1. Introduction
Organic Rankine cycles (ORC) require an organic medium to operate through thermodynamic states determined by the matching of temperature profiles to heat sources and sinks, often resulting in large expansion ratios. Additionally, the high molecular weight often exhibited by organic fluids leads to low values of the speed of sound [
1], resulting in turn in the onset of highly supersonic flows at stator discharge [
2]. The authors [
3] carried out an investigation of the radial-inflow turbine (RIT) design space using a mean-line model and parametric analyses, showing that, in order to achieve satisfactory efficiency with typical cycle configurations on the scale of tens of kilowatts, the stator discharge Mach numbers attain levels that commonly require convergent–divergent stators.
With respect to the design of convergent–divergent nozzles, the axial flow turbine configuration benefits from the broader pre-existing knowledge related to ideal gases, e.g., [
4,
5,
6], mainly derived from previous experience with highly loaded stages [
7] and auxiliary power turbines such as rocket turbo-pumps [
8]. On the other hand, the published literature concerning the use of RIT supersonic stators for the expansion air or other ideal gases is scarce. A noticeable exception is the work by Reichert and Simon [
9], who presented the design and analysis of convergent–divergent RIT nozzles for different discharge Mach numbers.
The established design practice for transonic stators, regardless of whether the turbine layout is in an axial or radial arrangement, makes use of the well-known method of characteristics [
10] for the design of the diverging section, which is then arranged into a row of nozzles. However, the conventional MoC, which assumes the fluid to be an ideal gas, cannot be used for an organic medium, and its first extension to dense gas vapours was reported by Aldo and Argrow [
11]. Since then, several authors have dealt with the design and the analysis of single test cases of ORC radial-inflow convergent–divergent stators, e.g., the adaptation of the existing RANS solver to real gas flows [
12], and subsequently the comparison of different flow solvers, turbulence models and fluid models [
13], as well as shape optimization studies, e.g., [
14,
15]. Furthermore, several design methods for the design of ORC radial-inflow supersonic vanes have been presented over the years, e.g., the one by Wheeler and Ong [
16] under the assumption of a polytropic relationship in fluid modelling, and the one by Anand et al. [
17]; furthermore, the replacement of the working fluid for radial-inflow supersonic stators was investigated by White et al. [
18]. However, comprehensive design guidelines are still unavailable with respect to several of the design variables.
From axial turbine cascades, it is known that under supersonic discharge conditions, the shape of the rear suction side plays a crucial role, as it reflects the expansion waves from the Prandtl–Meyer expansion around the trailing edge (TE), as well as the shock waves originating at the TE of the adjacent blade. Eventually, a curved uncovered suction side would also be responsible for the formation of additional waves. Therefore, the shape of the rear suction side can affect the uniformity of the downstream flow field.
With respect to convergent–divergent RIT nozzles, a straight uncovered suction side was found to increase downstream non-uniformity, affecting the Mach number and flow angle pitch-wise distributions [
17]. This might eventually result in an increase in loss due to the resulting mixing process, as well as enhanced unsteadiness, as observed in the subsequent blade row, which might also be of concern from a structural point of view. In this regard, Rinaldi et al. [
19] performed unsteady calculations using a highly supersonic ORC RIT, finding that torque fluctuated widely (even changing sign under certain operative conditions), as well as the presence of tangential and radial forces on the rotor blade resulting from the shock waves impinging on and detaching from the rotor blade; furthermore, one of the major contributors to loss was observed to be the boundary layer separation due to shock wave interaction in the rotor passages.
The stator design aims to meet some typical specifications, such as the outlet Mach number and the flow angle. The independent variables selected to achieve these goals include the vane count and the metal angle at the trailing edge. This choice allows the activation of a design procedure for the stator passage, whose effectiveness is then checked using a CFD base flow simulation. With respect to the first variable, conflicting trends can be envisaged: increasing the vane count increases the flow guidance, but on the other hand it also increases the wetted area and eventually the losses. Under supersonic discharge conditions, the picture is further complicated by the existence of waves reflecting on the uncovered suction side and playing a role in the uniformity of the downstream flow field. With respect to the outlet flow angle, from an efficiency point of view, it is desirable to increase its value (particularly at low specific speeds) [
20]. For axial turbine convergent–divergent stators, it has been demonstrated that increasing the outlet flow angle leads to higher downstream mixing losses and flow field non-uniformity, since the wake is closer to the suction side of the adjacent vane [
21]. On the other hand, related literature in this topic concerning RIT convergent–divergent nozzle is scarce. Finally, the discharge Mach number determines the level of compressibility and the magnitude of losses due to shock waves if supersonic discharge takes place.
This work aims at assessing the influence of combined effects of ORC convergent–divergent vane count and outlet metal angle on losses and downstream flow field uniformity and to investigate the existence of optimal combinations of these parameters. To do so, a series of RIT convergent–divergent nozzles with different values of vane count and outlet metal angle has been designed by means of an in-house code based on the method of characteristics (MoC) adapted to dense gases. The geometries have been then analysed and compared by means of CFD calculations.
2. Methodology
This section describes the methodology used to set up and analyse the test cases and it is organized as follows: the Method of Characteristics section describes the algorithm implementation to perform the sizing of the divergent side of the RIT nozzle; the Radial Vane Design section presents the methods used to fit the divergent part of the nozzle into a radial vane as well as the vane parametrization method and its input data; and CFD Setup describes the setting of numerical calculations for analysis and comparison of several geometries.
2.1. Method of Characteristics
As is well established, assuming a shape for the sonic line allows the supersonic region of a transonic nozzle to be designed independently of the subsonic one [
22]. The latter can then be designed to produce the desired sonic line shape [
23]. The design of the divergent portion is commonly made by means of the MoC [
10], although an adaptation is required for the application to dense gases.
In the present study, the design of the divergent part of supersonic nozzles is performed by means of an adapted Method of Characteristics for a two-dimensional sharp-edged Minimum Length Nozzle with a straight sonic line, under the assumption of steady, isentropic, inviscid flow. The code is implemented in MATLAB environment and fluid properties are computed via link to CoolProp thermodynamic library [
24].
The design of the divergent region implies the assignment of inlet total temperature and total pressure, which are equal to those at nozzle inlet, as well as the target Mach number at nozzle outlet together with the working fluid specification. Corresponding static pressure at the throat (M = 1) and at target Mach number (both reached through an isentropic expansion) are computed iteratively by means of bracketing method. Subsequently, the Prandtl–Meyer function ν corresponding to target Mach number is computed via numerical integration of the system of Equation (1)–(4), adapted from Cramer and Crickenberger [
25], with initial flow property values evaluated at the nozzle throat.
Once known the overall Prandtl–Meyer function required to bring the fluid to the desired outlet Mach number, the divergent nozzle shape and flow property calculation on the characteristics network is carried out based on the algorithm by Vanco and Goldman [
26].
The Prandtl–Meyer expansion originated at the throat corner is discretized into a user-specified number of right-running (RR) waves, blue lines in
Figure 1a, which are reflected as left-running (LR) waves, red lines in
Figure 1a, at the centreline. The latter family of waves meets the upper nozzle contour that is shaped to cancel them.
Flow angle
φ, Prandtl–Meyer function ν and Mach angle μ in each of the cells bounded by the characteristics net can be computed as in the ideal gas case; however, since the relationship between ν, local velocity-to-sonic speed in the throat and local Mach number used in [
26] is not applicable to dense gases, the algorithm is modified making use of the ν-Mach number relation from Ref. [
25]. The slopes of Mach lines for RR and LR waves are given by
and
, respectively. Like in Ref. [
26], average values of adjacent cells are used.
The knowledge of characteristic line slopes allows identification of the location (in terms of
and
coordinates) of each intersection between characteristic lines, so building the characteristic net (
Figure 1a), although different equations are required for interior points, nozzle centreline and nozzle contour points. Further details about the calculation procedure can be found in Ref. [
26].
The application of the method of characteristics adapted to dense gases leads to the calculation of the non-dimensional nozzle contour shape with respect to half throat width, together with flow properties distribution starting from M = 1 (straight sonic line at divergent duct inlet) up to a uniform target Mach number value at the nozzle outlet.
Figure 1 show the resulting characteristic net (with a reduced number of waves for legibility purpose) obtained by the MoC for a sample half-nozzle expanding R245fa to a target Mach number of 1.89; blue and red lines refers to RR and LR waves, respectively.
Figure 1b presents the related Mach number distribution computed by MoC for the same nozzle.
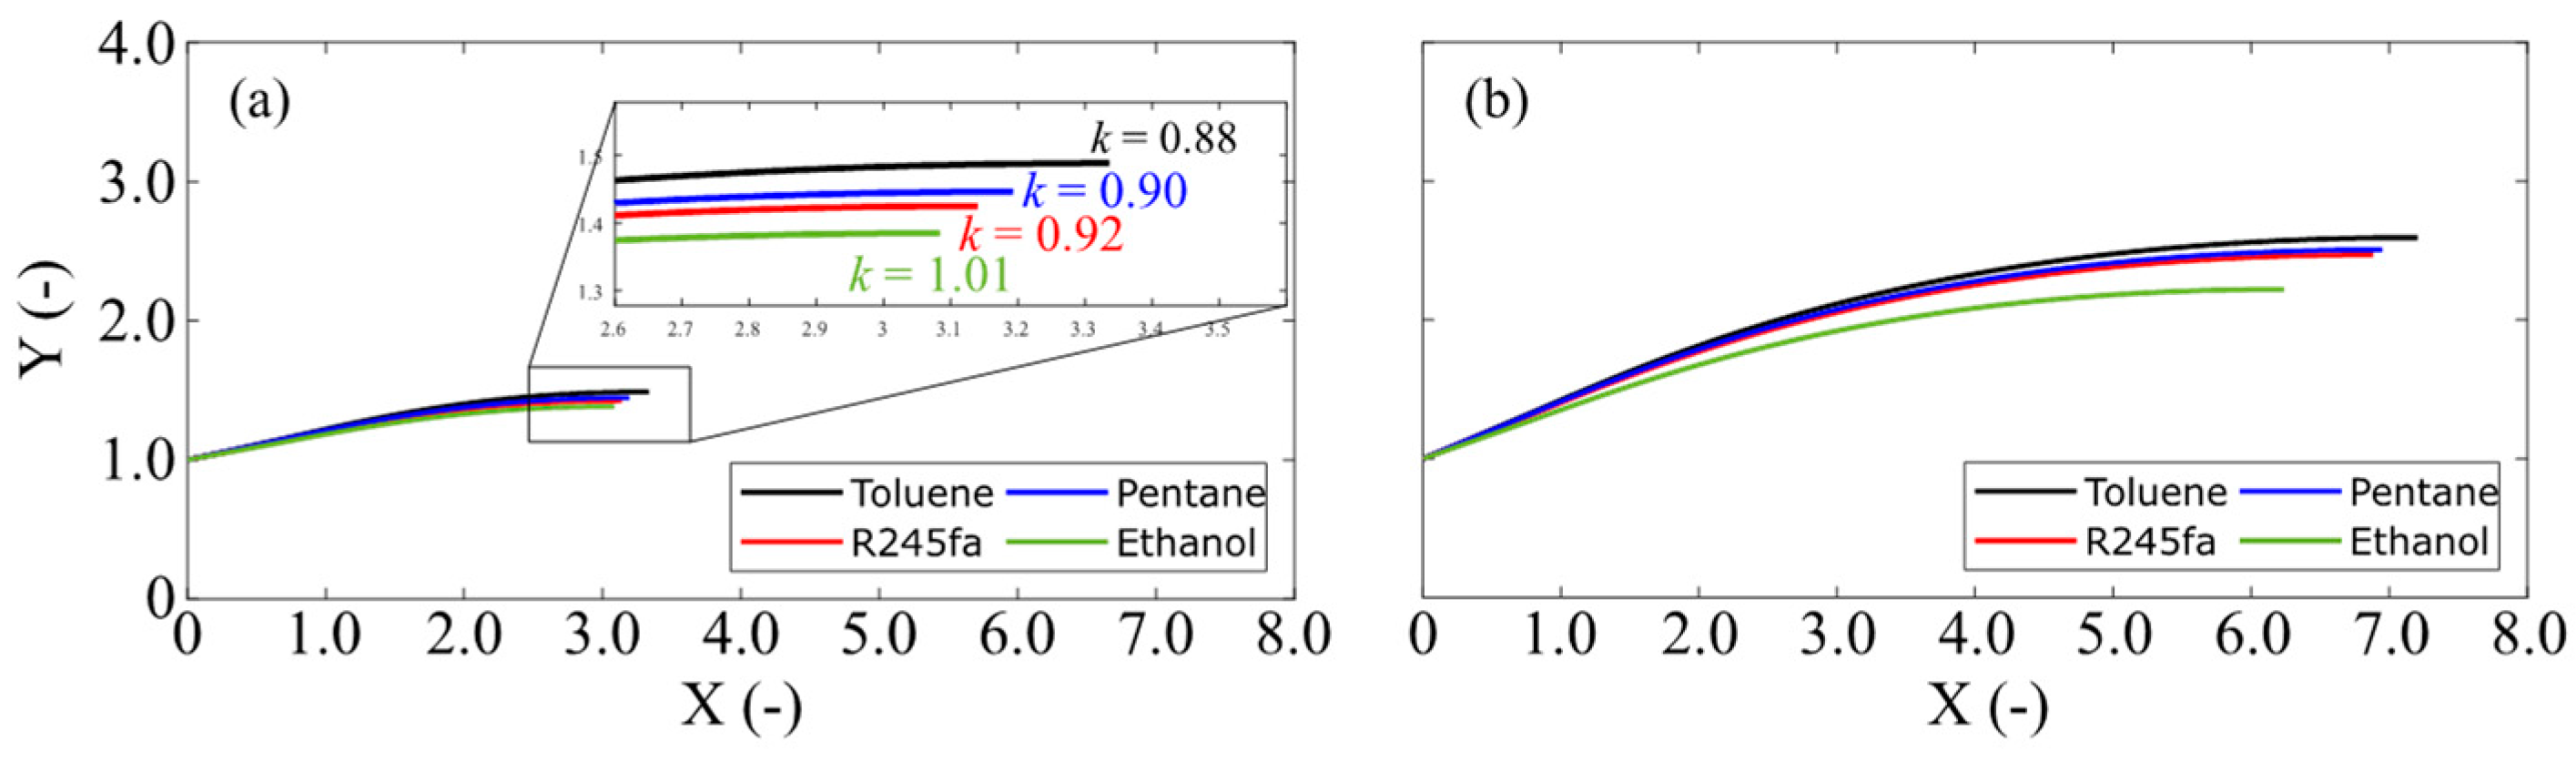
Figure 2 presents the resulting upper half shape (made non-dimensional by the inlet width) of nozzle divergent section obtained by means of the adapted MoC for several working fluids expanding from the same reduced total pressure (p
0/p
c) and total temperature (T
0/T
c) as those in
Figure 1, for two discharge Mach number values. This figure allows an impressive insight into the effect of both working fluid and target Mach number on nozzle dimensions. In this regard, it can be seen in
Figure 2 that, for a given target Mach number value, the working fluid affects both length and discharge area of the nozzle. The latter can be better visualized by means of the close-up view of the outlet region, provided in
Figure 2a, which also reports the average polytropic exponent k. This parameter is computed by a linear regression of log(𝜌/𝜌
0) and log(p/p
0) along 1000 points within the isentropic expansion from inlet to outlet pressure. This approach allows a qualitative understanding of the working fluid effects on nozzle shape, although larger discrepancies between the average value of k and the local slope of log(p/p
0) vs. log(𝜌/𝜌
0) arise as far as the critical point is approached. However, it is worth mentioning that in all cases presented in
Figure 2a, the R
2 of the linear regression was fairly higher than 0.998.
As one can notice from
Figure 2a, the lower the average polytropic exponent k the larger the nozzle length and outlet width. This occurrence is a consequence of the effect of k on the Prandtl-Meyer function value ν. In fact, it is known that for a target Mach number, decreasing the value of k leads to a higher required Prandtl–Meyer function value ν and, ultimately, to a larger nozzle size [
16]. As expected, an increase in the target Mach number increases nozzle length and outlet width,
Figure 2.
2.2. Radial Vane Design
Once the non-dimensional shape of the nozzle divergent part has been computed, it is possible to resize it and to arrange it into a RIT vane according to the following procedure.
First, the nozzle contour must be scaled to the right size in order to comply with the design mass flow rate. In this regard, it should be reminded that the vane height is generally not a free choice, because it usually results from the rotor preliminary design. Consequently, in the present design method, it is treated as a user-specified value and used to compute the actual throat width as follows:
Subsequently, the nozzle contour is scaled by and its specular half with respect to the horizontal axis is created. In this regard, it is worth mentioning that no boundary layer correction is applied to compute nozzle throat width (A*), which might lead to a slightly lower mass flow rate than the design one.
Furthermore, the suitability of the approximations has been checked against CFD results and it appeared to be satisfying, since the mass-average Mach number from CFD at A* is 1.04, and the difference between CFD mass-weighted average and target Mach number at AE is within 1% as well.
The first trailing edge (TE) is drawn by setting half circle of radius
at coordinates (0,
and aligning it to the design outlet metal angle,
Figure 3. Then, the right-scaled divergent region of the nozzle is shifted such that the last point of right-hand side contour lies at point f and it is rotated in order to be aligned with the outlet metal angle with respect to radial direction.
The TE and the right-hand side nozzle contour are rotated around an angular pitch ( building the supersonic part of the vane pressure side (a’–f’).
The uncovered suction side is built by means of a 2nd order Bezier polynomial whose two legs are tangent to the end of nozzle contour suction side and to the TE circle; control points , and are given by the first point of the rotated TE circle, last point of nozzle contour suction side and the intersection between the two tangent to and , respectively.
The subsonic part of the suction side, together with the leading edge (LE), is built according to the vane parametrization by Reichert and Simon [
9] by means of a series of circular arcs of decreasing radius from the inner throat (
in
Figure 3) to the leading edge, so that the radius of curvature is larger where gradients are higher.
The subsonic part of the pressure side consists of a circle (a’-CPPS,0) with the same radius and angular extension () as the first circle of the subsonic suction side construction (a–b), and a 2nd order Bezier polynomial defined as in the uncovered suction side case.
Finally, it should be highlighted that, while the vane count is an independent variable, the present design method does not allow the vane row solidity to be assigned, since the vane chord results from the design procedure.
2.3. CFD Setup
The stator design specifications, say inlet and outlet flow angles and vane height, are derived from one of the test cases investigated in the authors’ previous work [
3] that describes a RIT preliminary design performed by mean of an in-house mean-line code linked to CoolProp thermodynamic library [
24]. More specifically, the chosen test case assumes R245fa as working fluid, which is undergoing a volumetric expansion ratio of 14 with upstream total temperature and pressure of 439 K and 28 bar, respectively. The turbine candidate was selected among the converged cases of the parametric analysis discarding those with unfeasible geometries, excessive rotor flow turning and too short stator vane height (below 2 mm).
The RIT vanes built with the procedure outlined above have been later investigated by means of viscous, steady-state RANS 3D CFD calculations performed by ANSYS Fluent
® solver v 17.1. All calculations have been carried out by means of a density-based solver with implicit formulation, and Courant number = 5. Roe-FDS method for flux scheme was selected. Concerning the spatial discretization, a least square cell based scheme has been used for gradient reconstruction, whereas second order upwind discretization has been selected for flow and turbulence. Finally, the
model has been employed for the turbulent problem closure. Real gas thermodynamic properties have been evaluated by means of REFPROP [
27], via the built-in fluent routines. Regarding the convergence check, a first order solution was achieved before switching to second order spatial discretization.
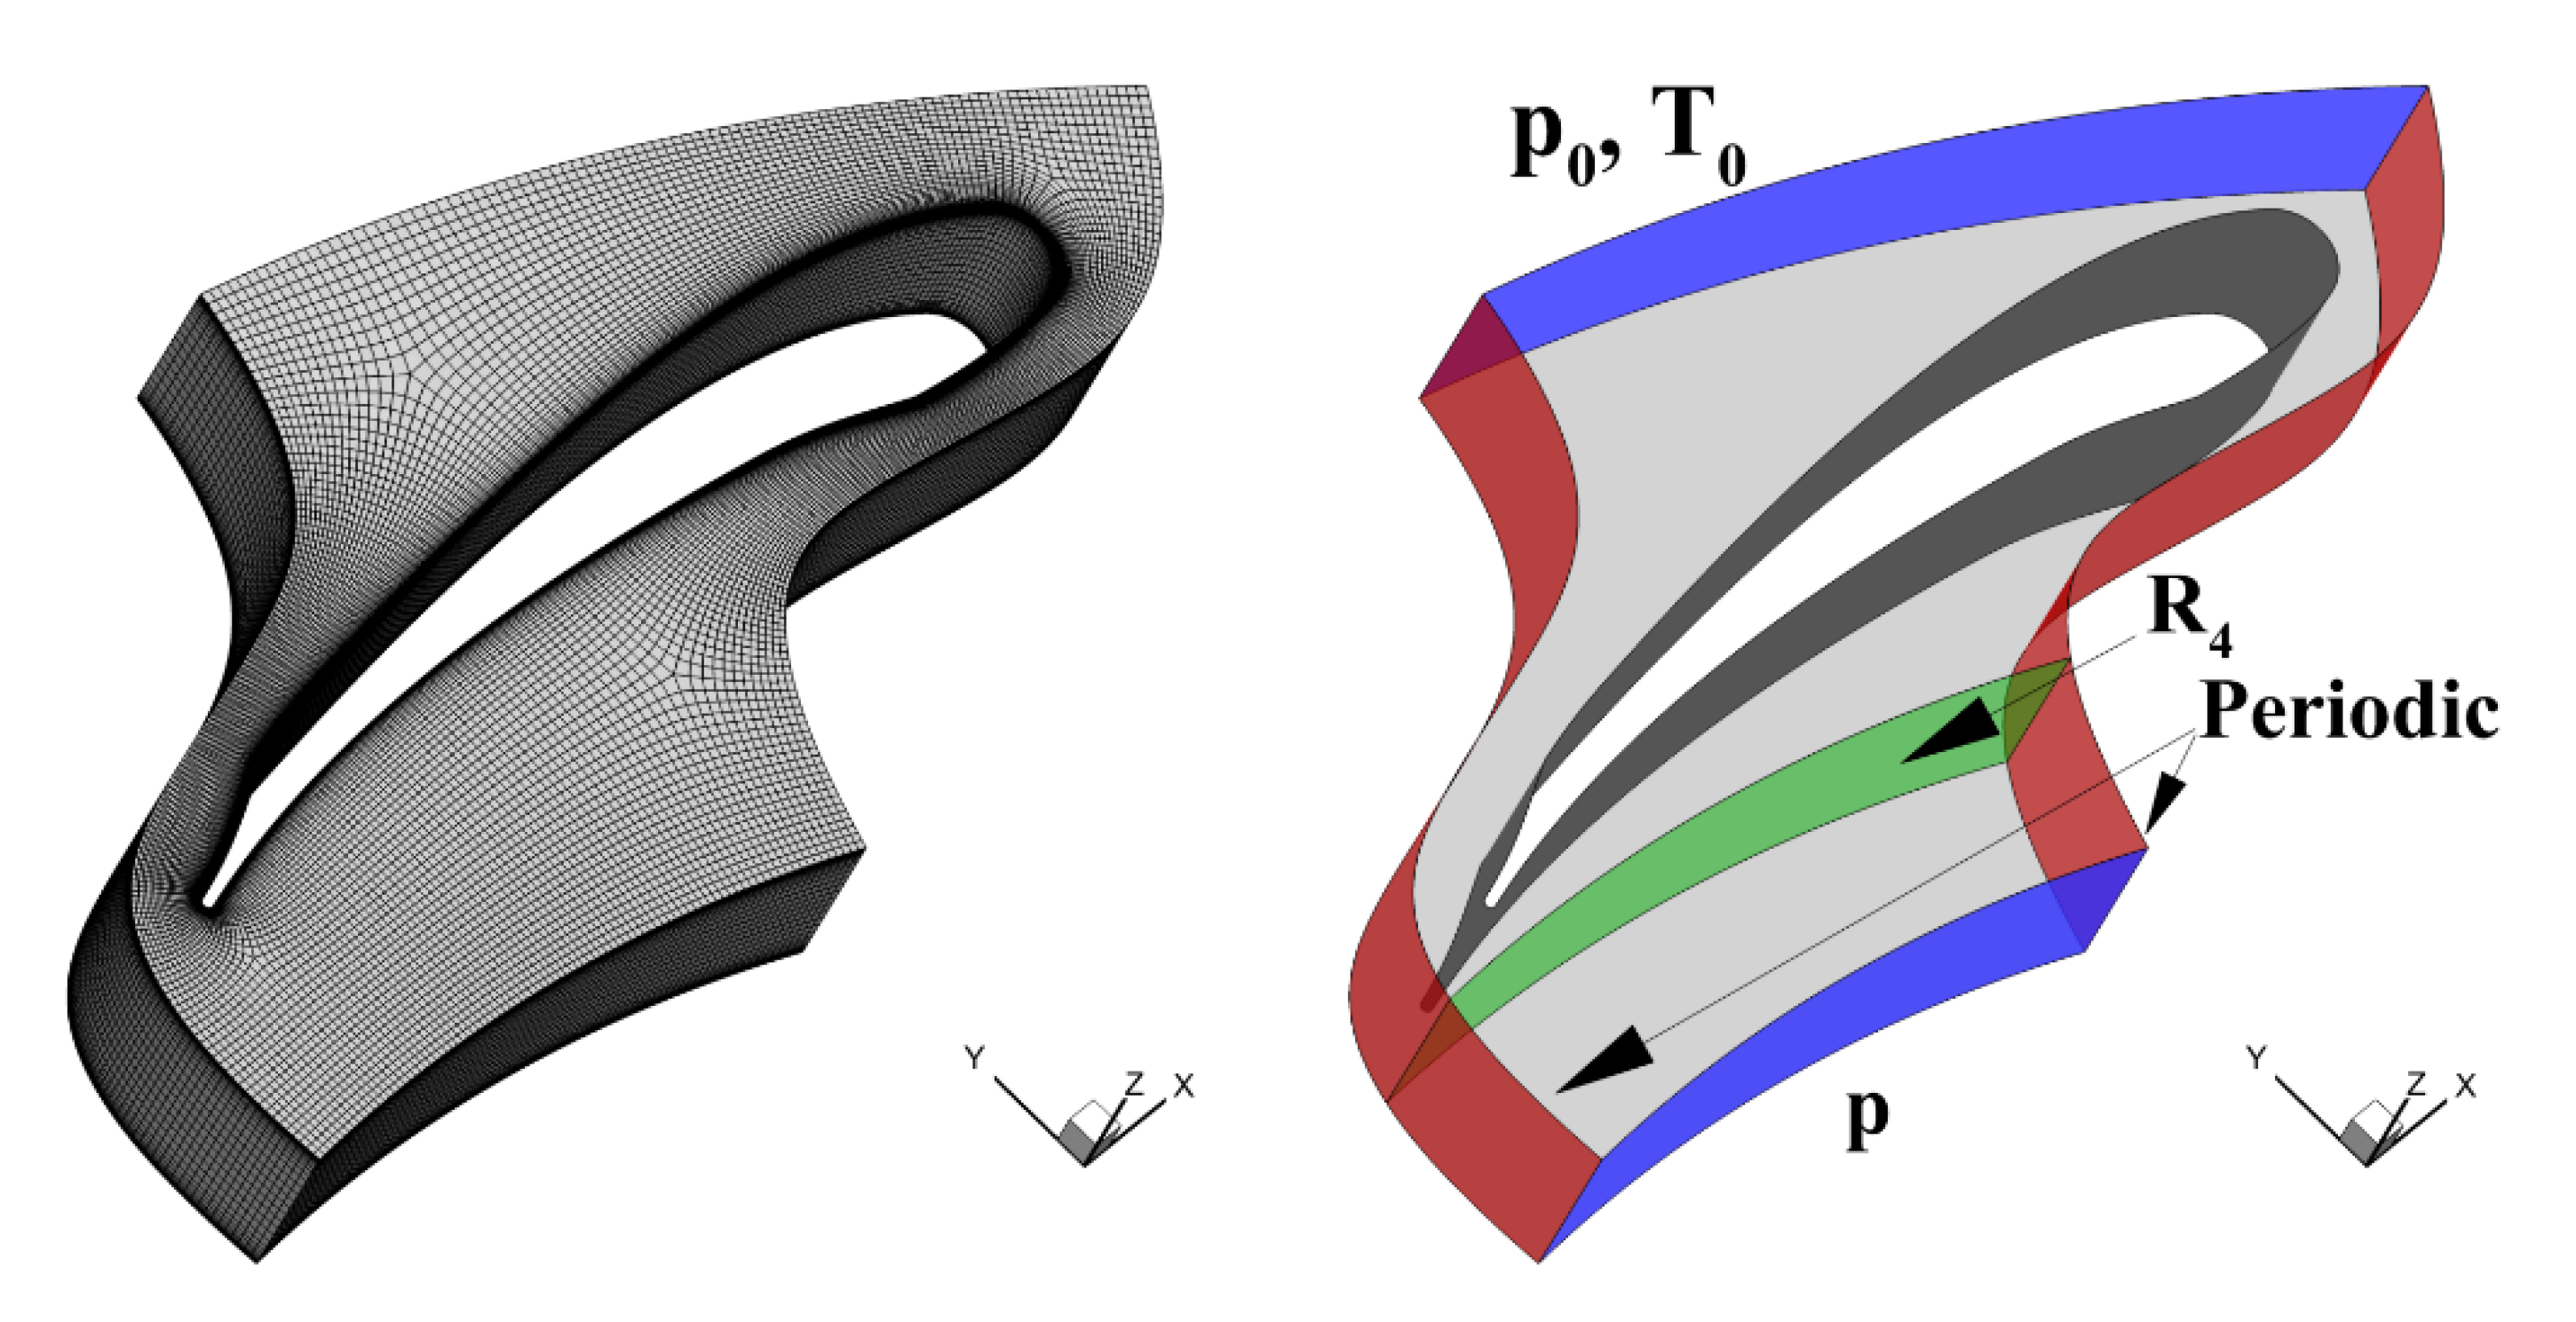
The fluid domain, shown in
Figure 4 together with the mesh for the 15 vanes–75° outlet metal angle case, was extended upstream and downstream with respect to the vane in order to avoid non-physical solutions, with rotationally periodic boundary condition on the sides of the domain. Hub, shroud, and blade walls were considered to be adiabatic with no-slip conditions. Flow boundary conditions were set in terms of total pressure and temperature and flow direction angles at the inlet and static pressure at the outlet. An outlet static pressure of 3.25 bar was assigned to reach a static pressure at rotor inlet plane (R
4 in
Figure 4) close to the one computed by the turbine preliminary design mentioned above. Finally, a strong-averaging option was activated to avoid wave reflection on the outlet boundary.
All meshes have been set-up in ANSYS TurboGrid; to reduce the computational effort, was set to 25 on the walls, making use of wall functions.
2.4. Mesh Sensitivity
A mesh sensitivity analysis was carried out on a single geometry with intermediate characteristics with respect to the investigated set of profiles, as reported in
Table 1. Four grid sizes have been used for the grid convergence study, established by refining the average spacing
, and by keeping the refinement factor r = h
coarser/h
finer always above 1.3 from each mesh to the finer one,
Table 2.
Table 3 reports the variation with mesh size of the mass-averaged results of performance coefficients and of several quantities of interest, expressed as percentage difference with respect to the finest mesh. As one can notice, such differences are already very low starting from the second mesh. However, despite such very small variations of the mass-averaged quantities with mesh size, the analysis of mid-span pitch-wise distributions (at rotor inlet radius R
4) displayed in
Figure 5 highlights very sharp variations. The latter may be explained by both expansion fans and shock waves originating from vane trailing edge, which appears dramatically smoothed out by the coarser grids.
In particular, pitch-wise pressure and flow angle distributions at mid-span computed in the coarsest mesh case,
Figure 5, present differences with peaks of about 20% with respect to the finest mesh. Based on these considerations, since the focus of the work is mainly on the downstream flow field uniformity, it was decided to proceed with an average mesh spacing
h corresponding to the one of the third mesh. This choice allowed a resolution enhancement of the expansion fans and shock waves, which appear to give the largest contributors to the pitch-wise non-uniformities.
3. Results
Different RIT vanes have been designed by means of the method presented in the methodology section. The nine geometries for the parametric analysis differ by vane count Z (10, 15 and 20) and outlet metal angle (70°, 75° and 80°). The distance between stator trailing edge and rotor inlet has been kept constant for all the cases and equal to the value found in the mean-line design. TE thickness was set as a percentage of the inner throat area (A*), so to induce the same blockage effect in each case. In this way, the actual blockage is only dependent on the of the boundary layer growth. The resulting TE thickness-to-pitch ratio is of nearly 1.49 × 10⁻².
Regarding the target Mach number (M
E) input for the method of characteristics, it was decided to keep it at a fixed value of 1.55. The latter is lower than the design Mach number at the stator outlet plane from mean-line design (1.66), thus ensuring that the flow undergoes a further expansion up to the stator exit pale. This expansion from nozzle core outlet (plane E in
Figure 3) to the TE plane might have a stabilizing effect on the boundary layer and might hence be beneficial. The resulting design expansion ratios in the nozzle core (throat-plane E) and semi-bladed region are 2.14 and 1.27, respectively.
In the following, the results of the numerical calculations on the geometries are presented. First, static pressure, Mach number and total pressure distributions at mid-span are shown for the 15 vane–75° outlet metal angle case in
Figure 6, with the superposition of streamlines. This allows visualization of expansion fans and compression waves, which can be clearly distinguished by means of the streamline deflection,
Figure 6a,b; and by the total pressure defect in the wake behind the trailing edge,
Figure 6c.
A more accurate insight into both flow field features and downstream non-uniformities is provided in next section by mid-span blade-to-blade contours together with mid-span pitch-wise distributions, so allowing assessment of metal angle and vane number influence.
3.1. Flow Structures
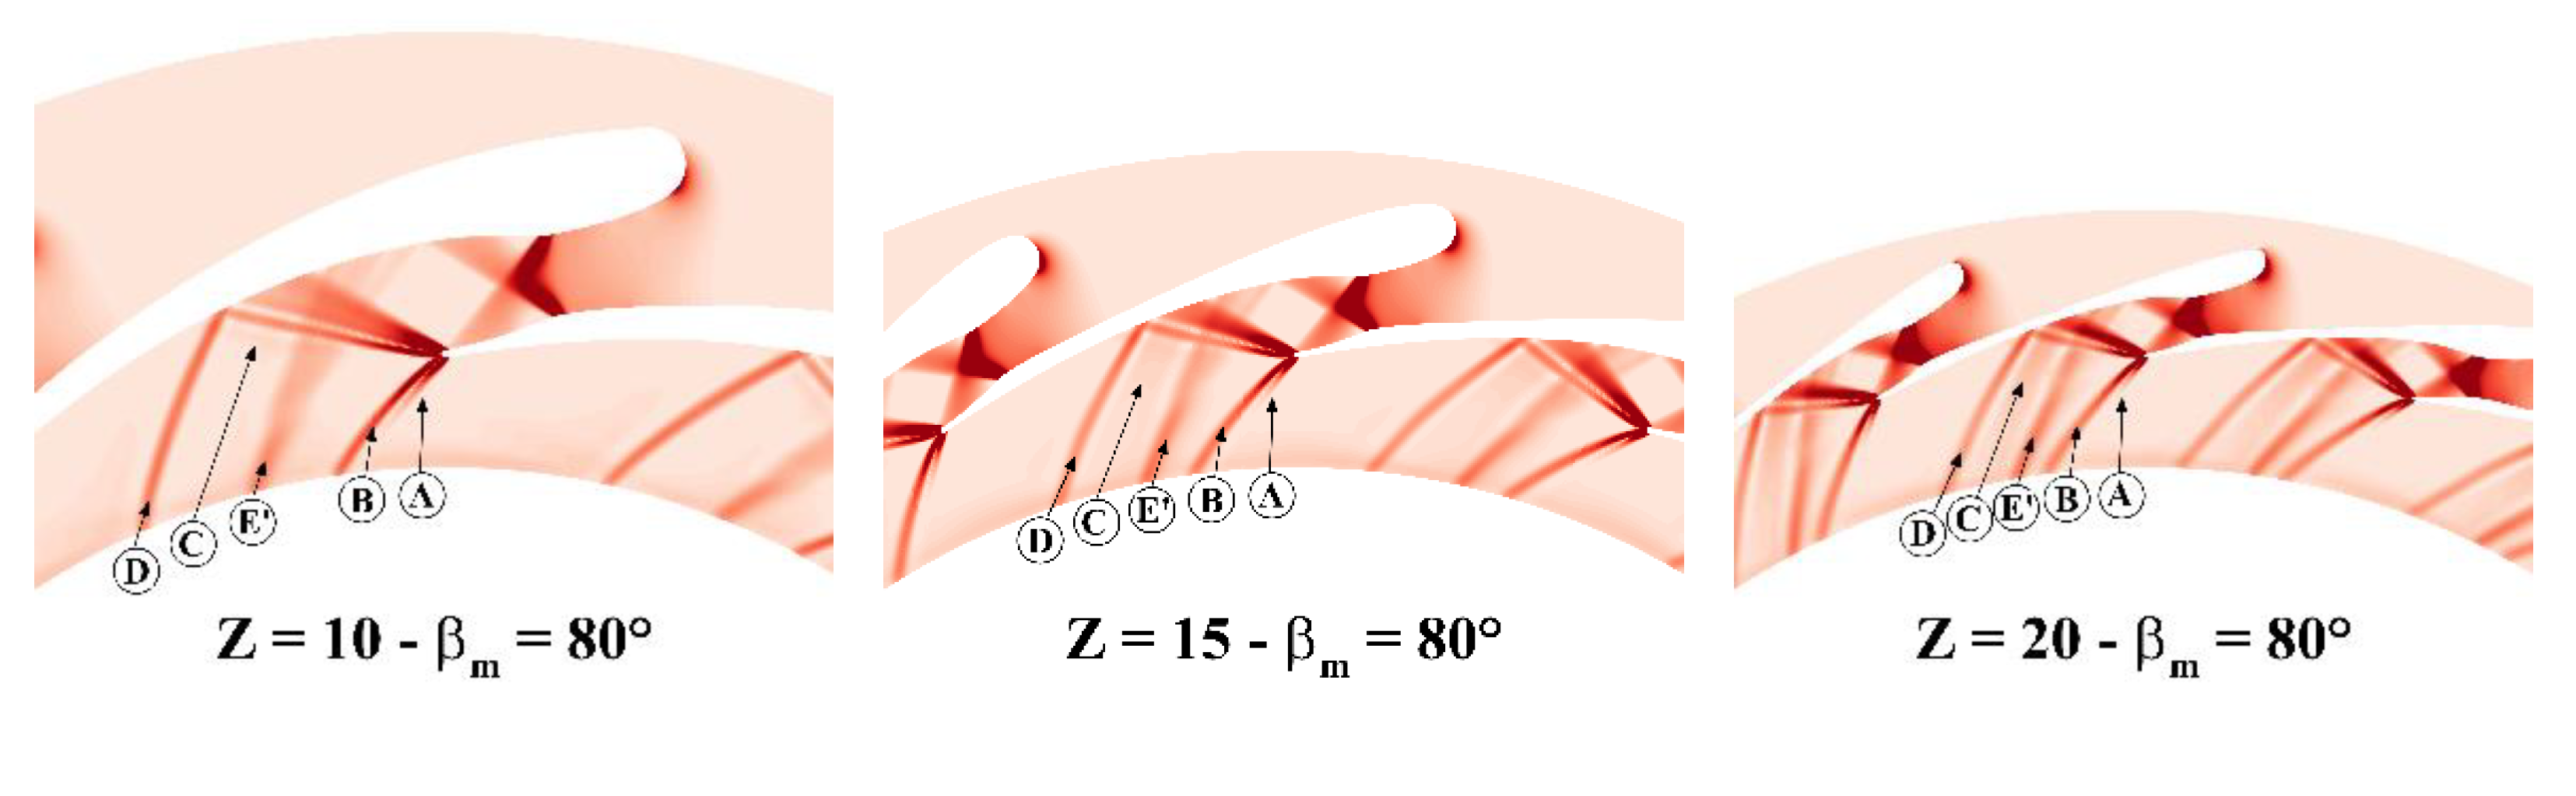
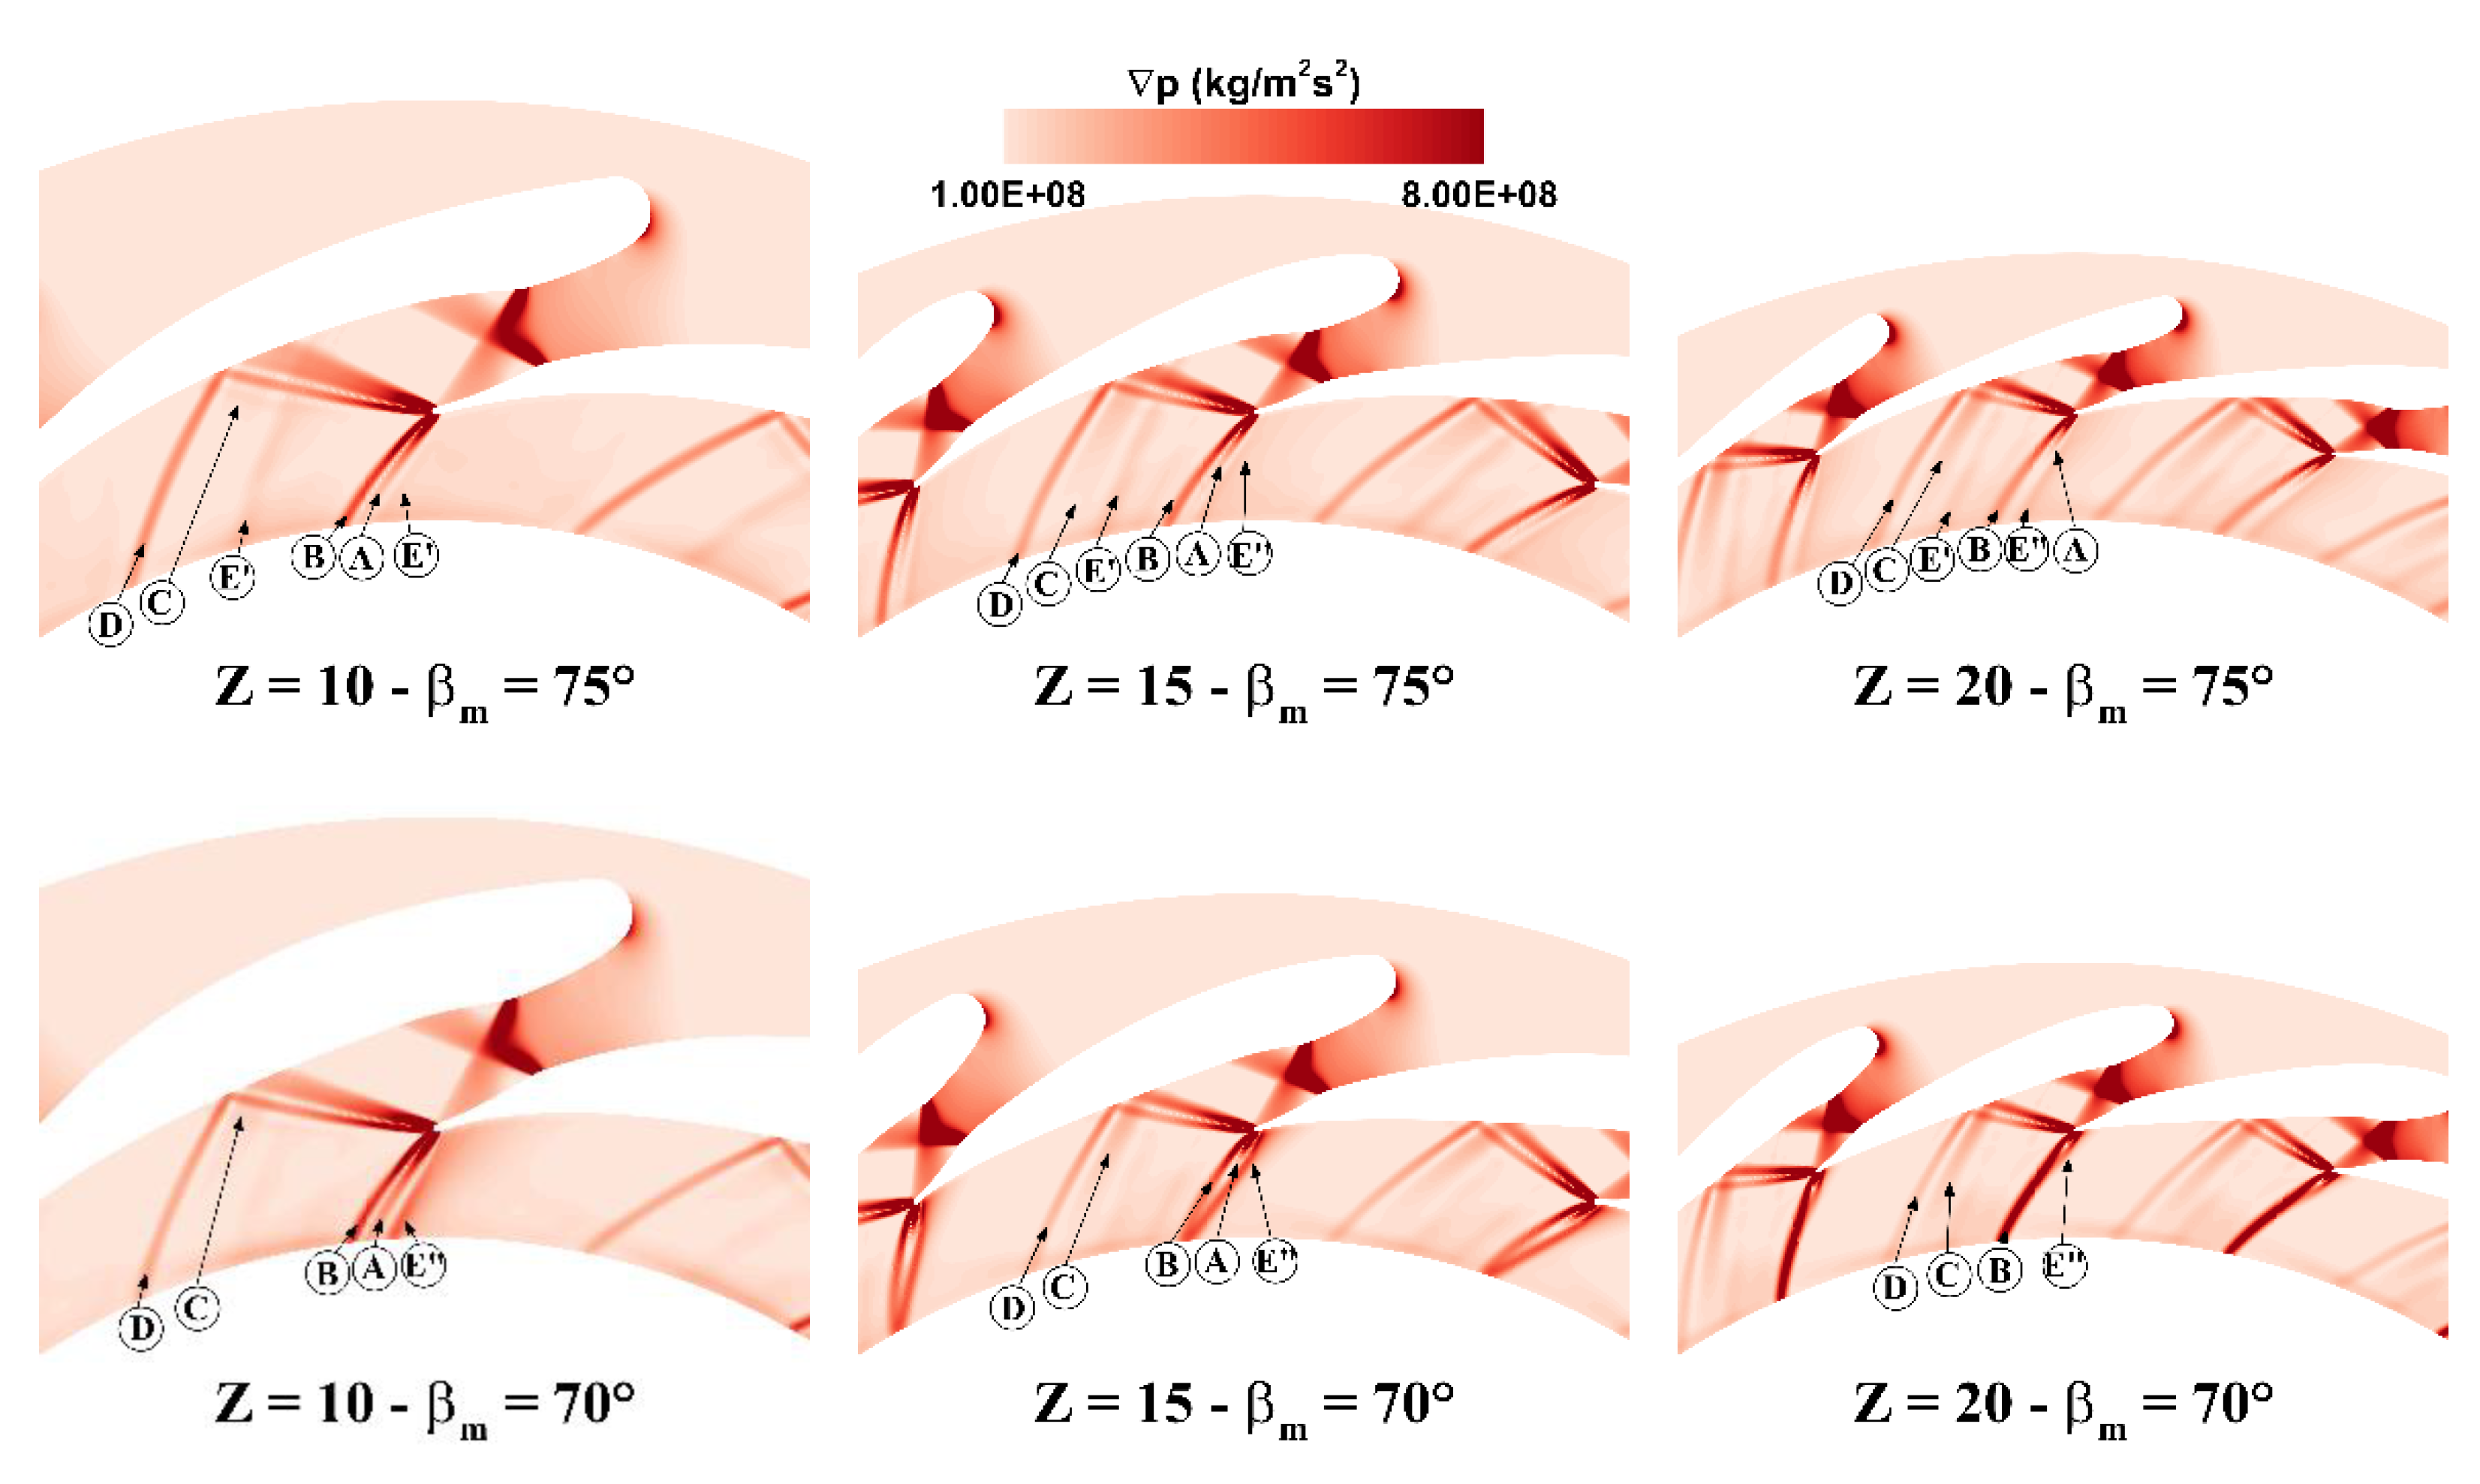
With the aim of investigating the characteristic features of the flow structures along with the influence of the design parameters, mid-span blade-to-blade pressure gradient distributions are presented for the 9 geometries in
Figure 7. Some common features can be identified in terms of right-running (RR) and left-running (LR) expansion fans, at the inner throat A* in
Figure 3, together with the well-known trailing edge supersonic flow pattern, which is also typical of axial turbine stators. In particular, the latter consists of:
LR shock (tag B), located after the expansion fan A;
RR expansion fan, which is then reflected on the suction side of the adjacent vane as LR expansion wave (tag C);
RR shock reflected as a LR shock (tag D) on the suction side of the adjacent vane.
Besides the above-mentioned sets of waves, another peculiar structure (tags E’ and E’’,
Figure 7) can be observed, i.e., two sets of
in-passage LR compression waves, originated by the non-straight rear suction side shape. The first one is located approximately at the beginning of the uncovered suction side (tag E’,
Figure 7), and the second one can be detected towards the trailing edge (tag. E’’,
Figure 7). It is worth-noting that the locations of
in-passage LR compression waves appear to be strongly affected by vane count and outlet metal angle combination, as a result of the vane parametrization method.
In fact, in the highest metal angle cases only the in-passage LR compression waves located right after the nozzle core exit plane can be found (tag E’). Conversely, in the intermediate metal angle cases, the first set (tag E’) is shifted downstream and the second set of compression waves (although of very weak intensity) can be seen toward the trailing edge (tag E’’).
Eventually, in the low metal angle cases, only the second set (tag E’’) is present, because of the different curvature distribution of the rear suction side. Finally, it is worth- noting that in the 20 vane count–70° outlet metal angle case,
Figure 7, the placement of
in-passage LR compression waves is so close to the trailing edge that it is rather difficult to distinguish it from the trailing edge LR shock (tag B). Actually, such waves almost merge while travelling downstream, making the expansion fan (tag A) difficult to identify.
3.2. Pitch-Wise Distributions
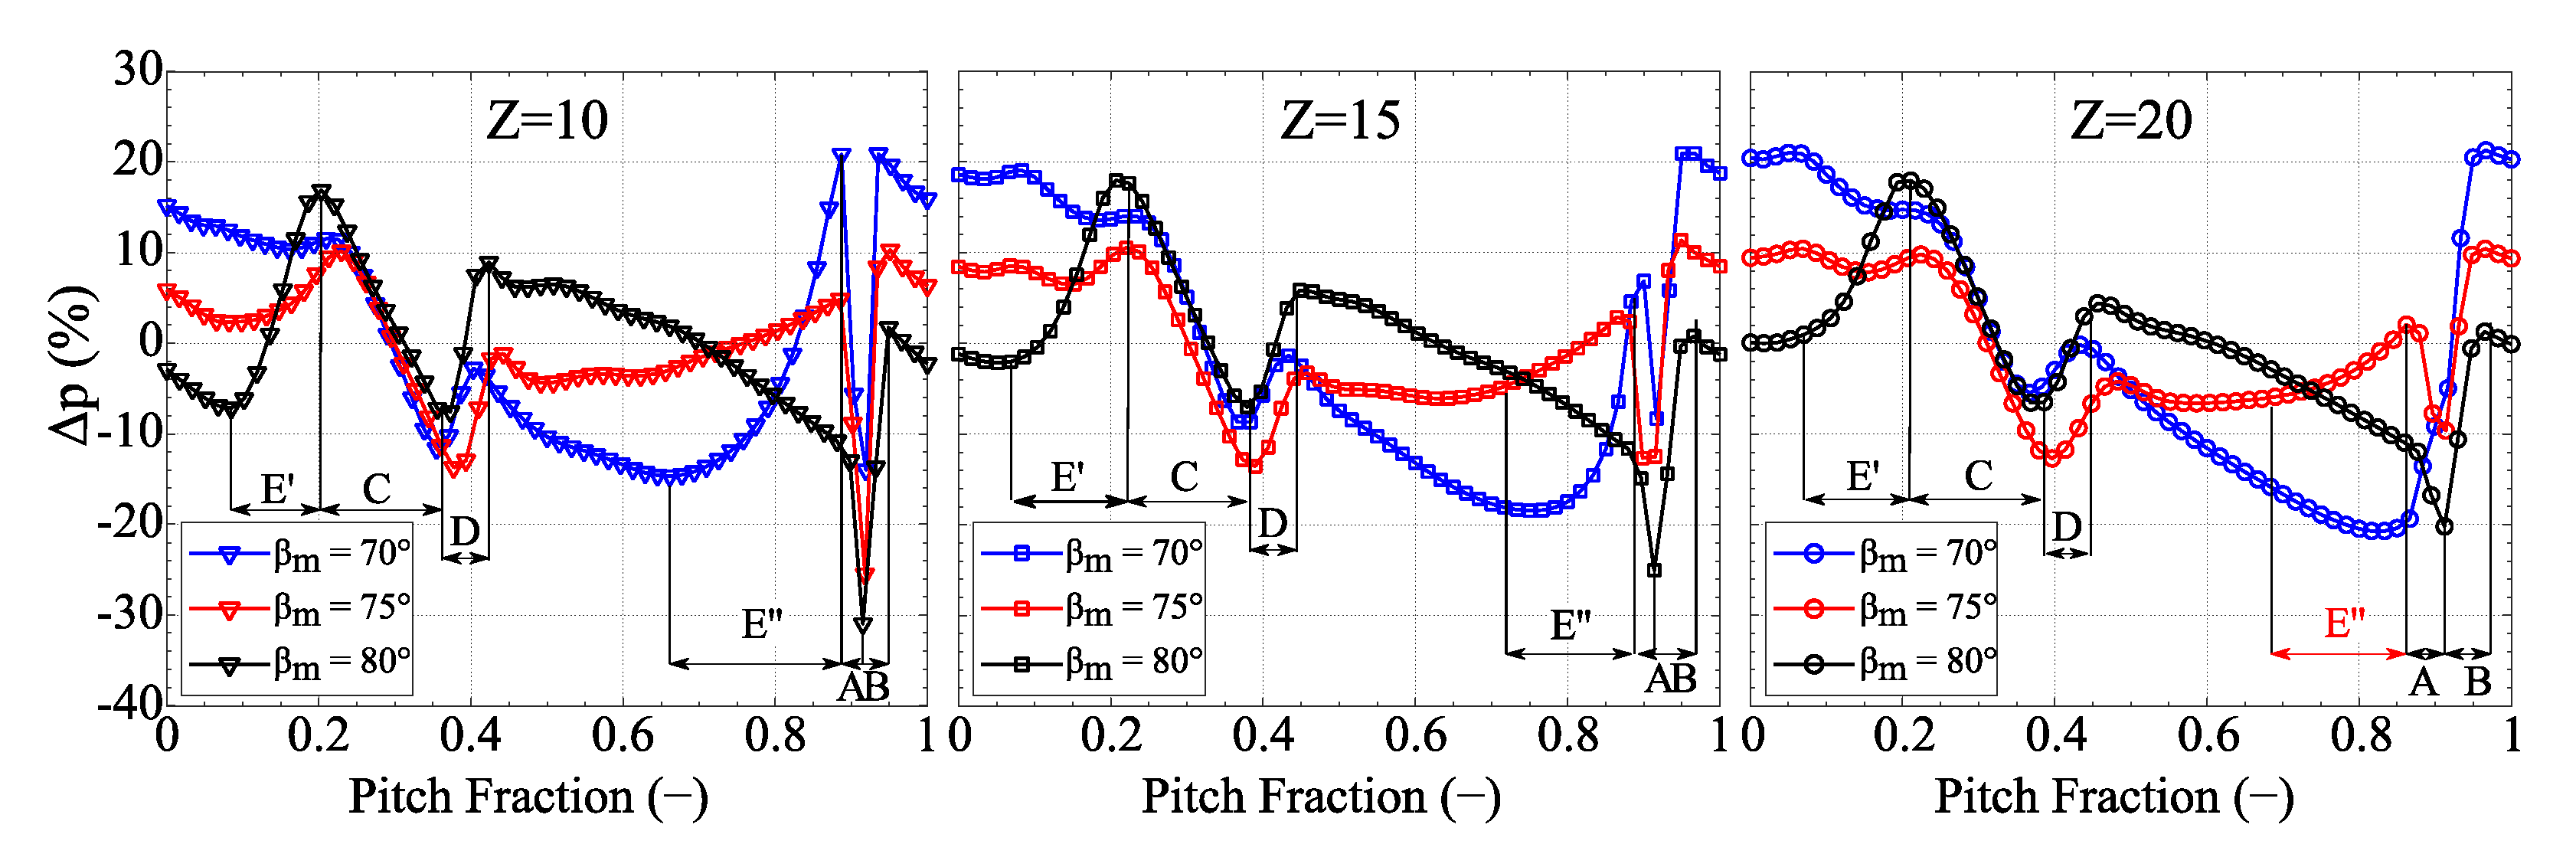
Figure 8 and
Figure 9 display the pitch-wise pressure distribution at mid-span (expressed as percent deviation from the average value) at rotor inlet radius (R
4) as a function of the relative angular coordinate with respect to the angular pitch. It is worth mentioning that a pitch fraction of zero corresponds to the RHS corner of the computational domain (
Figure 4), whereas the unity corresponds to the LHS one.
Referring to the 10 vane configurations (
Figure 8, Z = 10), a slightly decreasing trend can be observed in the distribution behind the trailing edge location (lowest fractions of the pitch), which can be ascribed to the wake effect.
Then, cases with outlet metal angles of 75° and 80° show a sudden pressure rise (due to
in-passage compression waves E’), which is instead not detected for 70° case. This occurrence can be explained by the pressure gradients in
Figure 7, if observing that in 70° cases only the second set of
in-passage LR compression waves E’’ is present and located near the trailing edge. Moreover, for the 80° case, the pressure rise due to the
in-passage LR compression waves (E’) is much larger than the one in the 75° case, consistently with the higher curvature induced by the 80° case right after the nozzle core outlet section.
Moving towards higher pitch fraction values, all three distributions undergo rapid expansion of comparable intensity because of the presence of the reflected
left-running expansion fan, tag C in
Figure 7. After the valley, pressure rises again because of the fluid passing through the
reflected left-running shock wave, tag D in
Figure 7.
If moving further towards the unit pitch fraction, different trends can be identified, depending on metal angle:
In the 70° case, the pressure distribution, after an initial decrease, starts rising very sharply due to the in-passage compression waves, tag E’’ (which in this case are located almost at the vane trailing edge, as a consequence of the uncovered suction side curvature distribution).
Conversely, the 80° case shows a decreasing trend, thanks to a lower curvature of the terminal part of vane suction side.
An intermediate trend takes place in the 75° arrangement (which is also characterized by a weak second set of in-passage compression waves, tag E’’). In this case, an initially decreasing trend is followed by an increasing one due to the compression waves.
Subsequently, a sudden expansion can be noticed in all three cases (although much larger in the 70° case) due to the
left-running expansion fan, tag A in
Figure 7. The pressure rises again in all three cases due to the
left-running shock wave tag B,
Figure 7. Finally, a slight expansion behind the trailing edge occurs in all these cases.
The same pressure pattern can be found in
Figure 8 (Z = 15 and 20), although with different values. The only relevant exception occurs in the 20 vane–70°,
Figure 8, for which the second set of
in-passage compression waves, tag E’’, is practically merged with the trailing edge shock wave.
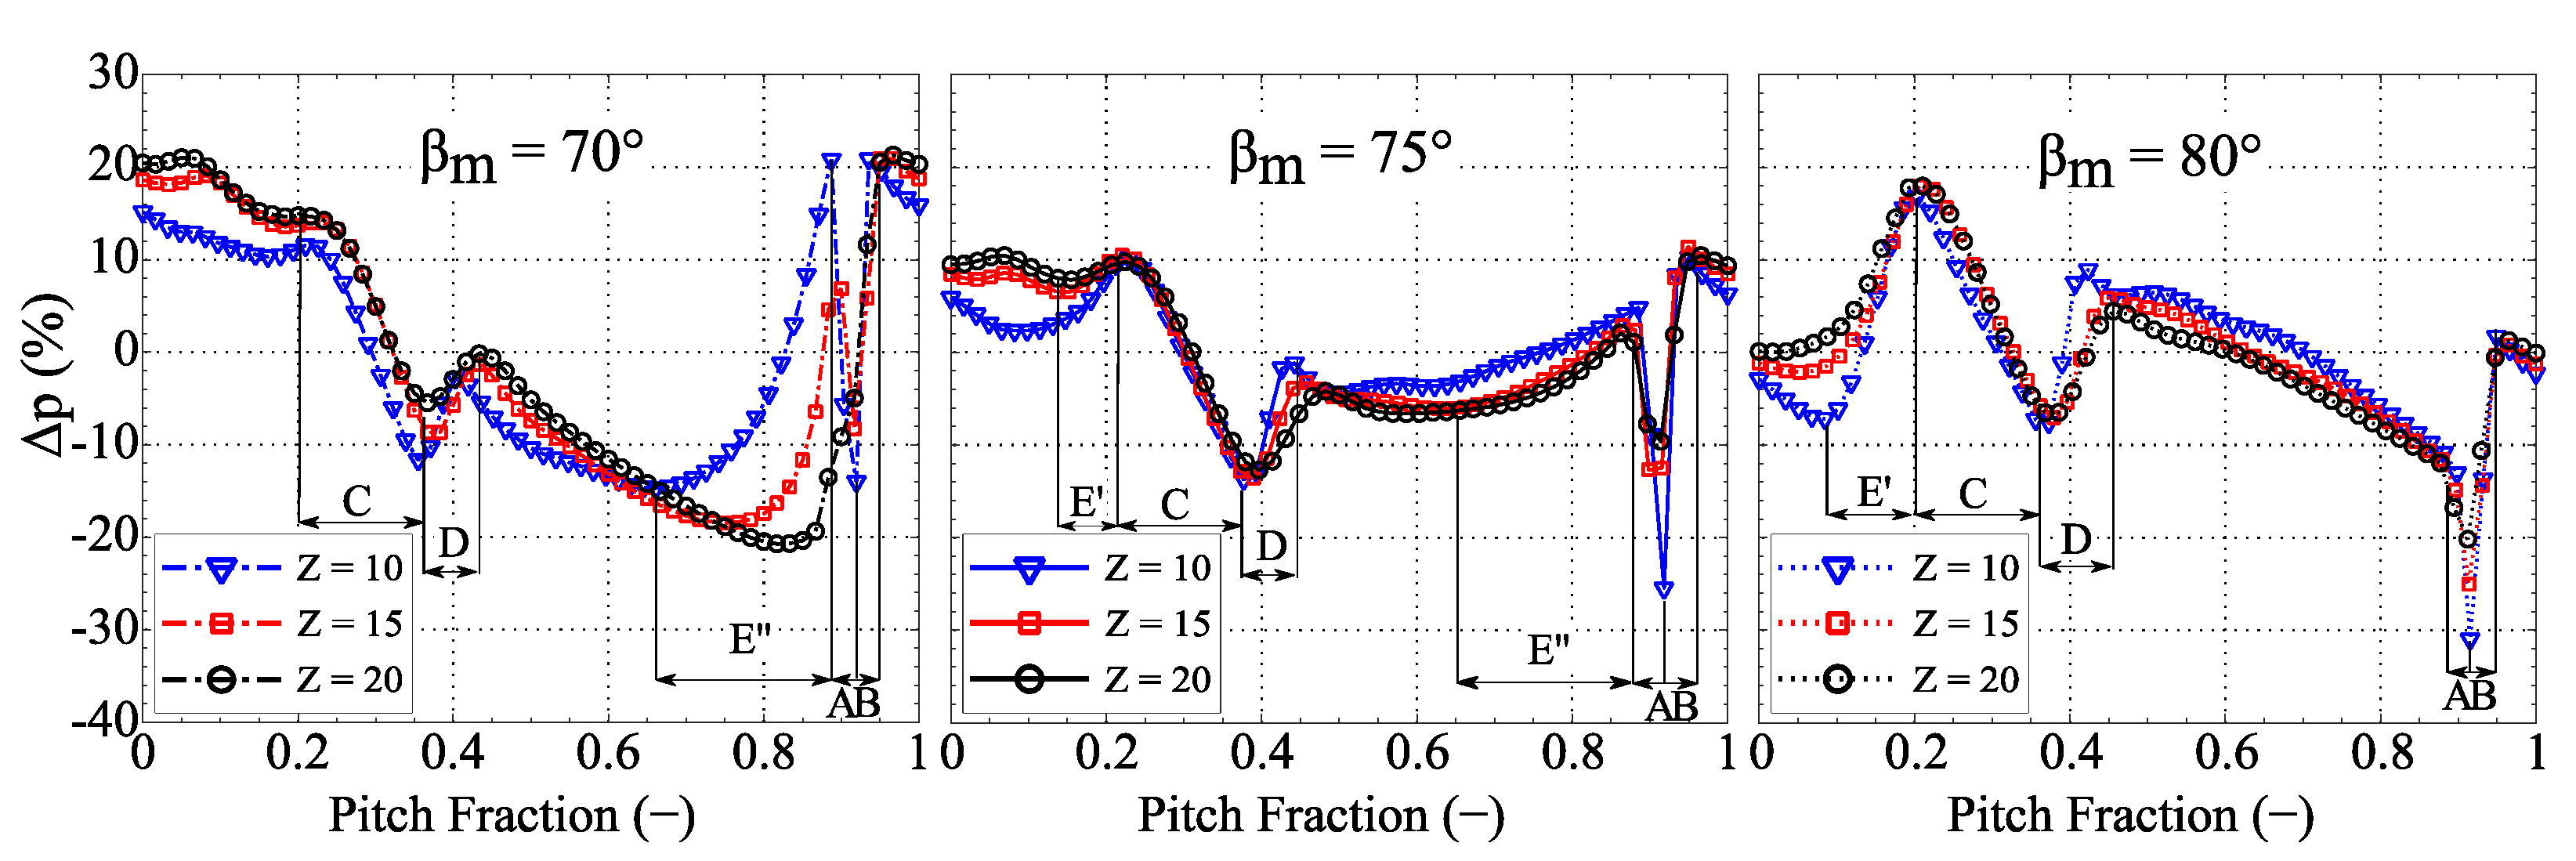
3.2.1. Vane Number Effect
As one can notice from
Figure 9, the overall effect of the vane count is modest particularly in the 75° and 80° outlet metal angle cases, with the major differences segregated firstly in the LR expansion fan (tag A,
Figure 7) and LR shock wave (tag B,
Figure 7), with sharper trends pertaining to the lowest vane count case, and secondly to pressure rise magnitude due to the
in-passage compressions waves (tag E’).
Differences induced by the vane count are more evident only in the 70° outlet metal cases, in the region between the reflected LR shock wave (tag D) and LR expansion fan (tag A),
Figure 9. Actually, in this region such cases are affected by the presence of the
in-passage compressions waves (tag E’’,
Figure 7), which occur much earlier as the vane count is decreased.
3.2.2. Discharge Metal Angle Effect
Substantially different trends can be detected in the 80° and 75° metal angle cases,
Figure 9, inside the region between reflected LR shock wave (tag D,
Figure 7) and LR expansion fan (tag A,
Figure 7). In particular, in the former case a monotonically decreasing trend is noticed, whereas in the latter case an increasing pattern is present after a certain pitch fraction, as a result of a weaker
in-passage compression wave (tag E’’). Concerning the 70° case, a monotonically decreasing trend can be observed up to the pressure rise induced by
in-passage compression waves (tag E’’).
Furthermore, 80° metal angle cases always show the deeper valley associated to the LR expansion fan (tag A).
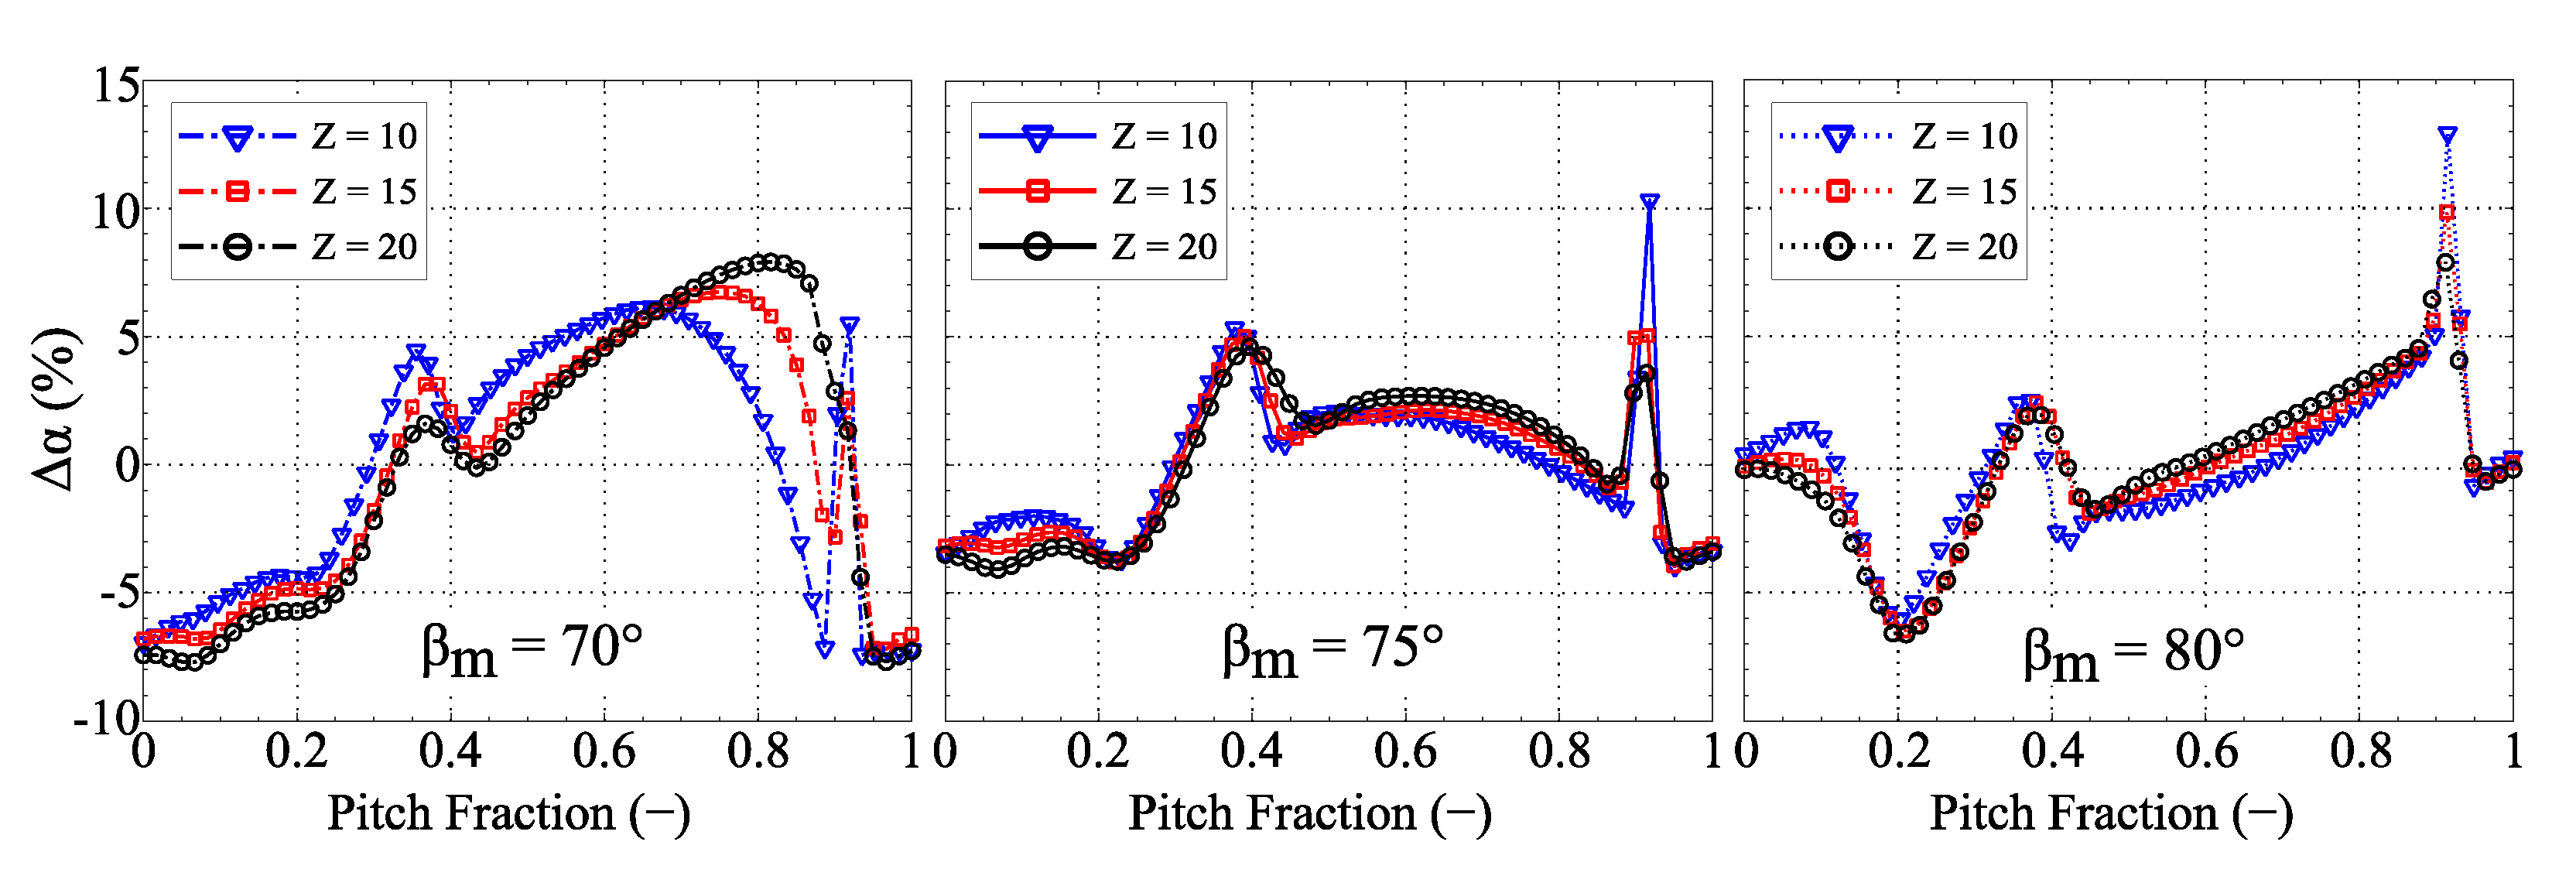
Finally, since most of the above-mentioned features of pitch-wise pressure distributions are induced by streamlines crossing Mach waves, similar trends can be detected for flow angle pitch-wise distributions in
Figure 10. In this case, however, maximum deviations from mean value do not exceed 15%, with unaltered vane count and outlet metal angle effects.
3.3. Global Trends
Several figures of merit have been considered to provide a global sketch of each stator performance in terms of losses and downstream flow field uniformity. For what concerns the former, total pressure loss
Y, kinetic loss coefficient ζ, and stator efficiency 𝜂 have been considered. In Equation (6), outlet properties are evaluated at rotor inlet radius surface.
The pitch-wise non-uniformity level of each geometry has been evaluated for several quantities with reference to the mid-span pitch-wise distribution at the rotor inlet radius, by means of the figure of merit defined by Equation (7),
being a general quantity of interest. This figure quantifies the average deviation of each distribution from its average value (designated by the overbar) normalized by the angular pitch.
Figure 11 presents the contour plots for total pressure loss, kinetic loss coefficient and stator efficiency as a function of vane count Z and outlet metal angle β
m. A clear and consistent trend can be identified for all three parameters. As a matter of fact, higher losses occur at both low vane count Z and high outlet metal angle β
m, and a progressive decrease occurs as the vane count is increased and the outlet metal angle is lowered. A minimum level is reached at the opposite corner of the map, with the lowest outlet metal angle and the highest vane count.
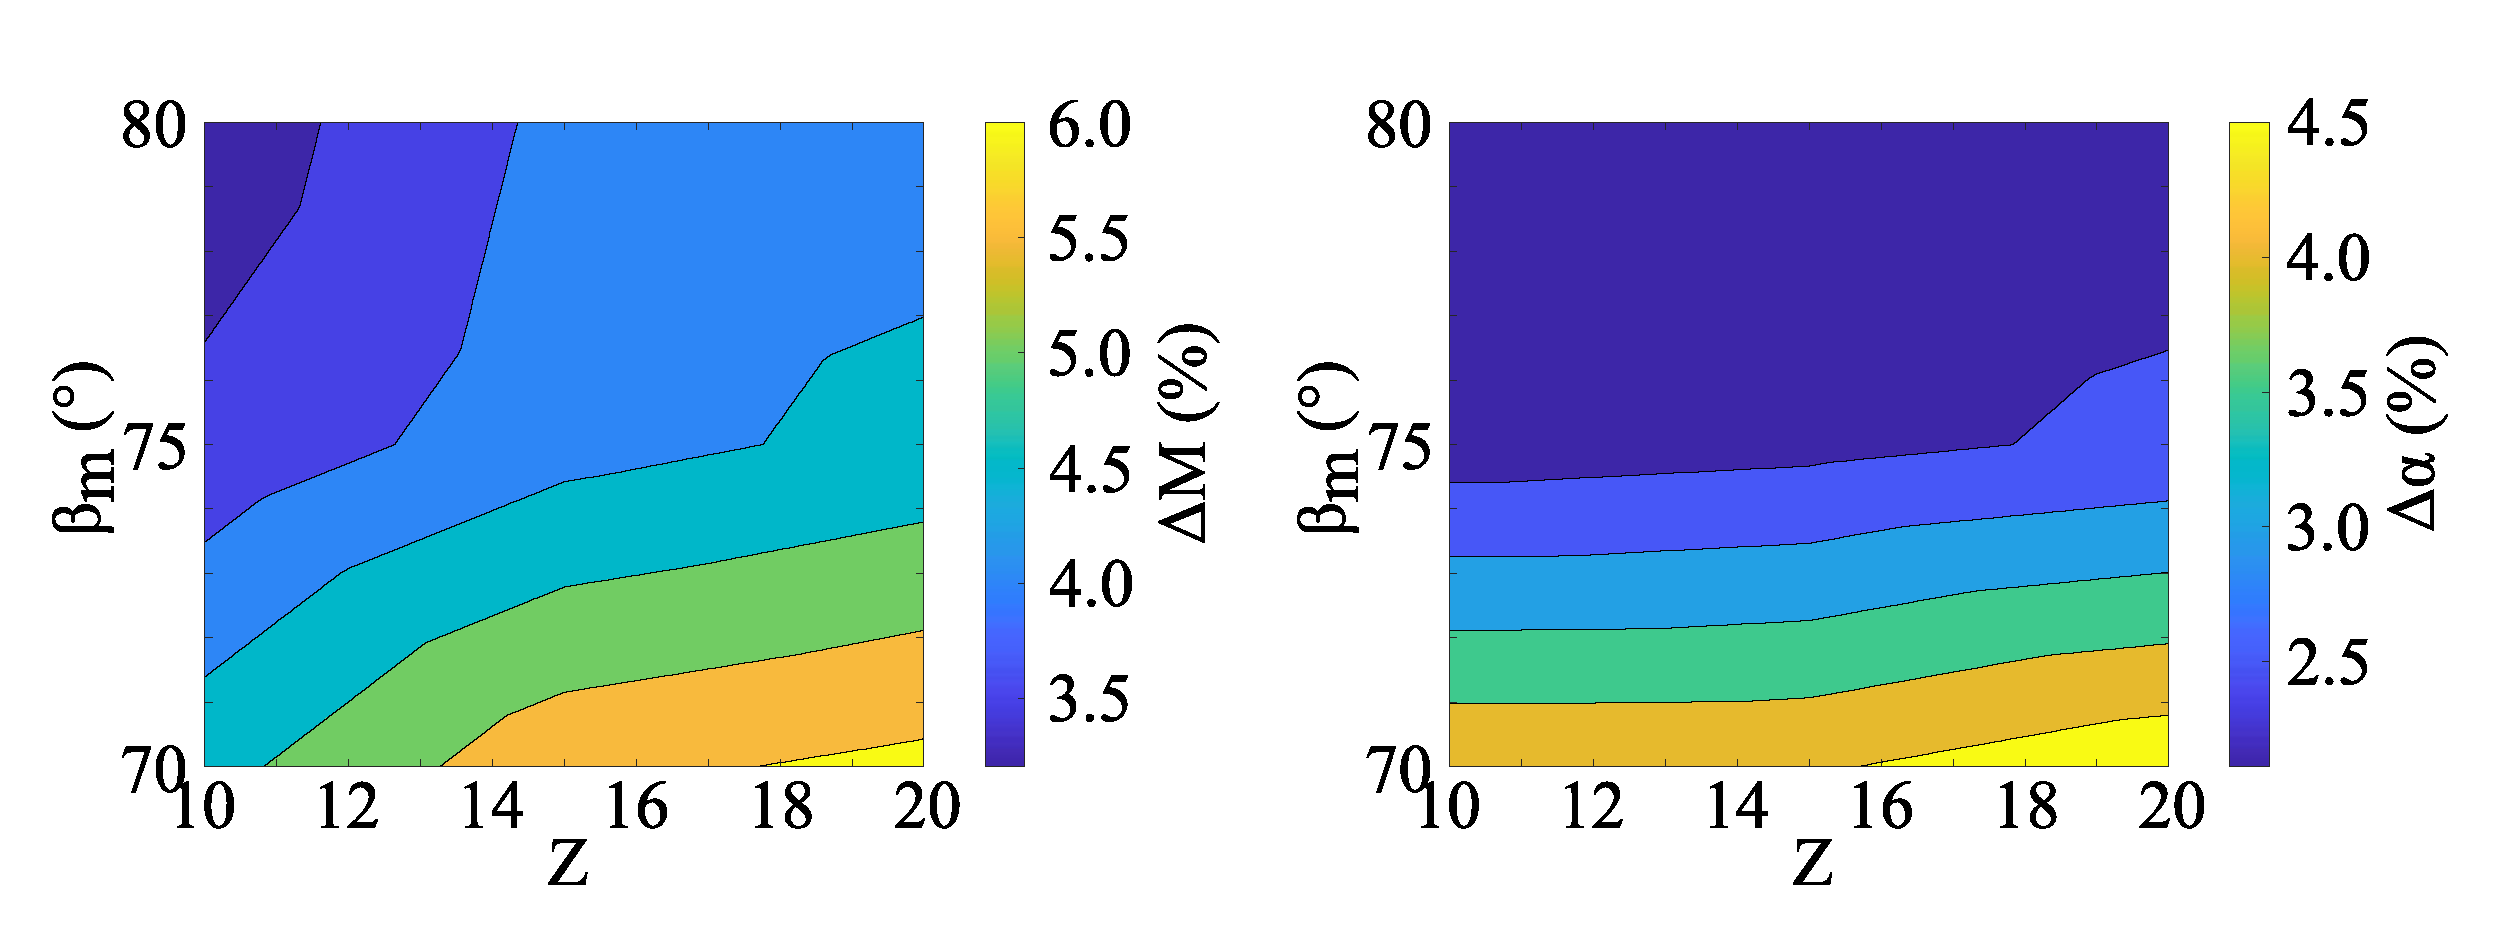
Figure 12 shows the contour plots of non-uniformity index for mid-span outlet Mach number and outlet flow angle (both in the absolute reference frame) at rotor inlet radius, as a function of vane count Z and outlet metal angle β
m. It is worth-noting that an opposite trend with respect to losses can be observed, since the lowest non-uniformity coefficients are attained by low vane count–high outlet metal angle configurations. Furthermore, the outlet flow angle non-uniformity level appears to be only weakly affected by the vane count. Generally speaking, despite the sharper trends in
Figure 9, lower vane counts show globally lower non-uniformity levels,
Figure 12.
As a concluding remark, overall conflicting trends can be found in
Figure 11 and
Figure 12 between the optima from a loss perspective and downstream flow field uniformity, so suggesting the need for multi-objective optimization strategies.
4. Conclusions
The present work was founded on an adaptation to dense gases of the method of characteristics for the inverse design of the diverging section of sharp-edged minimum length nozzles.
The adapted method of characteristics was used to design supersonic vanes of radial flow turbines for organic Rankine cycles, by means of a simple vane parametrization method, fitting the inverse design of the nozzle divergent section into the turbine vane. The method fits well in a conventional design procedure, allowing the designer to set vane height (usually determined in the preliminary design stage), vane count and outlet metal angle independently.
The method was used to investigate the combined effect of vane count and outlet metal angle on stator losses and downstream flow field uniformity for nine stators designed to expand R245fa, while keeping the same MoC target Mach (at AE) lower than the stator design discharge Mach number.
The boundary conditions, together with the preliminary design specifications, were derived from a previous publication by the authors, in which an in-house mean-line code was used to perform the turbine preliminary design and to carry out a parametric analysis of the design space. The CFD analyses of the nine geometries unveiled conflicting trends between optimal stator efficiency and downstream flow field uniformity, so envisaging the need for multi-objective optimization strategies. To gain further insight in the mechanisms driving this occurrence, mid-span pressure gradients were used to visualize the Mach wave patterns. Their influence is correlated with mid-span pitch-wise distributions at the rotor inlet, and the effect of vane count and outlet metal angle on their structure is highlighted. The overall effect of vane count appeared to be slight, even if locally sharper trends take place as the vane count is reduced. The outlet metal angle was seen to induce a larger effect on the overall mid-span pitch-wise distribution at stator outlet, and particularly on the trend in the rear suction side region. Furthermore, the higher the outlet metal angle the sharper the local trends.
Despite the simple vane parametrization method used in this work, results provide novel contribution particularly for the effect of outlet metal angle and vane count and the conflicting trends of optimum stator efficiency and downstream flow field uniformity.
Developments of the present work include the unsteady simulation for the stator-rotor interaction [
28]. Possible future works might include the investigation of the effect of the target Mach number for the MoC, in terms of expansion ratio sharing between bladed and semi-bladed portion of the vane passage. Improvements to the vane parametrization method might include the use of higher order Bezier polynomials specially for the rear suction side, so allowing more degrees of freedom for the curvature distribution, although reducing simplicity of use for generating a first guess geometry.


