Abstract
The paper presents a detailed analysis of particle image velocimetry (PIV) measurements performed in a turbine cascade representative of highly accelerated low-pressure turbine (LPT) blades. Two cameras have been simultaneously used to observe a great portion of the suction side boundary layer with the highest possible spatial resolution, thus allowing us to solve the interaction process between impinging upstream wakes and the blade boundary layer. Four unsteady inflow conditions, characterized by different incoming wake reduced frequencies and flow coefficients, have been examined at fixed Reynolds number. The highly resolved flow fields have been processed to explore reduced frequency and flow coefficient effects on the boundary layer unsteady transition process and, consequently, on loss production. For a deep physical insight on the mechanisms responsible for loss generation, proper orthogonal decomposition (POD) has been applied at different phases of the wake passing period. This has provided the dominant structures affecting the cascade aerodynamics during the wake period. Moreover, the examination of POD modes has allowed us to show the effects induced by the parameter variation on the turbulent kinetic energy production and thus to the unsteady loss production mechanisms.
1. Introduction
The investigation of the physical sources involved in the generation of profile losses represents a central topic in the optimization process of low-pressure turbines. The study is very complex because of the presence of periodic wakes shed from upstream rows, that makes the flow strongly unsteady. For this reason, several research works were carried out in the past. In the numerical simulation by Wu and Durbin [1], the dynamics of the upstream wake evolving in the blade passage is accurately described. It is shown that the wake is conveyed by the cascade potential field towards the blade suction side where it interacts with the boundary layer. Consequently, the transition and separation processes along the blade suction side are strongly influenced by upstream wakes. Especially, relevant effects have been observed in high-lift cascades at low Reynolds numbers, where large separation bubble can be present in the steady condition (see for instance Michelassi et al. [2]). Further investigations [3] captured the formation of two counter-rotating vortices developing at the boundaries of the wake, that are responsible for inducing periodic accelerations and decelerations inside the boundary layer. The consequent intermittent evolution of the near wall flow is also shown in the tests performed by Gompertz and Bons [4]. The process is even more complicated by smaller scale structures carried within the bulk of the wake, as documented by the measurements carried out by Stieger and Hodson [5], that revealed high turbulent activity just in the region of impinging wakes. In this scenario, a step forward in the understanding of wake related effects is provided in [6], where the capability of proper orthogonal decomposition (POD) in identifying different flow structures is discussed, allowing the identification of different mechanisms responsible for loss generation.
The dynamics of the wake-boundary layer interaction process is strongly affected by the upstream wake reduced frequency and the flow coefficient, since they characterize both timing and direction of incoming wakes. Michelassi et al. [7] investigated different inflow conditions, showing that the reduced frequency directly represents the forcing frequency acting on the boundary layer, while the flow coefficient induces different wake trajectories during advection in the downstream cascade passage. Similar flow dynamics are also shown in the simulations reported in [8], carried out for different combinations of both the parameters. Funazaki et al. [9] presented an investigation that quantified losses to the variation of some flow and geometric parameters, including the Strouhal number, closely related to the reduced frequency. However, in this work, reduced frequency and flow coefficient have not been varied independently.
In the present work, particle image velocimetry (PIV) measurements have been carried out in the rear part of the blade suction side to solve the wake-boundary layer interaction process in a highly accelerated turbine cascade. Four different combinations of reduced frequency and flow coefficient have been tested, at constant Reynolds number. Incoming wakes have been characterized at the inlet of the cascade by phase-locked velocity data acquired with an hot-wire anemometer (HWA). The time-mean and fluctuating parts of PIV velocity fields have been analyzed in order to discuss the effects of both reduced frequency and flow coefficient on the blade boundary layer development. Fluid dynamic losses have been quantified in the measuring domain for the different flow cases. Hence, for a deeper investigation of the mechanisms responsible for loss production, POD has been applied at six different phases of the wake passing period. POD modes have allowed us to separate deterministic and stochastic flow structures and to follow their temporal evolution through the inspection at different phases. The turbulent kinetic energy production per POD mode has also revealed loss contributions due to different flow structures, while its spatial distribution has exhibited the regions where losses are mainly produced for the different combinations of the flow parameters here tested.
2. Test Facility and Data Analysis
Measurements were performed in the low-speed wind tunnel installed in the Aerodynamic and Turbomachinery Laboratory of the University of Genova. The test section was constituted of a seven-blade planar cascade, representative of a highly accelerated low-pressure turbine row. The blade chord was 190 mm, the deflection 40° and the solidity 1.2. The cascade, designed to operate with a fully laminar suction side boundary layer in the steady condition, is further characterized by a diffusion factor of DF = 0.09, a diffusion rate of Ds = 0.15 and a velocity ratio of VR = 2.8. Measurements were carried out at fixed Reynolds number Re = 160k for four different combinations of reduced frequency and flow coefficient (see Table 1). The Reynolds number, slightly lower than the design one, was selected to maximize the spatial resolution of the PIV measurements. Instead, the combinations of reduced frequency and flow coefficient were chosen to investigate a large range of parameter variation around their nominal values. All the tests were performed with an inlet homogeneous free-stream turbulence of about Tu = 6%, generated by means of a turbulence generating grid and measured at the cascade inlet section in the steady condition. Upstream wakes were simulated by the moving bar system schematically presented in Figure 1, that allows the variation of reduced frequency and flow coefficient by controlling the bar velocity and spacing. The bars used for the present investigation were characterized by a diameter of 3 mm, appositely chosen to generate momentum defect and losses typical of an upstream LPT row. A detailed characterization of the wake entering the downstream cascade is reported in the following.

Table 1.
Test flow conditions.
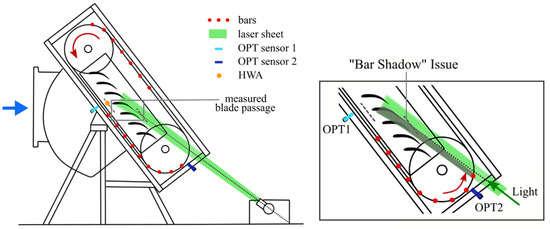
Figure 1.
Test section (on the left) and detail of the “bar shadow” issue (on the right).
2.1. Experimental Setup
Figure 1 shows the test section. The light source, a dual cavity Nd:Yag pulsed laser with 100 mJ energy per pulse at 6 Hz and pulse duration 8 ns, was located to light the test section from behind. The flow was seeded at the wind tunnel entrance section with Vaseline oil droplets with a mean diameter of 1.5 µm. The seeding flow rate was chosen in order to obtain a particle concentration of 4/5 particles per interrogation area. Measurements were performed in order to solve the wake-boundary layer interaction process on the blade suction side with the highest possible spatial resolution. To this end, two Dantec HighSense Mk II digital cameras (Dantec Dynamics, Skovlunde, Denmark), with a resolution of 1344 × 1024 pixels, were used simultaneously. The positions of the cameras are schematically reported in Figure 2. The left camera (cam1) observed the flow field just behind the velocity peak region for 0.35 < s/sMAX < 0.6, where the incoming wakes start to interact with the boundary layer, while the right camera (cam2) was located downstream close to the blade trailing edge, looking at the flow region in between 0.75 < s/sMAX < 1. In order to allow the measurement of the velocity gradients in the boundary layer, couples of PIV images were acquired with a time delay of 40 μs. The magnification factor was 0.263. The cross-correlation has been calculated over a 32 × 32 pixels interrogation area with 50% overlap, obtaining a vector spacing of 0.30 mm. For each flow condition, a total amount of about 2000 couples of images were collected.
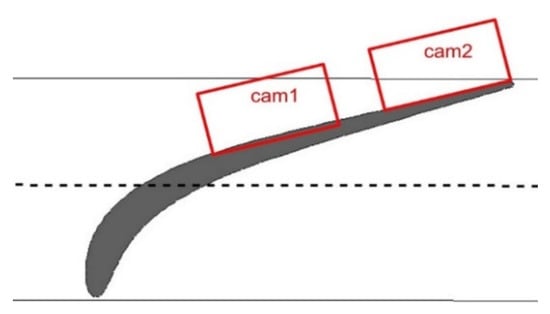
Figure 2.
Detail of the positions of the two cameras.
A particular setting of the test section was adopted to avoid shadows generated by the bars passing in front of the light source may corrupt the acquired images. The detail reported on the right of Figure 1 highlights the “bar shadow” issue. To overcome this problem, the bars (marked by red points in the figure) were assembled in two trains, constituted of 14 bars for conditions C1 and C4 (higher reduced frequency) and 7 bars for conditions C2 and C3 (lower reduced frequency). At the same time, two optical sensors were located in front of the cascade (OPT1) and in front of the laser (OPT2) to capture the passage of the bars. The transistor-transistor logic (TTL) signals generated by the sensors are reported in Figure 3 together with the laser pulses. The first spike from OPT1 switches on an acquisition window, that will be closed by the first spike from OPT2. The laser pulses in between the acquisition window correspond to images with wakes and without shadows, so they were kept for further post-processing, whereas the other images were discarded. The selected snapshots can be also phased in the wake period by computing the difference between the time instant tpiv of PIV pulse with the time instant t1 of the closer previous TTL pulse emitted by the optical sensor in front of the cascade (OPT1) and reffering it to the bar passing period T = t2 − t1, as in Equation (1):
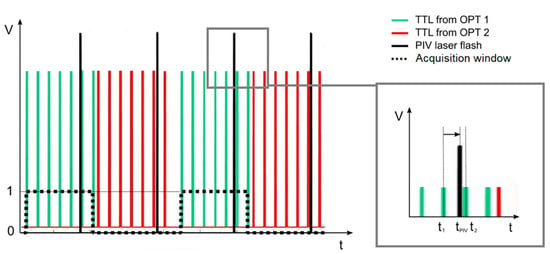
Figure 3.
TTL signals and phasing procedure.
In order to evaluate the velocity defect and the turbulence intensity peak characterizing the incoming wake for the different conditions, a single-element HWA (type 55P15) was also installed at the cascade entrance (Figure 1). The TTL signal from OPT1 has been used to phase-lock also these data. The signals of the optical sensors, the HWA and the PIV pulses were sampled with a DAQ NI acquisition board, with a sampling frequency of 6.3 kHz.
2.2. Data Processing
A fluid dynamic loss analysis was performed to quantify the effects due to reduced frequency and flow coefficient variation on the cascade efficiency. In the mean flow energy equation losses are related to the viscous dissipation Dvisc and the turbulent kinetic energy production PTKE terms, reported in Equation (2) and Equation (3), respectively. For clarity, Ui indicates the ith component of the time-mean velocity, while ui indicates the ith component of the fluctuating velocity. The viscous term represents the contribution to entropy generation due to the shear work (see for instance [10]) and depends only on the time-mean flow velocity gradient, while the turbulent kinetic energy production is also related to the fluctuating velocity field. In particular, turbulence production occurs where the principal direction of the Reynolds stresses and the mean flow strain tensor are aligned [3]. Since the integral of these two terms on a control volume gives the total pressure losses from the inlet to the outlet of the measuring domain [6], a loss coefficient ω can be defined in order to quantify the overall fluid dynamic losses produced in the volume Ω as in Equation (4), where pref is the reference dynamic pressure at the outlet of the cascade. In the present work, the overall region framed by the cameras has been considered as the control volume.
Once estimated the effects on the losses due to the parameter variation, POD has been applied for a deep analysis of the mechanisms responsible for loss generation in the different flow cases. As discussed in previous works (see for example [8]), POD provides a triplet of information: the eigenvalues λ(k), the eigenvectors χ(k) and the POD modes ϕ(k). Each POD mode is able to capture a particular spatial flow structure, the relative eigenvector provides its temporal evolution and the relative eigenvalue expresses the associated energy content. In the present work, POD has been applied at different phases of the wake period to follow the flow structure evolution during the wake-boundary layer interaction process. To this end, PIV snapshots have been split in 6 intervals equally spaced in time. The number of the time intervals has been defined in order to conserve at least about 300 snapshots for each phase bin, thus ensuring the convergence of the first low order (most energetic) POD modes, as documented in Lacarelle et al. [11]. Then, the turbulent kinetic energy production was evaluated per POD mode per phase. This allows us to identify the flow structures responsible for loss production and to investigate where losses are mainly produced. To this end, Reynolds stresses are expressed in the POD space according to Equation (5), where k indicates the mode index.
3. Results
3.1. HWA Measurements
The phase-locked velocity data measured at the inlet of the cascade with HWA are presented in Figure 4 for the four examined conditions. The plot on the top reports the phase-locked velocity, while the bottom one shows the phase-locked turbulence intensity. Referring to the C1 case (blue lines), the plots show four wake passing periods. Incoming wakes are hardly visible in the velocity plot, while they can be identified more clearly in terms of turbulence intensity peaks. The reason why the wakes do not appear as velocity defects can be explained looking at the sketches presented in Figure 5. The dynamics of the wakes at the entrance of the cascade is here schematically reported by velocity triangles, where c1 is the absolute flow velocity, u is the bar velocity and w1 is the relative flow velocity. The flow inside the wake is slower than the surrounding flow, thus, it develops with a lower velocity w1w. Once combined with the bar velocity, the absolute velocity of the flow inside the wake c1w can be obtained. In the sketch on the left, the triangles are calculated for φ = 0.6 (C1 and C2 cases). It results that the modules of the unperturbed absolute velocity (c1) and of the velocity inside the wake (c1w) are very similar. For this reason, the wakes in the C1 case are hardly visible in the velocity plot of Figure 4. This also occurs for the C2 case (black line), since it is characterized by the same flow coefficient of the C1 case. At the same time, in the C2 case the reduced frequency is halved with respect to the C1 case. Consequently, the distance between two consecutive peaks in the turbulence intensity plot is doubled and only two wakes can be observed. In between adjacent wakes the flow is unperturbed, as in the steady state, thus, the turbulence intensity resets almost to the inlet homogeneous free-stream turbulence intensity imposed by the turbulence generating grid (about 6%). On the other hand, the C3 case (green line) reveals the effect of the flow coefficient variation. Indeed, the reduced frequency is the same and the flow coefficient is a half with respect to the C1 case. The dynamics of the entering wakes is now reported by the sketch on the right of Figure 5, obtained for φ = 0.3. The bar velocity is doubled and, consequently, the module of the velocity inside the wake (c1w) becomes larger than the module of the unperturbed velocity (c1). Thus, the wakes are visible in the velocity plot derived from single-element HWA measurements as peaks, which is a completely different situation with respect to classic LPT blades, where upstream wakes are well known to be seen as velocity defect (see for example the work of Praisner et al. [12]). This is due to the small absolute flow angle jointly with the low value of the flow coefficient characterizing the operation of such a kind of highly accelerated turbine profiles. Looking at the turbulence intensity plot, the wakes appear with a higher and wider peak than in the previous cases. Nevertheless, the distance between two successive peaks is the same as the C1 case, since the reduced frequency is the same. Lastly, the C4 case (red line), characterized by high reduced frequency and low flow coefficient, exhibits the combined effect of both parameter variation. According with the previous observations, a larger number of wakes can be observed into the plot. The overall turbulence intensity is higher because the flow is continuously perturbed by wakes and, interestingly, any unperturbed flow region can be observed in between adjacent wakes, since they collapse and merge together. This will have a great impact on the loss generation mechanisms discussed below.
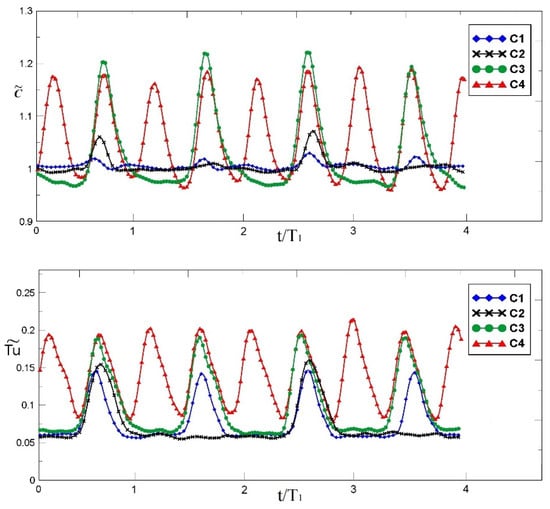
Figure 4.
Phase-locked velocity and phase-locked turbulence intensity distributions.

Figure 5.
Sketches of the wake dynamics at different flow coefficients.
3.2. Time Mean and Phase-Locked Distributions
The time-mean flow field is exemplary presented in Figure 6 for the C1 case. The contour plot represents the streamwise velocity component U, while the grey line highlights the boundary layer thickness. The velocity vectors (U,V) are also superimposed to the plot (one every eight vectors are shown to improve plot readability). The plot shows that the boundary layer continuously develops, without any separated flow region, from the velocity peak position to the blade trailing edge. In the fore part of the measuring domain (camera on the left), the boundary layer remains very thin, while it significantly grew in the rear part of the diffusive region captured by the right camera.
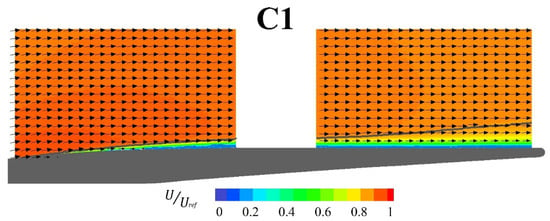
Figure 6.
Time-mean velocity vectors in the C1 case. Contour of streamwise velocity component U. Grey line represents the boundary layer thickness.
Reduced frequency and flow coefficient variation modifies the boundary layer evolution. Figure 7 shows the boundary layer thickness distribution referred to the blade chord in the plot on the left. It was directly calculated from PIV snapshots with an estimated accuracy of δ/C = ±0.75 × 10⁻³, that corresponds to ±2.5% of its value at the trailing edge in the C1 case, where the boundary layer velocity profile is solved by 16 measuring points. The maximum growth of the boundary layer was observed in the C1 and C4 cases, with a maximum thickness δ/C = 0.027 at the blade trailing edge, while the minimum thickness was observed for the C2 case (δ/C = 0.022 at the trailing edge). On the other side, Figure 7 presents the momentum thickness distribution normalized by its maximum value. It was obtained applying trapezoidal rule to integrate the velocity defect, with an estimated resultant accuracy at the trailing edge of ±8%. The momentum thickness shows similar trends with respect to the boundary layer thickness, with values in the C4 case higher than in the C1 case. Since this latter parameter is commonly related to the boundary layer losses, higher losses are expected in the C4 case, characterized by high reduced frequency and low flow coefficient.
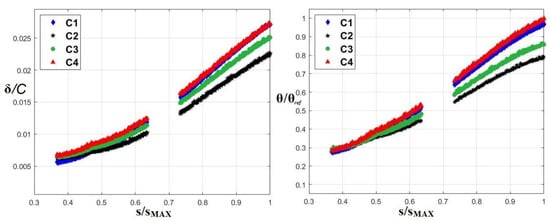
Figure 7.
Boundary layer thickness δ and momentum thickness θ along the suction side.
To better appreciate the transition mechanisms induced by upstream wakes, Figure 8 shows the time-space phase-locked evolution of the momentum thickness and of the shape factor for the different flow cases. Plots are extended over three wake passing periods of the C1 case. The intermittent nature of the boundary layer is clearly captured. Particularly, referring to the top-left plot (momentum thickness, C1 case) the yellow-red stripes are related to the momentum thickness increase consequent to the wake passage. Indeed, as explained in [5], the flow at the trailing boundary of the wake is subjected to a strong deceleration that leads to higher momentum thickness. Coherently, the shape factor (C1 case) reduces from value in the surround of 2.5, typical of the laminar state prior than the wake arrival, to around 1.8 as a consequence of the induced transition, as highlighted by the blue stripes observable downstream of s/sMAX = 0.6. It is worth noting that transition is locally induced by the wake passage, that promotes a turbulent state. However, a fully turbulent condition, typically identified by values of H12 = 1.4, is never achieved in these operating conditions.
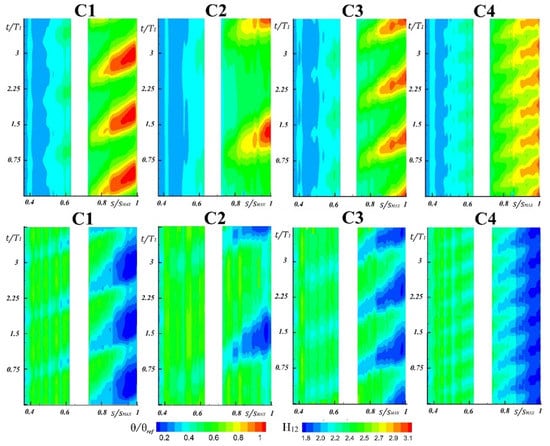
Figure 8.
Time-space diagrams of momentum thickness θ and shape factor H12.
The comparison with the other flow cases allows a direct visualization of the effects induced by both reduced frequency and flow coefficient variation. The reduced frequency effect is clearly visible in terms of number of wake patches present into the plot. In the C2 case only one wake path can be recognized, with the following one just appearing at the end of the ordinate axis. In the C1 and C3 cases three nuclei at high momentum thickness and low shape factor can be observed, while in the C4 case six wake induced transition zones can be observed. The flow coefficient variation is responsible for shifting in time the transitional patch induced by upstream wakes, as observable comparing the C1 and C3 cases.
In order to quantify the effects on the losses due to the observed different transition processes induced by the wakes, Figure 9 presents the fluid dynamic losses calculated in the PIV measuring domain for the different flow cases. The blue part of the bars is related to the contribution of the viscous term, while the green part represents the contribution of the turbulent kinetic energy production term. Data are scaled with the maximum loss value. Highest losses are produced in the C4 case, at high reduced frequency and low flow coefficient. This is due to the large number of wakes inducing a prompter transition, that leads to a higher momentum thickness and, at the same time, a greater turbulent kinetic energy production. The C1 and C3 cases are characterized by similar losses, although the momentum thickness at the trailing edge was slightly higher in the C1 case than in the C3 case. At the same time, Figure 8 has shown similar dynamics of the transition process induced by wakes, that appeared only shifted in time. On the other hand, the C2 case clearly exhibits the lowest losses, due to the reduced frequency reduction, in accordance with the smaller number of turbulent patches observed in Figure 8. It is worth noting that the main differences appear predominantly due to the different amount of turbulent kinetic energy production process (green bars). Indeed, the turbulent kinetic energy produced in the C2 case is 40% lower than in the C4 case, while the differences between the viscous terms are less pronounced and close to their measurement uncertainty. For this reason, in the following chapter a deep discussion of the turbulent kinetic energy production in the different cases is analyzed by means of POD.
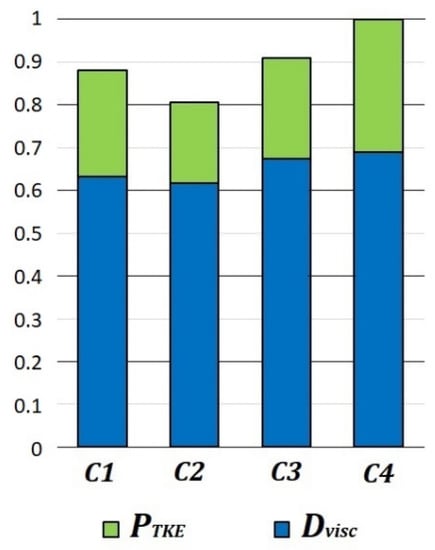
Figure 9.
Quantification of different loss contributions in the four flow cases.
3.3. POD Analysis
POD modes at different phases are presented in the following figures in order to identify the main flow structures carried by upstream wakes and how they interact with the boundary layer for the different cases. The turbulent kinetic energy production per POD mode is also reported to highlight the mechanisms leading to the loss variation depicted in Figure 9. Figure 10 presents the vectorial representation of the first POD mode computed at t/T = 0.00, t/T = 0.33 and t/T = 0.67 (on the left) and two exemplary higher order modes representative of finer scale fluctuations carried by wakes (on the right) for the C1 case. The color levels provide the turbulent kinetic energy produced by the related POD mode, while the green lines superimposed to the plot indicate the boundary layer thickness. Previous applications have already shown the capability of the first POD mode to capture the deterministic part of the fluctuating field (see, for instance, [13,14,15]), identifying the wake as a negative jet and showing two large scale vortices, referred as Q1 and Q2 in the literature (see, for example, [4]), attached to the leading and trailing boundaries of the wake. Here, the application of POD at different phases of the wake passage period also provides the possibility to follow the temporal evolution of these deterministic structures, simply by looking at the first POD mode for different phases. With reference to Figure 10, the wake is leaving the measuring domain at t/T = 0.00 and the clockwise rotating Q2 vortex attached to the trailing boundary of the wake is visible in the region captured by the right camera. Its passage causes a strong deceleration into the boundary layer region, responsible for turbulent kinetic energy production (yellow-red contour in the plot). Subsequently, at t/T = 0.33 the wake has completely left the blade passage (only the last part of the induced deceleration is visible on the right), while the new wake is entering on the left side of the domain. The left camera clearly shows the negative jet and the counter-clockwise rotating Q1 vortex. At t/T = 0.67 the wake is passing in the gap between the two cameras and both the Q1 and Q2 vortices can be observed on the right and on the left cameras, respectively. The boundary layer is now subjected to an acceleration induced by the Q1 vortex. The 3rd POD mode at t/T = 0.00 exhibits structures forming inside the boundary layer in the rear part of the suction side by the passage of the Q2 vortex. Regions of intense turbulent kinetic energy production can be identified by yellow-red areas where the magnitude of the vectors is higher. On the other side, the 2nd POD mode at t/T = 0.67, related to boundary layer structures just before the arrive of the wake, exhibits limited turbulent kinetic energy production, suggesting that loss production intensifies only after the passage of the wake centerline.
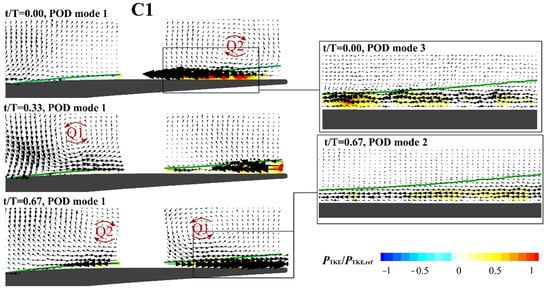
Figure 10.
Exemplary POD modes at different phases for the C1 flow case (f+ = 1.2, φ = 0.6). Contour plots report the turbulent kinetic energy production per mode.
Figure 11 shows analogous POD modes for the C2 case. With respect to the previous condition, the wake can be observed to enter at t/T = 0.00, it leaves the blade at t/T = 0.33, while at t/T = 0.67 the flow is completely unperturbed as a consequence of the lower reduced frequency characterizing this case. The negative jet and related vortices appear bigger, but the induced fluctuations are of minor magnitude. In addition, in this case, the turbulent kinetic energy is mainly produced in the decelerating region induced immediately after the wake passage, as visible at t/T = 0.33 looking at both the 1st mode (right camera) and the 3rd mode (detail on the rear part of the suction side). The mode 3 at t/T = 0.00 shows limited turbulent kinetic energy production when the boundary layer is unperturbed, confirming again that loss production is intensified immediately after the passage of the negative jet. Just because of the presence of large unperturbed areas (see t/T = 0.67 for example), the overall turbulent kinetic energy production is lower than in the previous case.
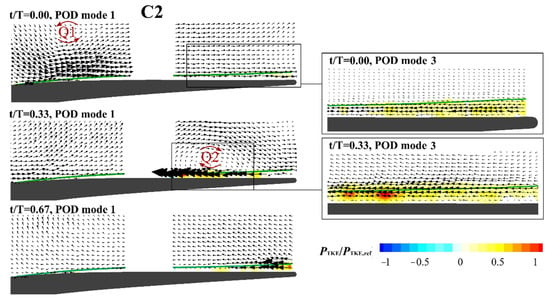
Figure 11.
Exemplary POD modes at different phases for the C2 flow case (f+ = 0.6, φ = 0.6). Contour plots report the turbulent kinetic energy production per mode.
The flow coefficient effect on the structures captured by POD can be discussed comparing Figure 12 (C3 case) with Figure 10 (C1 case). Comparison of the first mode at t/T = 0.00 for the C3 case and the first mode at t/T = 0.33 for the C1 case makes evident that the wake enters in the measuring domain with a more tangential inclination at low flow coefficient. Looking at t/T = 0.33 for the C3 case and at t/T = 0.67 for the C1 case, when the wake is passing in the gap between the two cameras, it can be also noted that Q1 and Q2 vortices are stretched in the outflow direction at low flow coefficient. Subsequently, at t/T = 0.67, the wake is interacting with the rear part of the suction side, while the successive wake is appearing on the left. Therefore, with respect to the C1 case, the wake motion is shifted in phase as a consequence of the different wake trajectory related to the flow coefficient, while the incoming wake frequency is the same. The 3rd mode at t/T = 0.67 captures again the deceleration induced in the boundary layer responsible for high turbulent kinetic energy production, as in the previous cases. Interestingly, the 2nd mode at t/T = 0.67 also shows a not negligible amount of turbulent kinetic energy produced in the acceleration region. It occurs at the leading boundary of the wake where the negative jet carries finer-scale fluctuations into the boundary layer, as observed by Berrino et al. [16] that measured high turbulence intensity just in this region.
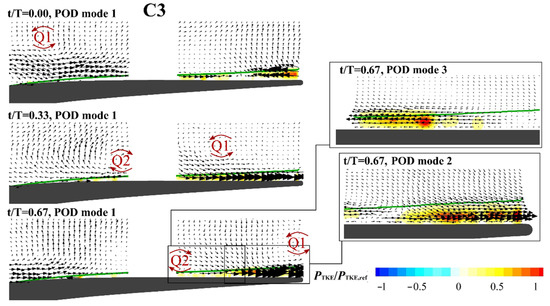
Figure 12.
Exemplary POD modes at different phases for the C3 flow case (f+ = 1.2, φ = 0.3). Contour plots report the turbulent kinetic energy production per mode.
The C4 flow case, characterized by high reduced frequency and low flow coefficient, is reported in Figure 13. The first POD mode simultaneously represents two distinct negative jet like motions, related to two consecutive wakes. At t/T = 0.00, the jets are well centered in the two cameras. The Q1 and Q2 vortices appear evidently smaller and more distorted than in the previous cases, probably because of the strong interaction with the previous/successive wake. Turbulent kinetic energy is produced at every phase into the boundary layer. The 3rd mode at t/T = 0.33 exhibits very high turbulent kinetic energy production at the blade trailing edge, as consequence of the Q2 vortex effects. The 3rd mode at t/T = 0.67 shows an accelerating region above the decelerating one leading again to high turbulent kinetic energy production.
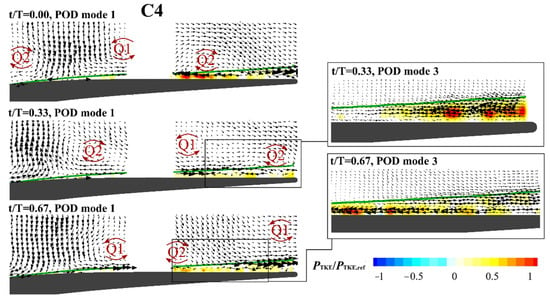
Figure 13.
Exemplary POD modes at different phases for the C4 flow case (f+ = 2.4, φ = 0.3). Contour plots report the turbulent kinetic energy production per mode.
The inspection of POD modes has shown that turbulent kinetic energy is mainly produced during the passage of the large-scale vortices in the diffusive part of the boundary layer. In particular, the decelerations induced by the Q2 vortex are related to high loss production. On the other hand, loss production decreases in the unperturbed regions, before the arrive of the successive wake. Therefore, loss differentiation between the flow cases is mainly driven by the reduced frequency. At low reduced frequency, the large areas of unperturbed flow cause a lower loss production, while at high reduced frequency the continuous action of successive vortices drives to higher loss production. On the other hand, the effect of the flow coefficient on the overall losses is difficult to isolate. Indeed, despite of the different wake trajectory and the different shape of the vortices, the turbulent kinetic energy production in the C1 and C3 cases is very similar.
4. Conclusions
A detailed analysis of the wake-boundary layer interaction process has been carried out by means of PIV measurements in the rear part of the suction side of a highly accelerated LPT cascade. Four flow conditions with different reduced frequency and flow coefficient have been investigated. Incoming wake characterization at the inlet of the cascade has revealed different dynamics induced by the flow coefficient variation. Interestingly, in the examined flow conditions, the wakes cannot be identified as velocity defects as in classic LPT cascades, but mainly as turbulent intensity peaks. Indeed, the small absolute flow angle and the low flow coefficient characterizing the operation of highly accelerated profiles induce a particular dynamic where the flow inside the wake results equal or slightly faster than the surrounding flow.
The analysis of the flow fields has shown different loss production, with higher losses at low flow coefficient and high reduced frequency as a consequence of the prompter transition process induced by incoming wakes. Loss variation between the flow cases appeared mainly due to the turbulent kinetic energy production; thus, POD has been applied to investigate the main flow structures involved in the wake-boundary layer interaction process and to discuss their contribution to loss generation. The first POD mode at different phases has described the deterministic part of the fluctuations, including negative jet and large-scale vortices at the boundaries of the wake. Reduced frequency affects the dimensions of the vortices. They are bigger at low reduced frequency, while the flow coefficient acts on their shape, causing stretching in the outflow direction at low flow coefficient. Higher order modes have instead shown oscillations induced inside the boundary layer. The turbulent kinetic energy is mainly produced by the decelerations induced immediately after the wake passing, while it decreases in the unperturbed flow regions in between adjacent wakes. Thus, loss variation between the different cases is mostly due to the effect of the reduced frequency, that determines the population of structures during the wake passage period.
Author Contributions
Conceptualization, D.L. and D.S.; data curation, E.C., A.N., D.P., M.U. and P.Z.; methodology, D.S. and D.L.; writing—original draft preparation, E.C., A.N., D.P., M.U. and P.Z.; writing—review and editing, E.C., A.N., D.P., M.U. and P.Z.; supervision, D.L. and D.S. All authors have read and agreed to the published version of the manuscript.
Funding
AvioAero originally founded the rig set up.
Institutional Review Board Statement
Not applicable.
Informed Consent Statement
Not applicable.
Data Availability Statement
Not applicable.
Acknowledgments
The authors would like to acknowledge AvioAero for the financing of the cascade tests.
Conflicts of Interest
The authors declare no conflict of interest. The funders had no role in the design of the study; in the collection, analyses, or interpretation of data; in the writing of the manuscript. The funders approved publication of the manuscript.
Abbreviations
The following abbreviations are used in the manuscript:
| Re | Reynolds number [c2C/ν] |
| f+ | reduced frequency [(u/S)/(c2/C)] |
| φ | flow coefficient [c1,ax/u] |
| c | absolute flow velocity |
| C | blade chord |
| DF | diffusion factor [(cpeak − cte)/cte] |
| Ds | diffusion rate [DF/(sdec − stot)] |
| s | coordinate along the blade suction side |
| S | bar pitch |
| t | time |
| T | wake passing period |
| Tu | turbulence intensity |
| u | bar velocity |
| VR | velocity ratio [cos (α1)/cos (α2)] |
| w | relative flow velocity |
| α | cascade angles |
| ρ | density |
| ν | kinematic viscosity |
| Subscripts | |
| ax | cascade axial direction |
| ref | reference value |
| te | trailing edge |
| 1,2 | inlet/outlet section of the cascade |
References
- Wu, X.; Durbin, P.A. Evidence of longitudinal vortices evolved from distorted wakes in a turbine passage. J. Fluid Mech. 2001, 446, 199–228. [Google Scholar] [CrossRef]
- Michelassi, V.; Chen, L.-W.; Pichler, R.; Sandberg, R.D. Compressible Direct Numerical Simulation of Low-Pressure Turbines—Part II: Effect of Inflow Disturbances. J. Turbomach. 2015, 137, 071005. [Google Scholar] [CrossRef]
- Stieger, R.D.; Hodson, H.P. The Unsteady Development of a Turbulent Wake through a Downstream Low-Pressure Turbine Blade Passage. J. Turbomach. 2005, 127, 388–394. [Google Scholar] [CrossRef]
- Gompertz, K.A.; Bons, J.P. Combined Unsteady Wakes and Active Flow Control on a Low-Pressure Turbine Airfoil. J. Propuls. Power 2011, 27, 990–1000. [Google Scholar] [CrossRef]
- Stieger, R.D.; Hodson, H.P. The Transition Mechanism of Highly Loaded Low-Pressure Turbine Blades. J. Turbomach. 2004, 126, 536–543. [Google Scholar] [CrossRef]
- Lengani, D.; Simoni, D.; Pichler, R.; Sandberg, R.D.; Michelassi, V.; Bertini, F. On the Identification and Decomposition of the Unsteady Losses in a Turbine Cascade. J. Turbomach. 2019, 141, 031005. [Google Scholar] [CrossRef]
- Michelassi, V.; Chen, L.; Pichler, R.; Sandberg, R.; Bhaskaran, R. High-Fidelity Simulations of Low-Pressure Turbines: Effect of Flow Coefficient and Reduced Frequency on Losses. J. Turbomach. 2016, 138, 111006. [Google Scholar] [CrossRef]
- Lengani, D.; Simoni, D.; Pichler, R.; Sandberg, R.; Michelassi, V.; Bertini, F. Identification and quantification of losses in a LPT cascade by POD applied to LES data. Int. J. Heat Fluid Flow 2018, 70, 28–40. [Google Scholar] [CrossRef]
- Funazaki, K.-I.; Murakami, D.; Okamura, Y. Parametric Studies on Aerodynamic Performance of Various Types of LP Turbine Airfoils for Aero-Engines Under the Influence Periodic Wakes and Freestream Turbulence. In Proceedings of the ASME Turbo Expo 2019: Turbomachinery Technical Conference and Exposition, Phoenix, AZ, USA, 17–21 June 2019. [Google Scholar]
- Denton, J.D. Loss Mechanisms in Turbomachines. J. Turbomach. 1993, 115, 621–656. [Google Scholar] [CrossRef]
- Lacarelle, A.; Faustmann, T.; Greenblatt, D.; Paschereit, C.O.; Lehmann, O.; Luchtenburg, D.M.; Noack, B.R. Spatiotemporal Characterization of a Conical Swirler Flow Field Under Strong Forcing. J. Eng. Gas Turbines Power 2009, 131, 031504. [Google Scholar] [CrossRef] [Green Version]
- Praisner, T.J.; Clark, J.P.; Nash, T.C.; Rice, M.J.; Grover, E.A. Performance Impacts Due to Wake Mixing in Axial-Flow Turbomachinery. In Proceedings of the ASME Turbo Expo 2006, Barcelona, Spain, 11 May 2006; pp. 1821–1830. [Google Scholar]
- Lengani, D.; Simoni, D.; Nilberto, A.; Ubaldi, M.; Zunino, P.; Bertini, F. Synchronization of multi-plane measurement data by means of POD: Application to unsteady boundary layer transition. Exp. Fluids 2018, 59, 184. [Google Scholar] [CrossRef]
- Legrand, M.; Nogueira, J.I.; Lecuona, A. Flow temporal reconstruction from non-time-resolved data part I: Mathematic fundamentals. Exp. Fluids 2011, 51, 1047–1055. [Google Scholar] [CrossRef]
- Legrand, M.; Nogueira, J.I.; Tachibana, S.; Lecuona, A.; Nauri, S. Flow temporal reconstruction from non time-resolved data part II: Practical implementation, methodology validation, and applications. Exp. Fluids 2011, 51, 861–870. [Google Scholar] [CrossRef]
- Berrino, M.; Lengani, D.; Simoni, D.; Ubaldi, M.; Zunino, P. POD Analysis of the Wake-Boundary Layer Unsteady Interaction in a LPT Blade Cascade. In Proceedings of the 11th European Conference on Turbomachinery, Fluid Dynamics & Thermodynamics, Madrid, Spain, 23–27 March 2015. [Google Scholar]
Publisher’s Note: MDPI stays neutral with regard to jurisdictional claims in published maps and institutional affiliations. |
© 2021 by the authors. Licensee MDPI, Basel, Switzerland. This article is an open access article distributed under the terms and conditions of the Creative Commons Attribution (CC BY-NC-ND) license (https://creativecommons.org/licenses/by-nc-nd/4.0/).