Abstract
This paper experimentally investigates a highly-loaded 1.5-stage transonic axial compressor, which comprises a variable inlet guide vane, a BLISK rotor, and a variable stator in tandem arrangement. A detailed comparison between the newly designed compressor stage and a reference stage with a conventional stator design was conducted by using extensive instrumentation. Thus, steady and unsteady phenomena—focusing on the aerodynamic and aeroelastic behavior—were analyzed. Due to the new stator vane design, a higher aerodynamic stator vane loading was pursued, while the vane count was reduced. This, in turn, allowed a rotor design with an increased work coefficient. This experimental study revealed several effects of the optimized compressor stage in terms of both performance and the corresponding aerodynamics, as well as the aeroelastic behavior.
1. Introduction
Future aero engines face the environmental challenge of drastically reducing greenhouse gases. Thus, politically defined regulations regarding emissions are becoming increasingly important. To achieve these regulations, novel approaches in technology development are inevitably necessary. Therefore, the development trends of aero engines aim for opportunities to increase efficiency in conjunction with reduced weight and size. As a major component, the axial core compressor offers great potential by increasing the overall pressure ratio with a minimum number of compressor stages, as well as reduced blade and vane counts. This results in highly-loaded compressor stages that are prone to flow separation. One possibility to withstand the high loading is the use of a stator in tandem arrangement. Hence, the work coefficient of the rotor can be increased which leads to an optimized stage loading.
Due to a high rotor blade loading in combination with low structural damping of BLISK rotors, transonic compressor rotors are susceptible to blade vibrations. This leads to stability limits, which are either aerodynamically or aeromechanically driven. To analyze the underlying phenomena, stall inception mechanisms and non-synchronous blade vibrations (NSV) have been research subject for decades (e.g., [1,2,3,4,5,6,7,8,9,10]).
The capabilities of a highly-loaded transonic compressor stage with respect to steady operation and its performance due to the usage of a tandem stator were already proved by Foret et al. [11]. Therefore, the objective of this experimental study is to perform an analysis that focuses on aerodynamics and the correlated aeroelastic phenomena.
2. Experimental Setup
The experimental investigations were carried out at the Transonic Compressor Darmstadt (TCD) test bench at Technical University of Darmstadt. A sectional view of the test facility and the compressor core is depicted in Figure 1. For a description of the test facility and its features, the reader is referred to Foret et al. [11]. The investigated compressor stage is set up as a 1.5-stage configuration, comprising a variable inlet guide vane (VIGV), a BLISK rotor and a variable stator vane (VSV), representing a high-pressure compressor front stage of a modern jet engine with relative Mach numbers within the rotor tip regions of about 1.4. The special feature of the VSV is its arrangement as a tandem stator.
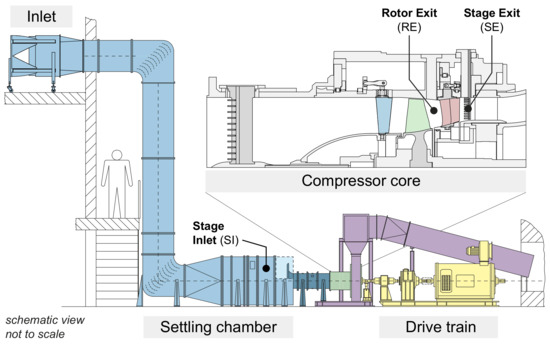
Figure 1.
Cross section of the test facility—Transonic Compressor Darmstadt TCD.
2.1. Instrumentation and Measurement Procedure
The compressor’s performance was measured with steady instrumentation. Pitot probes and thermocouples, installed in circumferentially fixed mounted measurement rakes, were used to measure the total pressure and temperature at the stage inlet (SI) and stage exit (SE), as marked in Figure 1. Furthermore, static pressure taps were distributed around the circumference in several measurement sections at the hub and casing. The rotational speed and the torque were measured with a torque measurement shaft. The mass flow was determined by means of a calibrated bellmouth upstream of the compressor core.
For detailed investigations of steady compressor aerodynamics, five-hole probe (5HP) measurements were carried out within the rotor and stage exit plane. By traversing the probe in radial direction, radial profiles of the flow quantities, such as total pressure, flow angle, and Mach number, were determined. To achieve a representative mean value, radial traverses were measured at several clocking positions relative to the non-rotating vane rows, VIGV and VSV respectively. The 5HP used in this work was calibrated at an in-house free-jet calibration channel for a Mach number and flow angle range that covered the values expected during compressor operation.
To determine the rotor blade vibrations, strain gauges (SGs) were applied to the rotor blades (see Figure 2). Additionally, piezo-resistive wall pressure transducers (WPTs) were mounted in the casing within the rotor tip region. These SG and WPT sensors were recorded with a sampling frequency of up to 500 kHz, and were therefore appropriate to resolve transient phenomena, such as aerodynamic disturbances and blade vibrations. On the one hand, the WPT sensors were arranged in an axial array that covered the entire axial rotor chord, as well as a certain range upstream of the rotor. Hence, two-dimensional wall-pressure fields could be derived. On the other hand, single sensors were distributed around the circumference in the region of the rotor leading edge to determine circumferentially propagating phenomena and BLISK vibrations.
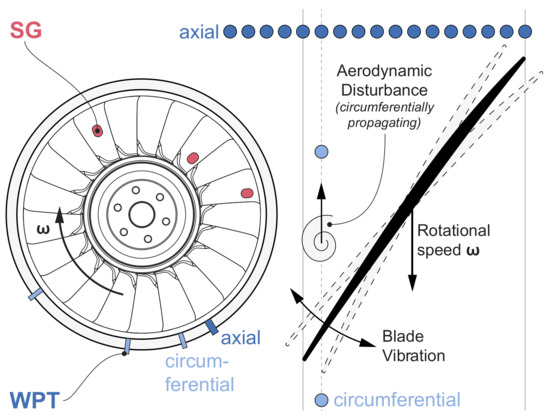
Figure 2.
Unsteady instrumentation within the rotor section.
2.2. Test Content
The data shown within this work comprise a reference configuration (REF)—as already investigated by Jüngst [9] and Möller and Schiffer [10]—and a configuration with an optimized stage loading (OLC), both designed by Rolls-Royce Deutschland Ltd. & Co KG. The VIGV used was the same for both stages. The REF stage comprised a conventional loaded rotor and stator, whereas the OLC stage comprised a rotor with an increased work coefficient and a highly loaded stator in tandem arrangement. For proper comparability, the general geometries, such as the rotor blade count, rotor tip gap, and the axial gaps between vane and blade rows, were kept equal for both configurations. In addition, the basic instrumentation was kept the same. Due to the higher loading, the vane count of the tandem VSV (OLC) could be reduced by more than 30%. This work focused on the comparison of both configurations at design speed (DS). The corresponding VIGV-VSV-schedule for this particular speed—referred to as nominal schedule—was kept the same for both configurations. The VSV angle variations were performed only for the examination of the VSV influence on aeroelastic effects of the OLC configuration and were appropriately marked within the respective sections.
3. Methodology
The investigations within this work can be divided into steady and transient operation, as illustrated in Figure 3. Steady compressor operation (see Figure 3, left) is achieved at steady-state flow conditions, i.e., the flow parameters are constant throughout the measurement time. Hence, flow phenomena are analyzed at certain operating points, such as peak efficiency (PE), intermediate (IM), or near stall (NS), which are defined by fixed throttling conditions respectively. To examine flow phenomena during transient compressor operation (see Figure 3, right), the last stable operating point (NS) of the respective characteristic is set as starting point. From there, the back-pressure is continuously increased by closing the throttle. During this throttling maneuver beyond the stability limit, the flow quantities are measured. By means of a once-per-revolution trigger signal, the measured data can be assigned to the respective revolution. The data analysis methods are based on the procedures presented by Jüngst [9].
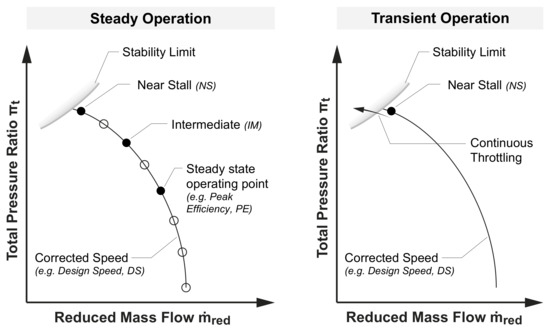
Figure 3.
Measurement procedures.
4. Results and Discussion
In order to assign the following analyses to the corresponding operating points in the compressor map, the characteristics of both investigated configurations, which were already examined in detail by Foret et al. [11], are shown in Figure 4. PE represents the operating point with the maximum efficiency. IM is an operating point with an increased back-pressure. NS represents the last stable operating point of the compressor characteristic. Foret et al. [11] pointed out several conspicuities between the OLC and the REF configuration at DS:
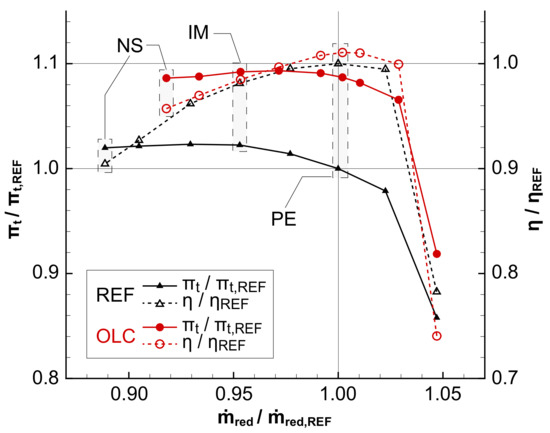
Figure 4.
Compressor map at DS and nominal VIGV-VSV-schedule.
- (i)
- The OLC configuration reached a higher pressure ratio (+8.7% at PE) and efficiency (+1.1% at PE) compared to the REF configuration along the entire DS characteristic.
- (ii)
- The reduced mass flows for the respective operating points near the choking limit and at the PE operating points matched for both configurations.
- (iii)
- The stability limit represented by the NS operating point was reached at a higher reduced mass flow for the OLC configuration, thus resulting in a reduced operating range compared to the REF configuration.
- (iv)
- The OLC stage performance was rather robust against VSV angle variations within a certain adjustment range (not shown in Figure 4 for brevity).
This work further focuses on the flow topology of the OLC stage. Therefore, on the one hand, steady aerodynamics are analyzed at three characteristic points (PE, IM, and NS). On the other hand, the unsteady behavior—aerodynamically and aeroelastically—is analyzed for transient throttling maneuvers beyond the stability limit. Both investigated rotors suffered NSV during throttling into the stability limit, even though the operating range was limited aerodynamically, by rotating stall respectively.
4.1. Steady Aerodynamics
The steady aerodynamics were analyzed by using 5HP measurements and time-resolved WPT data during steady compressor operation. The 5HP data are shown in Figure 5 for the rotor and stage exit planes, respectively. All data are referred to the PE operating point of the REF configuration in such a way that the percentage deviation is depicted. In addition to the flow quantities pressure ratio, flow angle, and Mach number, a pressure loss coefficient was calculated as
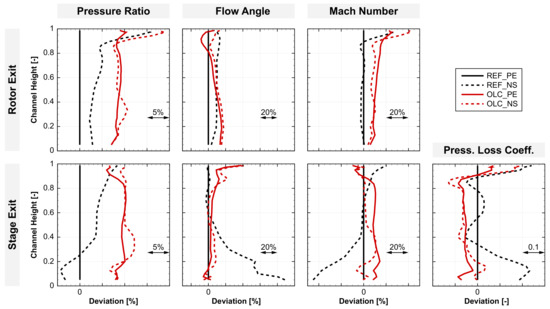
Figure 5.
Radial distribution of pressure ratio, flow angle, Mach number and pressure loss coefficient at rotor and stage exit for DS.
Here, the difference in the pressure ratios upstream (RE) and downstream (SE) of the stator is referred to the dynamic inlet pressure of the stator. In Figure 5, the respective difference of to the PE operating point of the REF configuration is depicted.
It is visible that the OLC configuration reached a higher pressure ratio, which applied to both, the rotor and stage exit. For PE, the pressure increase was up to 10%. Due to the fact that the investigated NS operating points were not at same reduced mass flows, the change between PE and NS was lower for the OLC configuration. Nevertheless, the radial profiles at the rotor exit were similar, and at NS, a peak was observed within the rotor tip region, which is not uncommon for tip critical transonic compressor rotors (compare with [12]). For the stage exit, the pressure profiles for the OLC configuration were almost constant. In contrast, the pressure profile for the REF configuration at NS showed a significant drop in the lower 40% channel height, indicating a hub flow separation within the stator.
Regarding the flow angles, the rotor exit swirl of the OLC design was higher compared to that of the REF design as a result of the higher turning for the increased work input. For both configurations, an increase in the rotor exit flow angle was visible from PE to NS, which was due to an increased back-pressure and, therefore, changed flow conditions at the rotor inlet. The profiles for the OLC configuration show that the flow turning of the OLC rotor was shifted towards the hub. Although the turning of the OLC rotor near the hub was almost 20% higher than for the REF rotor, the turning in the rotor tip region was up to 10% lower. For the stage exit, high deviations were observed within the tip region. Here, the turning of the tandem VSV (OLC) was increased by approximately 30%. For the lower 80% channel height, the exit flow angles of the tandem VSV were similar to those of the REF stator in spite of the higher inlet swirl induced by the OLC rotor exit flow, as described before. Thus, a higher turning of the tandem stator was realized. The beneficial behavior of tandem stators for high turning was already pointed out by Hertel et al. [13]. At NS, the hub flow separation for the REF configuration was visible by major deviations of the flow angle.
At rotor exit the Mach number of the OLC configuration was higher than for REF. As mentioned by Müller et al. [14], the advantages of tandem stators come into effect at high inflow Mach numbers. Within the rotor tip region, both configurations showed distinct peaks for NS. This matched with the radial profiles of the pressure ratio. The proof that the tandem stator could handle high inflow Mach numbers became visible at the stage exit. The Mach number deviations between PE and NS were low for the OLC configuration, whereby the hub flow separation of the REF configuration at NS was again visible by low Mach numbers near the hub.
To visualize the radial pressure loss distribution, the pressure loss coefficient was considered. It is visible that the losses for the OLC configuration at PE were lower with respect to the REF configuration for almost the entire channel height. This was due to the higher dynamic inlet pressure for the tandem VSV according to Equation (1). Only in the upper 5% channel height did the losses exceed the losses of the REF configuration. For the OLC configuration, at NS, the variations over the radial channel height were slightly increased. Locally, at 40% and 80% channel height, the losses were even lower than for PE. This might be attributed to the fact that the increase in pressure rise between PE and NS was moderate for OLC, but the mass flow was decreased (compare with Figure 4). Because the losses increased in the end wall regions, the area-averaged losses were higher for NS than for PE. For the REF configuration, the variations at NS were even higher. Especially the hub flow separation resulted in high pressure loss coefficients. The 5HP investigations showed no indications of a failure of the tandem stator towards the stability limit. Therefore, the loss in stability margin with respect to the REF configuration might be attributed to a breakdown of the rotor flow due to the high loading.
To analyze the steady aerodynamics within the rotor tip region, the data from the axial array of the WPTs were used. In Figure 6, the derived ensemble-averaged static wall pressure fields are shown for both configurations at DS for the operating points PE, IM and NS respectively. The static wall pressure was averaged over several hundred revolutions at steady-state conditions and referred to the total pressure at the stage inlet. The scale limits were set to equal values for a proper comparison. In each plot, the blades ① are schematically drawn. Additionally, some distinct flow features are illustrated: The shock ② resulting from supersonic conditions in the tip region is detectable by a sudden pressure rise. In addition, its relative position to the blade leading edge is marked by the detachment a and the angle . The tip leakage flow ③ and its trajectory are visible by a low pressure area in the vicinity of the suction side at the blade leading edge.

Figure 6.
Mean wall pressure data within the rotor tip region for the REF and OLC configurations at DS—operating points PE, IM, and NS.
For all operating points, but especially for operating points at equal mass flows (PE and IM), an increased static pressure rise in the OLC configuration was visible. This indicated a higher aerodynamic blade loading within the tip region. Comparing both configurations with respect to the pressure rise along the characteristic, the pressure increased from PE to IM to NS due to an increased back-pressure, as expected. This caused the shock to move further upstream (a increased) and changed the inclination of the shock ( increased). The low pressure area of the tip leakage flow also moved upstream towards the rotor leading edge. It was noticeable that the tip leakage flow intensity for the OLC configuration at PE was lower than that for the REF configuration. As expected from the compressor map (Figure 4), the differences between IM and NS for the OLC configuration were smaller because the stability limit was reached at higher mass flows than for the REF configuration. At PE, the relative shock detachment , i.e., the shock detachment referred to the rotor tip chord length, was slightly smaller for OLC than for the REF configuration, whereas the relative shock detachment at IM and NS was similar for both configurations. The shifted shock position resulted in reduced mixture of the tip leakage and main flow and, thus, increased losses in the interaction zone with the shock. Ultimately, blockage within the passage increased, and might be an indicator for unsteady flow regimes in the vicinity of the aerodynamic stability limit. Because the OLC rotor already achieved these flow conditions at higher mass flows, this might be the reason for the loss in operating range compared to the REF configuration.
4.2. Unsteady Aerodynamics and Aeroelasticity
Next, the transient behavior of both configurations was analyzed at the stability limit (compare with Figure 3, right). In Figure 7, the time-resolved pressure deviation within the rotor tip region—captured by the axial WPT array (compare with Figure 2)—is plotted for selected revolutions to qualitatively analyze the stall inception mechanism. The quantity shown is based on methods proposed by Brandstetter et al. [8]. It shows the difference between the static wall pressure and a local ensemble average of the wall pressure of several previous rotor revolutions. In order to determine pressure fluctuations, which can be used as an indicator of aerodynamic disturbances, the difference is related to the dynamic inlet pressure. The stall inception is marked as revolution zero.

Figure 7.
Pressure deviation during throttling maneuver at DS.
It is visible that the behavior was similar for both stages. 400 revolutions before stall inception, the fluctuations of both configurations were low. Even 100 revolutions before stall, an increase of the fluctuations was barely noticeable. Just shortly before stall inception, at revolution −5, pressure disturbances, such as single stall cells, covering several rotor blade passages, could be detected. Only five revolutions later, the flow field was highly disturbed and completely collapsed. This state lasted for a few hundred revolutions until the emergency bleed was activated and the compressor was returned to safe operating conditions, which resulted in very low pressure fluctuations within the rotor tip region.
In the following, aeroelastic effects are additionally taken into account for transient throttling maneuvers beyond the stability limit by analyzing associated SG and WPT data. The temporal progression of the corresponding frequency spectra for representative SGs and WPTs are shown for the REF and OLC configurations in Figure 8 and Figure 9, respectively. In each case, the stall inception is marked by revolution zero. The particular SG sensor is sensitive to vibrations of the first torsional mode (1T). The particular WPT sensor is the first sensor within the axial array downstream of the leading edge (compare with Figure 2) because this sensor properly detects circumferentially propagating aerodynamic disturbances in the vicinity of the rotor blade leading edge. Additionally, the respective maximum peaks for the frequency spectra are shown for both before stall inception and during stall. In each subfigure, the respective frequencies are referred to the rotational speed in order to assign occuring phenomena to the corresponding engine order (EO).
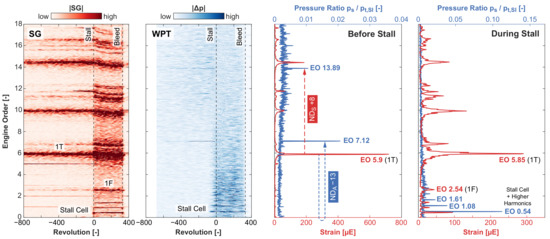
Figure 8.
SG and WPT spectra of the throttling maneuver at DS for the REF configuration.
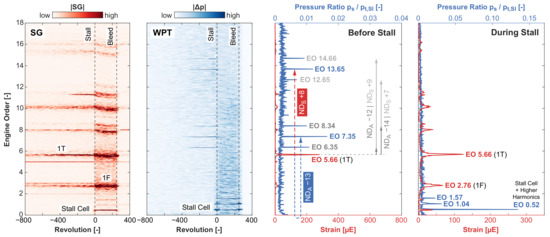
Figure 9.
SG and WPT spectra of the throttling maneuver at DS for the OLC configuration.
For the REF configuration (see Figure 8), the SG spectrogram shows a rise in 1T amplitudes. These vibrations are related to EO 5.9, as depicted in the peak-hold diagram before stall inception, hence, NSV occured. The WPT spectrogram shows two distinct peaks, which can be assigned to EO 7.12 and EO 13.89 by using the peak-hold diagram before stall. According to Jüngst [9], this indicates a fluid-structure coupling with a forward traveling structural wave with an nodal diameter NDS +8 and a backward traveling aerodynamic wave with an NDA −13. After stall inception (revolution zero), vibrations of the first flap (1F) mode occured at EO 2.54, as marked in the SG spectrogram and the peak-hold diagram during stall. These vibrations were evoked by a circumferentially propagating stall cell, which could be detected at approximately EO 0.5. The stall cells could also be detected by the WPT because higher pressure amplitudes were present in the WPT spectrogram. According to the peak-hold diagram during stall, these amplitudes were related to EO 0.54 and higher harmonics. Thus, the stall cells were traveling around the circumference in the stationary frame of reference with 54% of the rotor speed, and thus matched the values that are usually found in the literature. Hence, the behavior of this configuration with respect to aerodynamic and aeroelastic phenomena near the stability limit matches with the findings of Jüngst [9].
The same analysis method was applied to the data of the OLC configuration, as illustrated in Figure 9. Here, NSV occurred as well, apparent by 1T vibrations before stall inception, which were related to EO 5.66, as marked in the SG spectrogram and the corresponding peak-hold diagram. Considering the WPT spectrogram, several distinct peaks could be detected. Thus, the detected vibrations could be assigned to a fluid-structure coupling, as already seen for the REF configuration. Regarding the peak-hold diagram before stall inception, the peaks at EO 7.35 and EO 13.65 were associated to a backward traveling aerodynamic wave with an NDA −13 and a forward traveling structural wave with an NDS +8. In contrast to the REF configuration, additional peaks were visible in the WPT spectrogram that occurred at the same time. In the peak-hold diagram before stall, these peaks could be assigned to an NDS +7 in conjunction with an NDA −14, as well as an NDS +9 in conjunction with an NDA −12. Therefore, for the OLC configuration, most likely, several NDs were simultaneously present and superimposed. There was no indication that this phenomenon was due to the high aerodynamic loading of the OLC rotor. As for the REF configuration, the 1F mode vibrations and higher harmonics were excited during stall, as marked in the peak-hold diagram during stall. In contrast to the REF configuration, 1F mode vibrations already occurred before stall, but with low amplitudes. Again, this might be attributed to the higher rotor loading in general compared to the REF configuration. However, as mentioned before, the evaluated SGs are primarily sensitive to 1T vibrations, hence, 1F vibrations of the REF configurations might not be properly resolved by the selected SG.
Because the measured SG strain strongly depends on its positioning on the blade and the blade geometry, the strain magnitude is not appropriate for comparing different rotors. Furthermore, the different SG sensitivities of different modes are crucial. To gain a better understanding of the temporal progression of the 1T vibrations that occurred and their maximum amplitudes, Figure 10 illustrates the bandpass-filtered SG signal for the 1T mode and the bandpass-filtered WPT signal for the corresponding aerodynamic traveling wave. The SG amplitudes are referred to their maximum strain—given as a percentage of the operating limit—to indicate safe operation. In addition, the time of stall inception is marked, as well as the time when the SG amplitudes reached 10% of the operating limit. In order to visualize the temporal progression of the pressure rise of the rotor during the throttling maneuver, the total-to-static pressure rise coefficient , as defined by Jüngst [9], was used. is referred to its maximum value at PE for the OLC configuration and depicted in the subfigure below.
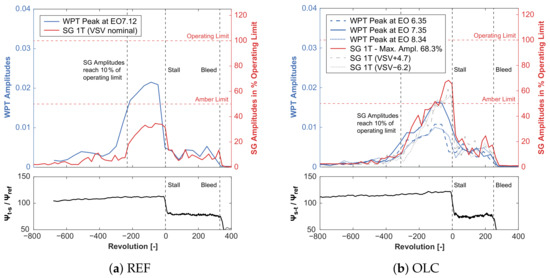
Figure 10.
SG and WPT amplitudes during throttling maneuver at DS.
For the REF configuration (see Figure 10a), it is visible that the WPT amplitudes for EO 7.12 began to rise rapidly at 300 revolutions before stall inception. The rise of the 1T SG amplitudes followed shortly after. The corresponding vibrations reached 10% of their operating limit shortly before revolution −200. Both amplitudes (WPT and SG) rose until stall occured at revolution zero, whereby the SG amplitudes (34.7%) remained below their amber limit. Prior to stall initialization, the pressure rise coefficient also rose, which means that the compressor continuously increased pressure while the aerodynamic disturbances were amplified within the rotor tip region. At the point when stall occured, the pressure rise coefficient, as well as the amplitudes of the SG and WPT, dropped to a lower level where the signal fluctuation was higher, especially for the pressure rise coefficient . At revolution 350, the emergency bleed was opened to obtain safe compressor operating conditions. Because the emergency bleed was activated manually by the test rig operator, the time, i.e., revolutions, between stall inception and the emergency bleed opening varied.
For the OLC configuration (see Figure 10b), the WPT amplitudes for EO 7.35 began to rise at revolution −400. The SG amplitudes reached 10% of their operating limit 300 revolutions before stall inception. In this case, the aerodynamic disturbances and vibrations began a bit earlier than for the REF configuration. This might be attributed to the higher loading of the OLC rotor, which was also visible by a higher pressure rise coefficient. The general behavior was similar to the REF configuration because the WPT and SG amplitudes increased rapidly until stall initiation, dropped down at revolution zero, and fluctuated more strongly on a lower level until the emergency bleed was activated. One difference here is that the SG amplitudes reached 68.3% of their operating limit, and therefore exceeded the amber limit, which is already defined as a critical operating range. Again, this might be attributed to the higher aerodynamic loading of the OLC rotor. As already mentioned before, for the OLC configuration, two further WPT peaks could be detected at EO 6.35 and EO 8.34. Therefore, the amplitudes for these two WPT frequency bands are also plotted in Figure 10b. The temporal progression was equal to the progression of EO 7.35, but the magnitude was a bit lower.
Because the higher loading was enabled by using a VSV in tandem arrangement, additional studies were carried out, including VSV angle variations in order to examine the influence of the tandem VSV on the rotor behavior in the vicinity of the stability limit. As expected, the influence of a closed (+4.7%) or opened VSV (−6.2%) was barely identifiable with respect to aerodynamics and corresponding aeroelastic phenomena at the stability limit. Therefore, only the SG amplitudes are illustrated as gray lines in Figure 10b to prove this statement.
5. Conclusions
The outcomes of the experimental investigations conducted here can be split into two parts. First, the 5HP measurements at steady operating conditions verified the capability of the tandem VSV to withstand a high aerodynamic stator loading, thus enabling an optimized stage loading. Hence, an increased work coefficient of the rotor could be realized. There was no indication that a flow breakdown of the tandem stator was the reason for the loss in stability margin compared to the REF configuration. Therefore, the target of the second part was to determine the reason for the loss in stability margin. The associated data of the WPTs and the SGs were evaluated with respect to the aerodynamic behavior of the OLC rotor and the corresponding aeroelastic effects in order to find differences from the REF rotor. The behavior of the two rotors seemed to be similar, showing NSV before stall inception that resulted in fluid-structure interactions with equal NDs. In addition, the stall cell propagation speeds and the stall inception mechanisms matched. One conspicuity of the OLC rotor is the potentially simultaneously excited ND pattern, as indicated by the measurement data. This phenomenon did not seem to be the reason for reaching the stability limit at higher reduced mass flows as the aerodynamic stability limit was reached. Consequently, the reason for this might be attributed to the high aerodynamic rotor loading, and therefore resulting in a flow breakdown. To clarify the phenomenon of multiple NDs, further investigations of other SG and WPT sensor combinations are crucial. As indicated by Möller et al. [15] and Stapelfeldt and Brandstetter [16], this phenomenon should also be investigated considering flutter criteria.
Finally, this work might still contribute to a better understanding of highly-loaded axial transonic compressor stages with respect to aerodynamic and aeroelastic behavior and encourage the usage of tandem stators.
Author Contributions
Conceptualization, J.F. and H.M.; Formal analysis, J.F. and A.S.; Funding acquisition, H.-P.S. and B.B.; Investigation, J.F., D.F., and F.K.; Methodology, J.F.; Project administration, H.-P.S.; Supervision, H.-P.S.; Visualization, J.F. and A.S.; Writing—original draft, J.F.; Writing—review and editing, J.F., D.F., F.K., A.S., and B.B. All authors have read and agreed to the published version of the manuscript.
Funding
This research was funded by Federal Ministry for Economic Affairs and Energy (BMWi) and Rolls-Royce Deutschland Ltd. & Co KG in the framework of the AG-Turbo project COOREFlex-turbo 1.2.6b (FKZ: 03ET7071L and 03ET7070G). The authors gratefully acknowledge the financial support and thank Rolls-Royce Deutschland for the permission to publish this paper.

Data Availability Statement
The data presented in this study are intellectual property of the industry partner Rolls-Royce Deutschland Ltd. & Co KG and, therefore, are restricted from being publicly shared.
Acknowledgments
The technical assistance from and helpful discussions with the TU Darmstadt compressor team are very much appreciated. The authors would also like to thank the compressor aerodynamic group of Rolls-Royce Deutschland Ltd. & Co KG for their continuous support.
Conflicts of Interest
The authors declare no conflict of interest.
Nomenclature
The following nomenclature is used in this manuscript:
| Latin | |
| a | Shock detachment |
| c | Chord length |
| p | Pressure |
| Reduced mass flow | |
| Greek | |
| Flow angle | |
| Difference | |
| Shock angle | |
| Pressure loss coefficient | |
| Efficiency | |
| Pressure ratio | |
| Pressure rise coefficient | |
| Rotational speed | |
| Subscripts | |
| Aerodynamical | |
| Dynamic | |
| Rotor exit | |
| Static quantity | |
| Structural | |
| Stage exit | |
| Stage inlet | |
| Total-to-static | |
| Total quantity | |
| Abbreviations | |
| 1F | First flap blade mode |
| 1T | First torsional blade mode |
| 5HP | Five-hole probe |
| BLISK | Blade-integrated disk |
| DS | Design speed |
| EO | Engine order |
| IM | Intermediate |
| ND | Nodal diameter |
| NS | Near stall |
| NSV | Non-synchronous vibration |
| OLC | Optimized loading compressor |
| PE | Peak efficiency |
| REF | Reference configuration |
| SG | Strain gauge |
| TCD | Transonic Compressor Darmstadt |
| VIGV | Variable inlet guide vane |
| VSV | Variable stator vane |
| WPT | Wall pressure transducer |
References
- Baumgartner, M.; Kameier, F.; Hourmouziadis, J. Non-Engine Order Blade Vibration in a High Pressure Compressor. In Proceedings of the 12th International Symposium on Airbreathing Engines, Melbourne, Australia, September 1995. hal-01353829. [Google Scholar]
- Inoue, M.; Kuroumaru, M.; Tanino, T.; Furukawa, M. Propagation of Multiple Short-Length-Scale Stall Cells in an Axial Compressor Rotor. ASME J. Turbomach. 2000, 122, 45–54. [Google Scholar] [CrossRef]
- Kielb, R.E.; Barter, J.W.; Thomas, J.P.; Hall, K.C. Blade Excitation by Aerodynamic Instabilities—A Compressor Blade Study. In Proceedings of the ASME Turbo Expo 2003, Power for Land, Sea, and Air, Atlanta, GA, USA, 16–19 June 2003. GT2003-38634. [Google Scholar]
- Yamada, K.; Kikuta, H.; Iwakiri, K.-I.; Furukawa, M.; Gunjishima, S. An Explanation for Flow Features of Spike-Type Stall Inception in an Axial Compressor Rotor. ASME J. Turbomach. 2013, 135, 021023. [Google Scholar] [CrossRef]
- Dodds, J.; Vahdati, M. Rotating Stall Observations in a High Speed Compressor Part 1: Experimental Study. ASME J. Turbomach. 2015, 137, 051002. [Google Scholar] [CrossRef]
- Pullan, G.; Young, A.M.; Day, I.J.; Greitzer, E.M.; Spakovszky, Z.S. Origins and Structure of Spike-Type Rotating Stall. ASME J. Turbomach. 2015, 137, 051007. [Google Scholar] [CrossRef]
- Day, I.J. Stall, Surge, and 75 Years of Research. ASME J. Turbomach. 2016, 138, 011001. [Google Scholar] [CrossRef]
- Brandstetter, C.; Jüngst, M.; Schiffer, H.-P. Measurements of Radial Vortices, Spill Forward, and Vortex Breakdown in a Transonic Compressor. ASME J. Turbomach. 2018, 140, 061004. [Google Scholar] [CrossRef]
- Jüngst, M. The transonic compressor with non-uniform tip clearance: Effects on aerodynamics and aeroelasticity. Ph.D. Thesis, Technical University of Darmstadt, Darmstadt, Germany, 2019. [Google Scholar]
- Möller, D.; Schiffer, H.-P. On the Mechanism of Spike Stall Inception and Near Stall Non-Synchronous Vibration in an Axial Compressor. In Proceedings of the ASME Turbo Expo 2020: Turbomachinery Technical Conference and Exposition, Virtual Conference, London, UK, 22–26 June 2020. GT2020-14711. [Google Scholar]
- Foret, J.; Franke, D.; Klausmann, F.; Schiffer, H.-P.; Becker, B.; Müller, H. Experimental Investigation of a Transonic Compressor with Variable Stator Vanes in Tandem Arrangement. In Proceedings of the Global Power and Propulsion Society, Virtual Conference, Chania, Crete, 7–9 September 2020. GPPS-CH-2020-0079. [Google Scholar]
- Passrucker, H.; Engber, M.; Kablitz, S.; Hennecke, D.K. The Effect of Forward Sweep in a Transonic Compressor Rotor. Proc. Inst. Mech. Eng. Part A J. Power Energy 2003, 217, 357–365. [Google Scholar] [CrossRef]
- Hertel, C.; Bode, C.; Kožulović, D.; Schneider, T. Investigations on Aerodynamic Loading Limits of Subsonic Compressor Tandem Cascades: Midspan Flow. In Proceedings of the ASME 2013 International Mechanical Engineering Congress and Exposition, Volume 1: Advances in Aerodynamics, San Diego, CA, USA, 15–21 November 2013. V001T01A041. [Google Scholar] [CrossRef]
- Müller, L.; Kožulović, D.; Wulff, D.; Fischer, S.; Stark, U. High Turning Compressor Tandem Cascade for High Subsonic Flows—Part 2: Numerical and Experimental Investigations. In Proceedings of the 47th AIAA/ASME/SAE/ASEE Joint Propulsion Conference & Exhibit, San Diego, CA, USA, 31 July–3 August 2011. AIAA 2011–5602. [Google Scholar] [CrossRef]
- Möller, D.; Jüngst, M.; Holzinger, F.; Brandstetter, C.; Schiffer, H.-P.; Leichtfuß, S. Mechanism of Nonsynchronous Blade Vibration in a Transonic Compressor Rig. ASME J. Turbomach. 2017, 139, 011002. [Google Scholar] [CrossRef]
- Stapelfeldt, S.; Brandstetter, C. Non-synchronous vibration in axial compressors: Lock-in mechanism and semi-analytical model. J. Sound Vib. 2020, 488, 115649. [Google Scholar] [CrossRef]
Publisher’s Note: MDPI stays neutral with regard to jurisdictional claims in published maps and institutional affiliations. |
© 2021 by the authors. Licensee MDPI, Basel, Switzerland. This article is an open access article distributed under the terms and conditions of the Creative Commons Attribution (CC BY-NC-ND) license (https://creativecommons.org/licenses/by-nc-nd/4.0/).