Based on the comprehensive measurements and compulsory simulations, global trends can be derived, considering steady and unsteady aerodynamics as well as the aeroelastic behavior.
3.1. Steady Aerodynamics
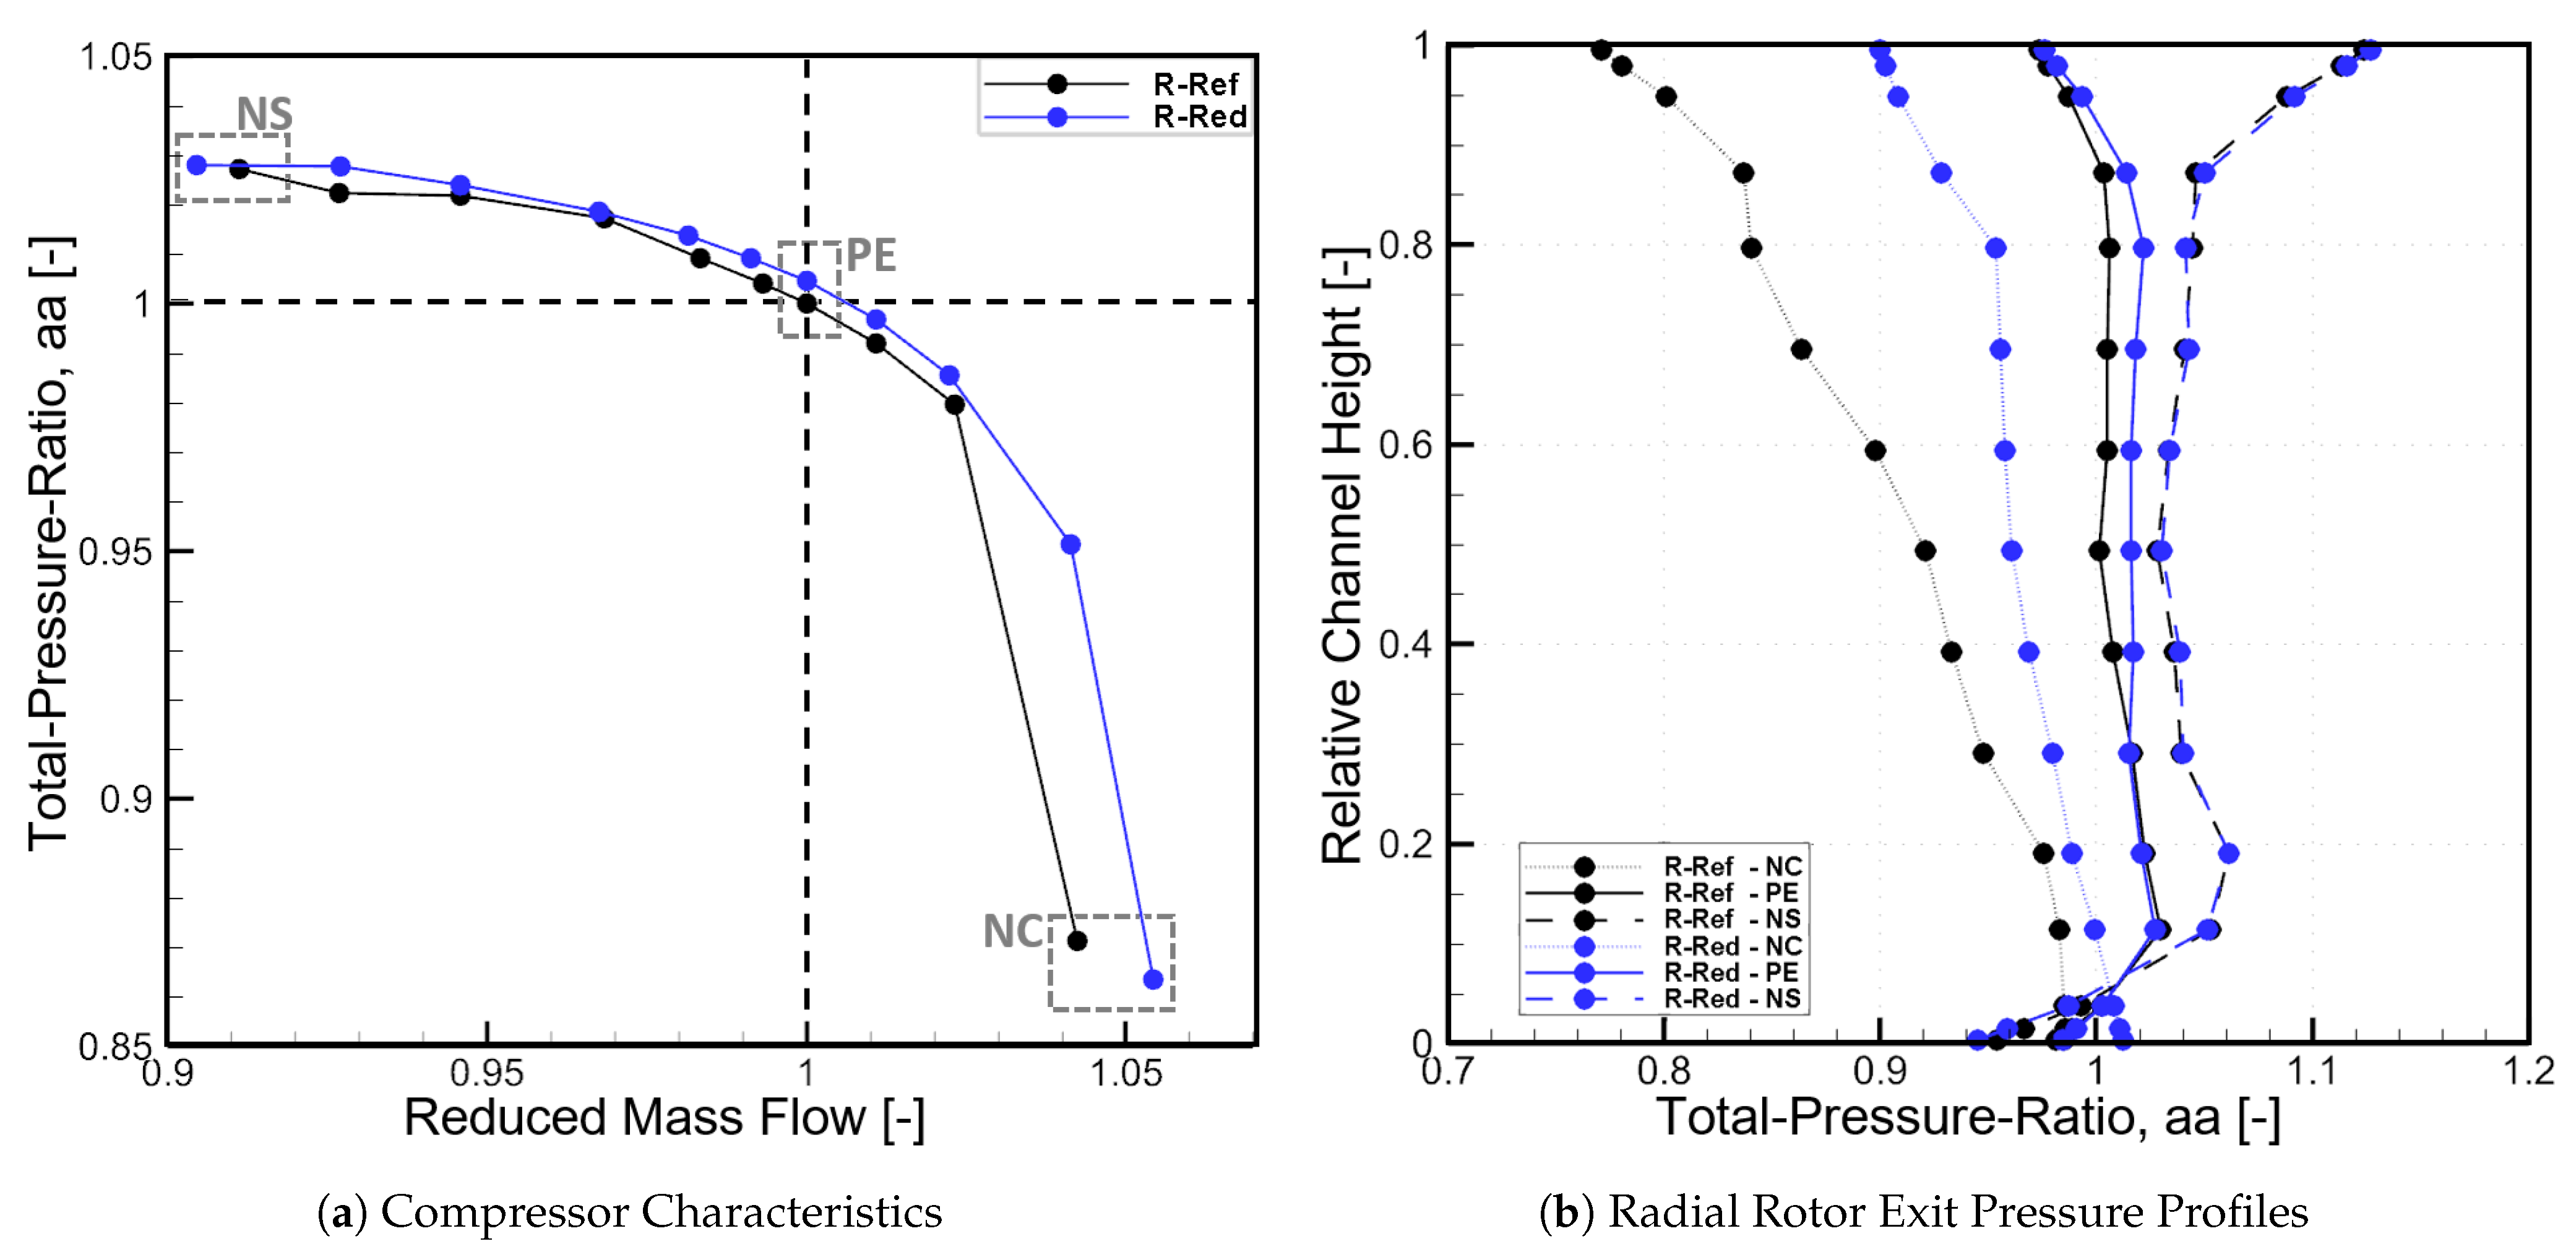
In order to characterize the steady aerodynamics and performance of the compressor stage configuration, the compressor map for design speed (N100) and nominal VIGV setting is shown in
Figure 2a. Compared to rotor R-Ref, the compressor stage with R-Red shows a similar characteristic with small variations. At near choke (NC), higher mass flows can be achieved for R-Red. As a result of the reduced blade count, mass flow can be further increased until blockage of the cross section is evoked by sonic flow within the narrowest section of the rotor. Additionally, R-Red shows a sightly increased total pressure ratio for the entire speed line as well as comparable mass flow and total pressure ratio at the last stable steady operating point (NS). To evaluate the rotor-only aerodynamics, measurements within the rotor exit plane were carried out. Based on the stator leading edge instrumentation, the radial profile of the total pressure ratio with respect to the relative channel height was derived and is shown in
Figure 2b for near choke, peak efficiency (PE) and near stall operating conditions at design speed (compare
Figure 2a). The total pressure ratio of R-Red is increased for near choke and peak efficiency, compared to R-Ref. This proves that the pressure rise is performed by the rotor itself and not due to a better interaction with the stator. Furthermore, the pressure profile at the last stable steady operating conditions (NS) shows a uniform overlap with R-Ref, hence similar radially distributed loading.
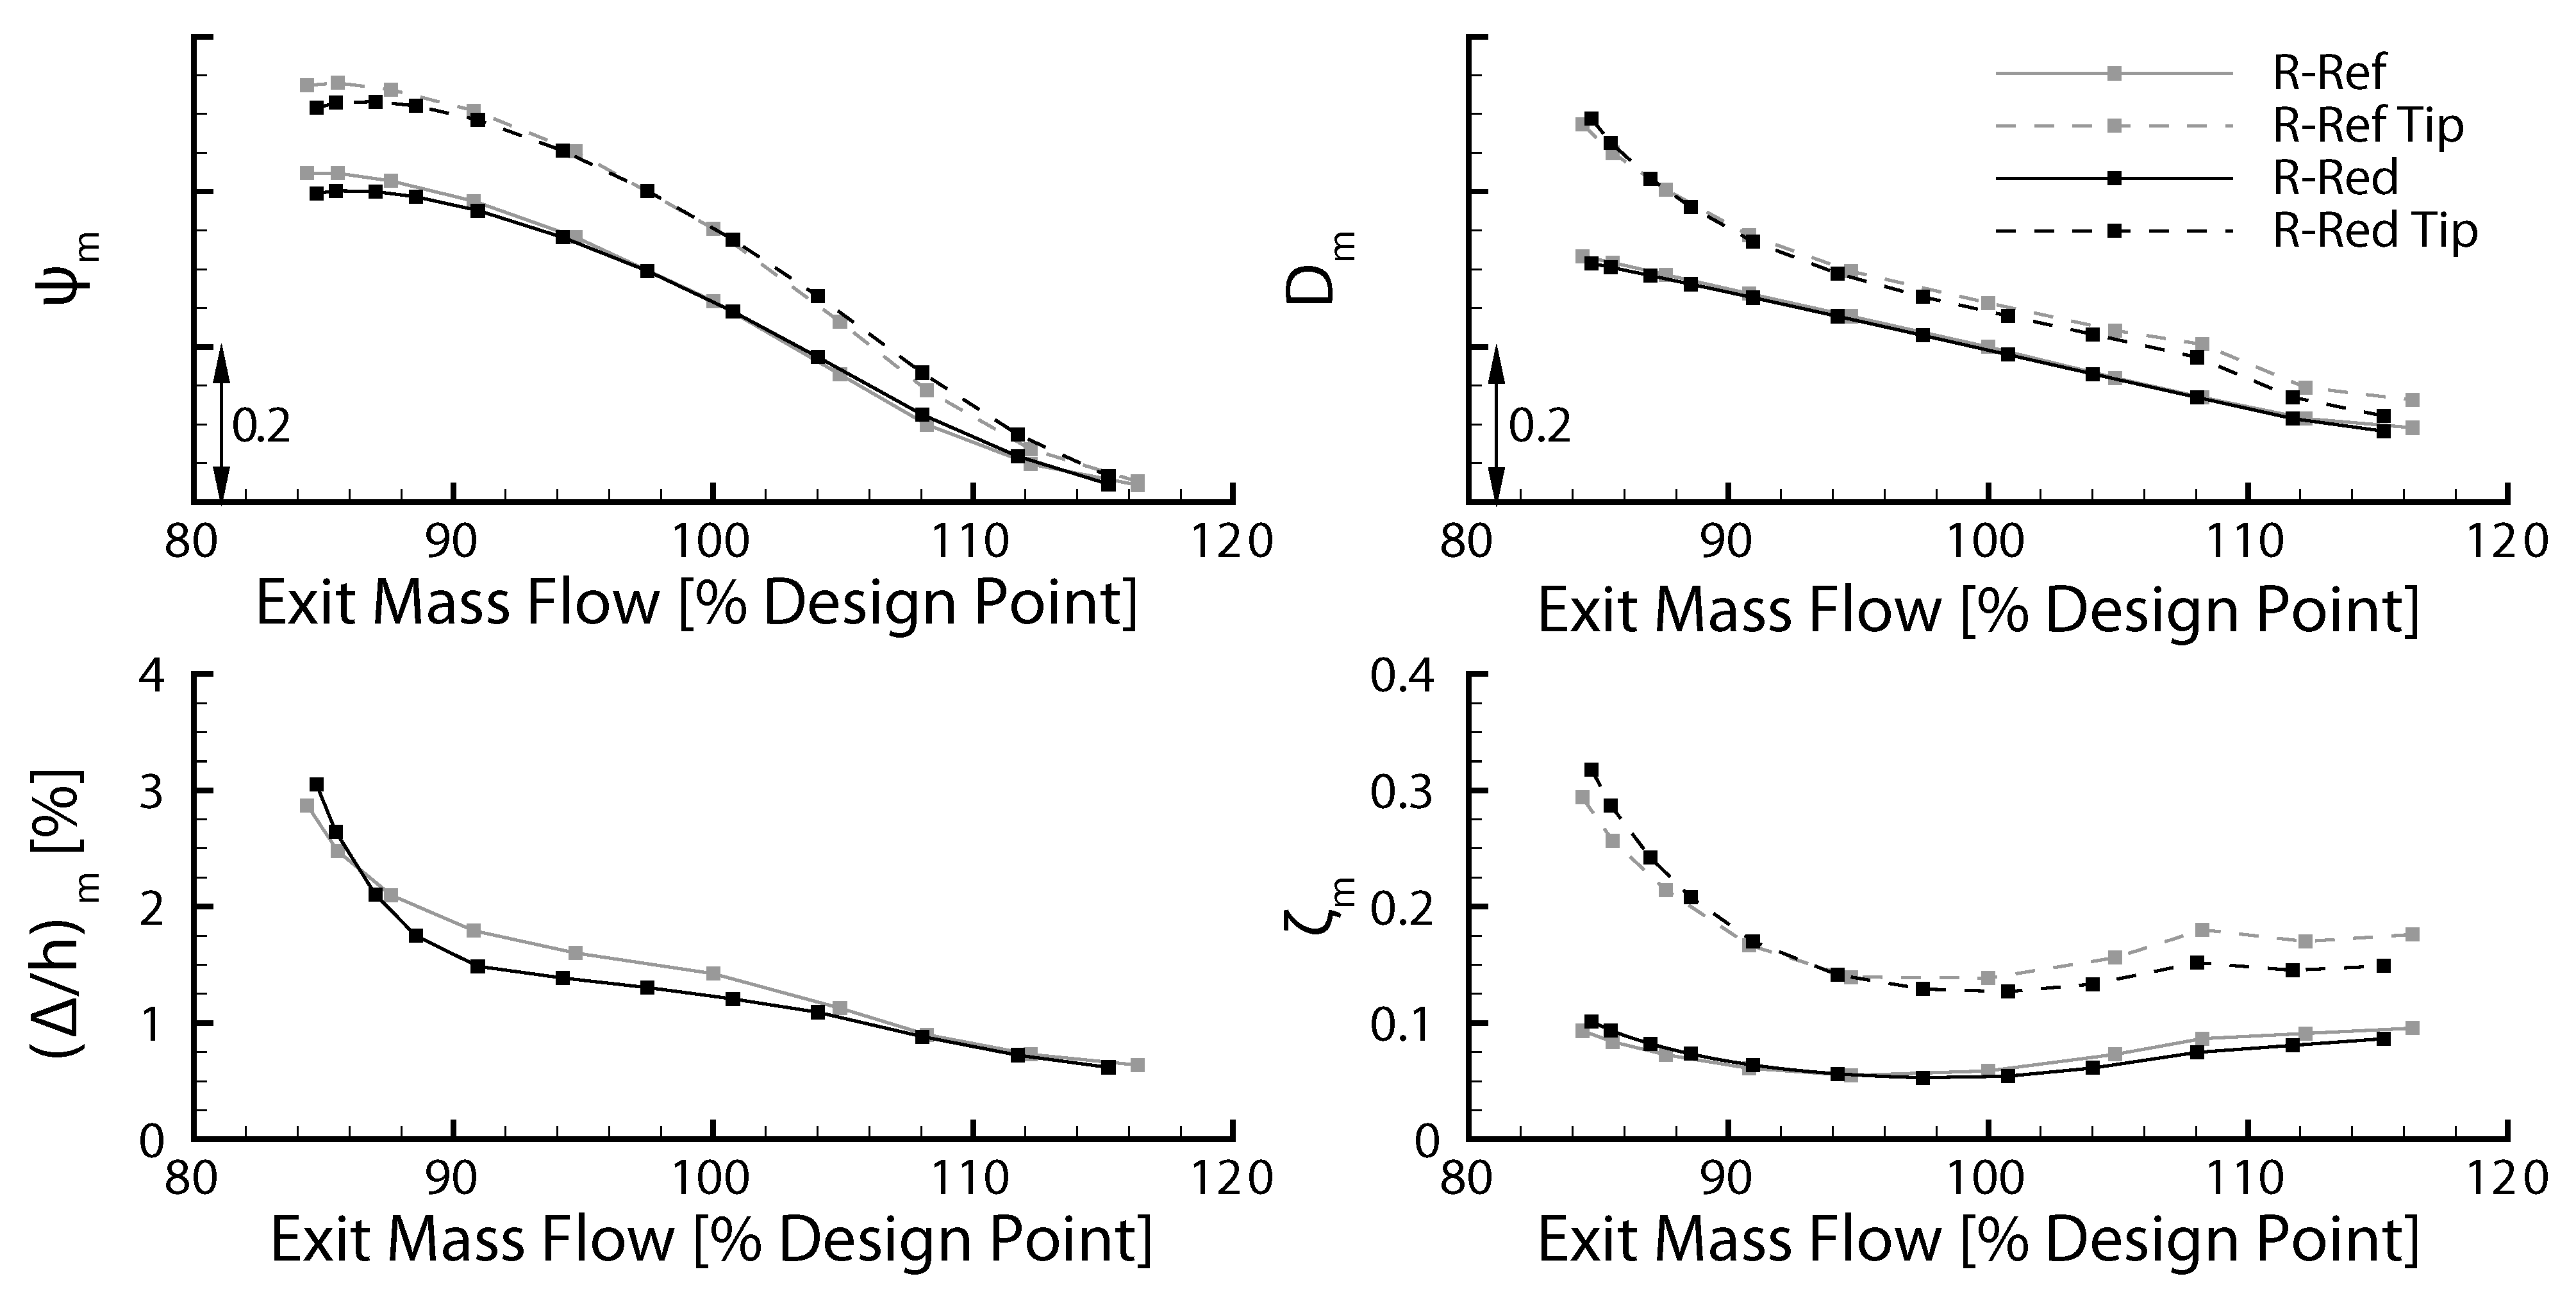
In order to compare the aerodynamics of the rotors in more detail, specific evaluation parameters are derived from the simulations, as shown in
Figure 3. Solid lines illustrate mean values of the rotor and dashed lines the mean at blade tip (upper 20% channel height) for different throttling conditions at design speed. In general, a strong similarity of the rotors is visible. The pressure rise coefficient
is plotted in the upper left graph, showing an almost equal behavior for both rotors with small difference in the vicinity to stall. The increased pressure rise at the blade tip is evident as well (compare
Figure 2). Throttling the compressor leads to higher diffusion within the rotor. As shown in the upper right graph, the diffusion is similar for both rotors and increases almost linearly, with over-proportional increase at the tip in the vicinity to stall. This can be traced to the rising blockage at blade tip, as shown in the lower left graph. For R-Red with its larger rotor passage, the slope is steeper in the vicinity to stall, even though the overall blockage is similar. The blockage causes high losses in the blade tip region, especially close to stall, as illustrated in the lower right graph. Due to radial flow redistribution lower channel heights are less loaded, resulting in lower averaged losses for the entire blade. Overall, the aerodynamic behavior is very similar along the stable operating range. Despite the varying blade count, similar flow effects as well as resulting blockage and losses in the blade tip region occur.
3.2. Unsteady Aerodynamics
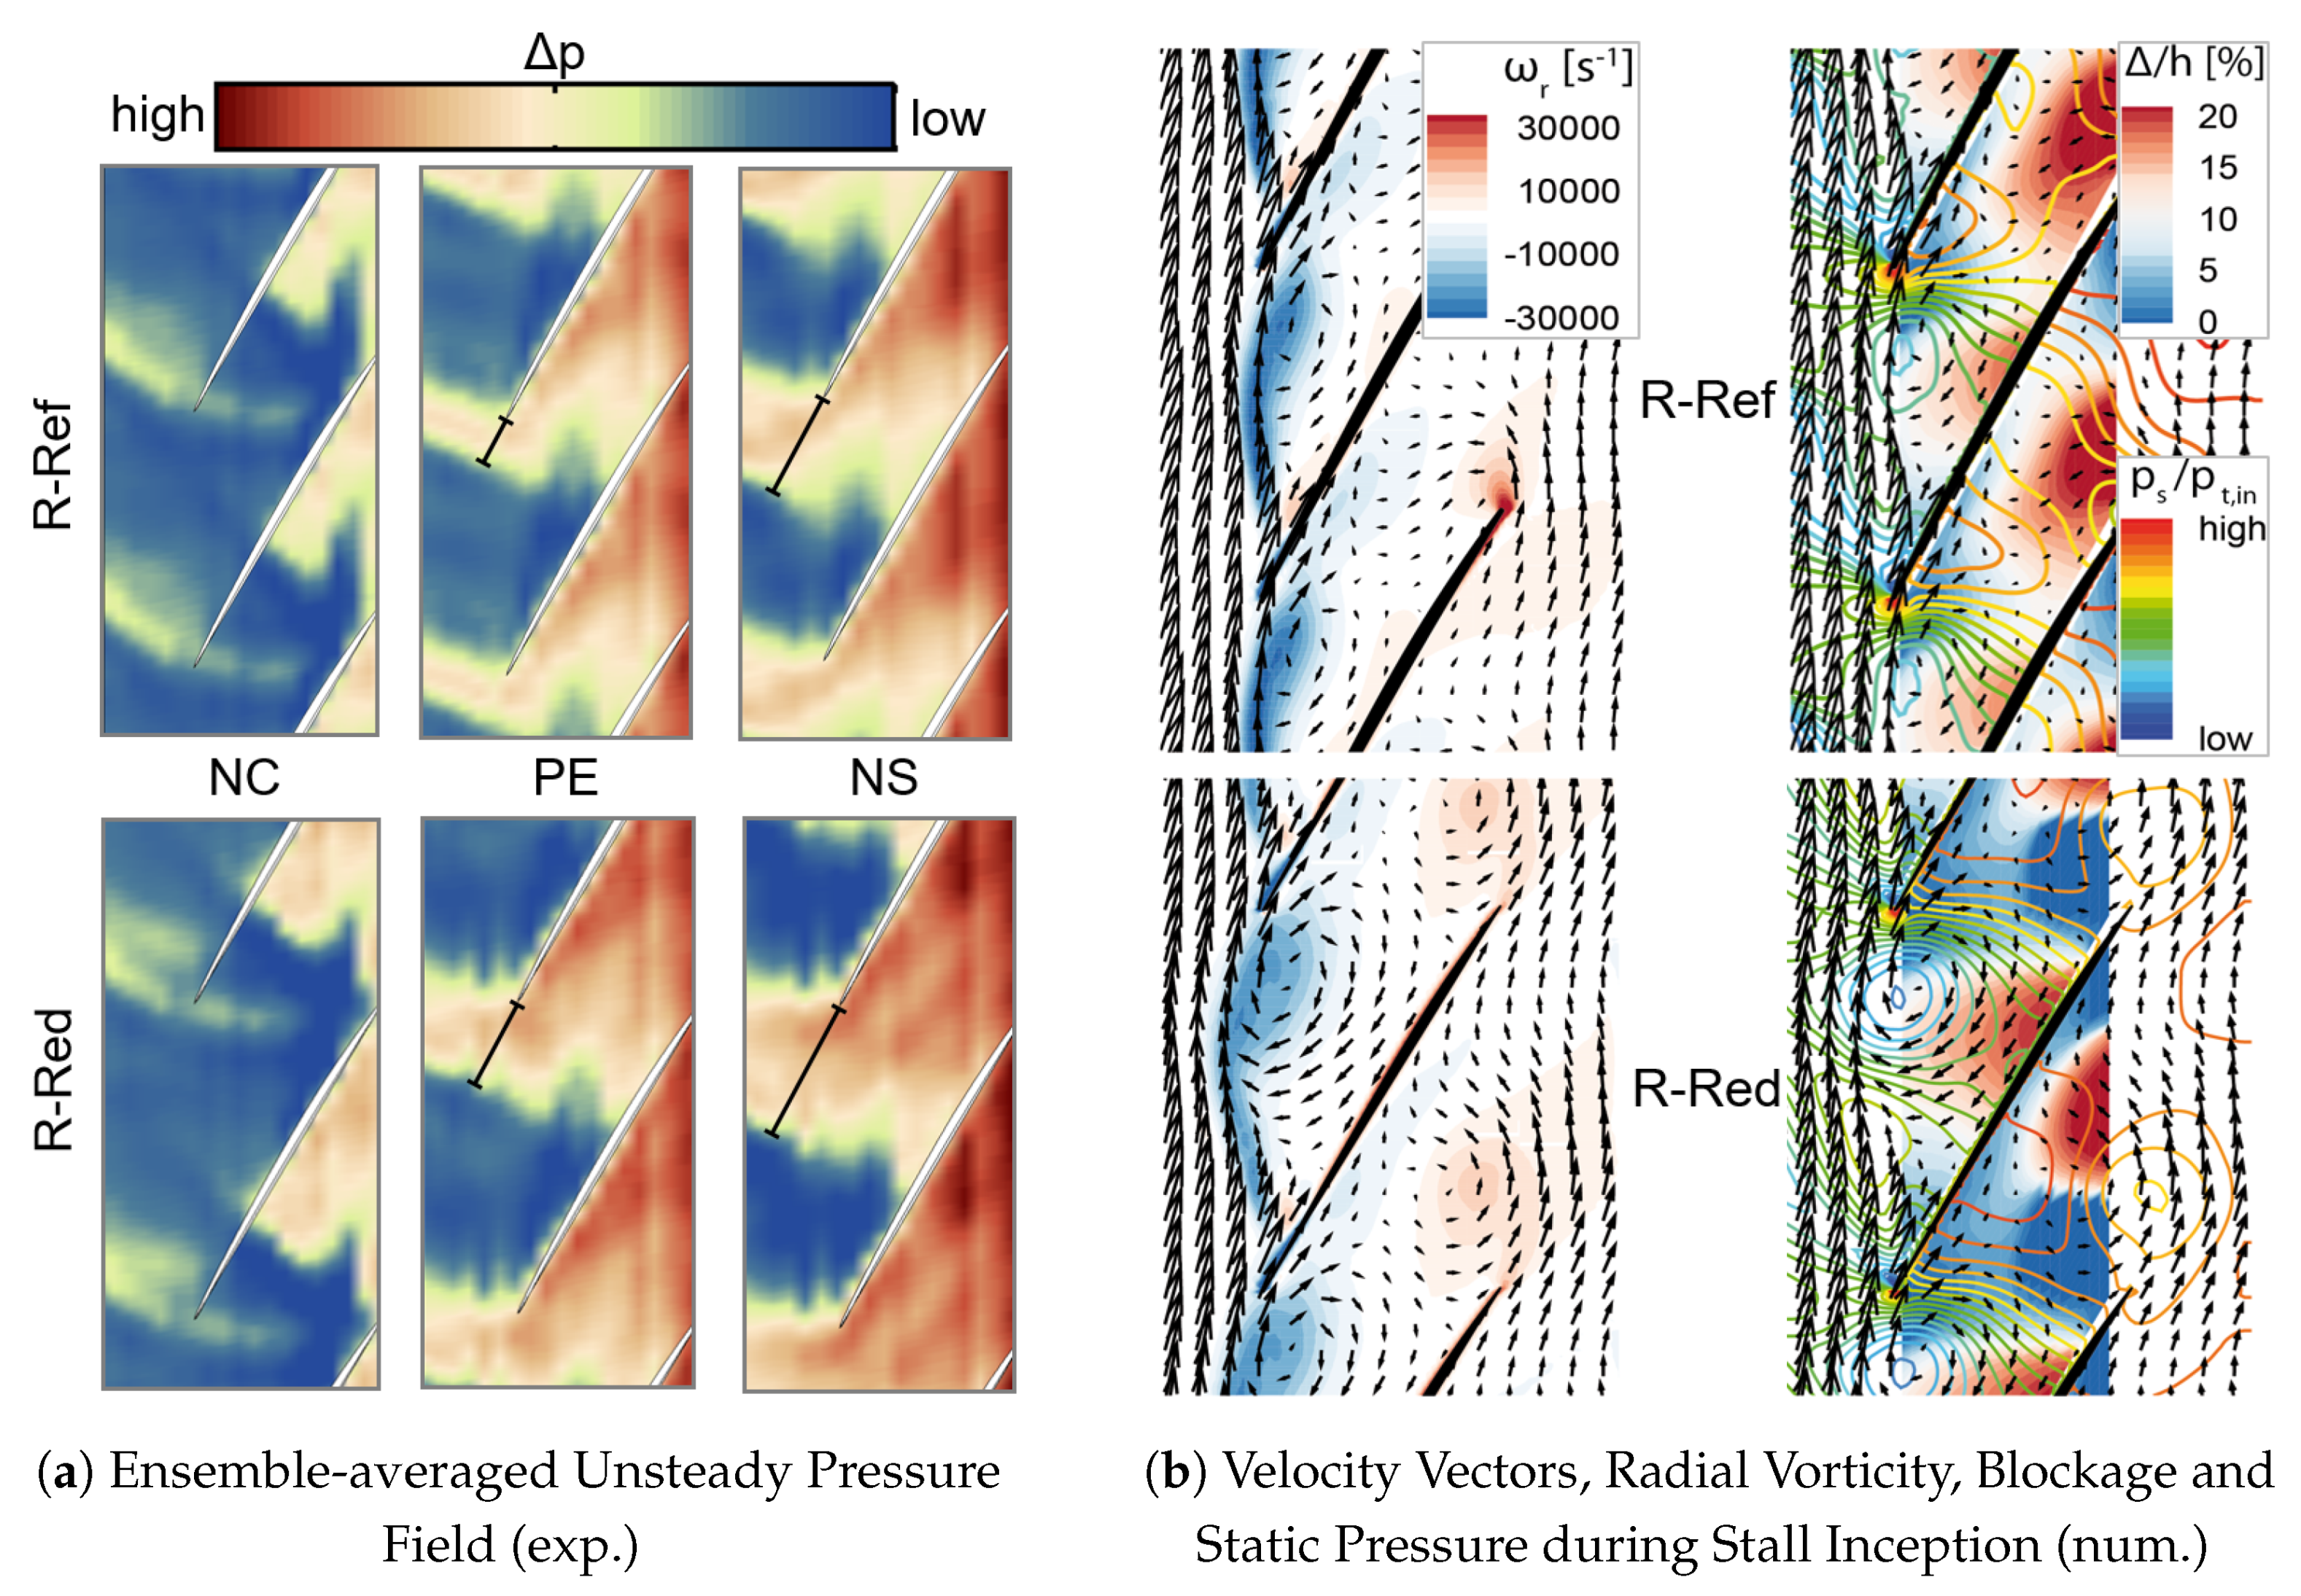
The unsteady wall pressure at blade tip is used to analyze aerodynamic loading, secondary flow phenomena and shock position. Therefore, different operation points along the design speed characteristic are shown for both rotor configurations in
Figure 4a. As expected, the blade loading increases and thus the shock detaches further from the blade leading edge during throttling at constant speed. This behavior can be seen for both configurations, even though it differs between the two rotors. Already at peak efficiency operation, the shock is further detached for R-Red. This can be explained by the larger blade pitch due to the reduced blade count and operating conditions with similar pressure rise, hence increased aerodynamic loading of the individual blades. This results in increased static pressure gradients within the passage and potentially in higher suction side peaks in isentropic Mach number.
The rotor tip flow during the initial phase of stall inception is numerically investigated in
Figure 4b. The velocity vectors and radial vorticity show the shear layer between the incoming main flow and blockage within the passage. The periodically fluctuating shear layer results in a formation of radial vortices, which coincide with regions of high negative radial vorticity. This phenomena is evident for both rotors. The fluctuations are associated with the formation of regions with high blockage within the passage, causing propagating high and low pressure spots due to local flow stagnation and acceleration. For further details refer to [
10].
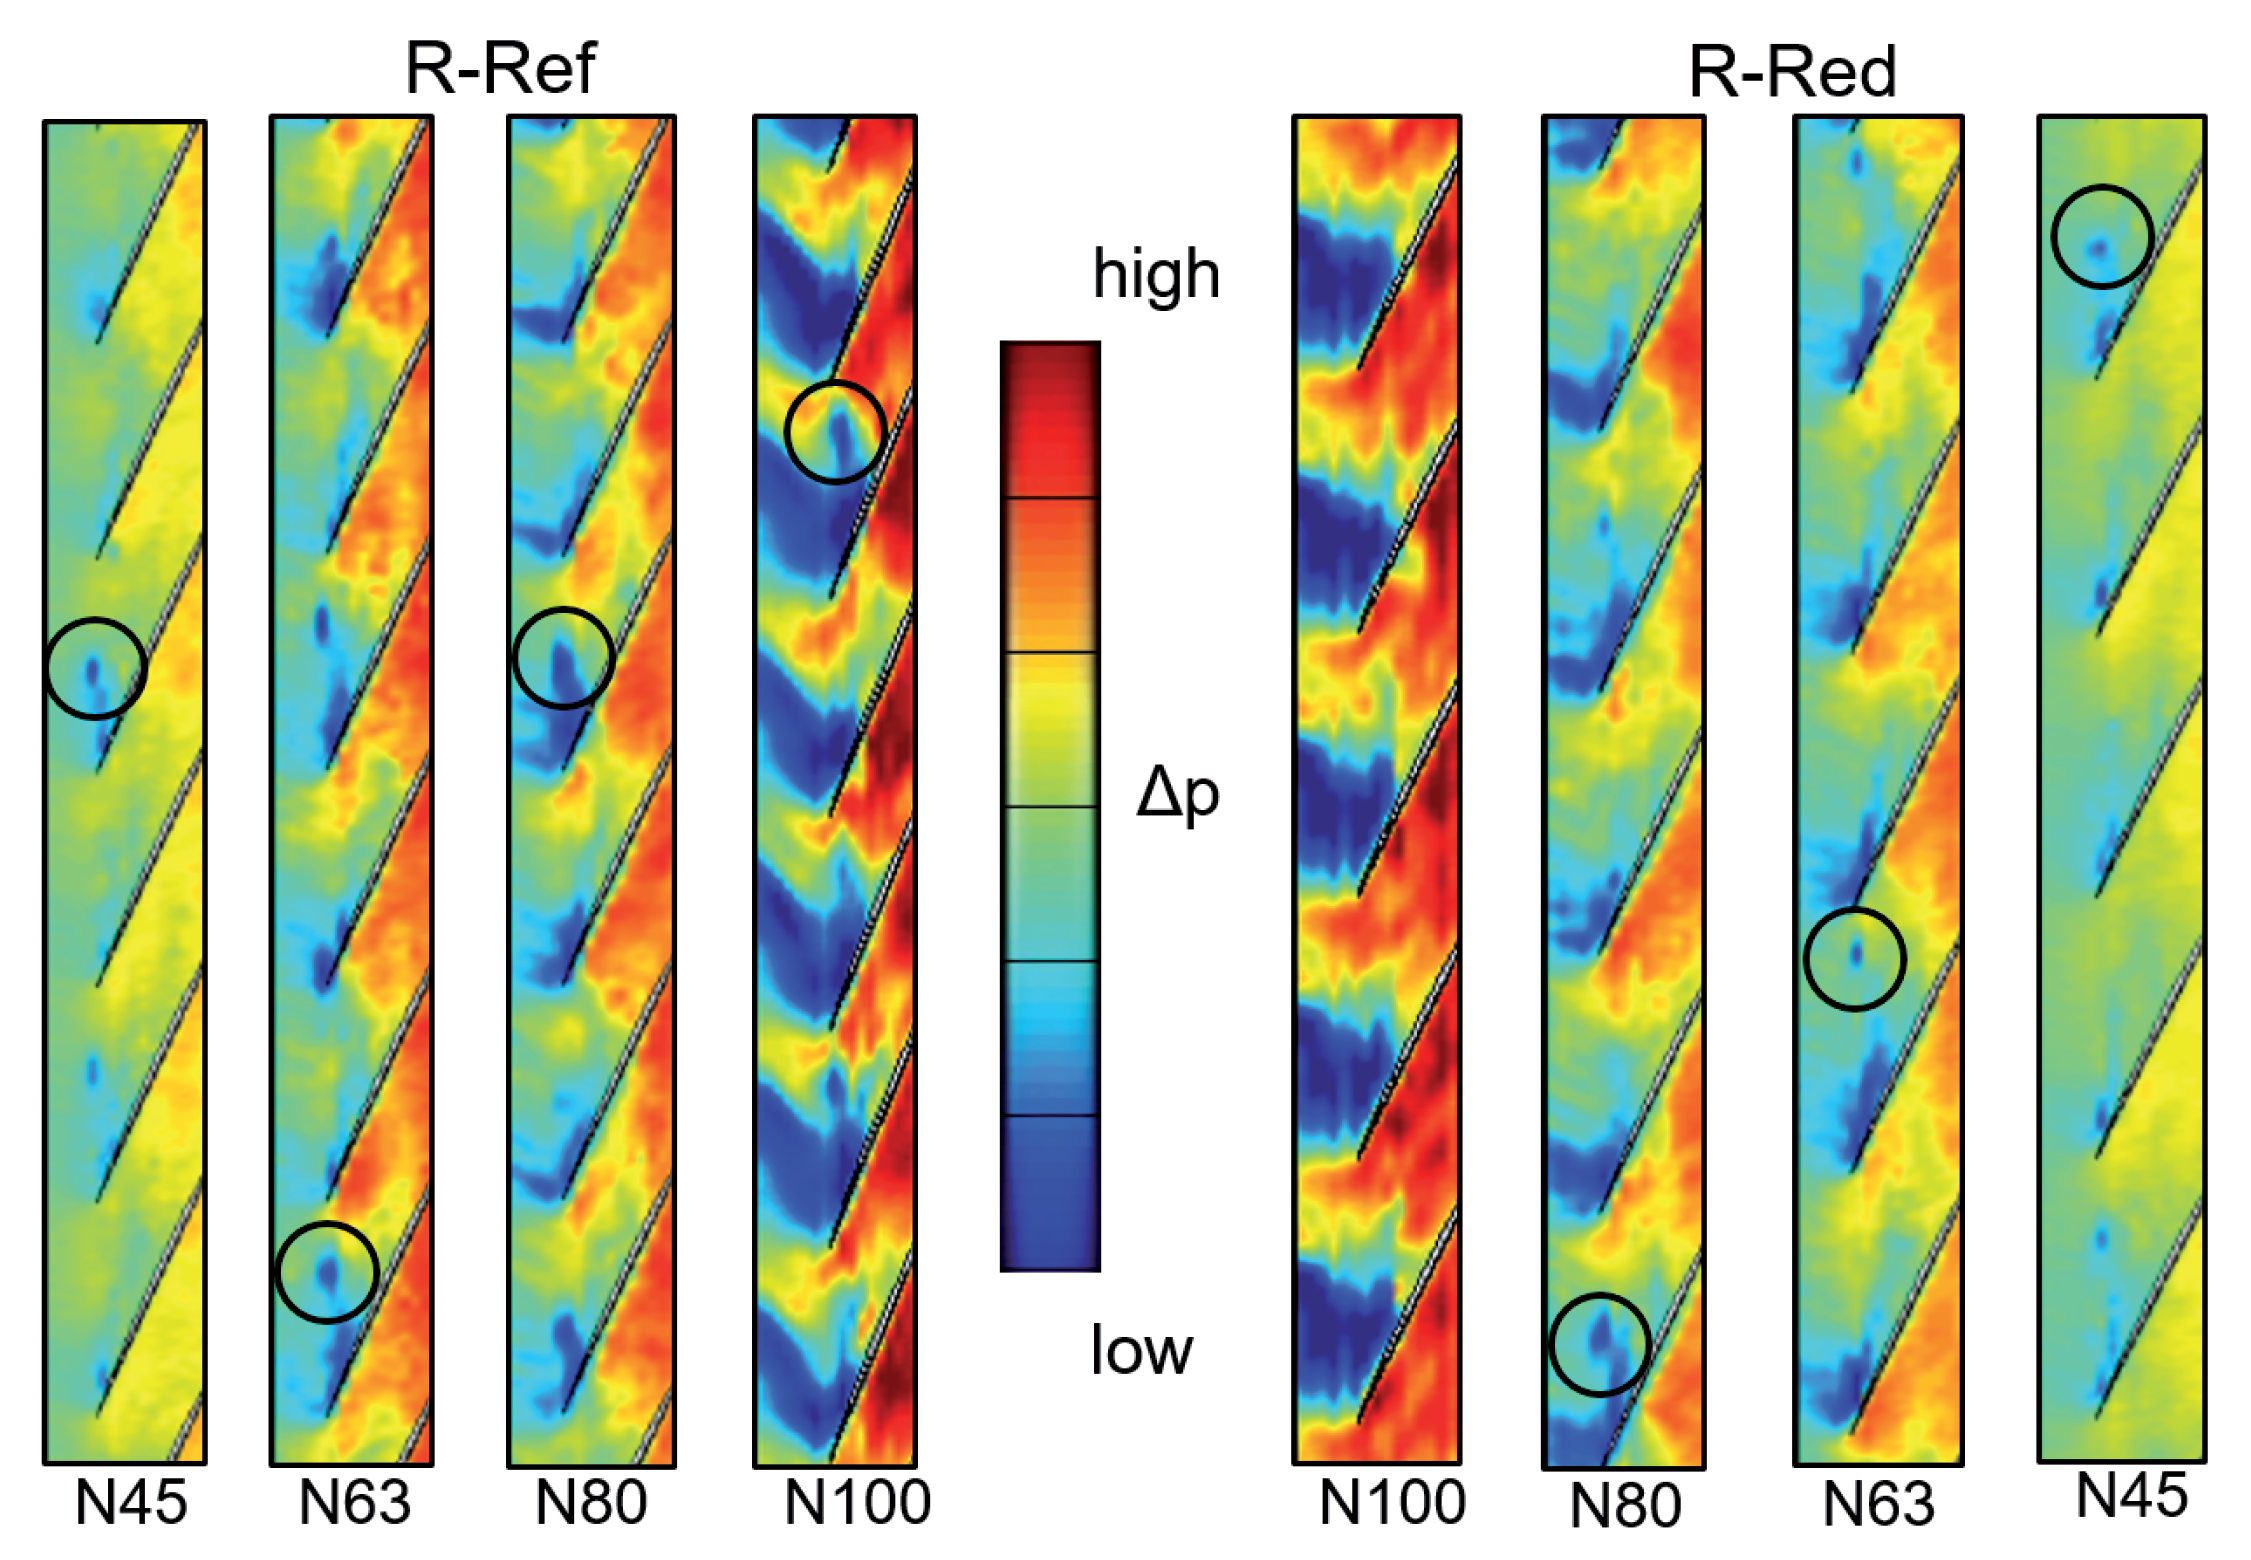
The time-resolved pressure field at blade tip for the last stable steady-state operation point (NS) at different rotational speeds is shown in
Figure 5 for both rotor configurations. As expected, the pressure level rises for increasing rotational speed and the influence of the shock is visible for transonic operation (N100). Furthermore, all speed lines show low-pressure level spots (see circular markers), indicating disturbances like radial vortices (compare [
15]). Those spots vary in count, size, propagation speed and trajectory (compare [
7]), which might also affect the corresponding stability limits.
Comparing rotor R-Ref and R-Red shows differences in the unsteady aerodynamics at the blade tip. For rotor R-Ref, the disturbances, indicated by low-pressure regions, are already larger for steady conditions near the stability limit. In addition, these low pressure regions seem to occur less for rotor R-Red (detailed analysis not shown for brevity).
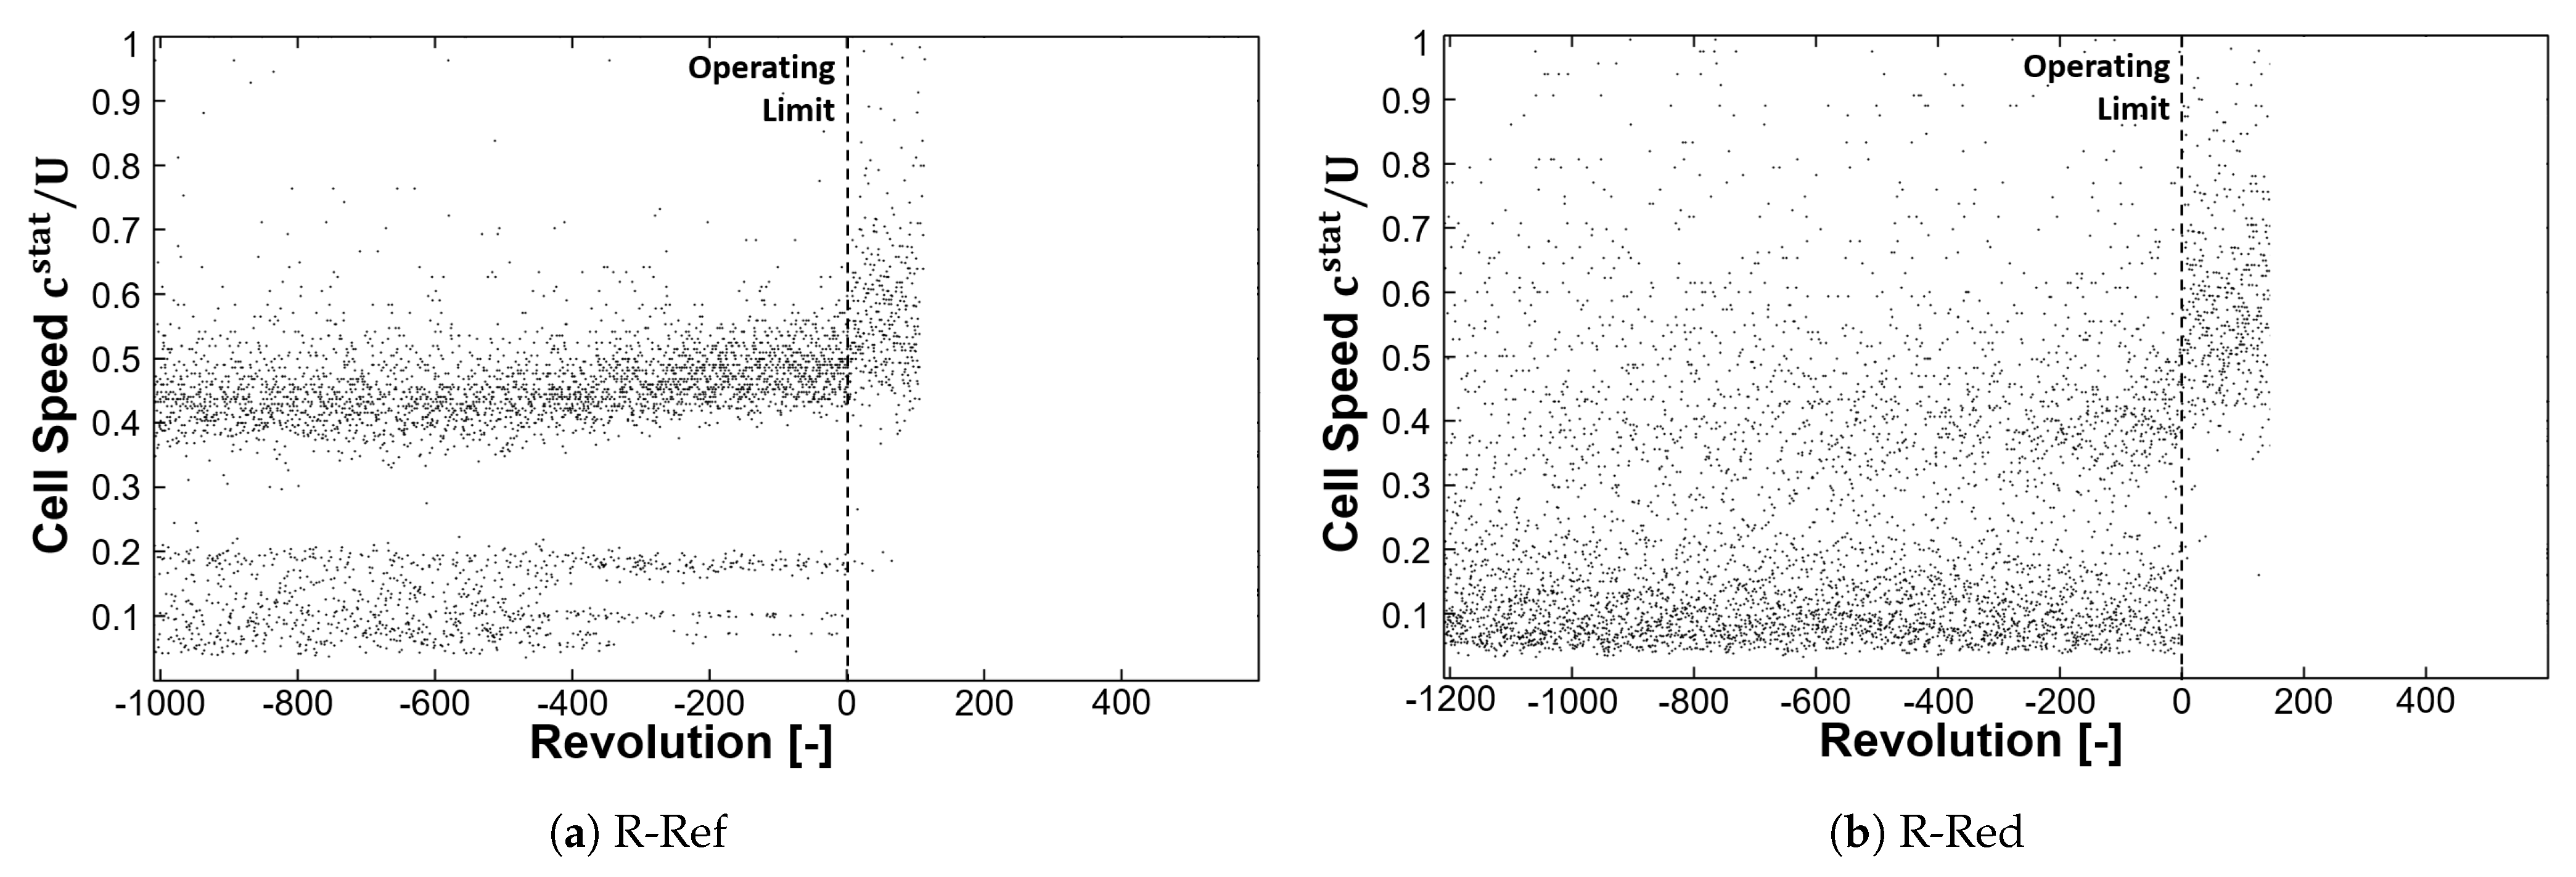
The aerodynamic disturbances propagate around the annulus at a particular propagation speed.
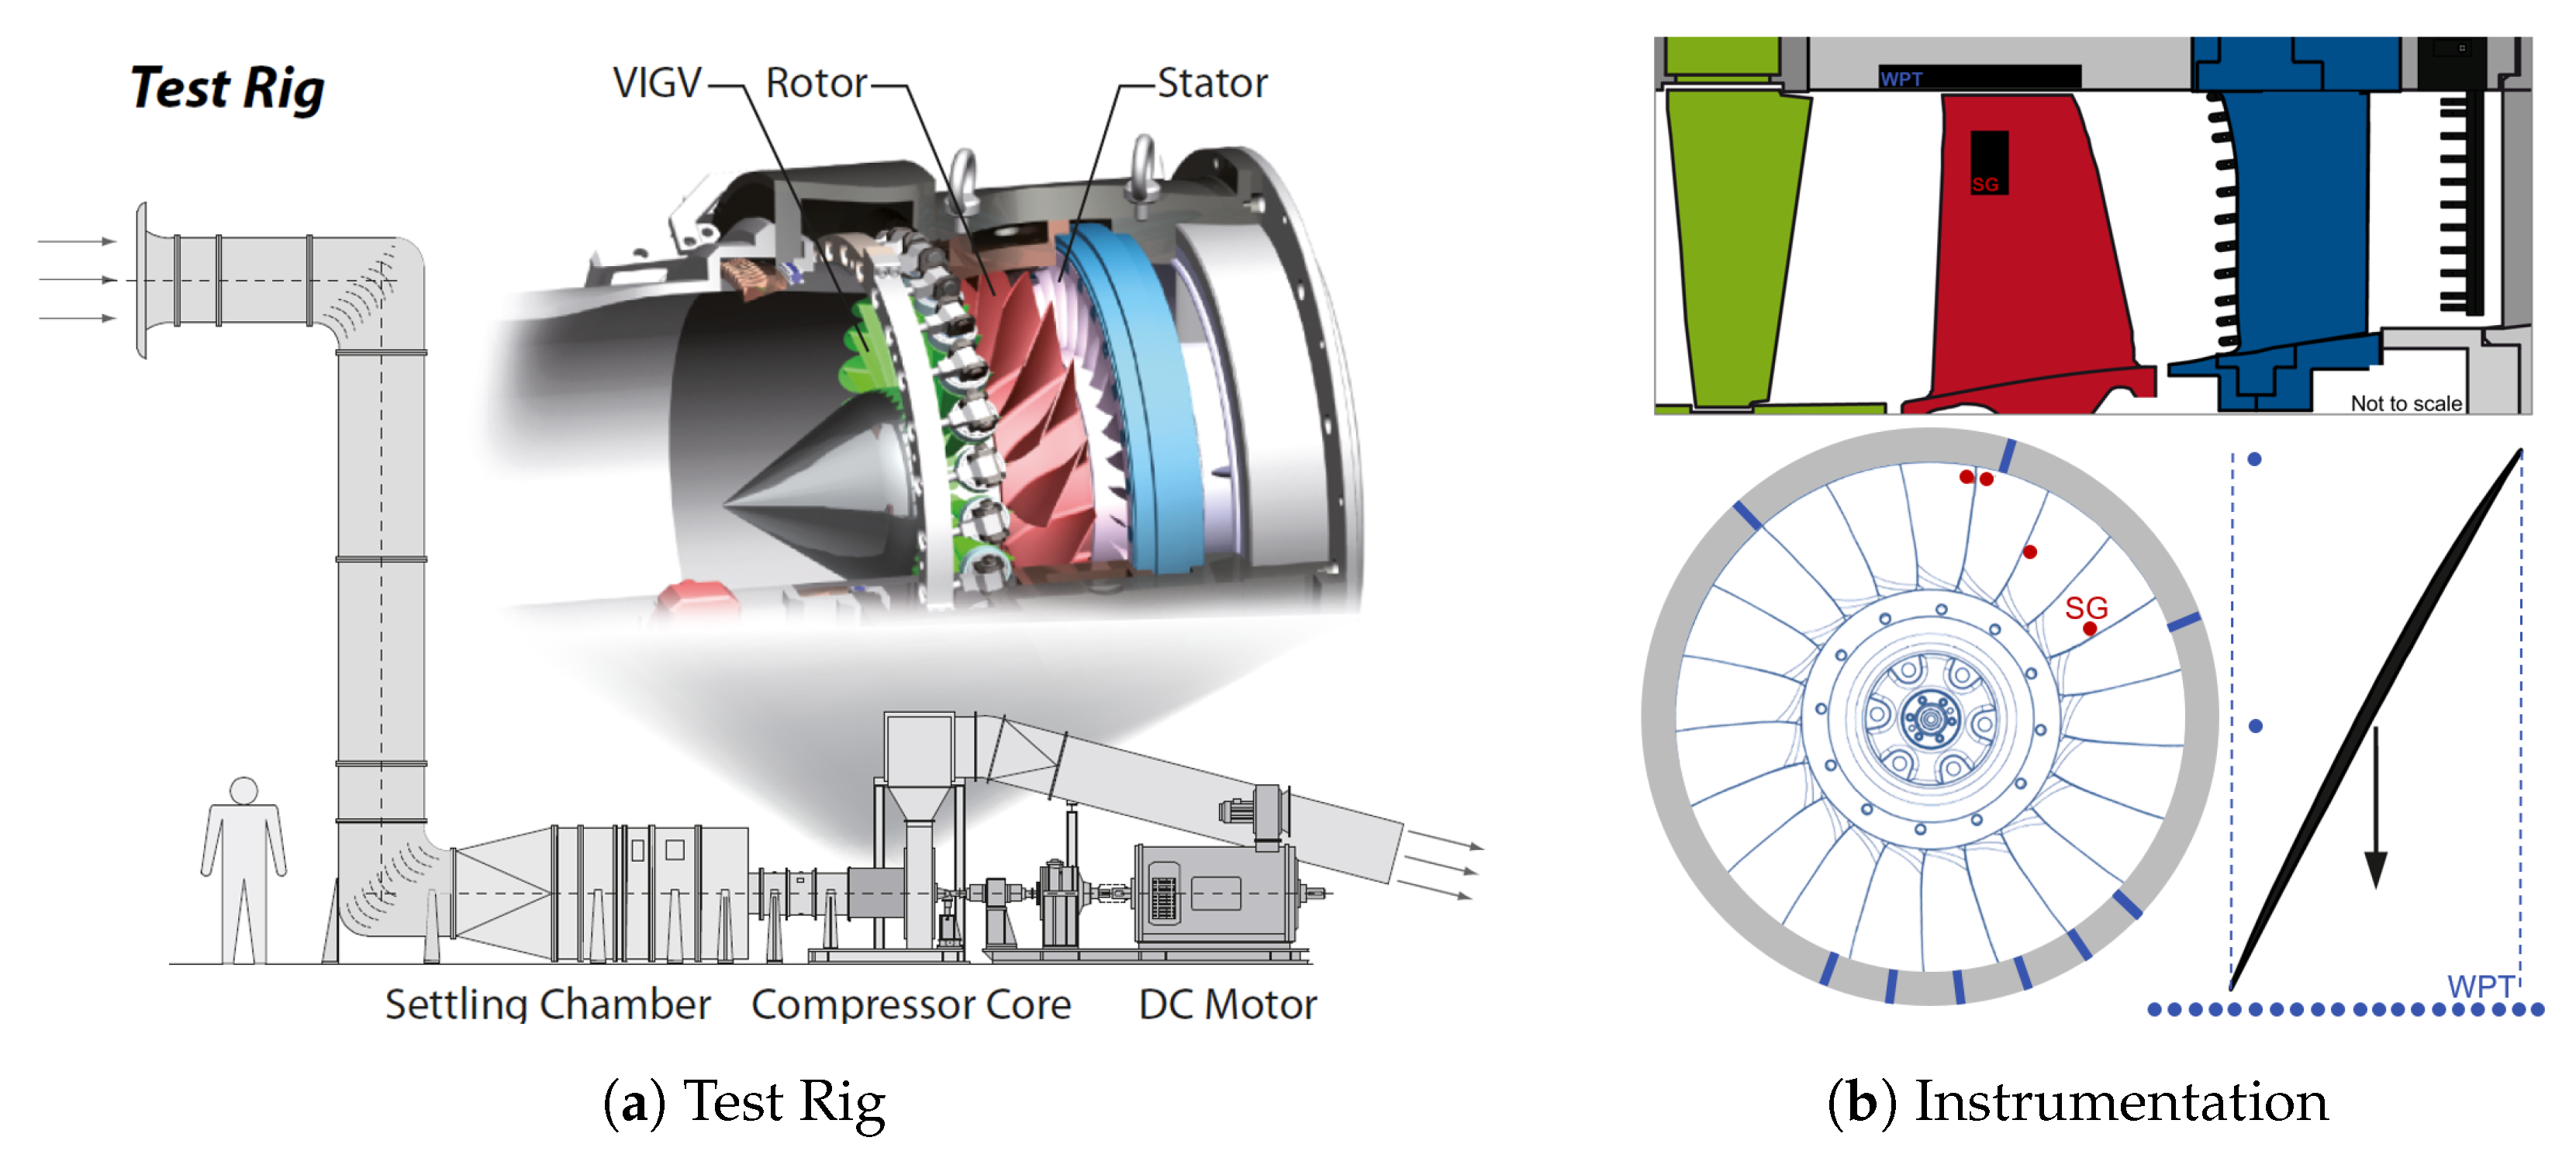
Figure 6 illustrates the propagation speed of aerodynamic disturbances with respect to the rotor tip speed during stall inception at design speed, as determined by the circumferentially distributed WPT sensors close to the blade leading edge (compare
Figure 1). For rotor R-Ref, the cell speed increases from about 42% to almost 50% rotor tip speed. Considering about six disturbances per revolution, an aerodynamic wave number of 13 is established, traveling in opposite direction to rotor speed. For more details refer to [
7]. For R-Red, no distinctive cell speed can be calculated with the circumferential distributed sensors at the leading edge. One reason could be the comparable small cells and another the trajectory within the rotor passages.
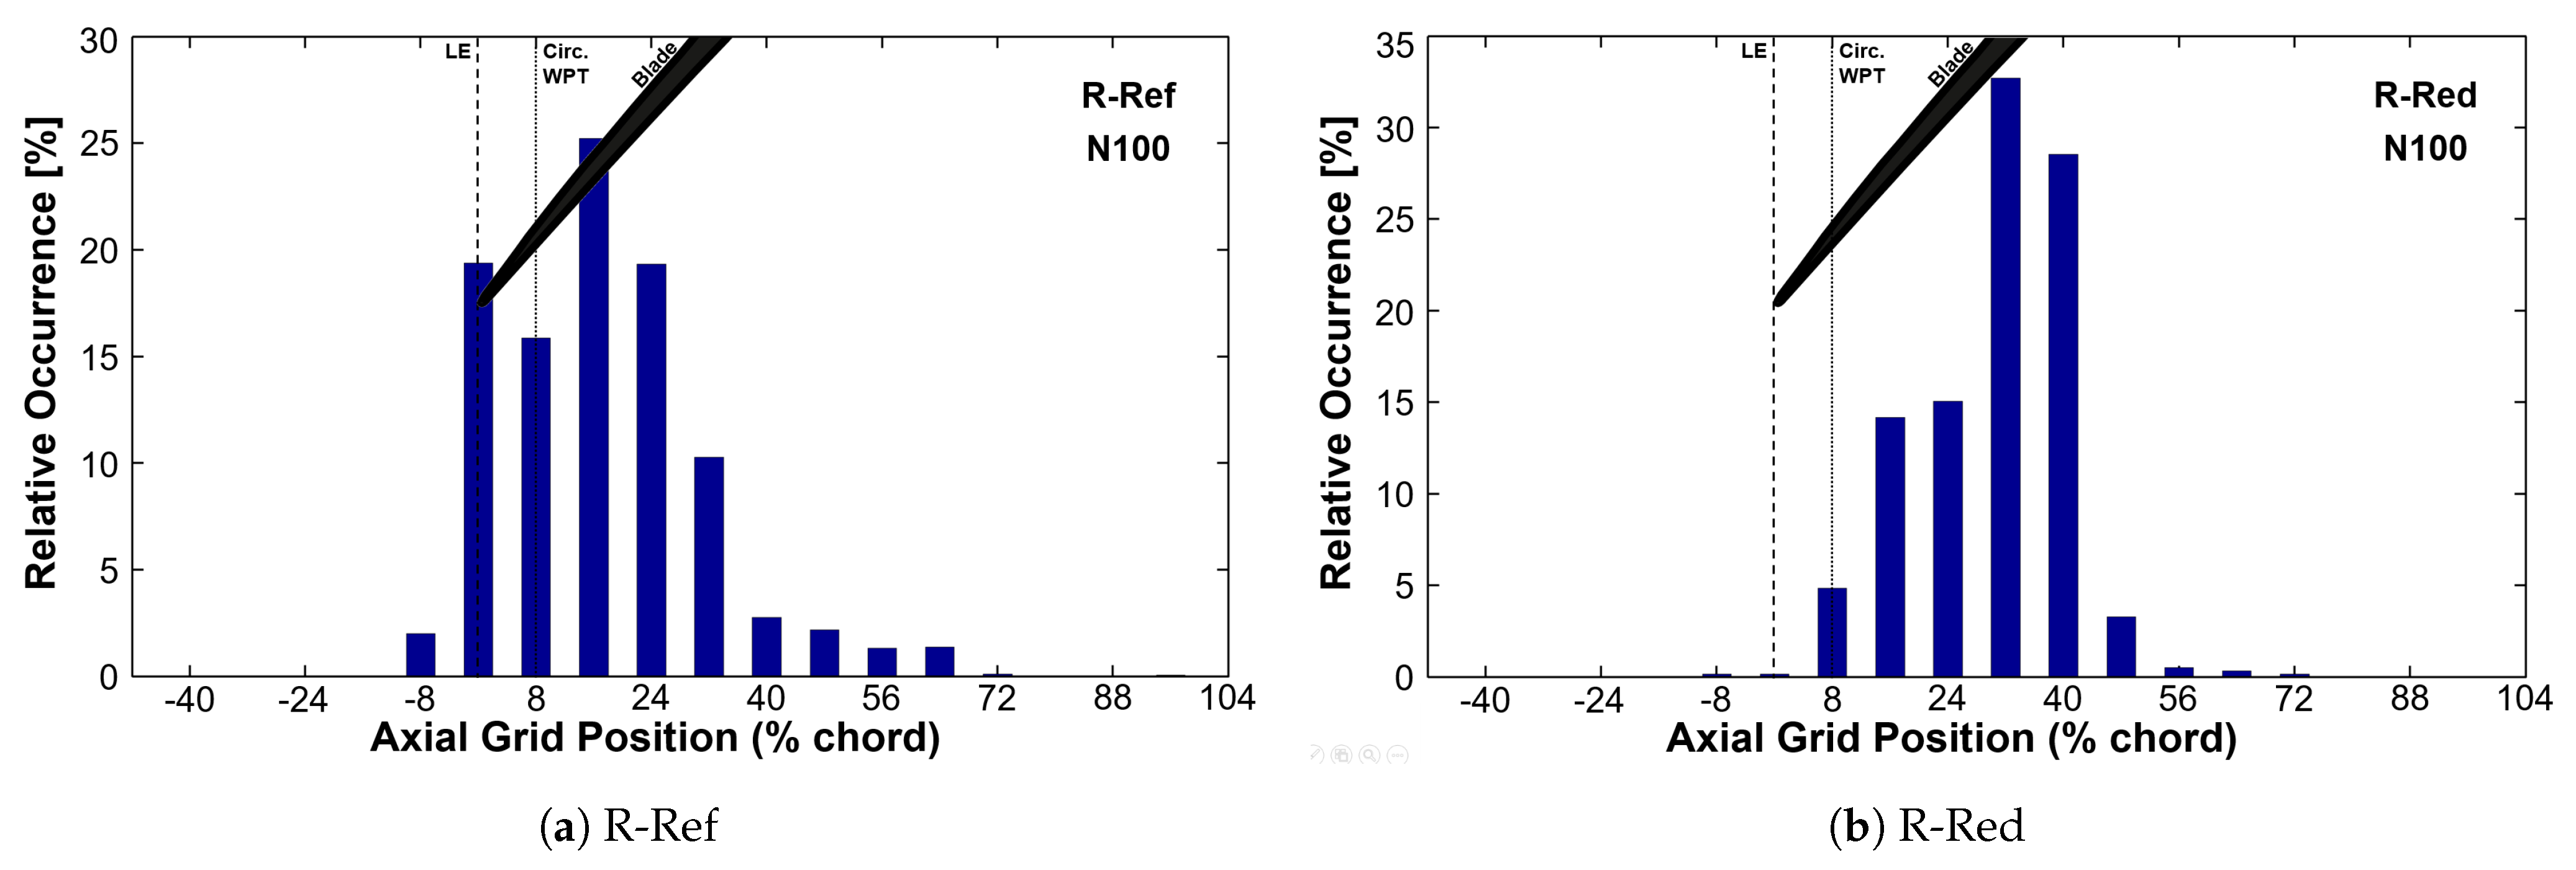
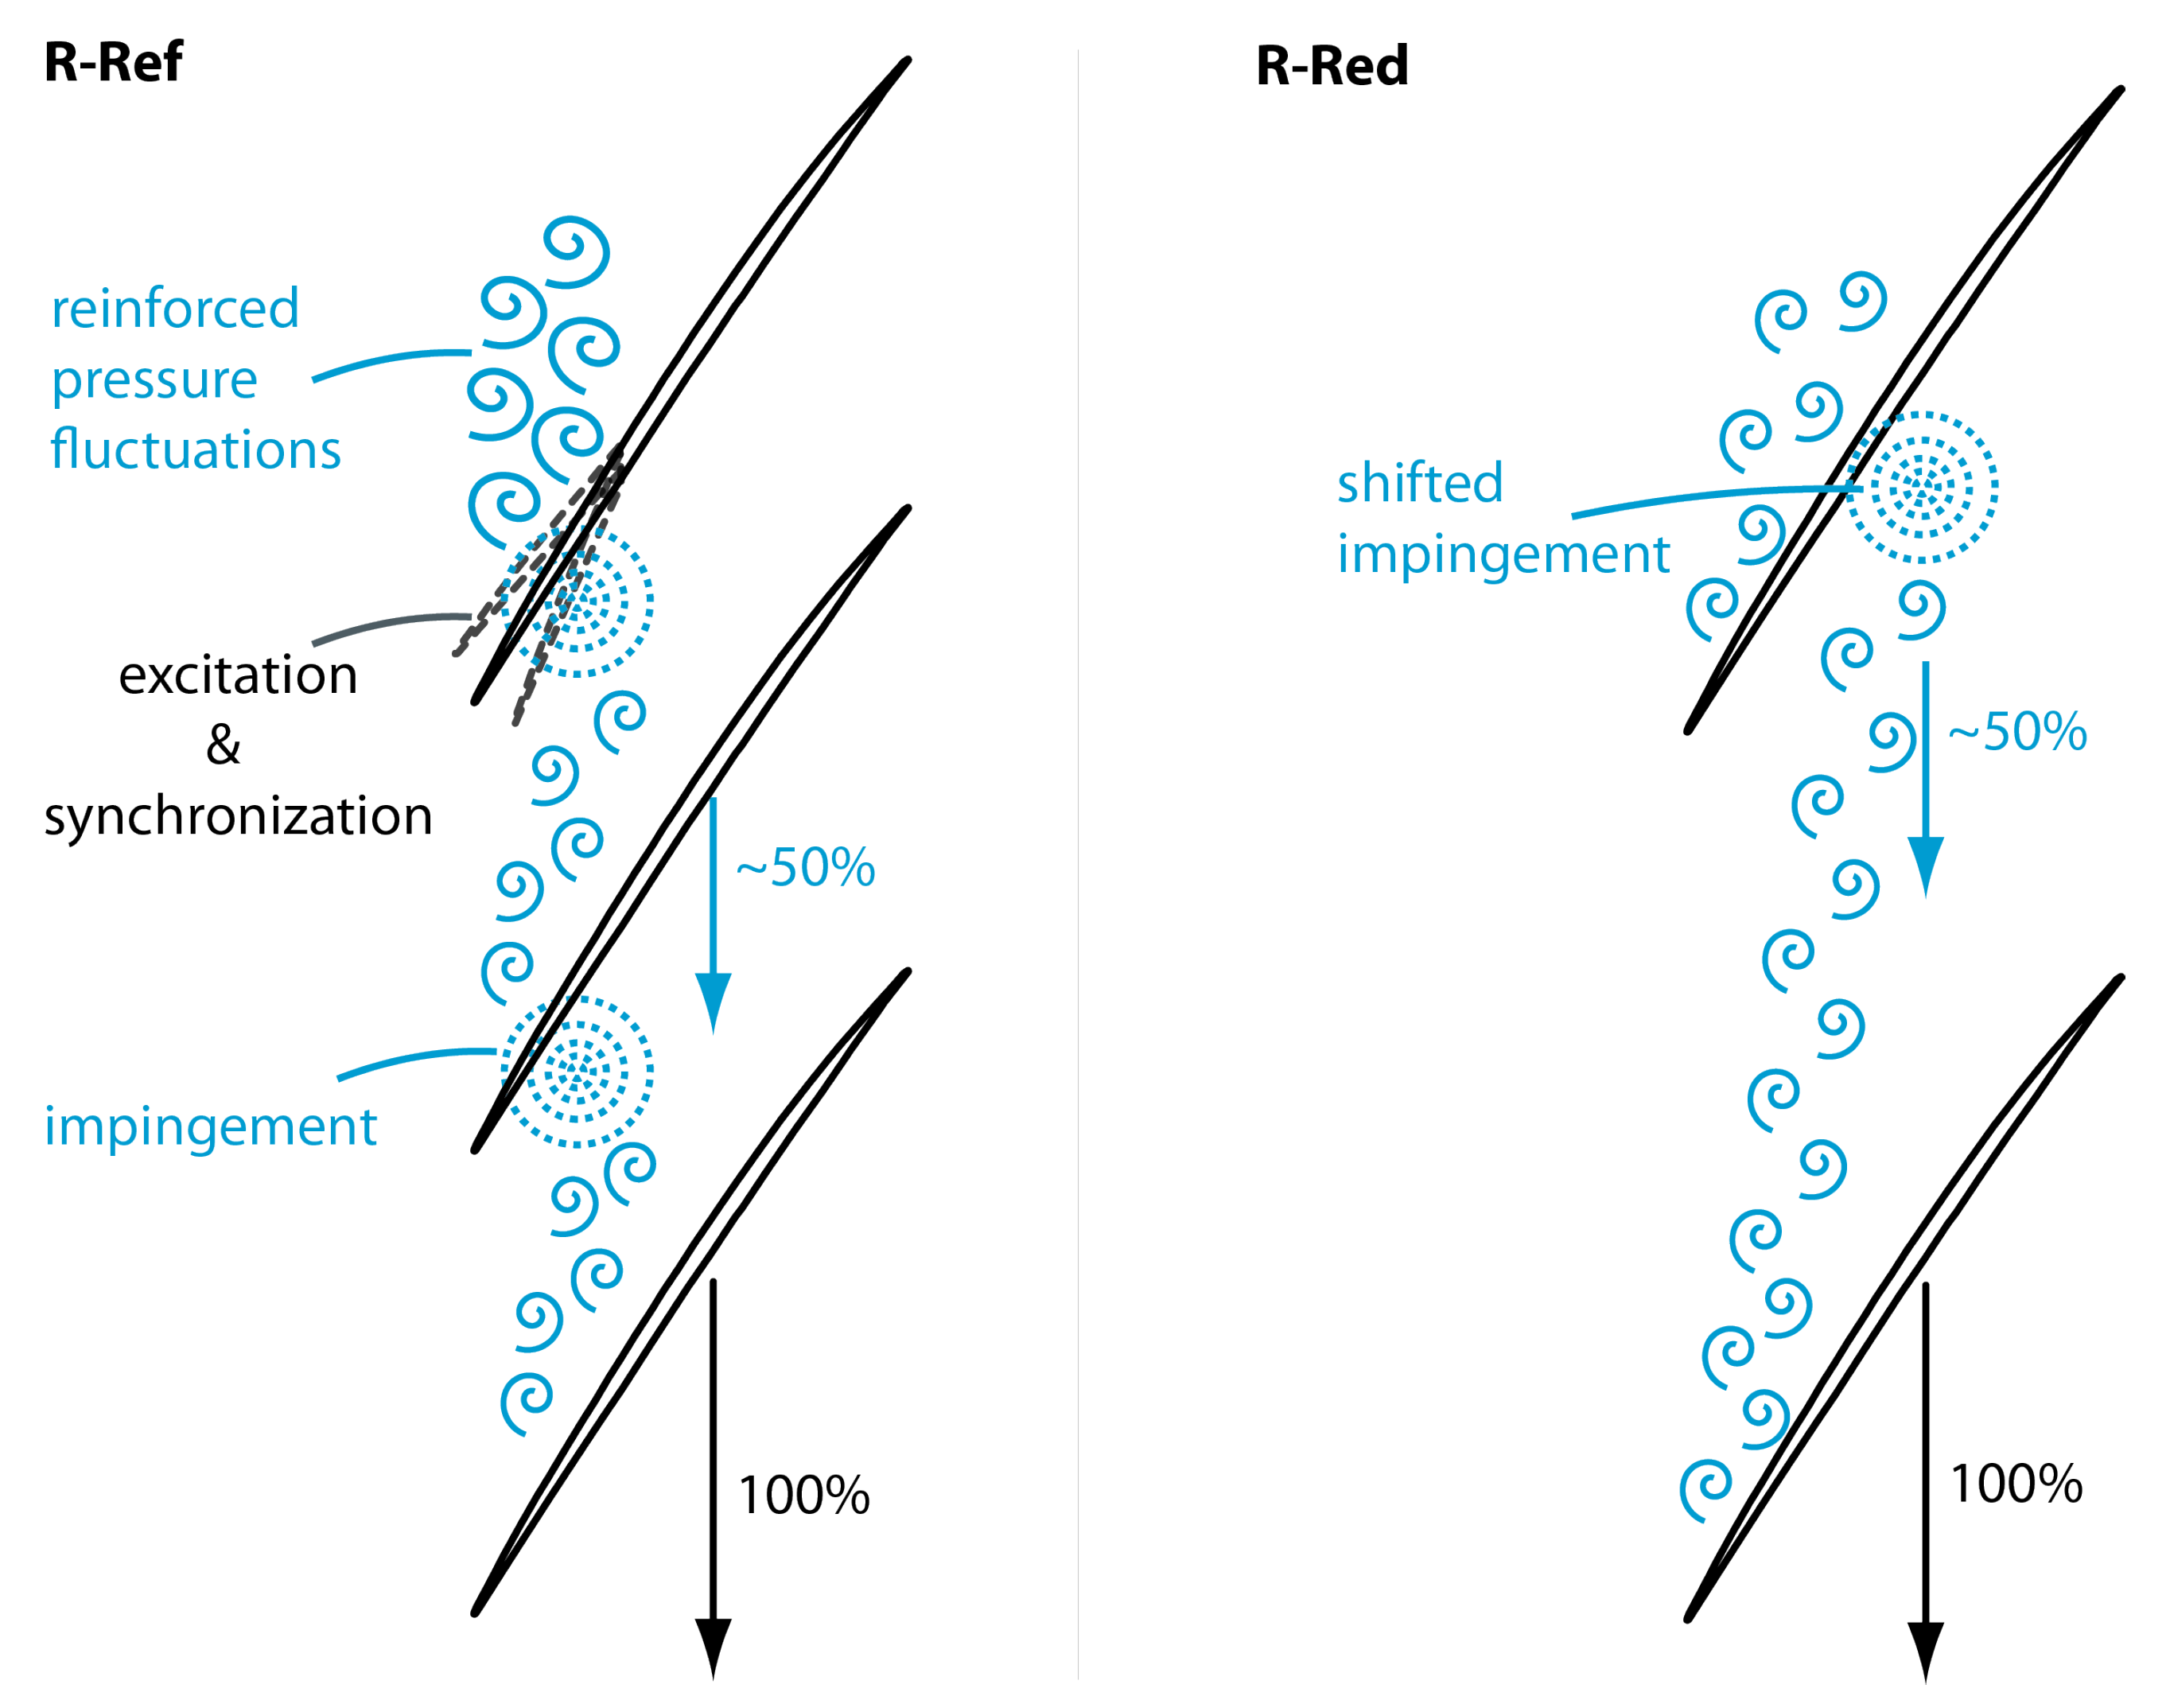
Figure 7 illustrates the axial occurrence of the detected aerodynamic disturbances, thus their one-dimensional trajectory while propagating through the rotor during stall inception at design speed. The dashed line indicates the blade leading edge and the dotted line the axial position of WPT sensors, used for spectral analysis and propagation speed calculations. Comparing the two rotor configurations, a further downstream shifted trajectory of the disturbances is distinctive for R-Red. Thus, less low-pressure regions are present within the particular WPT analysis section, exacerbating reliable cell speed calculations (compare
Figure 6). Due to the increased blade pitch, the aerodynamic disturbances have a longer propagation period through the passage (compare [
11]), and hence are carried further downstream by the axial momentum of the main flow. With respect to aeroelastic mechanisms at the stability limit, it is reasonable to assume that the shifted trajectories are a lower risk to excite 1T blade vibrations. This is in agreement with the vibration analysis. Further findings regarding the influence of trajectory and propagation speed of aerodynamic cells with respect to the compressor aeroelastics is presented in later sections. R-Ref shows similar behavior as presented by Brandstetter et al. [
7]. The disturbances primarily occur and propagate within a sector at about 25% axial chord length downstream of the leading edge. Hence, impinging the adjacent blade can result in forward spillage, triggering fluctuations in the adjacent passage, leading to radial vortices respectively, as well as amplified excitation of blade vibration.
3.3. Aeromechanics
In many cases, the operating limit along the entire operating range is set by a combination of stall and blade vibration. Those blade vibrations are almost always excited during transient operation and partially exceed the defined limits for safe operation. In addition, a change in nodal diameter for different speed lines and VIGV schedules, as well as a shift due to the blade count is evident (see [
11]). Based on the above-noted global trends and variation in aeroelastic behavior at the stability limits, it is reasonable to determine the unsteady aerodynamics at blade tip and its interaction with the blade vibration in more detail.
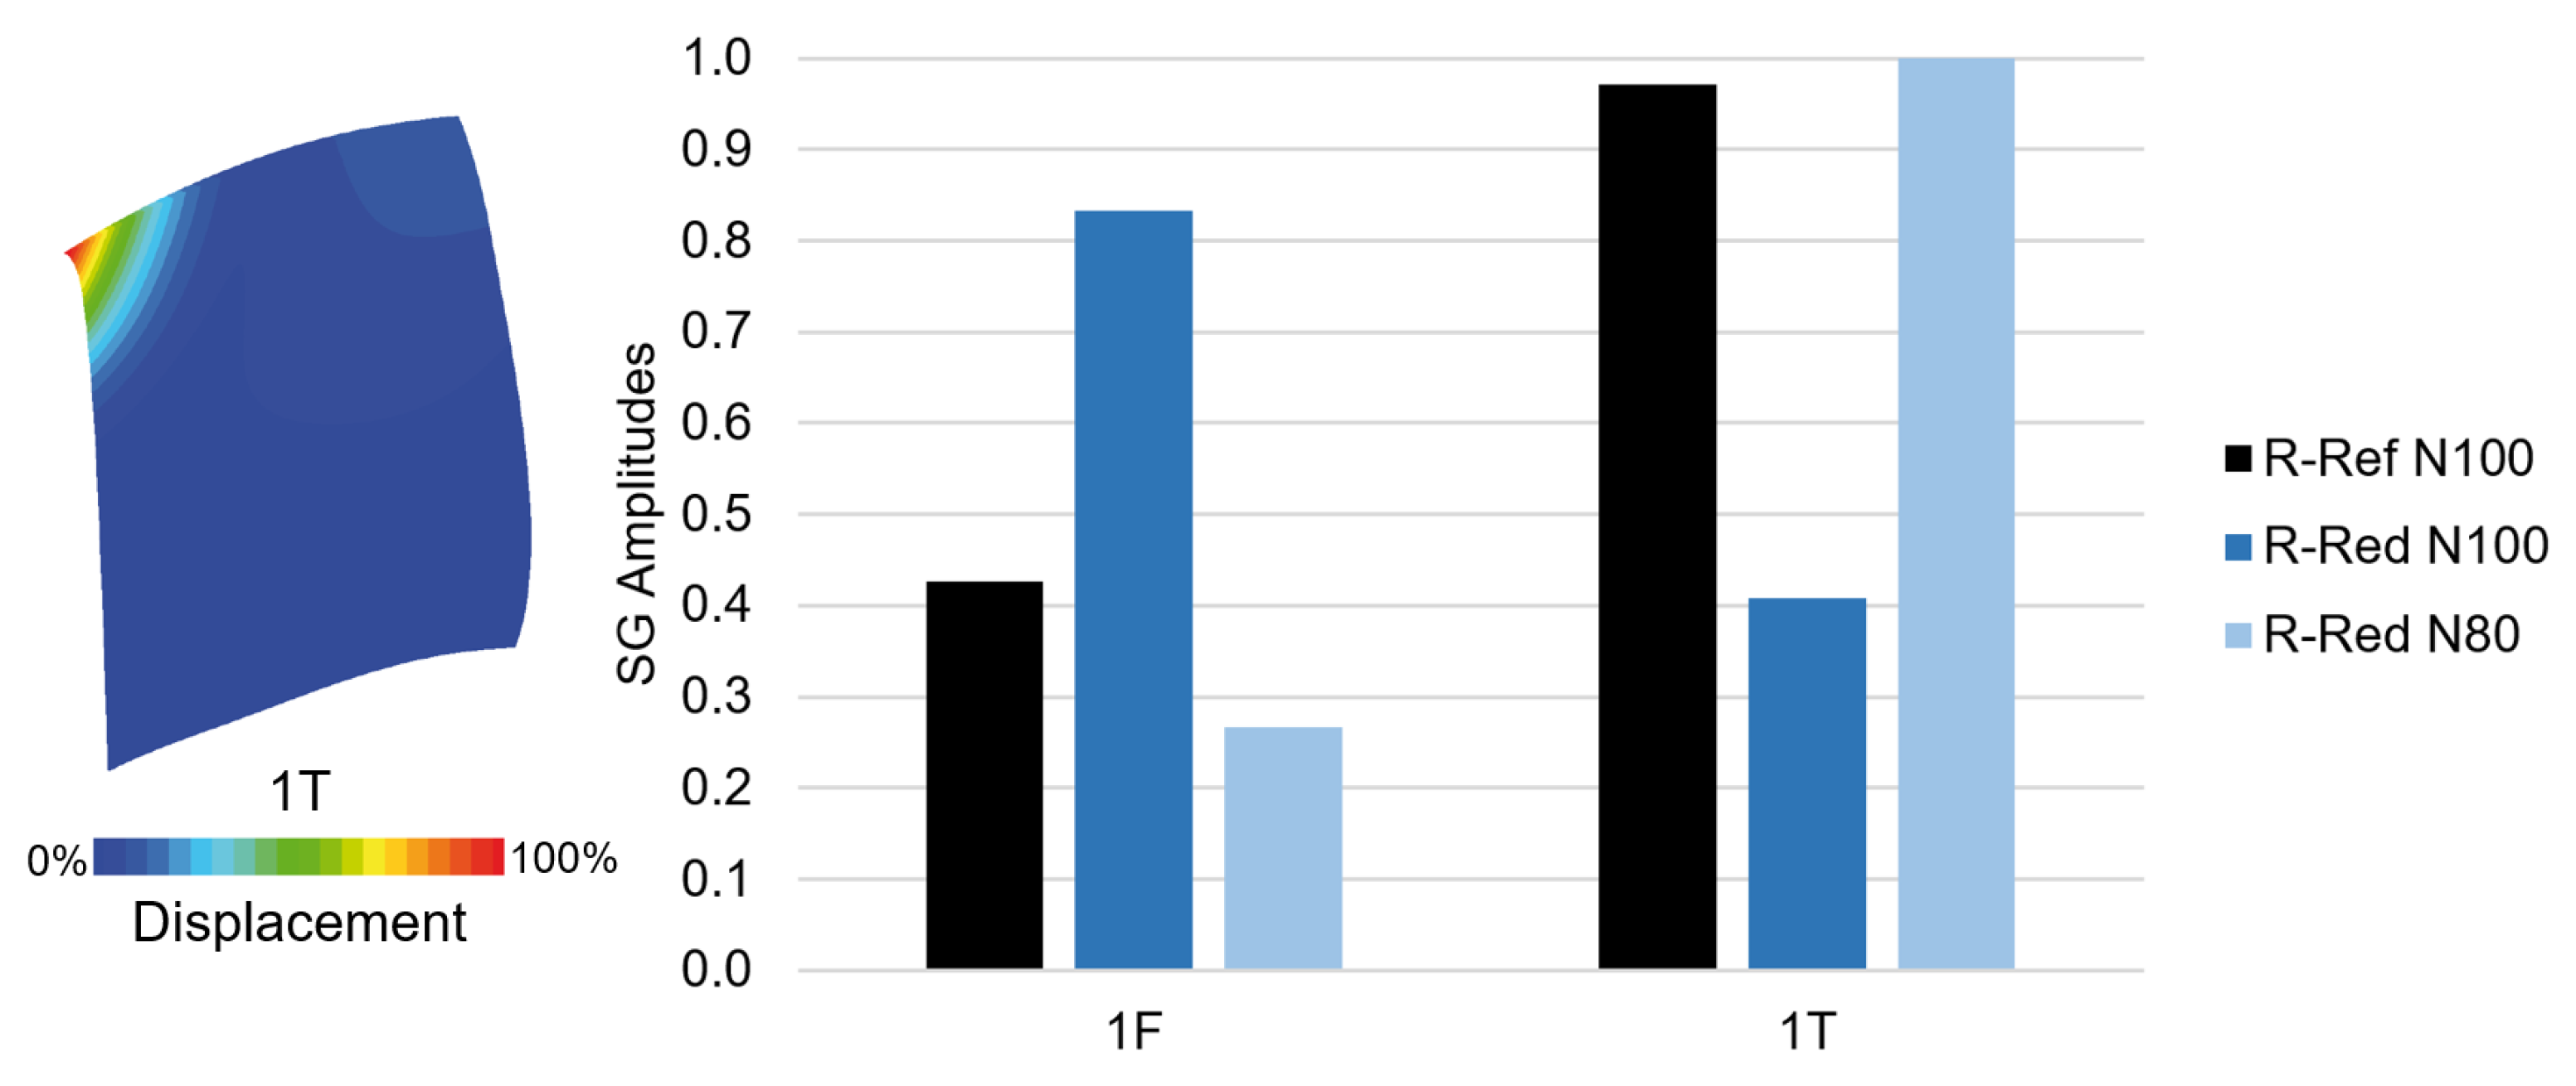
Figure 8 illustrates the normalized strain gauge amplitudes during stall inception, both at transonic and subsonic operating conditions as well as for both rotor configurations. It is based on the maximum amplitudes of the first flap (1F) and first torsional (1T) blade eigenmode prior to and during rotating stall. The chart shows significant differences, comparing the rotor configurations and operating conditions. R-Ref shows a vulnerability to non-synchronous 1T blade vibration in the vicinity to the stability limit with slightly increased 1F amplitudes during rotating stall. The 1T blade vibration can be traced to a fluid-structure-interaction, excitation and synchronization with circumferentially traveling aerodynamic disturbances, as shown before. For detailed experimental and numerical analysis refer to [
10,
12].
For R-Red at design speed, a different behavior is apparent and the strain gauge amplitudes verify the aforementioned observations considering the shifted trajectory of aerodynamic disturbances within the rotor and its effect on fluid-structure-interaction. Taking the mode shape of a torsional blade mode (compare
Figure 8) and especially its particular deflections at the blade tip into account, the shifted aerodynamic disturbances seem to reduce the potential to excite blade vibrations. Furthermore, the first flap vibrations during rotating stall are amplified. For part speed, the stability limiting mechanism seems to change and is comparable to R-Ref.
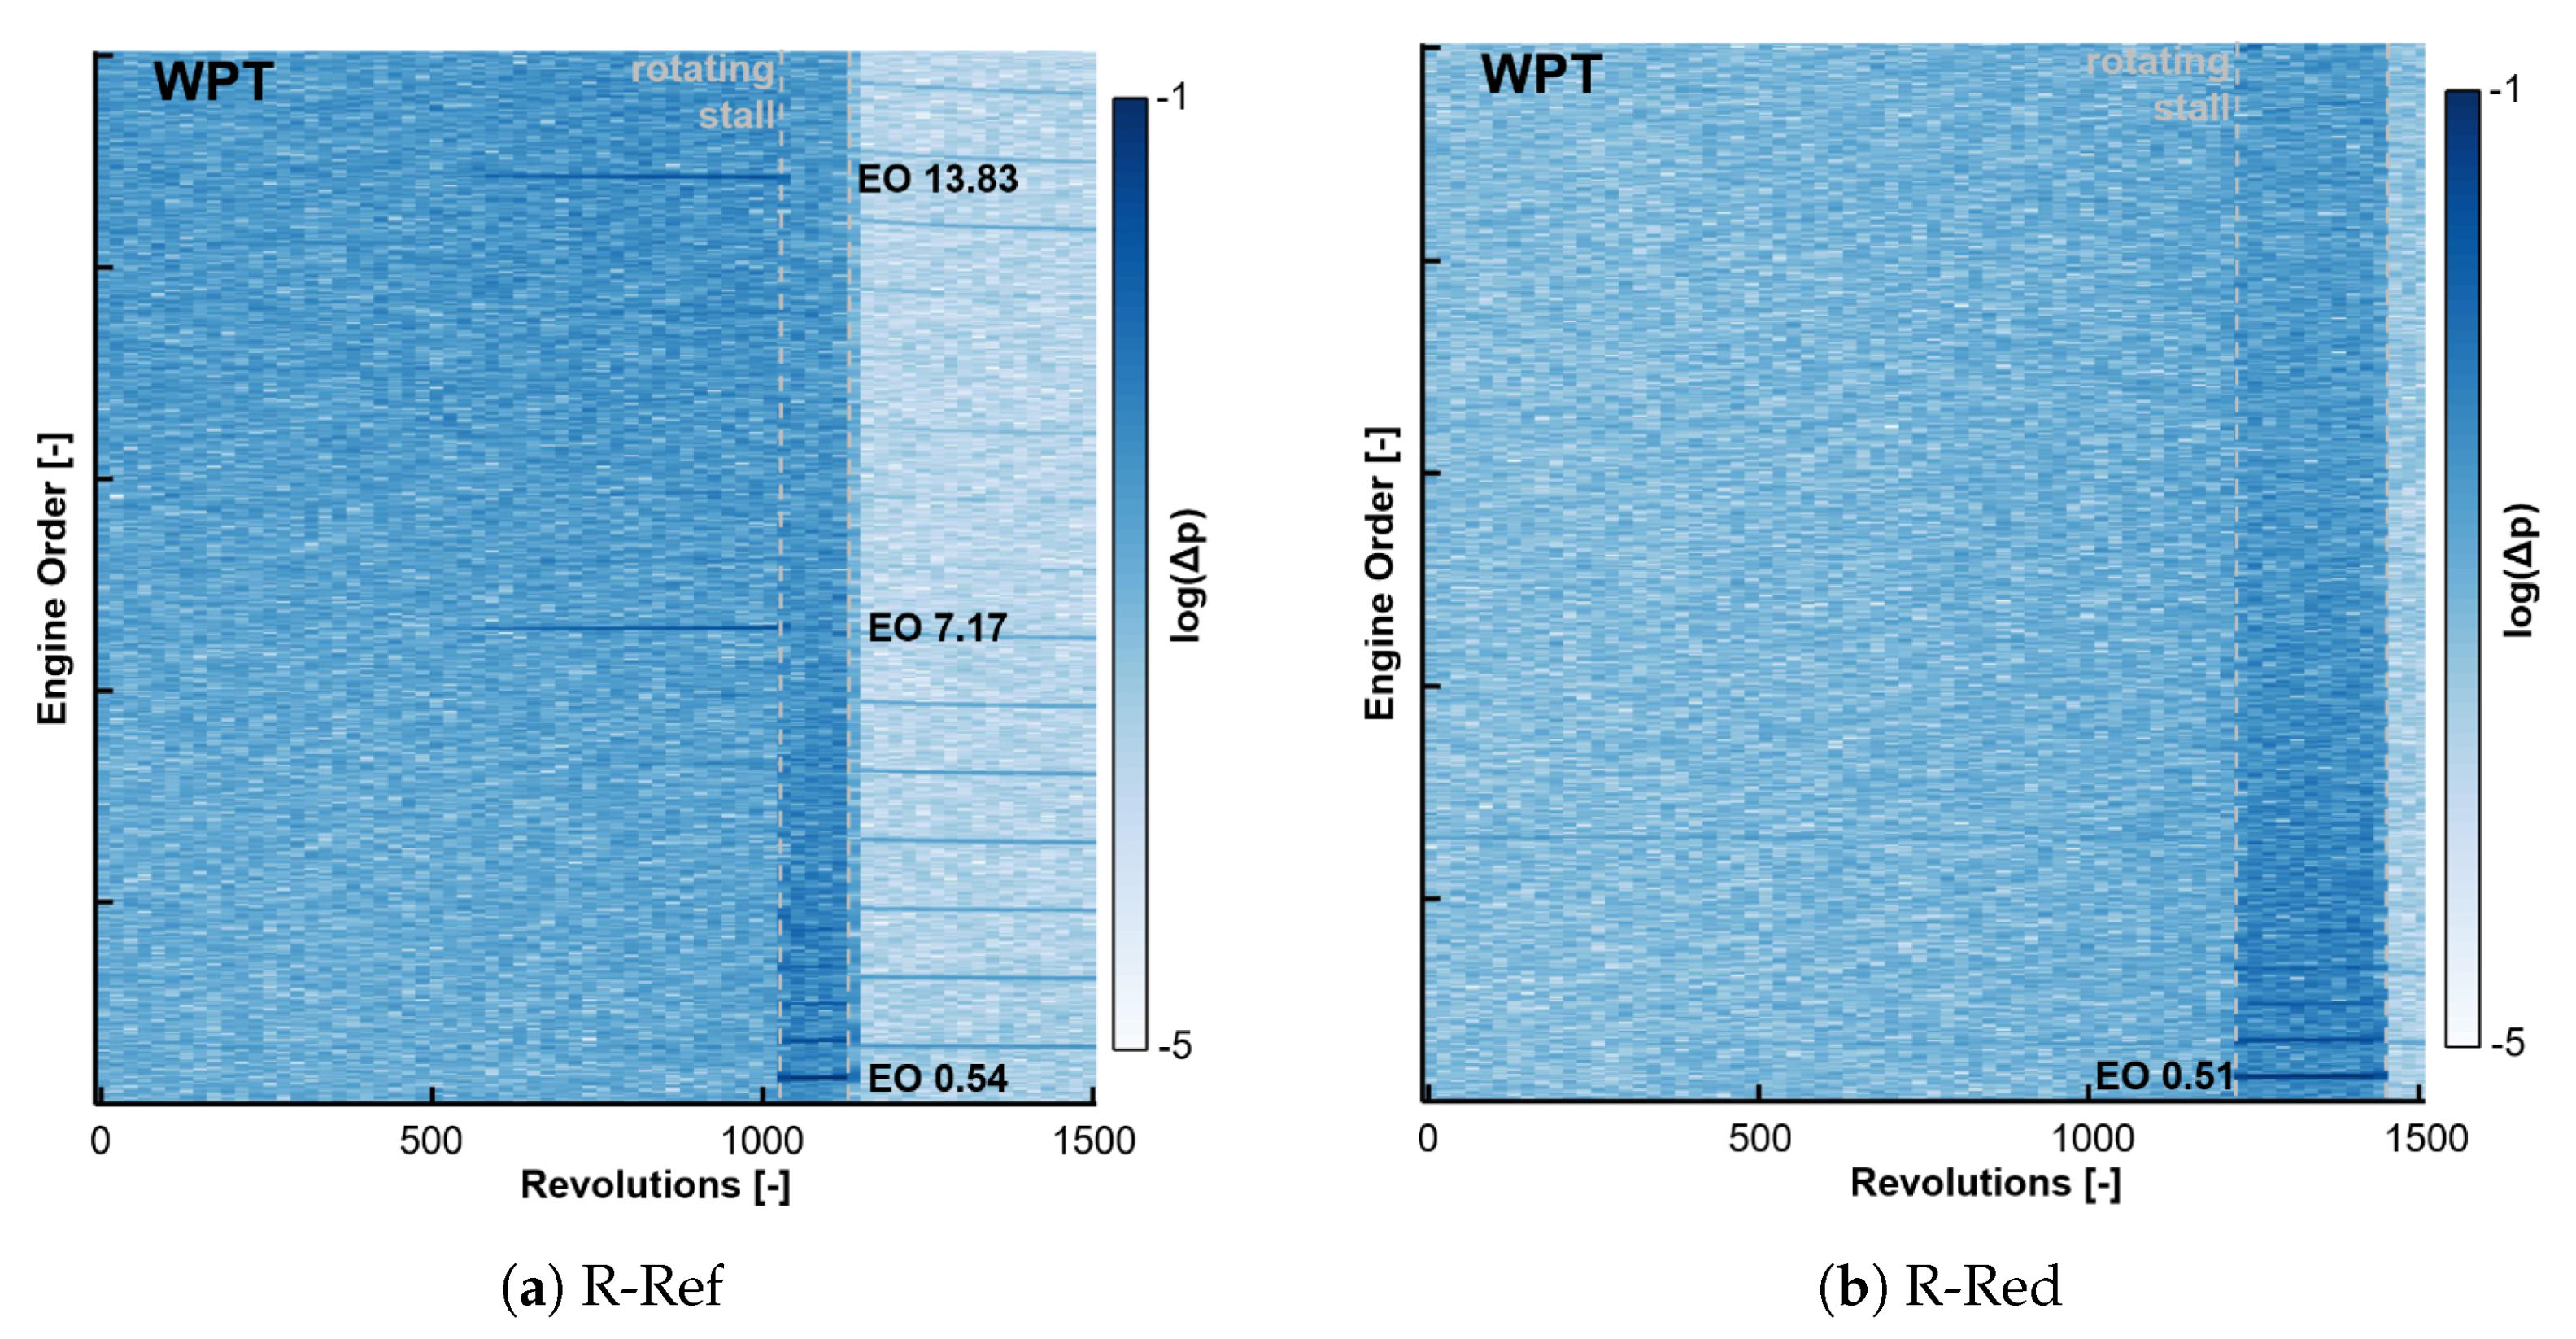
The spectra of the WPT signal support the discussed findings, as shown in
Figure 9 for both rotors during stall inception at design speed. For R-Ref two distinct peaks prior to stall (rotating stall is marked by a dashed line) can be referred to fluid-structure-coupling, as typically postulated by literature. EO 13.83 can be assigned to a ND+8 BLISK vibration (considering SG data, not shown for brevity) interacting with 13 aerodynamic cells propagating in circumferential pattern at distinct speeds. Additionally, the cell speed during rotating stall can be depicted as 54% rotor speed. Considering R-Red, no distinct peaks, indicating fluid-structure-interaction are visible prior to the aerodynamic stability limit, rotating stall (at EO 0.51) respectively. Again, this proves the aforementioned aeromechanical behavior of the blade count reduced rotor.
At part speed operating conditions with a particularly adjusted VIGV schedule, R-Red shows an increased vulnerability to 1T blade vibration in the vicinity to the stability limit (compare
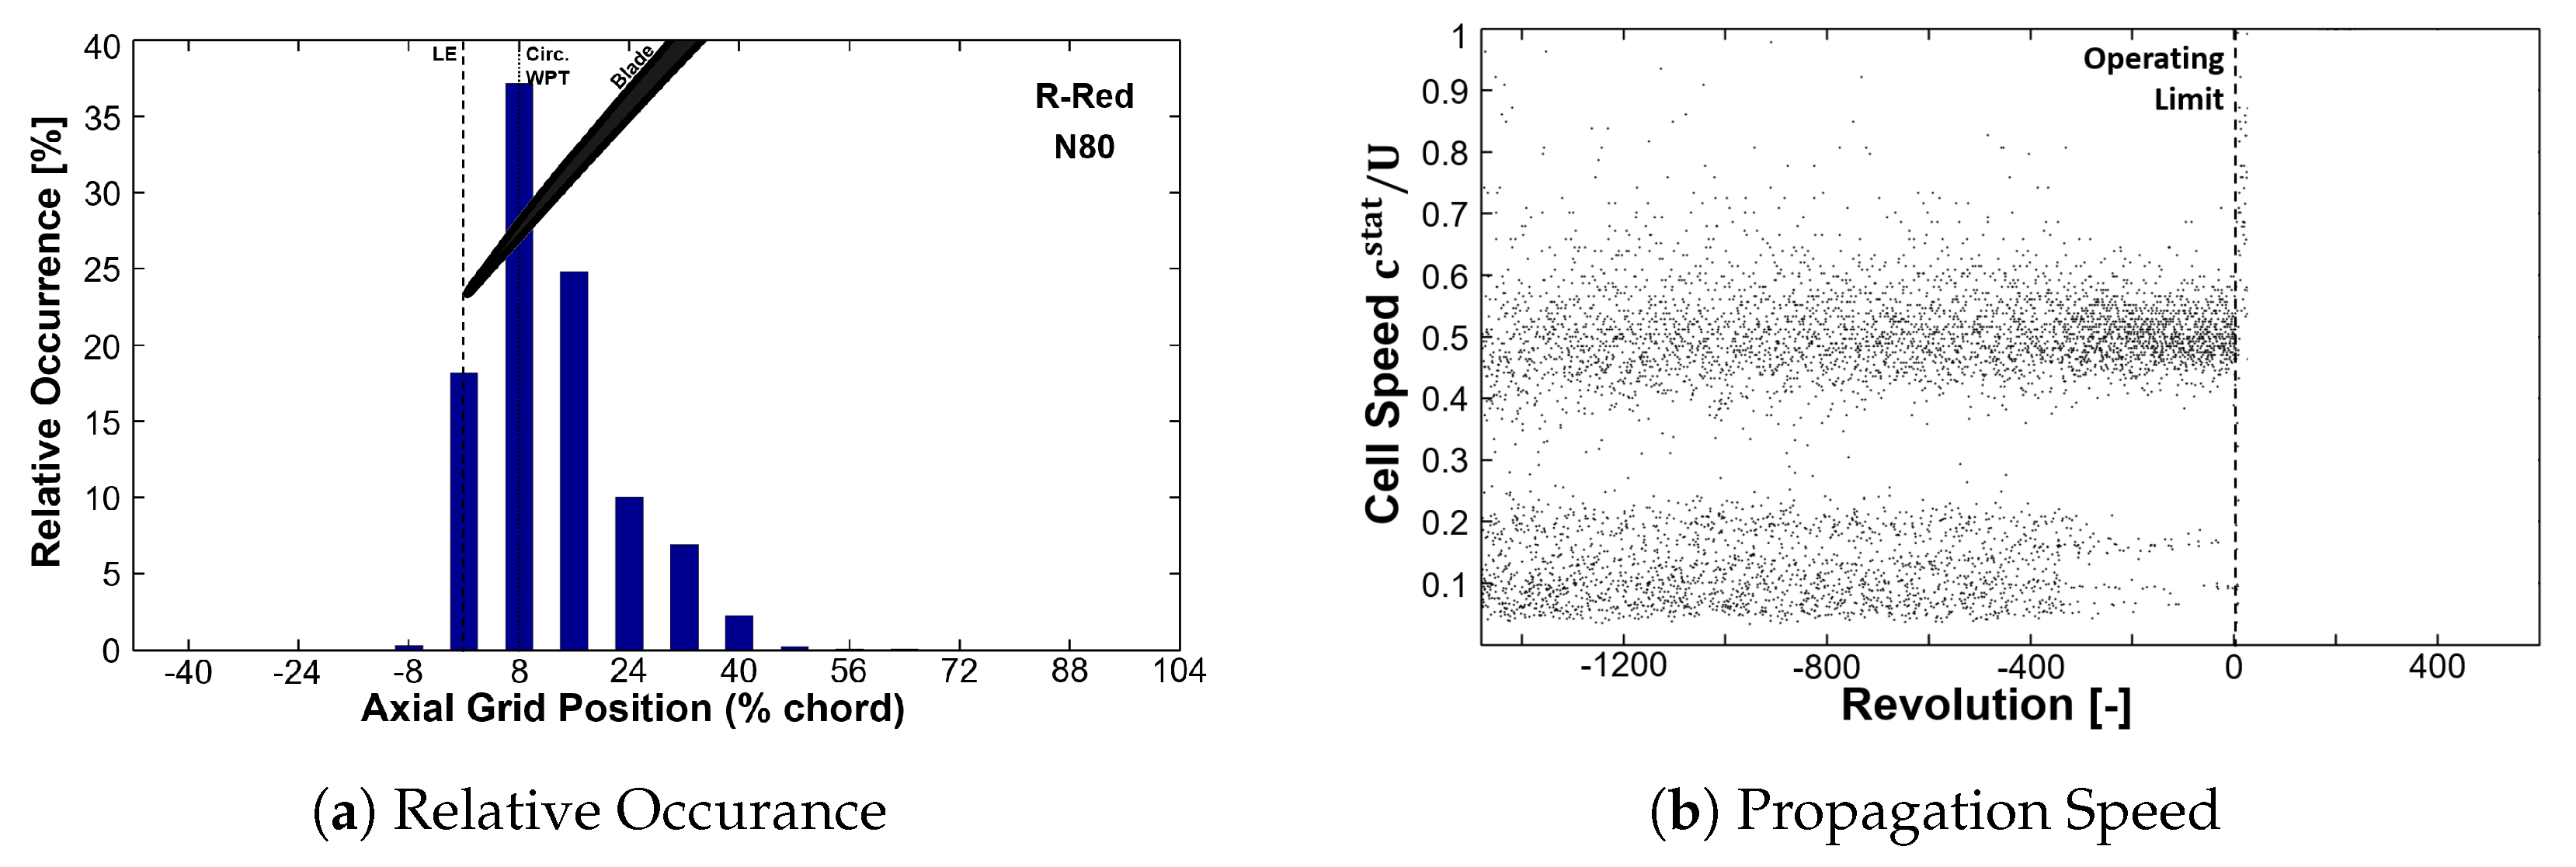
Figure 8). This behavior can again be explained by the unsteady wall pressure data and related analysis. Considering the axial distribution within the rotor passage (
Figure 10a), the detected disturbances are located further upstream compared to design speed, basically within the leading edge plane. Thus, on the one hand it is possible to determine cell speeds with the circumferential distributed WPT sensors, resulting in about half the rotor speed, as plotted in
Figure 10b. On the other hand, as for R-Ref, those disturbances enable a fluid-structure-interaction, hence excitation of 1T blade vibration and coupling with a particular BLISK mode (compare
Figure 8).
