Abstract
Mechanically robust turbine design with respect to blade vibration is challenging when dealing with nozzle-ring fouling and wear. Especially for engines operating with heavy fuel oil (HFO), the nozzle rings of the turbocharger turbines are prone to severe degradation in terms of contamination with unburned fuel deposits. This contamination will lead to an increased excitation of blade resonances in comparison to the nominal design. Due to the statistical character of contamination, long-term monitoring of blade vibration amplitudes would be beneficial. In the harsh environment of HFO operation, however, conventional blade vibration measurement techniques, such as those using strain gauges or blade tip timing, cannot work reliably for a long period. Thus, the objective of this research is to develop a method that enables the monitoring of turbine blades using pulsation or vibration sensors installed on the stator side. Almost a dozen turbines, both radial and axial, have been examined in order to determine a proper measurement chain/position and analytical method. Even though the challenges specific to the turbocharger turbine application—that high-frequency (up to 50 kHz) acoustic radiation from turbine blades has to be detected by a sensor on the stator side—were demanding, in the course of the investigations several clear examples of turbine blades engine-order resonance detection were gathered. Finally, the proposed method has been tested successfully in a power plant for over one year.
1. Introduction
In heavy fuel oil (HFO) operation, the vaned turbocharger nozzle ring might be the first major flow obstruction after the engine cylinder outlets, making it prone to contamination by fuel residuals. The degree of contamination depends on various factors, such as the properties of the HFO, temperature, or the frequency and quality of prescribed turbine washings by end users. A contamination state, as shown in Figure 1, in which some sectors of the nozzle ring are clogged almost completely, is not uncommon. As well as being the cause of a drop in turbine stage efficiency, nozzle-ring fouling is also considered to be the major cause of turbine blade failures due to high-cycle fatigue (HCF).
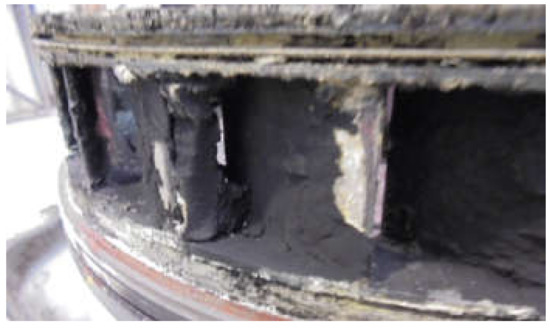
Figure 1.
Heavily fouled nozzle ring of a radial turbine.
Because of the statistical character of the contamination pattern (even with a highly contaminated nozzle ring, depending on the contamination pattern, it cannot be ruled out that the blade vibration amplitude could also decrease when excitation forces are located off-phase from a blade vibration mode) and its influence to blade vibration amplitudes, a long-term blade vibration amplitude monitoring system may be beneficial. Conventional blade vibration measurement techniques, such as strain gauges or blade tip timing (BTT), which use optical or capacitive sensors, cannot, however, long survive harsh environments, especially those with HFO operation.
Theories pertaining to blade vibration detection on rotating parts by sensors installed on a stationary reference have existed since the 1980s [1,2,3,4]. Most of the research, however, deals with compressor-stage flutter detection and characterisation, i.e., non-integral modes. Just one paper claims to have successfully detected integral blade vibration in a multiple-stage axial compressor by means of pulsation measurement at the stator [5].
In the standard turbine stage qualification process carried out by ABB Switzerland Ltd., Turbocharging, several resonances will be identified and must be proved to be HCF-safe, even if the turbine were to stay at a particular resonance for a long period. In addition, taking a certain degree of nozzle-ring fouling into account, a margin to the alternative stress design limit is normally adopted. However, the qualification process does not cover severe fouling, such as that seen in Figure 1 and cannot account for the variations in contamination patterns. The main object of this study is, therefore, to find a proper and robust method to monitor turbine blade vibration behaviour under HFO operation using sensors installed on non-rotating parts.
2. Materials and Methods
2.1. Review of Mengle’s Theory
The background theory of this study owes much to the work of Mengle [3]. When only concerned with frequency shifts due to reference frame change from rotating to stationary, Kurkov [1,2] and other researchers [3,4] derived practically the same equations, but Mengle’s study may be the only one that also handles the amplitude characteristics of airborne acoustic waves emitted by the blade vibration. Mengle derived the following formula for frequency shifts in rotating blade vibration observed from a stationary frame, first displayed adopting the same nomenclature used in [3].
- ω’: Observed frequency (in stationary frame)
- ω: Blade vibration frequency (in rotating frame)
- k: Traveling-wave mode number (in rotor structure)
- m: Integer (Fourier coefficient order for airborne wave between blades)
- B: Number of rotor blades
- Ω: Rotor rotational speed
Now, when an integral vibration mode is concerned, Equation (1) will read
- EO: Engine order,
- ND = k: Nodal diameter
ND varies between for an even number of blades or for an odd number of blades. When ND is negative, then the ND pattern travels against the shaft rotation direction. The reason for the rearrangement of three terms in Equation (2) is to avoid mixing up the two different media, i.e., structure and air, that transmit the acoustic wave.
2.1.1. Rotor Structure-Borne Traveling Wave
The first term of Equation (2), (EO + ND)Ω, is the frequency of the rotor structure-borne traveling wave observed from the stationary frame. When a probe on the stator side looks, via blade tip timing or shaft vibration using eddy current probes, at the rotating structure, (EO + ND)Ω is the “observed frequency.” In this case, the second term in Equation (2), mBΩ, is not relevant. A commercially available tip timing program adopts this nomenclature [6], i.e., EO + ND is named as the “observed” engine order (from stator-side sensors). This term will be physically easier imaginable, when it is rearranged as
In space, along the circumference of bladed rotor, ND cycles of wave are present. The rotation speed of the ND pattern relative to the rotor is , because, in the case of an integral vibration mode, a blade on the rotating frame vibrates EO cycles within one rotor revolution. The rotor itself is turning at the speed Ω with respect to the stationary frame, so that Ω must be added (see Figure 2).
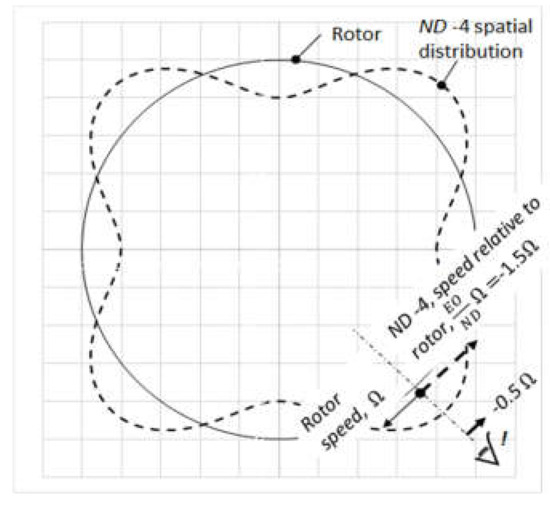
Figure 2.
Schematic display of ND spatial distribution and its rotation speed in the case of EO = 6 and ND = −4, the resulting observed engine order from stator will be two.
With a bladed rotor that is perfectly cyclically symmetric, i.e., without mistuning, in an integral vibration mode along an engine order, there is a fixed excitable nodal diameter. For example, with turbine blade number B = 11, and EO = 6, the excitable ND will be +5. Due to this fixed relation between EO and excitable ND, statements in [5] such as, “forced response pressure fluctuations are Doppler shifted to blade pass frequencies (and their harmonics)” arise. However, the relation is valid only for a perfectly symmetric system, which does not exist in reality. That means, due to the mistuning of a real system, the excitation energy will be distributed in several nodal diameters. Hence, it is essential to identify a dominant nodal diameter—in the case of resonances excited by equally spaced nozzle-ring vane numbers, the dominantly vibrating nodal diameter often meets the rules, even with a naturally mistuned rotor—when measurement result comparison between strain gauges/tip timing and stationary installed pulsation or vibration sensor is to be conducted.
2.1.2. Airborne Wave Shape between Blades
Due to the rotor structure vibration, blades emit airborne acoustic waves. The m in (2) means, physically, the wave number between two blades; in the available references, it is sometimes mentioned that the airborne acoustic wave would also be traveling like the structure-borne wave. However, it is actually confined between rotor blades, at least within the range of the blades’ passages. One should hence consider the first term (EO + ND)Ω as the primary cause, and the mBΩ as secondary, resulting from the structure blade vibration. When two blades vibrate at a certain frequency, the airborne acoustic wave shape between them depends on the airborne acoustic wavelength, spacing-distance between the blades, and the inter-blade phase angle (). For example, when blade spacing length << airborne wavelength, then the pulsation amplitude of m = 0 will be dominant. However, when blade spacing length >> airborne wavelength, the pulsation amplitude with an m > 2 will be dominant. In a real situation, the blade spacing length will not have an exactly integral relation to the airborne wavelength, so the wave shape must be Fourier transformed, as is done in [1,2,3,4].
In turbocharger turbine blade vibration detection by means of stationary installed pulsation or vibration sensors, estimation of a possible dominant m for a resonance is indispensable because of the high rotation speed, (up to >1000 rps) and blade numbers (radial turbines, around 10–15, axial turbines >30). One increment of m can result in a frequency shift of >30 kHz, which could cause complications in the measurement chain and data acquisition.
2.1.3. Pulsation Amplitude Relation with Blade Deflection
Pulsation amplitude, p, emitted by a blade vibrating with frequency ω and deflection amplitude of Adefl can be formulated as
- ρ0: Density of medium
- c0: Speed of sound
- p0: Bulk gas static pressure
- T0: Bulk gas temperature
- τ ≤ 1: Fraction of gas flow travel time on the vibrating surface and one blade vibration cycle duration
From Equation (4), it can be recognized that, even with the same blade deflection amplitude, depending on the frequency and static state of the gas, the emitted pulsation amplitude varies. In the turbine stage, the bulk gas flow rate is considerably high, so that gas passing around the blade will not have enough time to absorb the whole blade oscillation energy, but only a fraction of it. The actual flow field around a turbine stage is complex, but Equation (4) provides us at least with the maximum possible pulsation amplitude we can expect. By assuming that τ = 1, Adefl = 250 µm02P, atmospheric static pressure and a bulk gas temperature of 400 °C, the expected pulsation amplitude will be approximately 9 mbar02P at 2 kHz vibration frequency. When the vibration frequency is 10 kHz, it will be 43 mbar02P, i.e., the higher the frequency, the higher the pulsation amplitude that can be expected. In addition, at a higher vibration frequency, a higher τ can also be expected.
2.1.4. Pulsation Amplitude Axial Decay Behaviour
Before moving on to the discussion on amplitude decay behaviour, a reminder that the available open literature mostly handles only the axial compressor stage. The pulsation sensors have normally been placed in the vicinity of rotor blades, often covering them. In such a measurement setup, whether the emitted airborne pulsation amplitude decays or propagates undiminished in the axial direction might not be important. However, from a practical point of view, it is desirable to locate a sensor away from the rotating blades, to where mechanical and temperature requirements for instrumentation will not be as severe. Furthermore, the subject of most of the open papers is the detection and characterisation of flutter, which normally occurs at non-integral engine orders. For such purposes, pulsation amplitude peaks related to integral engine orders, especially blade-passing frequency and its higher harmonics, can be filtered out. On the other hand, for an integral vibration mode monitoring, pulsation amplitude changes of blade-passing frequencies will become the primary concern. High pulsation amplitudes at blade-passing frequencies with classical meaning, i.e., when blades are not vibrating, however, are concentrated in gaps between the turbine tip and casing, and will decay rapidly in up/downstream directions. An in-house conducted Computational Fluid Dynamics (CFD) calculation for a one-stage axial turbine shows that the pulsation amplitude at blade-passing frequency will diminish to less than 1/20 of its original value approximately 12 times the chord length downstream from the turbine blade trailing edge. Therefore, also from this point of view, for an integral vibration mode detection, it is better to install a sensor away from the turbine blades.
Mengle [3] also studied pulsation amplitude decay behaviour. According to [3], the airborne acoustic wave number in the axial direction, kx, can be formulated as
- U: Axial bulk gas flow rate
- V: Circumferential bulk gas flow rate (= blade tip velocity)
- ky: Wave number between blades in circumferential direction
- s: Spacing between two blades
The derivation of Equation (5) needs highly idealized assumptions and boundary conditions, but Equation (5) can be used for orientation.
When the content of the root in Equation (5) is a negative value, then kx will have an imaginary part, so that the amplitude in the axial direction will decay. With a given set of U, V, ω, and c0, the content of the root will be a quadratic function of ky, which depends on the wave number between two blades, m.
Because U2 + V2 – is always negative (relative velocity does not exceed the speed of sound), Y will be a convex parabolic curve.
The two curves in Figure 3 are derived by varying only ω (3 or 7.5 kHz), keeping the other parameters in Equation (7) constant. When a blade vibration frequency is 3 kHz, only the modes of m = 1, can propagate downstream but when it is 7.5 kHz, three wave number modes, m = 0, 1 and 2, can.
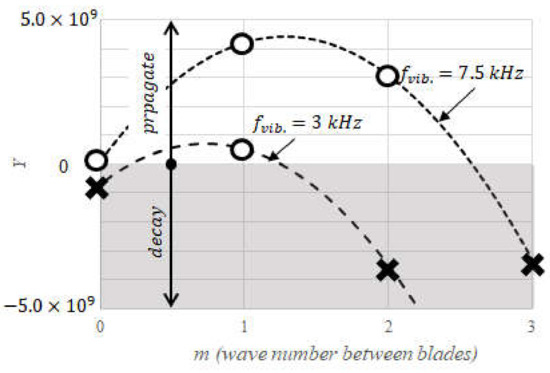
Figure 3.
Effect of blade vibration frequencies on the judgment if the airborne wave will propagate or decay in the axial direction.
2.2. Experimental Setup
Figure 4 shows a typical experimental setup for both radial and axial turbine stages in ABB Switzerland Ltd., Turbocharging.
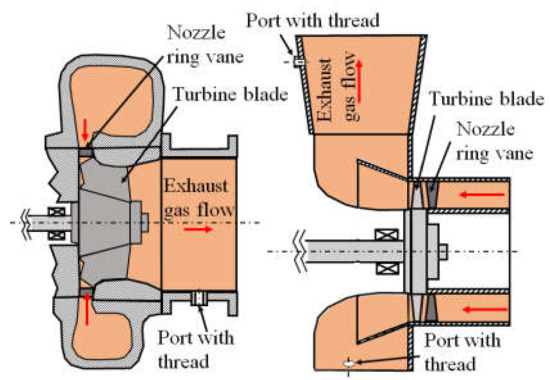
Figure 4.
Typical layout of turbocharger turbine stage with instrumentation ports, left: radial turbine; right: axial turbine.
In the course of this study, five axial and two radial turbine stages were experimentally investigated. The ports with threads in Figure 4 are standardly integrated into the series product. They are used for inspections or instrumentation, typically for temperature or static pressure measurement. Pulsation measurement sensors, most with a piezoelectric sensor, were installed in the threaded port, with the sensor tip mounted nearly flush with the inner surface.
Initially, a test series with an axial turbine stage was carried out especially for this study. Here, other types of sensor, such as accelerometers, acoustic emission sensors or eddy current probes, were installed at several measurement positions to determine if a suitable method that is cheaper than the pulsation sensor approach could be found. However, as will be detailed below, these alternatives are generally not as suitable as the pulsation sensor, even though in some particular stage/resonances they can also detect blade vibration. In this paper, mainly results with pulsation measurement will be presented.
In ABB Switzerland Ltd., Turbocharging, a newly developed turbine stage must pass an HCF qualification in which both strain gauges and blade tip timing measurements are usually employed. In the qualification process, the identification of potentially critical fundamental resonance modes and several nozzle-ring-induced higher resonance modes are conducted using these measurements supported by Finite Element Method (FEM) calculation, so that the vibration behaviour of such resonances can be well characterized. Integrating an additional pulsation or accelerometer measurement into this already established process does not require too much extra effort. By this given process, it is possible to judge, during the turbine qualification period, if potentially critical resonances can be actually monitored by a sensor on the stator side. Pulsation, or sometimes also accelerometer measurements other than the abovementioned test series, have been conducted in the context of the standard HCF qualification tests.
The signals from the pulsation sensors (Type 1, a piezoelectric sensor, sensitivity ca. 100 pC/bar, Type 2, a piezoresistive sensor with integrated amplifier, sensitivity ca. 13 mV/mbar), along with strain gauge signals, were fed to a digitizer card with 40 respectively 80 kHz bandwidth. Data acquisition and analysis was conducted by a commercially available multichannel FFT (First Fourier Transform) analysis program. Tip timing measurements were mostly conducted using optical probes.
3. Results and Discussion
From Equation (2) and discussions in Chapter 2, it can be seen that it is essential to identify a dominant nodal diameter of a resonance if a rotor blade vibration detection from the stator side is to succeed. A comparison between an order-tracked pulsation amplitude trend and that of the strain or deflection amplitude of a certain blade or all blades, as conducted in [5] might not deliver a satisfactory result because the pulsation measurement from the stator side senses a blade vibration mode as a whole system. Nodal diameter trend is needed rather than individual blade strain/deflection trend for this reason. The applied Blade Tip Timing (BTT) program outputs, by default, a nodal diameter trace plot within Least Squares Model Fit (LSMF) analysis. From the plot, the dominant nodal diameter can be identified and, according to Equation (2), candidates for engine orders can be derived for the pulsation measurement analysis.
3.1. Fundamental Vibration Mode Detection in a Radial Turbine
Figure 5 displays one of the most convincing comparisons between BTT and pulsation measurement. The black trend curve (BTT) and the two grey trend curves (pulsation) are processed by independent data acquisition systems and analysed in different ways. The test, in which the signals in Figure 5 were recorded, was conducted with a nozzle ring manufactured by a selective laser melting process using a model constructed from a 3D scanned nozzle ring, as retrieved from a field engine. The condition of the retrieved nozzle ring was comparable to that in Figure 1.
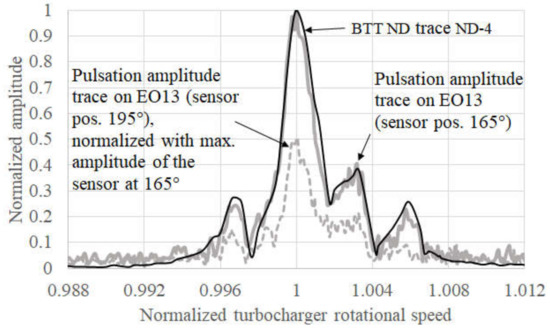
Figure 5.
Comparison between blade tip timing (BTT) ND -4 trace and pulsation amplitude trace on EO13 in a sweep test through a fundamental resonance mode on EO6 of a radial turbine with 11 blades.
The two pulsation sensors (angular positions 165° and 195°) recorded different pulsation amplitude levels (the amplitude of sensor at 195° is normalized against the maximum amplitude from the sensor at 165°). A closer examination using BTT traveling-wave analysis revealed, however, that such amplitude differences, by a factor of 0.5, can also be found in blade deflection measurements between eight BTT sensors. Therefore, the pulsation amplitude differences shown in Figure 5 relate not to the sensor/measurement chain, but only to the sensor position.
Figure 6 summarises analysis results with different nozzle-ring conditions but with the same radial turbine stage.
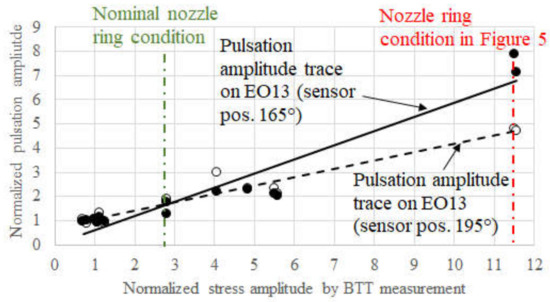
Figure 6.
Linear dependencies between blade vibration stress and measured pulsation amplitude.
From the fact that the blade vibration stress can be four times greater than the values evaluated with a nominal nozzle-ring condition and the pulsation amplitudes will increase accordingly by two to four times; in this particular case, it can be judged that a blade vibration monitoring will be possible. The data to the left side of the nominal nozzle-ring condition line in Figure 6 were recorded with such a nozzle-ring condition that the intentionally introduced inhomogeneity was out of phase with the background excitation distribution so that the measured blade vibration amplitudes were lower than those measured under nominal conditions.
The applicability of the theoretical consideration in Chapter 2 can be checked using this example:
- (1)
- By BTT measurement and analysis, ND = −4 was identified as the dominant vibration mode;
- (2)
- By inserting ND = −4, EO = 6, B = 11 in (2), expected engine orders along which pulsation measurement reactions to the blade vibration mode will be processed as EO = 2 (m = 0), EO = 13 (m = 1), EO = 24 (m = 2) and so on;
- (3)
- By taking the aspect of airborne acoustic wave shape between two blades into account, the modes with m = 0 and m = 1 are expected to have high pulsation amplitudes;
- (4)
- Finally, by taking the axial amplitude decay behaviour into account (refer to Figure 3, the line with 3 kHz), only the mode with m = 1 (EO = 13) can propagate undiminished downstream (the pulsation sensors were located approx. 1.5 times the chord length downstream from turbine blade trailing edge).
3.2. Fundamental Vibration Mode Detection in an Axial Turbine
The maximum pulsation peak amplitude in Figure 5, radial turbine fundamental mode, was around 8 mbar02P, which can be clearly distinguished above the noise level. In the case of an axial turbine stage, however, despite the fact that a comparably good correlation like that in Figure 5 between BTT ND trace and pulsation engine order analysis could be found in some cases, the detected absolute pulsation amplitudes were low—in the range of 1–2 mbar02P (even when the turbine blade deflection amplitude entered a critical range). This absolute pulsation amplitude difference between radial and axial turbine fundamental modes comes from the fractional factor τ discussed in Chapter 2. Referring to Figure 4, and taking the mode shape of typical fundamental vibration into account, it can be recognized that the oscillating blade surface area of a radial turbine is considerably wider than that of an axial turbine, hence τradial > τaxial.
3.3. Nozzle-Ring-Induced Higher Vibration Mode Detection
Figure 7 displays the same kind of comparison as Figure 5, but for a nozzle-ring-vane-induced higher vibration mode of an axial turbine stage. Because this turbine stage is mistuned, and nozzle ring vanes are unevenly distributed, a correlation as good as that in Figure 5 could not be obtained. However, by comparing test results between the widest and the narrowest throat nozzle ring vane configuration (with the narrowest one, the excitation force on vane number order will be the highest), it is obvious that the pulsation measurement reacts to the blade vibration: where the blade deflection amplitude rose by factor of 20, measured pulsation amplitude increased by factor of 10 (amplitude with narrowest nozzle ring throat/that with widest nozzle ring throat). For a nozzle-ring-induced higher mode blade vibration of an axial turbine stage (B > 30), tracking the pulsation amplitude trend on an engine order of 2 × B has been found to work in most cases, which is supported by the same theoretical considerations given in Chapter 3.1. The frequency range of the pulsation peak trend on EO66 in Figure 7 was higher than 40 kHz. At this high-frequency range (the applied piezoelectric pulsation sensor has its mechanical eigenfrequency at around 50 kHz.), various airborne acoustic resonances are present, which could distort the pulsation trend aiming to track the acoustic radiation from the turbine blades.
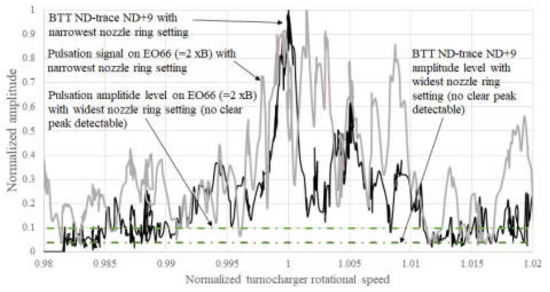
Figure 7.
Comparison between BTT ND +9 trace and pulsation amplitude trace on EO66 in a sweep test through a nozzle-ring-vane-induced higher vibration mode along EO24, with narrowest and widest nozzle ring throat configurations (axial turbine stage, B = 33).
When using an accelerometer (the commercially available high-temperature accelerometer has its eigenfrequency at around 10 kHz), additional interference from casing resonances will be introduced. Furthermore, an accelerometer senses not only the casing vibration caused by the propagating acoustic radiation from turbine vibration underneath its installation position but also the structural vibration of “classical” blade-passing frequencies generated by the gap between turbine tip and casing. Because of this additional unwanted source, which potentially causes further trend distortions, accelerometers, or other methods that sense the casing vibration, have clear disadvantages compared to pulsation measurement.
3.4. Long-Term Field Experience
A two-stage turbocharged engine, operating with HFO, was chosen for a long-term vibration monitoring demonstration. Vibration behaviour monitoring of the high-pressure stage radial turbine by means of a piezoelectric pulsation sensor was of principal interest. The applied sensor has endured over one year of operation, delivering acceptably good signals. The sensor’s sensing membrane is flush with the sensor head, so that even when some dirt sticks to the membrane, the measurement itself does not seem to be unacceptably impaired. The chosen measurement position, at the turbine outlet, where the temperature is not at such a level that the HFO residual will become sticky, may have enhanced the long-term endurance of the sensor.
Figure 8 shows a statistical data analysis of the fundamental mode detection, where data were gathered over five months, and each resonance passage has been extracted from the stored data. This particular engine will not stay at this resonance in the normal operation condition, so just ca. 240 instances of resonance passages have been counted. There were some cases with a pulsation amplitude up to 50 mbar02P, which, at first sight, seems to be quite high compared with the results with the other radial turbine presented in Figure 5 and Figure 6.
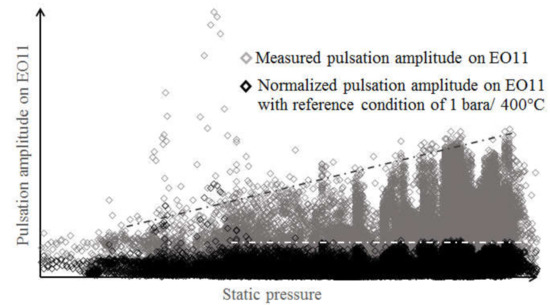
Figure 8.
Pulsation amplitude dependence on static pressure, >240 fundamental-mode resonance passages have been recorded over five months in a high-pressure radial turbine stage.
In the high-pressure turbine of a two-stage turbocharging system, the static pressure level in a resonance passage can vary remarkably (in Figure 8, the signal at the right-hand side of the x-axis is about twice that at the origin), and from the measured raw pulsation amplitude, a certain linear dependence on static pressure is visible (refer to the black dotted line for orientation). From Equation (4), the pulsation amplitude radiated by the blade vibration depends on the factor . By defining a reference condition, the measured pulsation amplitude can be normalized, as displayed in Figure 8 (black diamonds). By adopting the normalization, except in some cases, the pulsation amplitude became stable for the entire test period, and not dependent on the static pressure/temperature level.
4. Conclusions
This study provides sound evidence that integral mode turbine blade vibration can be principally detected by a pulsation sensor installed on the stator side away from turbine trailing edge, when vibration stress reaches a critical level from an HCF point of view. It also delivers, based on the Mengle’s theory, practical technical guidelines on how to extract the part of airborne acoustic radiation in the pulsation signal which originates from an integral mode blade vibration.
The applicability of this approach for long-term blade vibration monitoring must be assessed case by case. Generally, it can be employed as condition-based monitoring, by referring the pulsation amplitude level at a potentially critical resonance crossing with nominal condition. Further restriction may be that the blade vibration stress must increase remarkably, by at least 1.5 times of nominal condition, when the vibration stress reaches a critical level. In turbocharger application, such cases do actually exist. This approach will gain higher significance when several similar installations should be monitored. In such a case, by installing both BTT sensors and a pulsation sensor in one installation, while others can be equipped only with a pulsation sensor, the functionalities of pulsation measurement and analysis can be first checked by referring to BTT measurement results. The expenditures for installing a pulsation measurement system are considerably lower than that for a BTT system. Furthermore, the pulsation signal contains other relevant information, such as low-frequency pulsation originating from a reciprocating engine.
Funding
This research received no external funding.
Conflicts of Interest
The authors declare no conflict of interest.
Nomenclature
| Adefl | Blade deflection amplitude |
| B | Blade number |
| BTT | Blade Tip Timing |
| CFD | Computational Fluid Dynamics |
| EO | Engine or Excitation Order |
| FEM | Finite Element Method |
| FFT | First Fourier Transform |
| HCF | High Cycle Fatigue |
| HFO | Heavy Fuel Oil |
| LSMF | Least Squares Model Fit |
| ND | Nodal Diameter |
| T0 | Bulk gas temperature |
| U | Axial bulk gas flow rate |
| V | Circumferential bulk gas flow rate (= blade tip velocity) |
| Ω | Rotor rotational speed |
| Speed of sound | |
| k | Traveling-wave mode number (in rotor structure) |
| kx | Airborne acoustic wave number in the axial direction |
| ky | Wave number between blades in circumferential direction |
| m | Integer (Fourier coefficient order for airborne wave between blades) |
| p | Pulsation amplitude |
| s | Spacing between two blades |
| ρ0 | Density of medium |
| τ | Fraction of gas flow travel time on the vibrating surface and one blade vibration cycle duration |
| ω | Blade vibration frequency (in rotating frame) |
| ω’ | Observed frequency (in stationary frame) |
References
- Kurkov, A. Flutter Spectral Measurements Using Stationary Pressure Transducers. J. Eng. Power. 1981, 103, 461–467. [Google Scholar] [CrossRef][Green Version]
- Kurkov, A.P. Formulation of Blade Flutter Spectral Analyses in Stationary Reference Frame; NASA TP-2296; NASA: Washington, DC, USA, March 1984. [Google Scholar]
- Mengle, V.G. Acoustic spectra and detection of vibrating rotor blades including row-to-row interference. Presented at the AIAA 13th Aeroacoustics Conference, Tallahassee, FL, USA, 22–24 October 1990. [Google Scholar]
- Gill, J.D.; Capece, V.R.; Fost, R.B. Experimental methods applied in a study of stall flutter in an axial flow fan. Shock. Vib. 2004, 11, 597–613. [Google Scholar] [CrossRef][Green Version]
- Murray, W.L., III; Key, N.L. Detection of Rotor Forced Response Vibrations Using Stationary Pressure Transducers in a Multistage Axial Compressor. Int. J. Rotating Mach. 2015, 2015, 198534. [Google Scholar] [CrossRef]
- Agilis Measurement Systems. Available online: https://agilismeasurementsystems.com/ (accessed on 20 January 2020).
© 2020 by the author. Licensee MDPI, Basel, Switzerland. This article is an open access article distributed under the terms and conditions of the Creative Commons Attribution (CC BY-NC-ND) license (http://creativecommons.org/licenses/by-nc-nd/4.0/).