This section introduces first the metamodel-assisted optimization method with a focus on the database and the model update. Then, Kriging is presented and some aspects are highlighted such as the exploration versus exploitation approach and the way failed simulations are treated.
2.1. Metamodel-Assisted Evolutionary Algorithm (MAEA)
Algorithm 1 shows the MAEA optimization method, which contains two major loops. The outer loop is called an iteration, while the inner loop within the Differential Evolution (DE) is called a generation. Since the metamodel evaluation is fast, many metamodel evaluations are possible during the DE process. Usually, a very large number of generations (1000–10,000) can be performed on large populations (40–100 individuals) within seconds.
| Algorithm 1 Single-objective metamodel assisted differential evolution. |
- 1:
create an initial database - 2:
for to do - 3:
train metamodel on database - 4:
perform single-objective DE by using the metamodel - 5:
evaluate the best individual by expensive evaluation tool and add to the database - 6:
end for
|
The database stores the relationship between design vectors (input) and performance vectors (output) of the designs already analyzed by the accurate evaluation. Several geometries are analyzed at the start of the optimization algorithm by the accurate evaluation in order to train the first metamodel. The accuracy of the Kriging predictions strongly depends on the information contained in the database. The Design of Experiments (DOE) method maximizes the amount of information contained in the database for a limited number of computations and is used in the present optimization algorithm [
11]. The DOE technique considers that each of the
k design variables can take two values, fixed at 25% and 75% of the maximum design range. The maximum amount of information can be established by evaluating each possible combination of the design variables, which is called a full factorial design. This would yield a total of
experiments, which becomes rapidly unfeasible for a larger number of design variables
k. The current work uses a
fractional factorial design, where only a fraction
of the full factorial design is analyzed with
. One additional computation is made to evaluate the central design with all parameters at 50% of their range. This results in a total of
evaluations.
Once the database is available and the first Kriging model has been trained, the algorithm searches for the next sample to enrich the database. There are different strategies to select the next sample to be analyzed. The simplest approach, labeled Prediction Minimization, selects the best design according to the metamodel prediction. The newly evaluated individual which is added to the database improves the accuracy of the model in the region where previously the evolutionary algorithm was predicting a minimum. This feedback is the most essential part of the algorithm as it makes the system self-learning.
2.2. Kriging Metamodel
The mathematical form of a Kriging model has two parts, as shown in Equation (
1). The first part is a linear regression with an arbitrary number
k of regression functions
, which tries to catch the main trend of the response.
For the
ordinary Kriging, only one regression function is used (
), namely the process mean (
). The second part of Equation (
1),
, is a model of a Gaussian random process with zero mean with a covariance of
assumed to be [
12]:
with
the process variance and
a
correlation function, which depends only on the distance
. The correlation function is chosen as a product of one-dimensional correlation functions:
The parameters
and the function
are determined such that
is the best linear unbiased predictor (BLUP). A linear estimator means that
can be written as a linear combination of the observation samples and the unbiasedness constraint means that the mean error of the approximation is zero. The best linear unbiased predictor is considered the predictor with minimal mean square error (MSE) of the predictions,
The BLUP formulation when simplified for ordinary Kriging reads as follows [
13]:
with
the vector of the spatial correlation between the unknown point
and all known samples
and finally
the correlation matrix which contains the evaluation of spatial correlation function at each combination of samples:
Note that usually, the diagonal elements of the correlation matrix are equal to one, while off-diagonal entries are between 0 and 1 and get closer to 1 when
is closer to
. The parameters used to build
serve as tuning parameters to improve the prediction accuracy of the method. The correlation function can take different forms: exponential, Cubic Spline, Matèrn, Gaussian, etc. [
14] and the Gaussian correlation, one of the most used correlations [
6], reads as follows:
The hyperparameters
, the variance
and the process mean
are tuning parameters of the Kriging model and are found by maximizing the Likelihood Estimation (LE):
It is possible to find the values of
and
that maximize LE directly by setting the partial derivative of the likelihood equal to zero:
The value of
that maximizes LE, however, cannot be calculated analytically and has to be obtained numerically during the model
training. Two training processes are established: Maximum Likelihood Estimation (MLE) and Cross Validation (CR). MLE is faster but yields generally lower levels of accuracy [
15] as it assumes the samples behave as a Gaussian process. Cross validation provides better accuracy by minimizing a leave-one-out error but is therefore very costly, especially for large training sets. In this work, the training uses MLE on the concentrated log-likelihood
instead of Equation (
9), which simplifies the LE expression but results in the same optimal
:
Typically, a bounded optimization problem is solved to find the
hyperparameter from a predefined interval
–
] with the highest likelihood using the definition of the process variance and mean of Equation (
10). The lower bound
and the upper bound
impact the quality of the kriging interpolation. When
, the correlation matrix approaches a matrix of ones, as clear from Equation (
8), and the prediction is reduced to the mean value of all samples. On the other hand, for large values of
, the correlation matrix approaches the identity matrix and the prediction is still interpolating the samples but equal to the mean value for any new prediction (see [
16] for more details on the effect of the hyperparameters).
For the bounded Kriging, the MLE-based training follows a two-step strategy. First, the hyperparameters intervals are scanned to find a interval that guarantees an interpolation error lower than 1%. This step guarantees a value high enough to have an acceptable prediction error. When a nugget (a nugget or regularization parameter is a small number added to the diagonal of the correlation matrix.) is used as in this work, the check of the interpolation error guarantees also an acceptable . Next, a search is done to find the optimal d hyperparameters within the interval defined at Step 1. The MLE uses a gradient-based optimization method (L-BFGS) from the NLOPT library, which performs a bounded hyperparameter optimization. The first step of this procedure differentiate the bounded Kriging from ordinary Kriging, for the latter the lower and upper bounds and are set based on heuristic and trial-and-error.
2.3. Exploration Versus Exploitation
The metamodel-assisted optimization algorithm builds first an interpolation around the available samples from the database. During subsequent iterations, the metamodel proposes new samples for the high-fidelity evaluation. These samples refine gradually the models in certain areas of the objective space. Two main trends are possible: either the model refines the area next to the optimum of the last iteration or it explores areas where the model accuracy is still low. This step is called the infill criterion or acquisition.
2.3.1. Prediction Minimization (PM)
This criterion, especially suited for dense initial databases, chooses the design with the optimal prediction (e.g., minimum loss or highest efficiency). A large initial database covering well the multidimensional design space leads, in fact, to a good overall prediction accuracy. The learning is in general very effective and the metamodel-assisted optimizer converges rapidly to an optimum, which is likely to be a global one in case a global search algorithm is used.
In realistic settings, however, the initial database is not dense enough as the high-fidelity evaluation is time-consuming and the required number of design evaluations scales up exponentially with the number of design variables (curse of dimensionality). A pure exploitative infill criterion steers hence the metamodel-assisted optimizer toward a local optimum when starting from sparse data and very likely will not search in unexplored regions where a global minimum can be hidden (see
Figure 1).
2.3.2. Maximum Entropy
Unlike the PM criterion, the
Maximum Entropy criterion chooses the design with the maximum uncertainty or variance
(see Equation (
12)) on the prediction and does not consult the objective value.
The algorithm is then space-filling and works on improving the general prediction accuracy without using the system response of evaluated samples for the next infill. In practice, the metamodel-assisted optimizer with a variance maximization criterion needs many high-fidelity evaluations, especially for high-dimensional problems. Moreover, many explored areas are likely to be of low interest but need to be investigated to ensure that no potential optimum is missed, which slows down the optimizer convergence. It is more interesting to explore areas of the design space only when it is likely that they will improve the objective function. The next criterion tackles this issue.
2.3.3. Expected Improvement (EI)
The EI criterion quantifies the expected improvement I in a certain location and the MAEA algorithm uses the information to search for the location of the highest expected improvement.
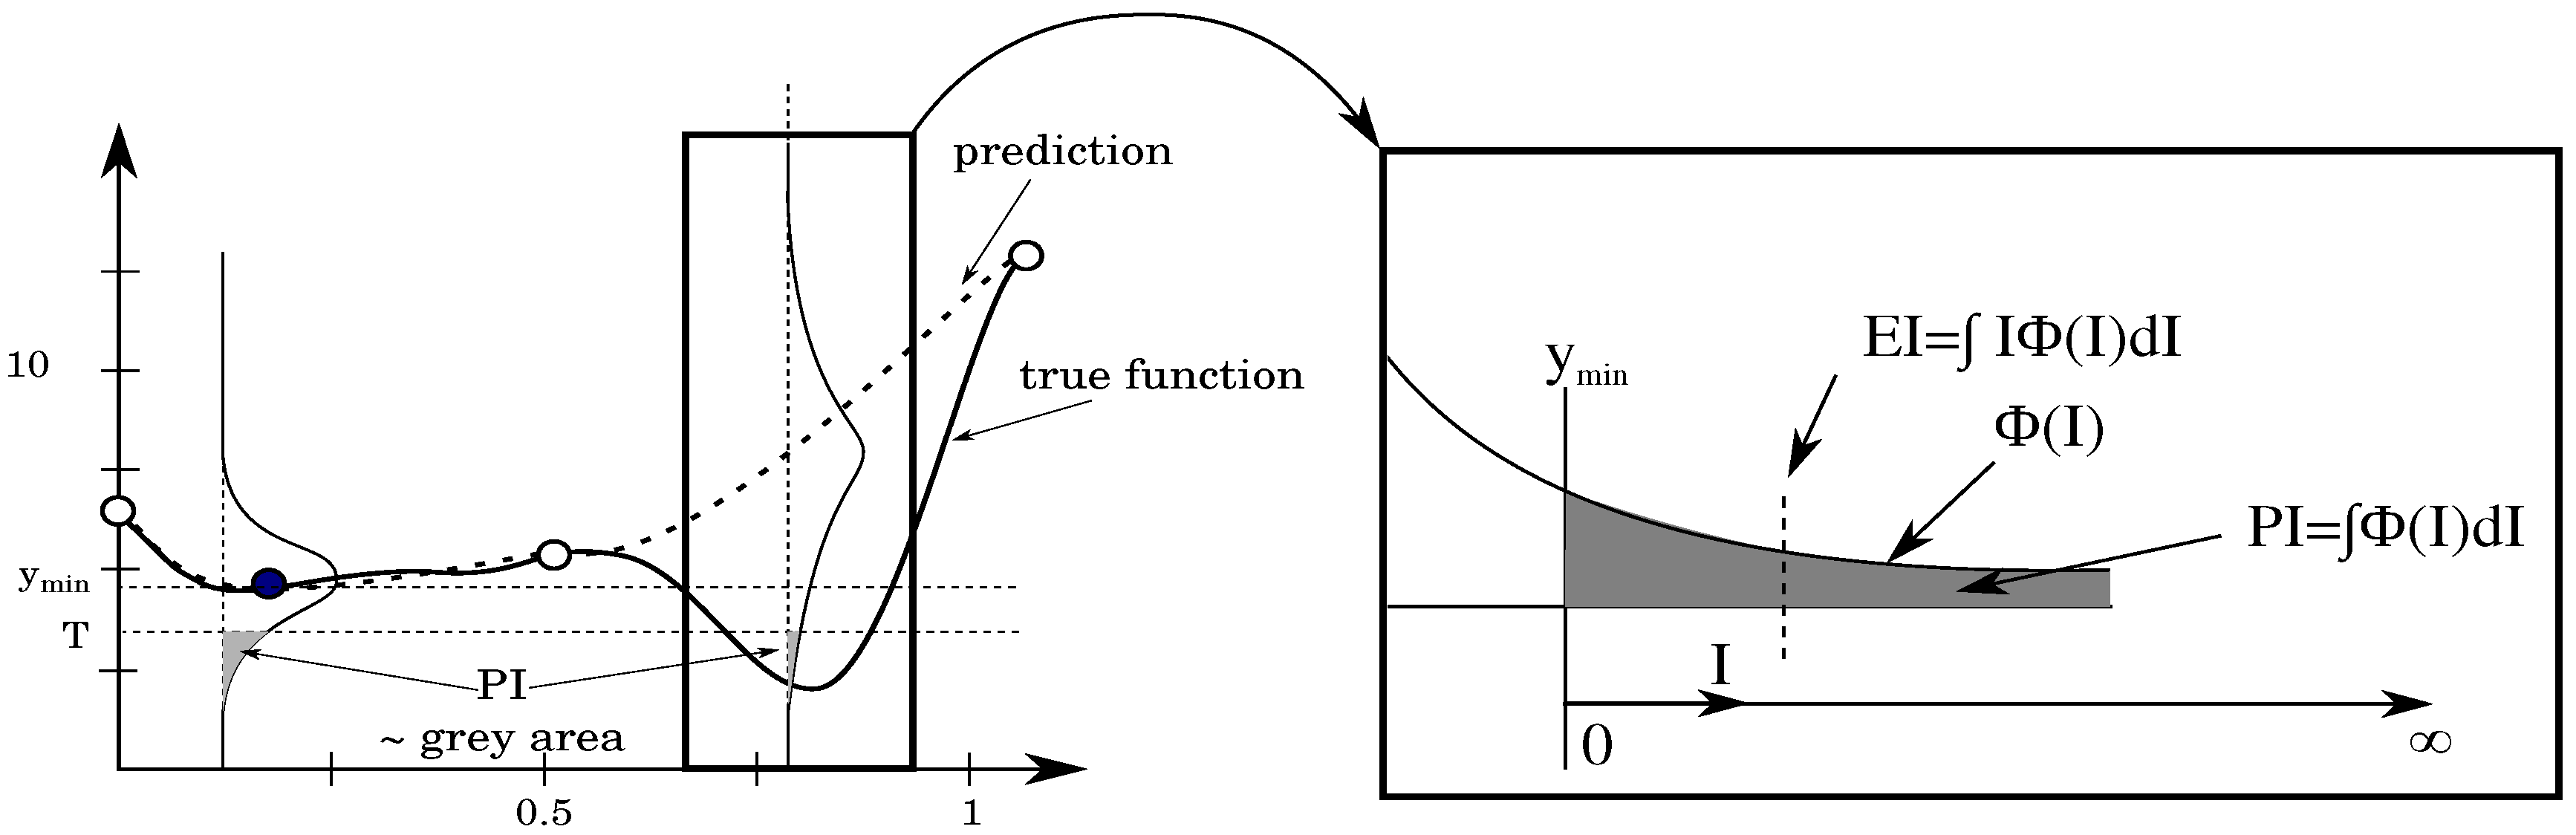
To visualize the expected improvement, one needs to look at the probability density function for a given
x value, as shown in
Figure 2. The mean value is given by
while the the best value in the current set of samples is shown by
. The probability that the prediction is equal to
y for this
x value is given by:
We are of course only interested in
y-values that are smaller than
. We introduce a new coordinate axis
I that starts from
and goes further to smaller
y-values. Each value
I corresponds to a certain improvement and has a probability of improvement equal to [
14]:
The interest now goes to the mean value of I. Small values of
I have a larger probability of occurring but larger values of
I can still occur with significant probability if the variance
is large. The mean value of the distribution
is the expected improvement (EI) and is given by:
When integrated by part, the latter equation has following form:
where
.
After rearrangement, the EI reads as follows:
Schonlau [
17] proved that EI-based metamodel-assisted optimizers can find a global optimum after a finite number of iterations. The EI value is zero at sampled locations and might increase further from samples as the variance grows. These two factors result in a multimodal shape of the EI requiring special care to find the location in the design space with the highest EI value.
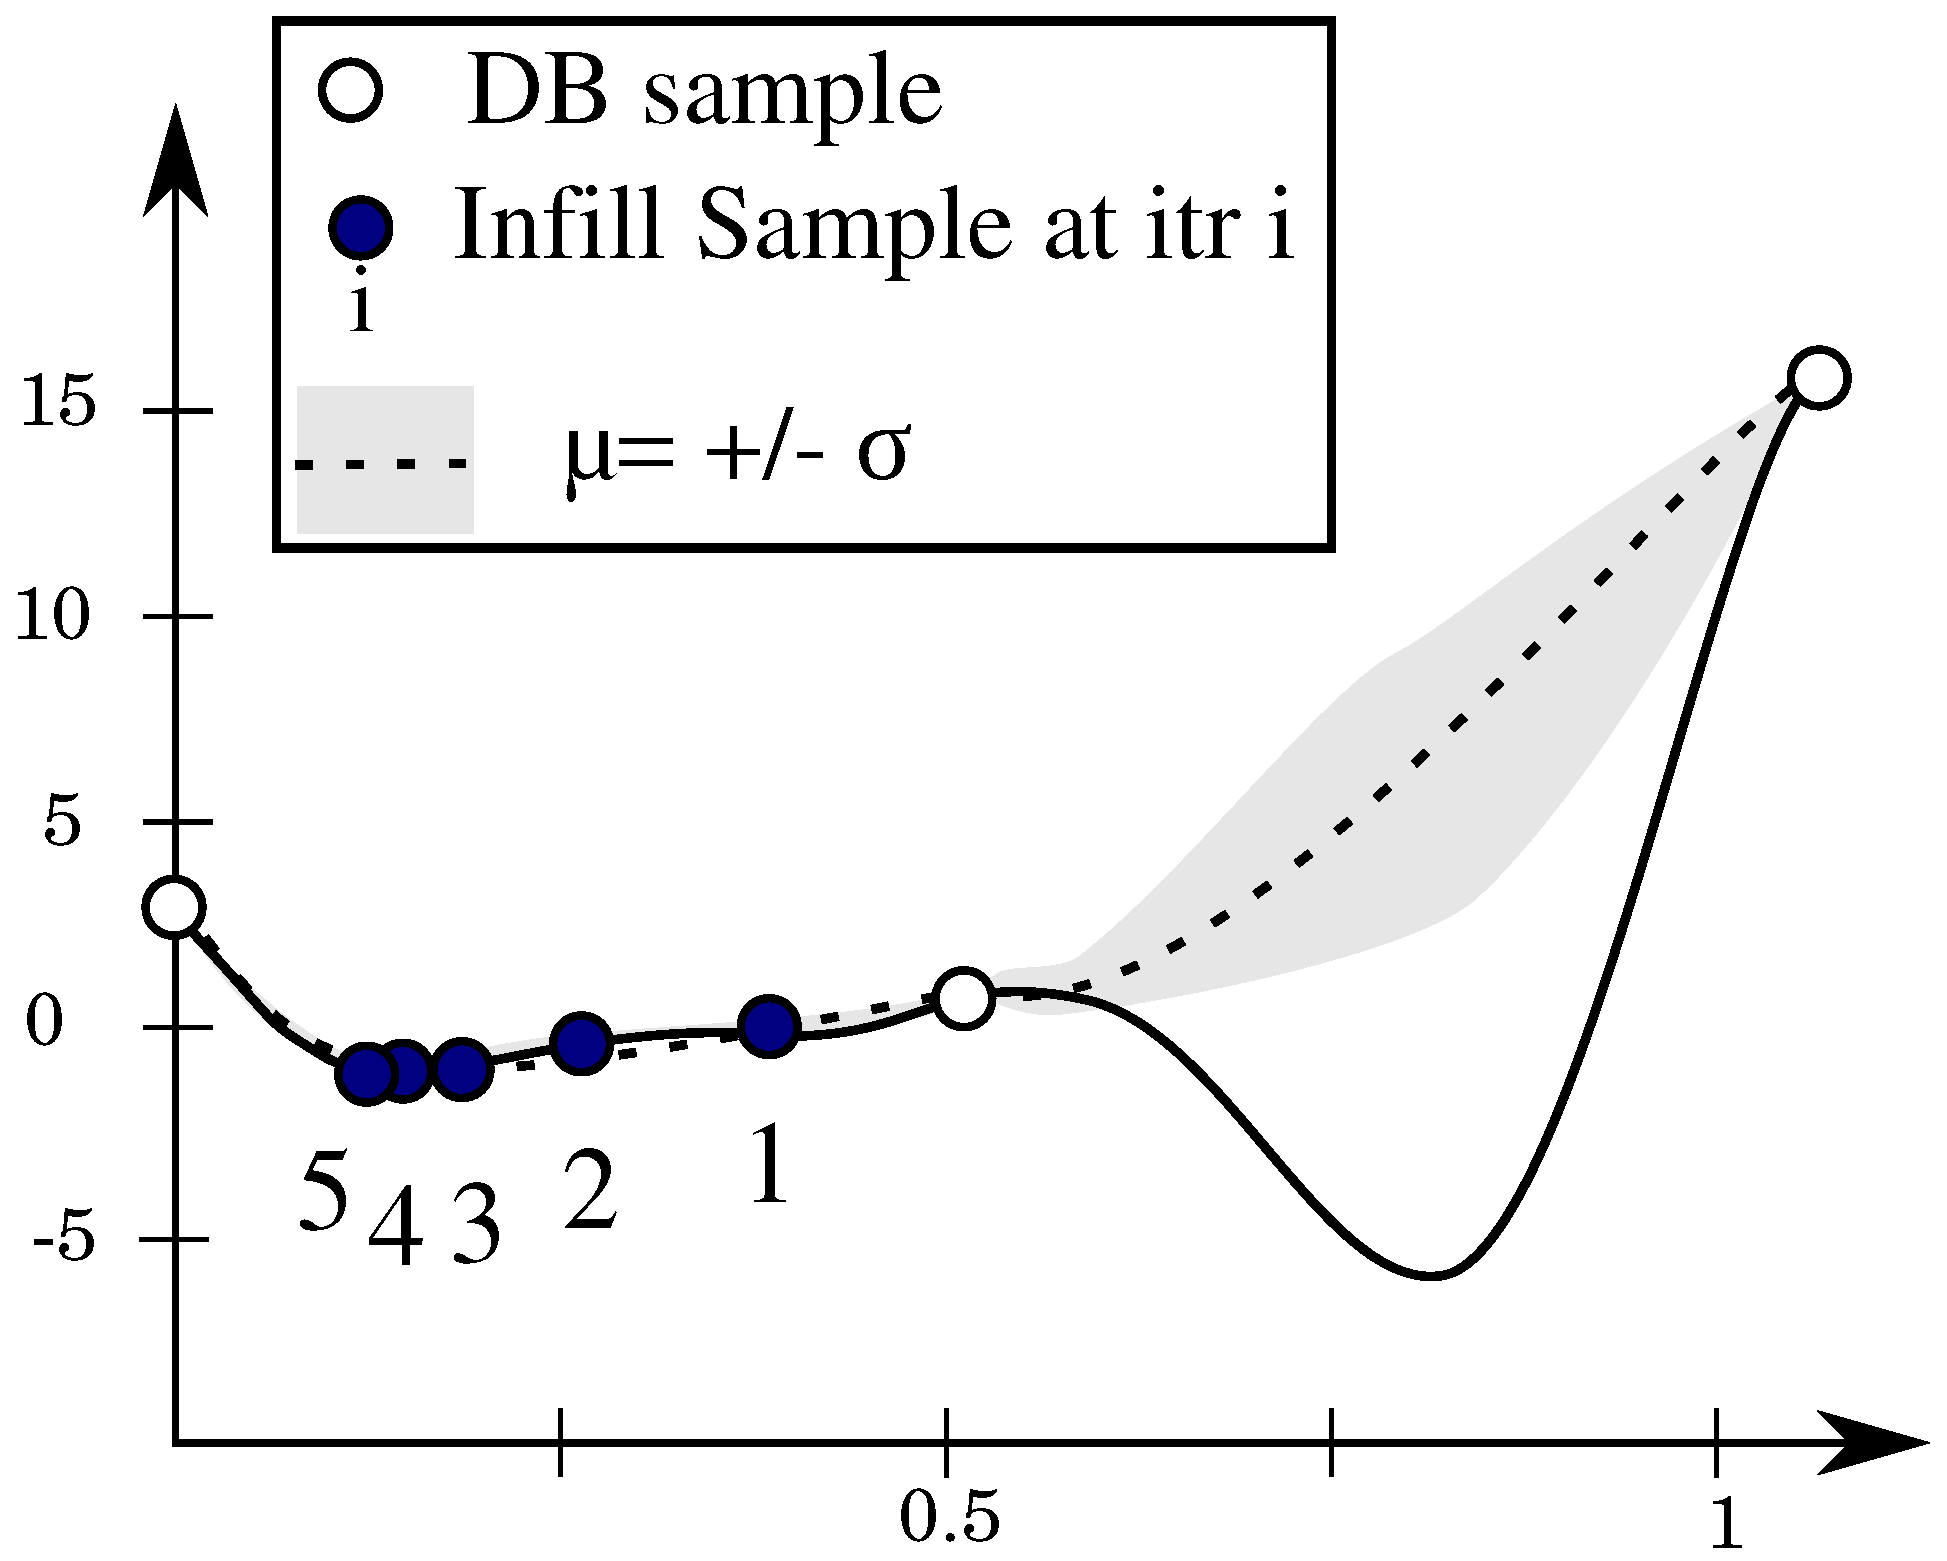
Figure 3 shows the convergence of the EI criterion on the Forrester function in a few iterations, unlike the prediction maximization criterion.
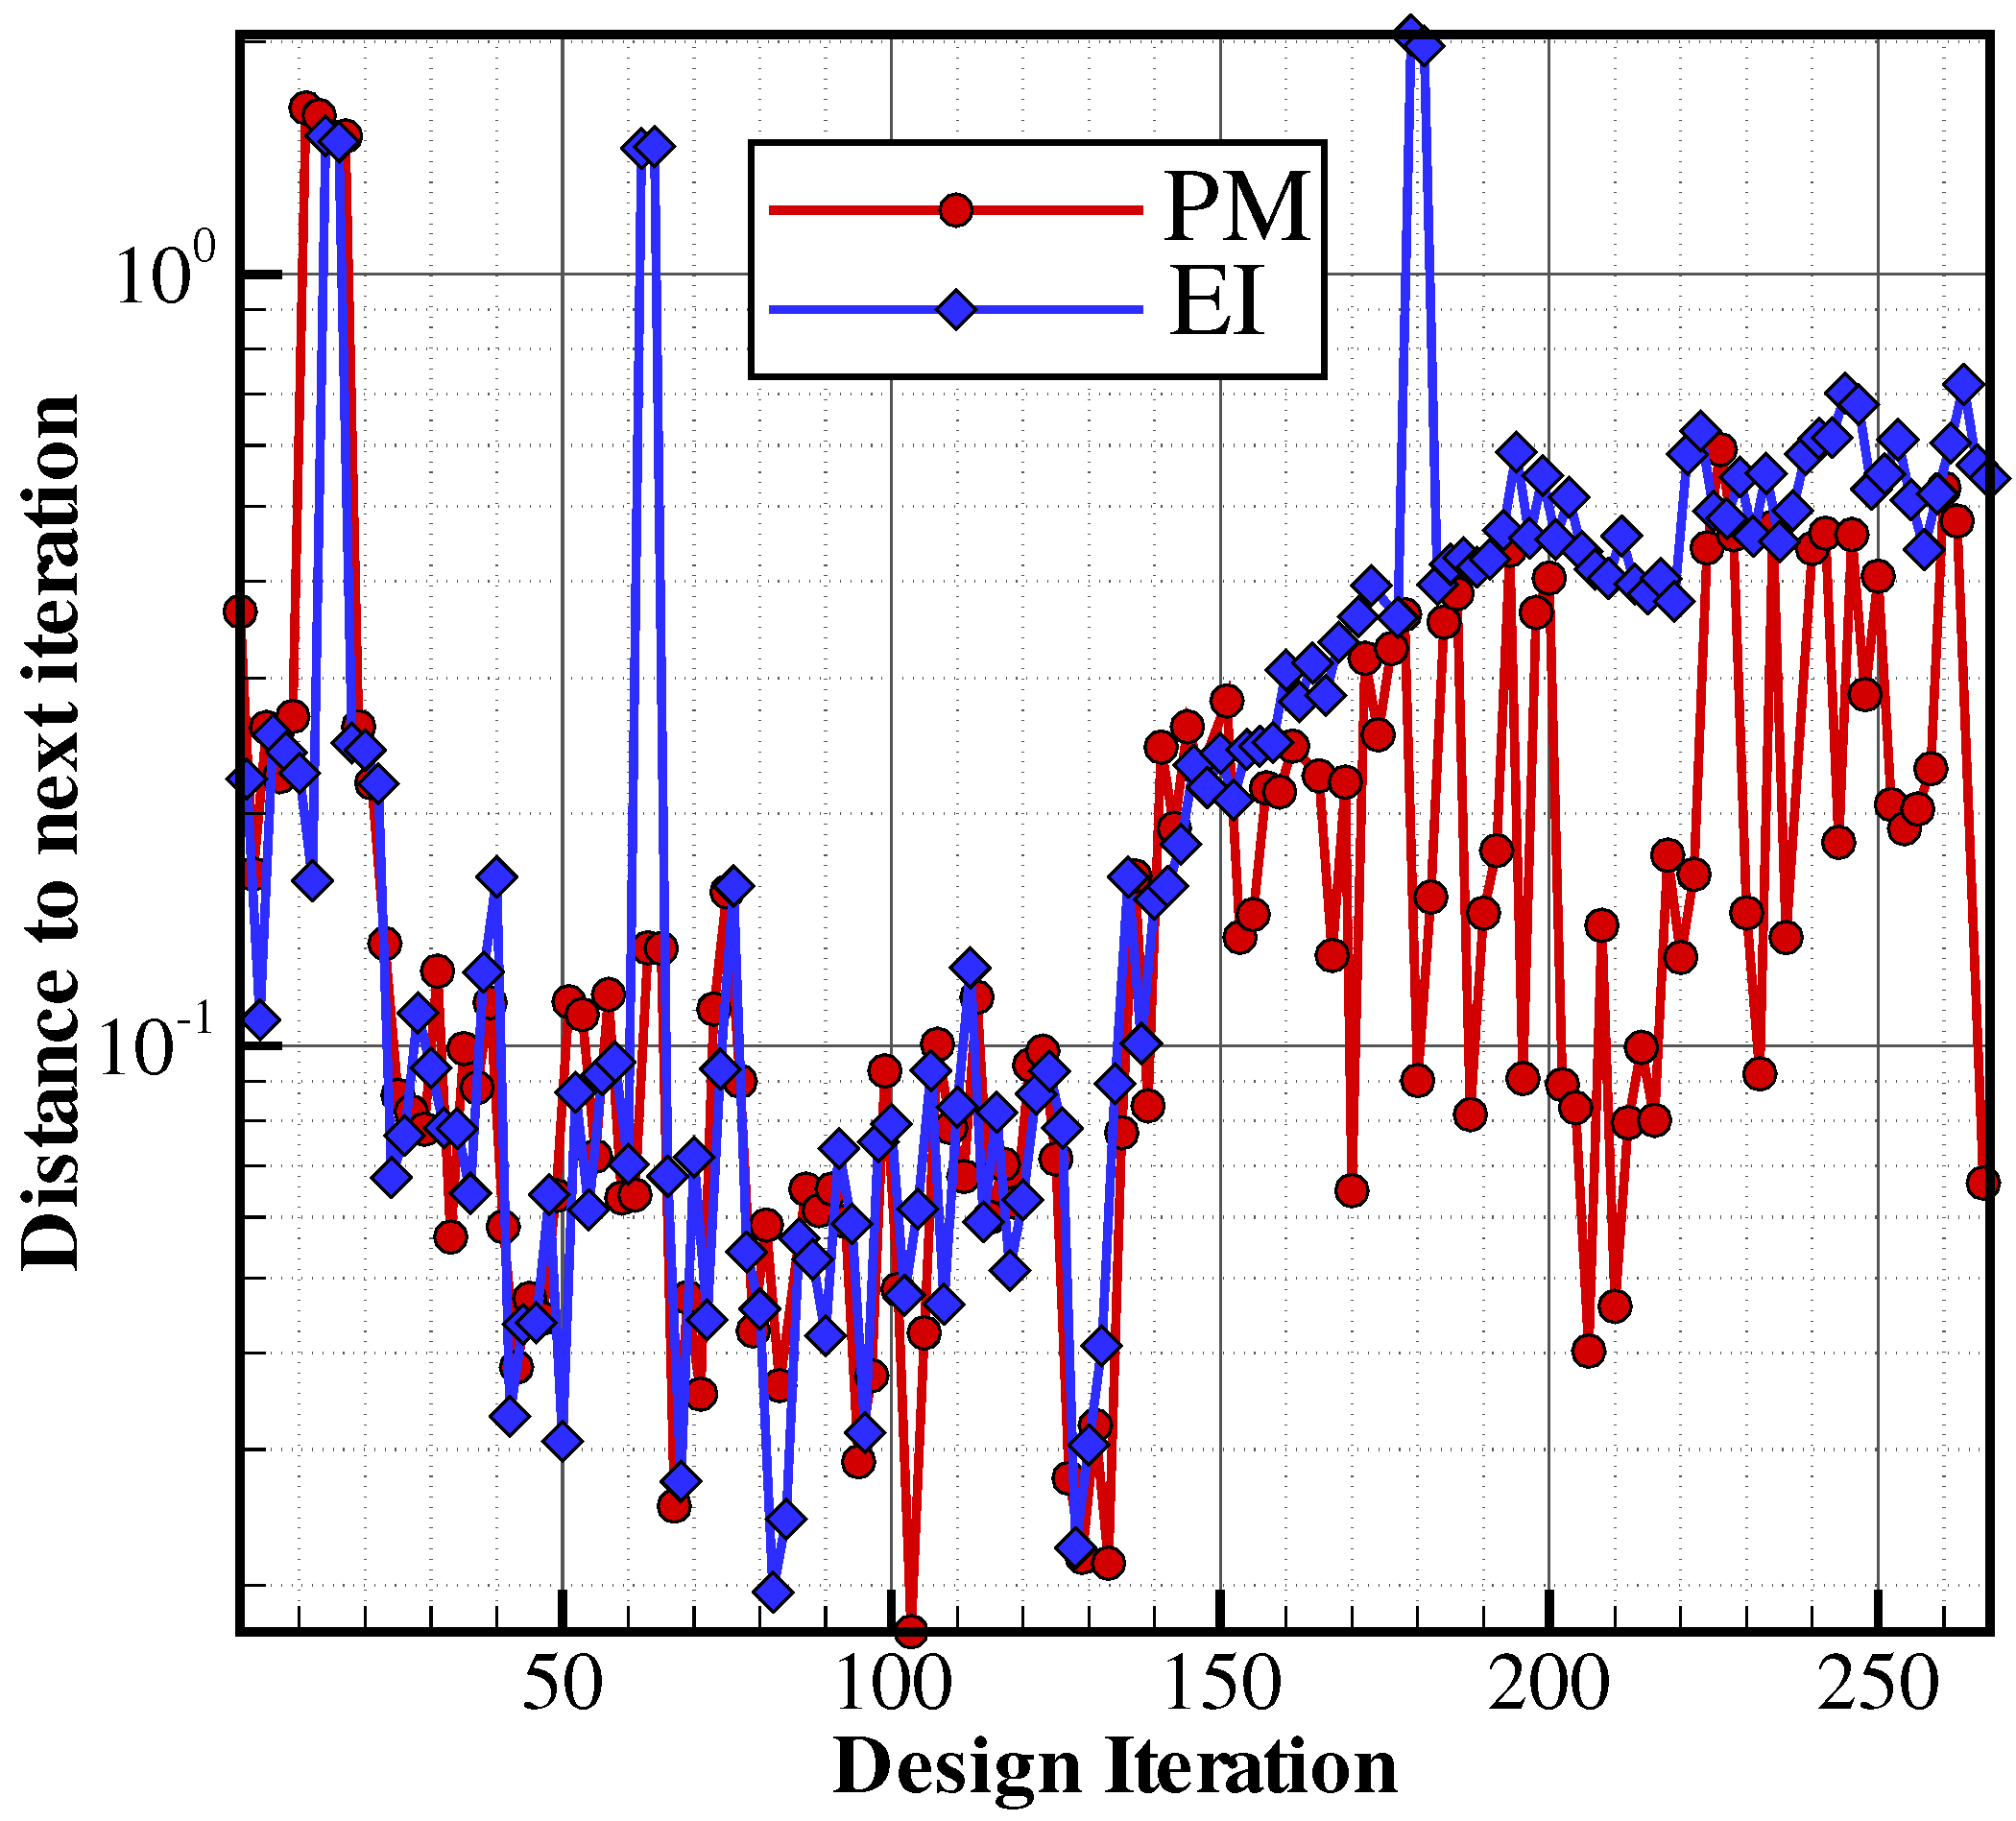
2.3.4. Cyclic Infill Criteria
It is possible, in a sequential optimization framework, to switch between different infill criteria during the iterative cycle. A cyclic search repeats the same cycle of acquisition, which is characterized by a number of iterations and a predefined criterion for each of these iterations. One cycle may start with few explorative samples, then gradually evolves towards fewer explorative samples and finally extremely exploitative samples, similar to Sasena [
15] (p. 84). A cycle, in this work, is composed of
m EI iterations followed by
n PM iterations with
small enough to allow multiple cycles during the optimization under limited computational budget. EI is responsible for the exploration of the design space to uncover promising regions, while the prediction minimization (PM) exploits the best design the metamodel can offer.
2.4. Treating Failed Evaluations
In a metamodel assisted optimization, the high-fidelity evaluation could be a CFD simulation, a stress analysis or any field-specific simulation. Simulations could diverge or even fail during the meshing phase, especially when challenging designs are generated or the design parameters are not properly bound. In that case, a decision has to be made on how to use the information from the failed simulation [
10].
Ignoring the failed designs creates an information loss and the optimizer is likely to propose very similar designs to the failing one. When noticing the failed simulation, it is possible to push the search out of the region by an intrusive penalty strategy or a non-intrusive recovery strategy. Assigning a penalty for the objective value of the failed design masks the failure region for the optimizer, so it does not approach the same area again. The penalty distorts, however, the objective space and may hide an optimum if located next to the area of the failed simulation.
The non-intrusive strategy, on the other hand, replaces the penalty with a dummy value generated by the surrogate model [
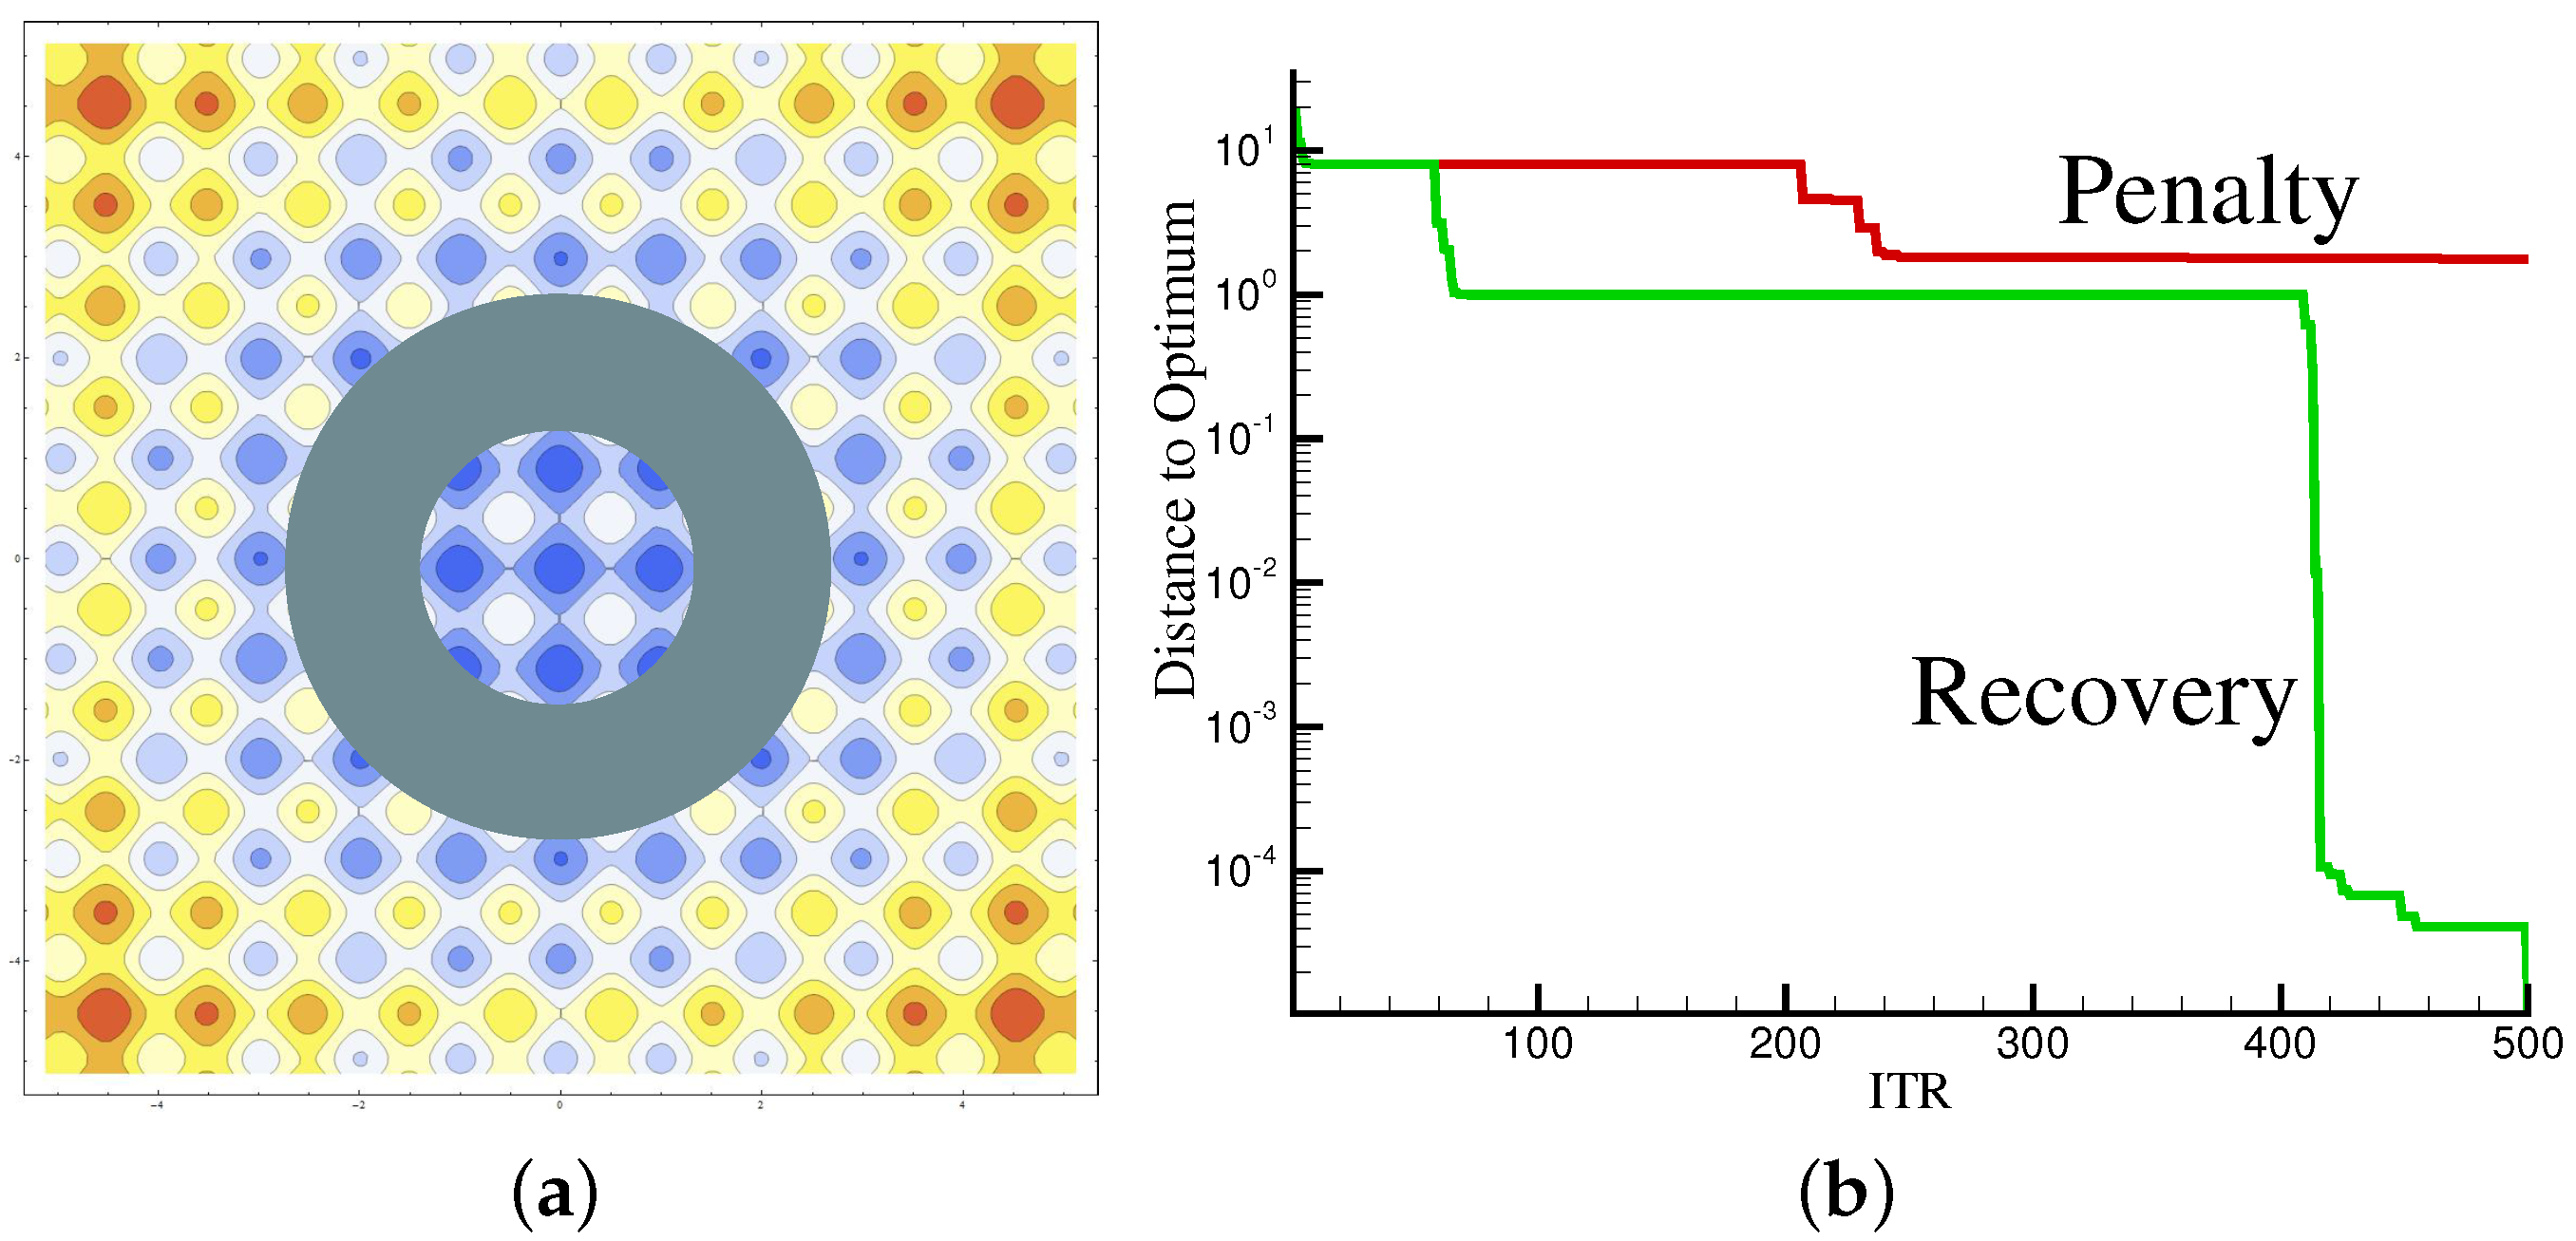
9]. Therefore, it is of utmost importance to use an explorative infill criterion, otherwise the surrogate could get trapped in an endless loop of proposing the same design which fails. The penalty and recovery approaches were tested on the Rastrigin analytical 2D function:
The Rasrigin function has a global shape influenced by the parabolic term
, which leads to the global optimum at
. The sinusoidal term creates waves on top of the parabolic shape, which render the optimization more difficult with many local optima. Moreover, the evaluation of the Rastrigin function has been slightly changed and, for certain ranges of the variables
and
, the evaluation of the function is set artificially to fail.
Figure 4a shows a contour plot of the Rastrigin 2D function with a ring to simulate failed evaluations surrounding the optimum in the center. Both presented approaches were tested and the results are shown in
Figure 4b. The penalty alternative distorts the objective space as expected and misses, therefore, the global optimum. While the penalty approach is trapped in a local minimum, the recovery approach is able to find the global optimum.
