1. Introduction
The onset and prediction of surge in axial and centrifugal compressors has been intensively investigated in recent decades. Surge, and particularly deep surge, adversely affects the lifespan of turbomachinery (Cumpsty [
1] ). To avoid surge occurrence, the physical mechanism that lead to flow reversal has to be understood. Tremendous work by Emmons in 1955 [
2], performed on axial and centrifugal compressors, showed that it is not only the compressor aerodynamics that influences the onset of surge. The attached downstream plenum also influences the mass flow rate at which surge occurs. By reducing the volume of the connected plenum, the surge line could be shifted towards a lower inlet Ma number for all speed lines. Following up these and several other findings in early turbomachinery research, surge mass flow rate was determined to be a system-dependent value. The Helmholtz resonator was an appropriate model to describe the physical mechanisms of surge. Greitzer developed this further in 1976 [
3]. Greitzer’s analytical approach is based on the transformation of kinetic energy in the suction sided piping system to potential energy in the plenum downstream of a single stage axial compressor. The set of equations is derived from one-dimensional conservation of mass and momentum. The suction side of the compressor is assumed to be incompressible; the pressured-sided plenum is compressible. This enables energy transformation and allows the system to oscillate. To validate the analytical assumptions, the theoretical approach was proven with various experimental measurements. Greitzer defined a dimensionless value
B, to determine system stability:
Surge is predicted for operation points with ; stable operating conditions occur for . In the compression system investigated by Greitzer, was 0.7. In several subsequent publications on surge, Greitzer’s theory was validated using plenum volume variations.
For each investigation, the critical value had to be adapted as the experimental setup varied. Several authors investigated the interaction of system components with the surge line concluding that:
Surge mass flow rate shifts with varying plenum sizes. Surge can be avoided with sufficiently small volume sizes.
The characteristics of both the compressor and the downstream throttle play an important role in the prediction of surge.
The focus of this investigation is the charged-air system for automotive applications. A major difference to axial industrial applications is the pneumatic compression system, which starts at ambient conditions and ends at the inlet valves of a piston engine. As there are several resistances in the suction and pressure sided piping of the compressor, Greitzer’s model meet its limits.
Components such as the air filter, a set of elbows and flow straighteners are part of the suction side of the centrifugal compressor. Interesting results were gathered by Kerres [
4], who assessed the impact of inlet pressure loss devices on the onset of surge. The surge mass flow rate of three compressor inlet configurations are compared: Straight inlet,
bend and a pressure drop device with straight inlet pipe. Although the compressor inflow is obstructed by a
elbow, the surge line shifts to lower mass flow rates independent of the clocking positioning of the bend relative to the compressor housing. An almost identical shift in the surge line could be achieved with an orifice, positioned in a straight inlet pipe. The inflow is assumed to be inhomogeneous for both configurations; however, increased map width could be detected. Similar results were investigated by Galindo et al. [
5,
6,
7], Hou et al. [
8], Elkamel [
9], Marelli et al. [
10] and Serrano [
11]. In contrast to Kerres’ results, Bayomi [
12] stated that map width enhancement is gained by assembling flow straighteners upstream of the compressor, providing a more homogeneous inflow.
Kerres and Bayomi reached different conclusion but addressed the fundamental turbomachinery question regarding which physical mechanism leads to the onset of surge. The charged-air system is divided into three categories to address the question: the compressor characteristic, the boundary conditions of the compressor, and the overall compression system. This paper relates to all three categories but focuses on the influence of the compression system on surge, with additional information on unsteady exit boundary conditions.
2. Experimental Setup
The surge model extension presented here is based on experimental observations gathered at the Institute of Gas Turbines and Aerospace Propulsion at TU Darmstadt. The hot gas stand at TU Darmstadt is an open-loop system. Pressurized air is heated with an electrical heater to a controlled turbine inlet temperature of 573 K, at a maximum pressure level of 4.5 bar. Turbine inlet mass flow is controlled by precise valves to adjust energy input and set rotor speed. An inductive sensor is used to record rotor speed at the turbine wheel. The bearing oil conditions are set to 363 K and 4 bar.
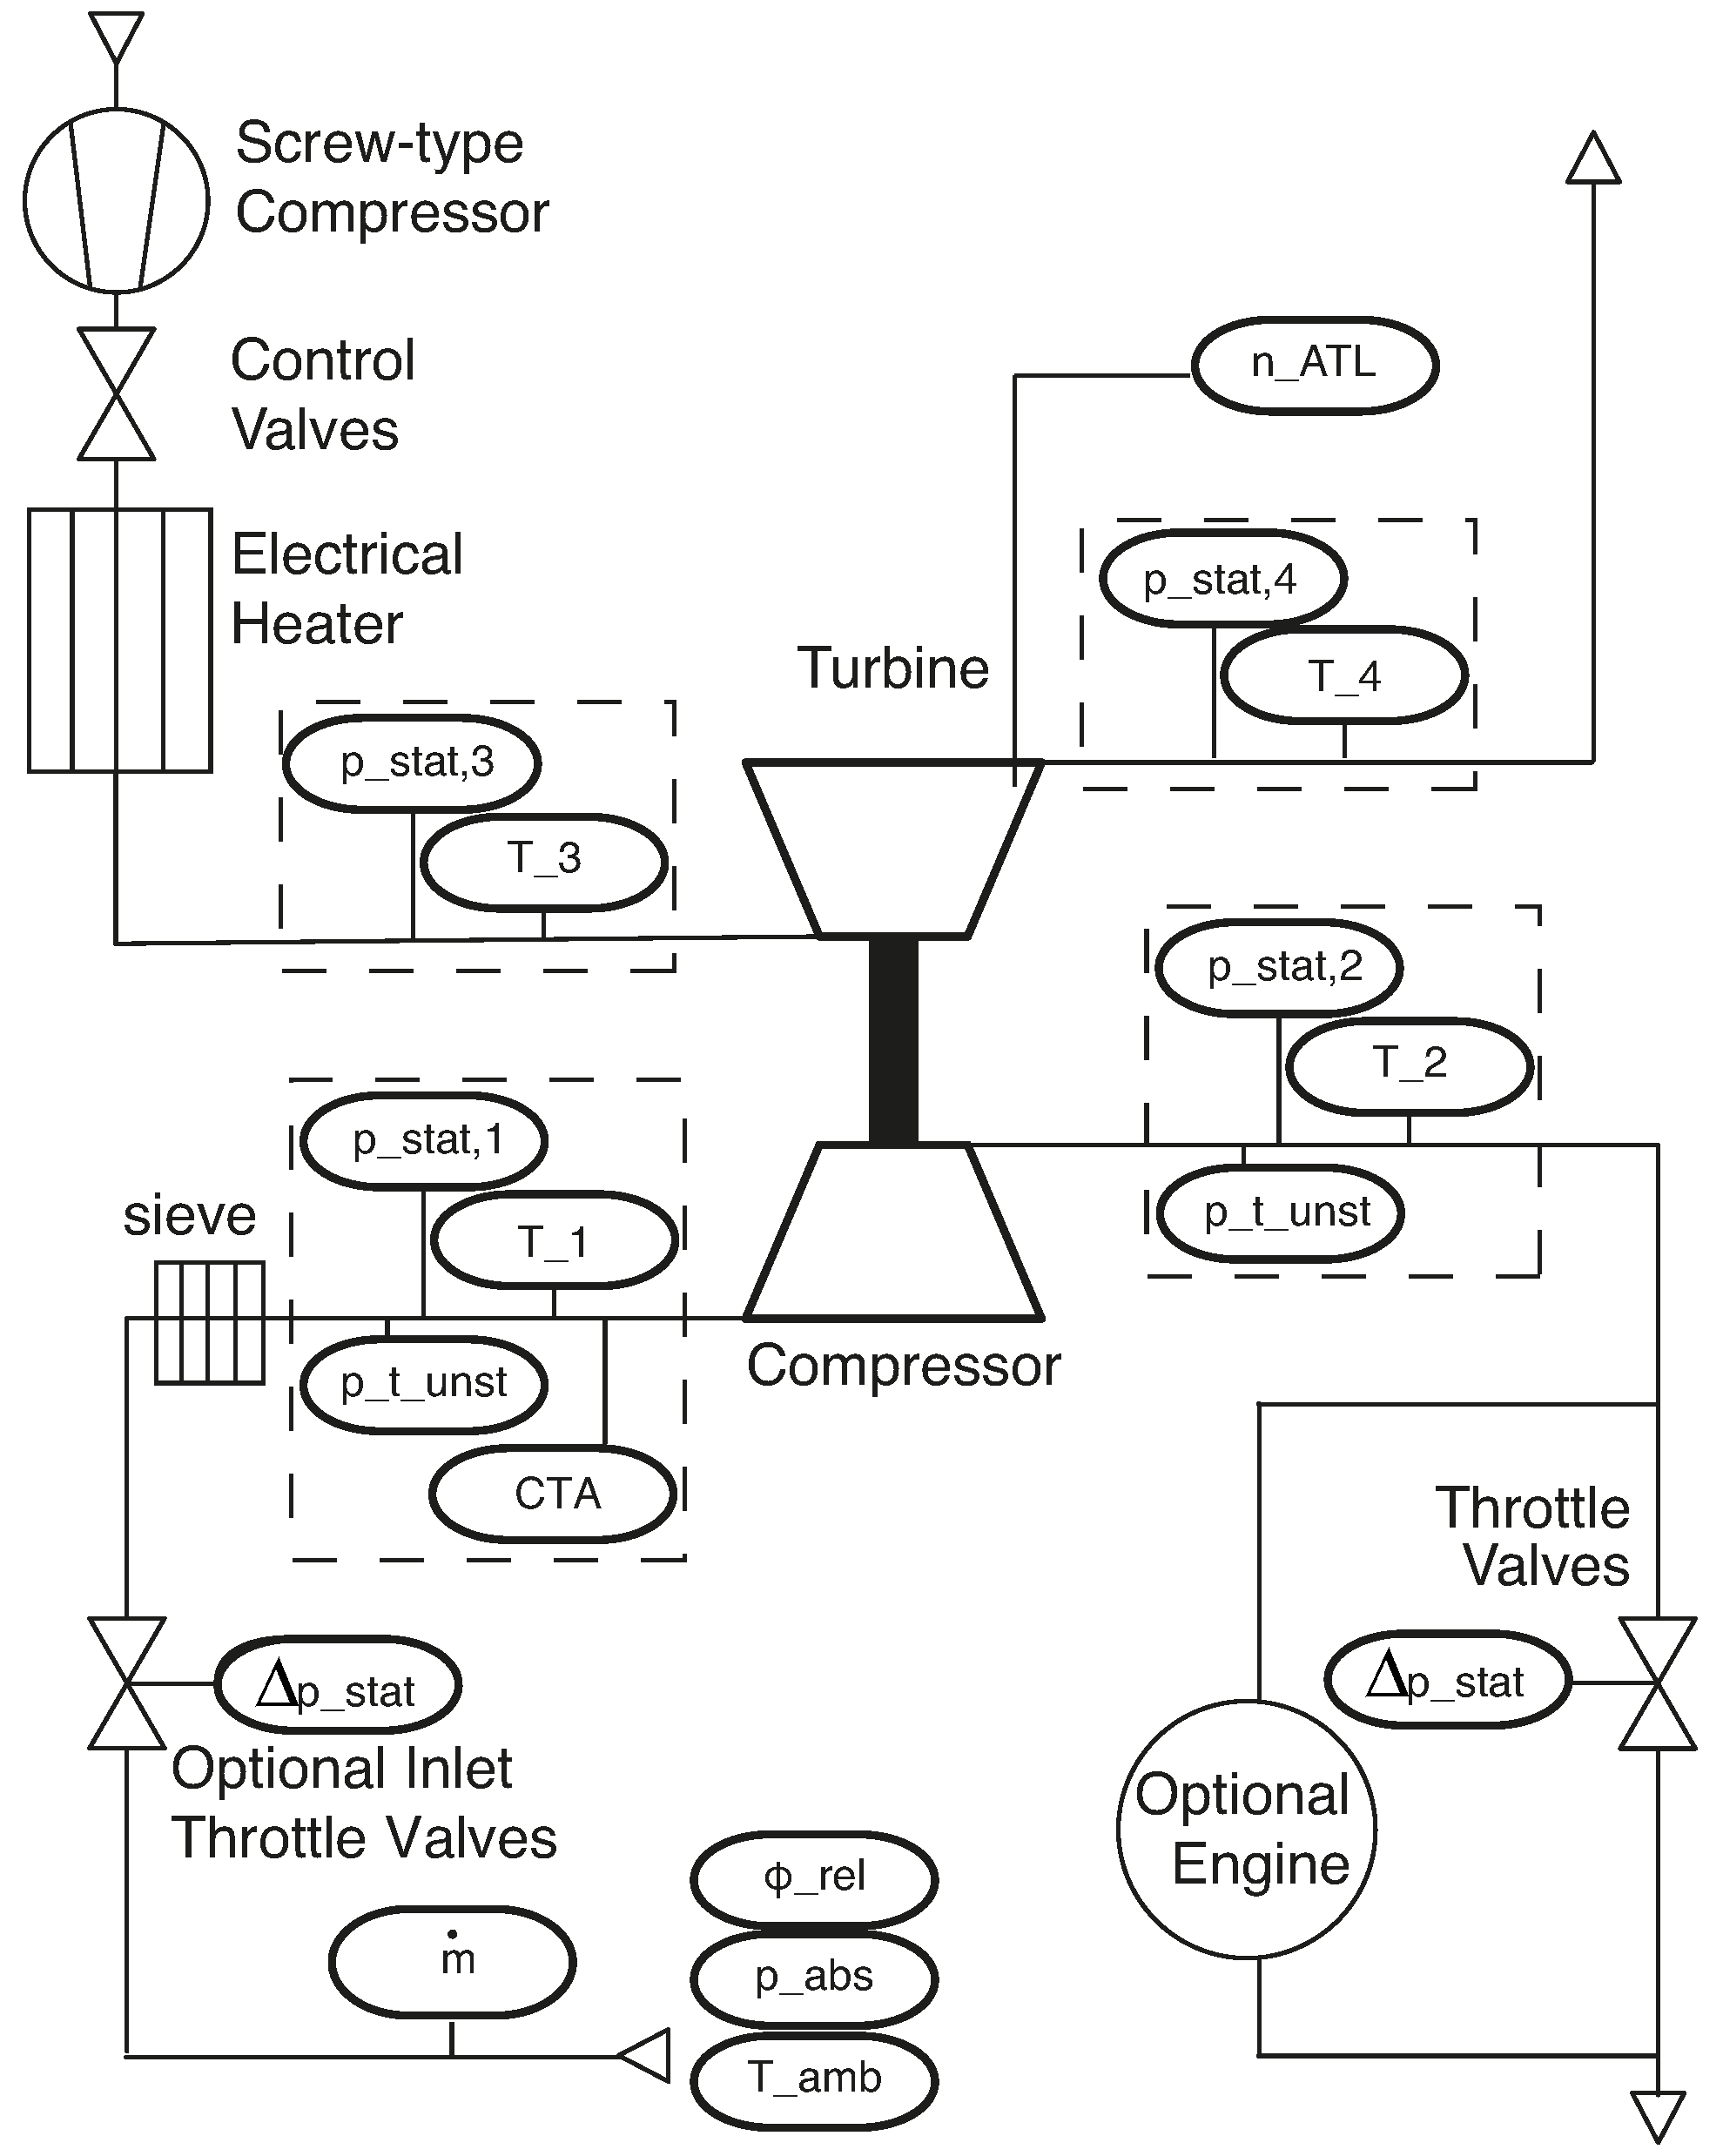
The open-circuit design of the compressor draws in ambient, preconditioned air. Relative humidity, ambient pressure and temperature are continuously monitored. After passing through a flow straightener, mass-flow is measured using a calibrated orifice. Downstream of the measuring orifice the flow is guided into the compressor inlet. A sieve cascade is inserted upstream of the inlet measurement plane to guarantee homogeneous inflow conditions with constant low turbulence levels. Static pressure and total temperature are determined in front of and behind the compressor stage, providing basic aerodynamic data for compressor map analyses. Air is released downstream of the test section via throttling valves that are used to control the compressor’s operating point. Steady state conditions are ensured by controlling the test cell temperature and online monitoring of all measured values and their standard deviation. Measurement positions and basic control features are visualized in
Figure 1.
In addition to this basic gas stand design based on SAEJ1826 [
13], variations of compressor investigations are used. The inlet pressure at the compressor stage can be massively reduced using an optional inlet throttle valve. The throttling characteristics of this inlet valve and the exit valves are recorded with pressure taps up- and downstream of the valves. The position of the inlet throttling valve is visualized in
Figure 1. The piping, pipe length, and pipe volume between the compressor outlet and throttling valve can be varied. A wide range of forms and sizes can be integrated into the piping and the total volume can be reduced to a negligible value. In addition to the volume variation, an electrically driven piston engine can be included to induce pulsating flow conditions at the outlet of the compressor stage. It is possible to determine the influence of unsteady compressor boundary conditions on the onset of compressor surge. The piston engine is a three cylinder 1.0l engine and is applied parallel to the exit throttle valve: Various operation modes can be realized. It is possible to throttle the compressor by only using the throttle valve, the engine or both components to investigate different frequency values at a specific operating point. Compressor exit volume changes are kept as low as possible to minimize plenum effects on the stability limit when switching the throttle operation mode. Unsteady instrumentation (to measure mass flow and pressure fluctuations) are added to the basic aerodynamic experimental setup.
3. Instrumentation and Accuracy
Basic compressor map measurements are in accordance with SAE J1826 [
13]. In each measurement plane (i.e., in front of and behind the compressor stage), three thermocouples type K are used for temperature measurement and static pressure is determined with four circumferentially distributed holes (hole diameter d = 0.5 mm). Static pressure holes are connected to a high accuracy, relative pressure sensor. An extensive and systematic study of repeatability and assembling tests were performed to determine maximum measurement uncertainties. While uncertainties originating from sensor accuracy are relatively easy to determine, systematic uncertainties due to assembly effects in the turbocharger as well as in the gas test stand are only determinable with extensive studies. The maximum measurement uncertainty for total pressure ratio can be specified as 0.65% of the measured value, and as 0.8% for efficiency.
An inductive sensor is used on the turbine wheel to measure turbocharger speed. The compressor flow near the shroud is not influenced by invasive speed measurement techniques. The mass flow rate is measured upstream of the compressor via measuring orifices that are designed and calibrated for different measuring ranges to ensure low uncertainty. The maximum uncertainty of mass flow rate is 0.9% of the measured value.
Unsteady mass flow and pressure ratio fluctuations for tests with the piston engine are determined using specifically designed instrumentation. In front of the compressor, a constant temperature hot wire anemometer is positioned at one third of the pipe diameter. The sieves upstream of the measurement plane ensure a low level of turbulence. This results in a high signal-to-noise ratio, which allows the pulsating mass flow variations to be resolved. In addition, unsteady total pressure is monitored with a pitot tube equipped with an unsteady pressure transducer. The CTA and pitot tube are calibrated for mass flow measurements in steady state experiments, using the mass flow instrumentation of the hot gas stand (i.e., measuring orifices). Afterwards, the calibration data are used to determine unsteady mass flow fluctuations. Unsteady static pressure in front of and behind the compressor stage are determined using special pressure transducers mounted on the pipe surface. These measurement techniques are used to visualize a time resolved compressor operating point in experiments using the piston engine. They can also be used for surge detection and to resolve surge frequencies.
4. Surge Detection
The most difficult and therefore most uncertain value to measure is the onset of surge. Various surge criteria are monitored. Inlet temperature, compressor speed and unsteady signals from the CTA and pitot tube are used. In addition, the outlet pressure and the unsteady static pressure ratio determined by the flush mounted transducers in front of and behind the stage are recorded. As for most centrifugal compressor measurements, the acoustic behavior is analyzed by unsteady pressure measurement techniques and typical surge frequencies can be recorded. Surge is detected for an inlet temperature raise of 5 K and for dominant frequencies lower than 20 Hz, which appear for the unsteady sensor signals.
The exact surge limit is recorded with very slow sweep measurements, starting from a stable compressor operating point close to surge and increasing back pressure until surge is detected via the above-mentioned surge criteria. This process is repeated several times to ensure that the last stable operating point is as close as possible to the surge limit.
5. Compressor Characteristic
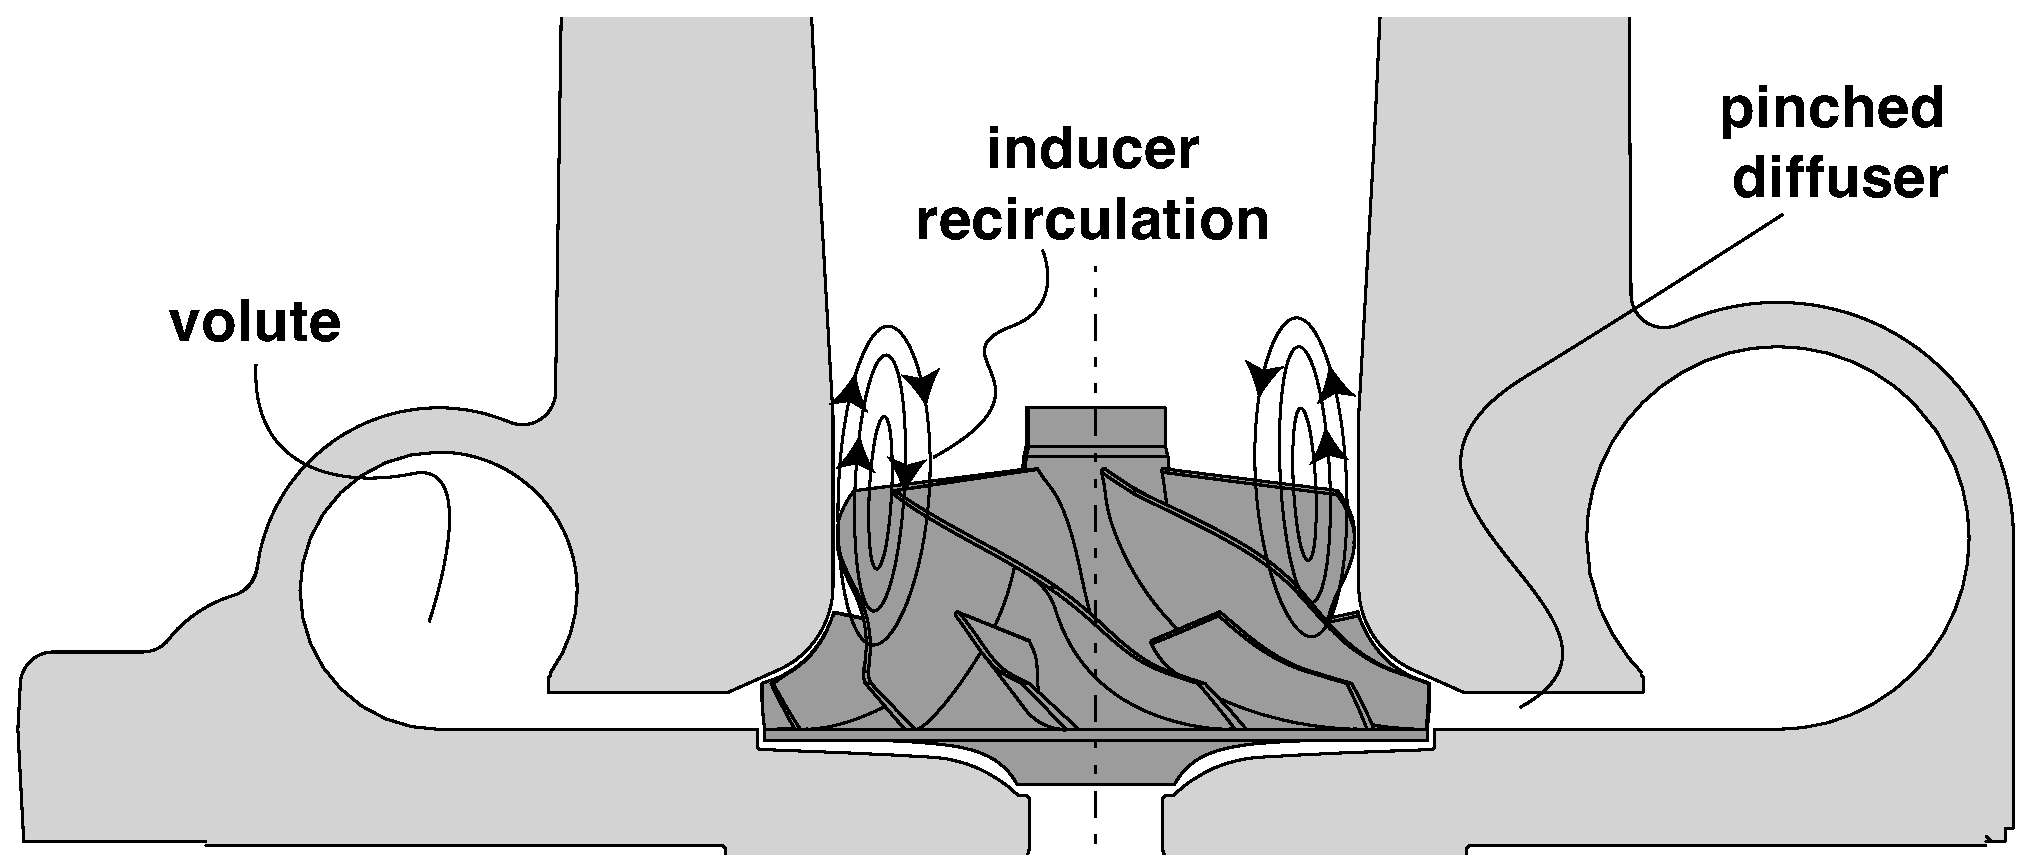
Compression system instabilities, such as stall and surge, occur when the compressor is throttled. By throttling the compressor, the incidence angle of the relative velocity theoretically increases, which causes the flow to separate on the blade suction side. This aerodynamic condition is known as stall, which is often a precursor of surge. The aerodynamics of the tested centrifugal compressor are discussed to understand the flow physics of the investigated compressor and to classify the results. The compressor stage used is a typical automotive design, comprising a centrifugal compressor with high trim, a pinched diffuser and a volute (
Figure 2). Past experience indicates that these designs typically tend to generate a recirculation zone in the inducer [
14]. This recirculation zone is already formed for slightly throttled operating points close to peak efficiency operation. Numerical simulations for the experimentally investigated compressor configuration are performed to study the impact of inducer recirculation. The CFD results show a distinct development of blockage for operating points near surge. The energy input and therefore the total pressure ratio is lower when blockage zones occur, which was also proven by Harley [
14]. The reduction in total pressure ratio depends on recirculation size. This means that closing the throttle valve causes the speed line gradient to decrease to zero, or even positive values. The incidence distribution of the impeller leading edge is affected by the recirculation zone. For higher throttled operation points, the blockage zone grows and the inlet mass flow is redistributed. The inflow is pushed towards the impeller hub, which decreases the incidence for lower impeller spans. However, deep surge occurs, which cannot be explained by general aerodynamic separation effects. Moreover, the diffuser flow does not show flow separation near surge for the investigated impeller configuration. A physical explanation for the occurrence of surge that only considers the compressor characteristic cannot therefore be given. The role of the overall compression system is discussed to gain more insight into the mechanisms for the onset of surge. Therefore, an analytic model is set up.
6. Analytic Approach
The analytic derivation of a novel surge definition is based on the specification of an appropriate simplification model. Greitzer’s approach rests on a distinct degree of abstraction of the pneumatic piping system. This idea is complemented by an additional component on the suction side of the compressor (
Figure 3), which is modeled as pneumatic resistance,
, a valve.
The model can be divided into five components, all covered by the same mathematical approach. For each component, the conservation equations for mass and momentum are applied. The pneumatic valves and the compressor are treated similarly. Each of the three components is assigned to a particular performance characteristic, which depends on the actual mass flow rate and the pressure difference involved. The derivation of the compressor performance characteristic is shown for these components. The characteristic of each component is described as a function of static pressure drop across the component for specific mass flow rates.
This correlation is linearized.
The equations for both valves are listed below:
Both pneumatic valves are modeled as resistances, and the compressor as a pressure generator. The inlet piping is considered to be incompressible. Therefore, the first integral of the momentum equation is used. As in Greitzer’s theoretical approach, the pressure rise of the compressor is inserted into the incompressible inlet piping equation.
The exit plenum is specified as compressible, allowing an oscillating process.
Equations (
3)–(
6) are used to set up a system of equations, which are presented in Equation (
7). Using small perturbation analysis, the set of equations is converted to a characteristic polynomial.
Considering the solution of the characteristic polynomial (Equation (
8)), the system is unstable for positive eigenvalues. Similar to structural dynamic theory, this is the case for negative damping factor D. On this occasion, Greitzer distinguished between static and dynamic stability.
Throttling the compressor, the dynamic stability limit exceeds the static limit, which is explained in detail in [
3]. Therefore, the damping factor D can be written as:
For
, the system is stable, which means that natural resonances are damped and energy dissipates during the oscillation process. In contrast, for negative values of D, the system is self-excited. Eliminating the inlet valve
and non-dimensionalizing Equation (
9), the damping factor can be transformed into the well known Greitzer B -criteria. The main difference to Greitzer in this analytic approach is the consideration of the inlet valve
and the derivation of a generally valid stability criteria D out of the system eigenvalues. For any compression system that can be abstracted by the above pneumatic diagram (
Figure 3), deep surge occurs for negative damping factor D.
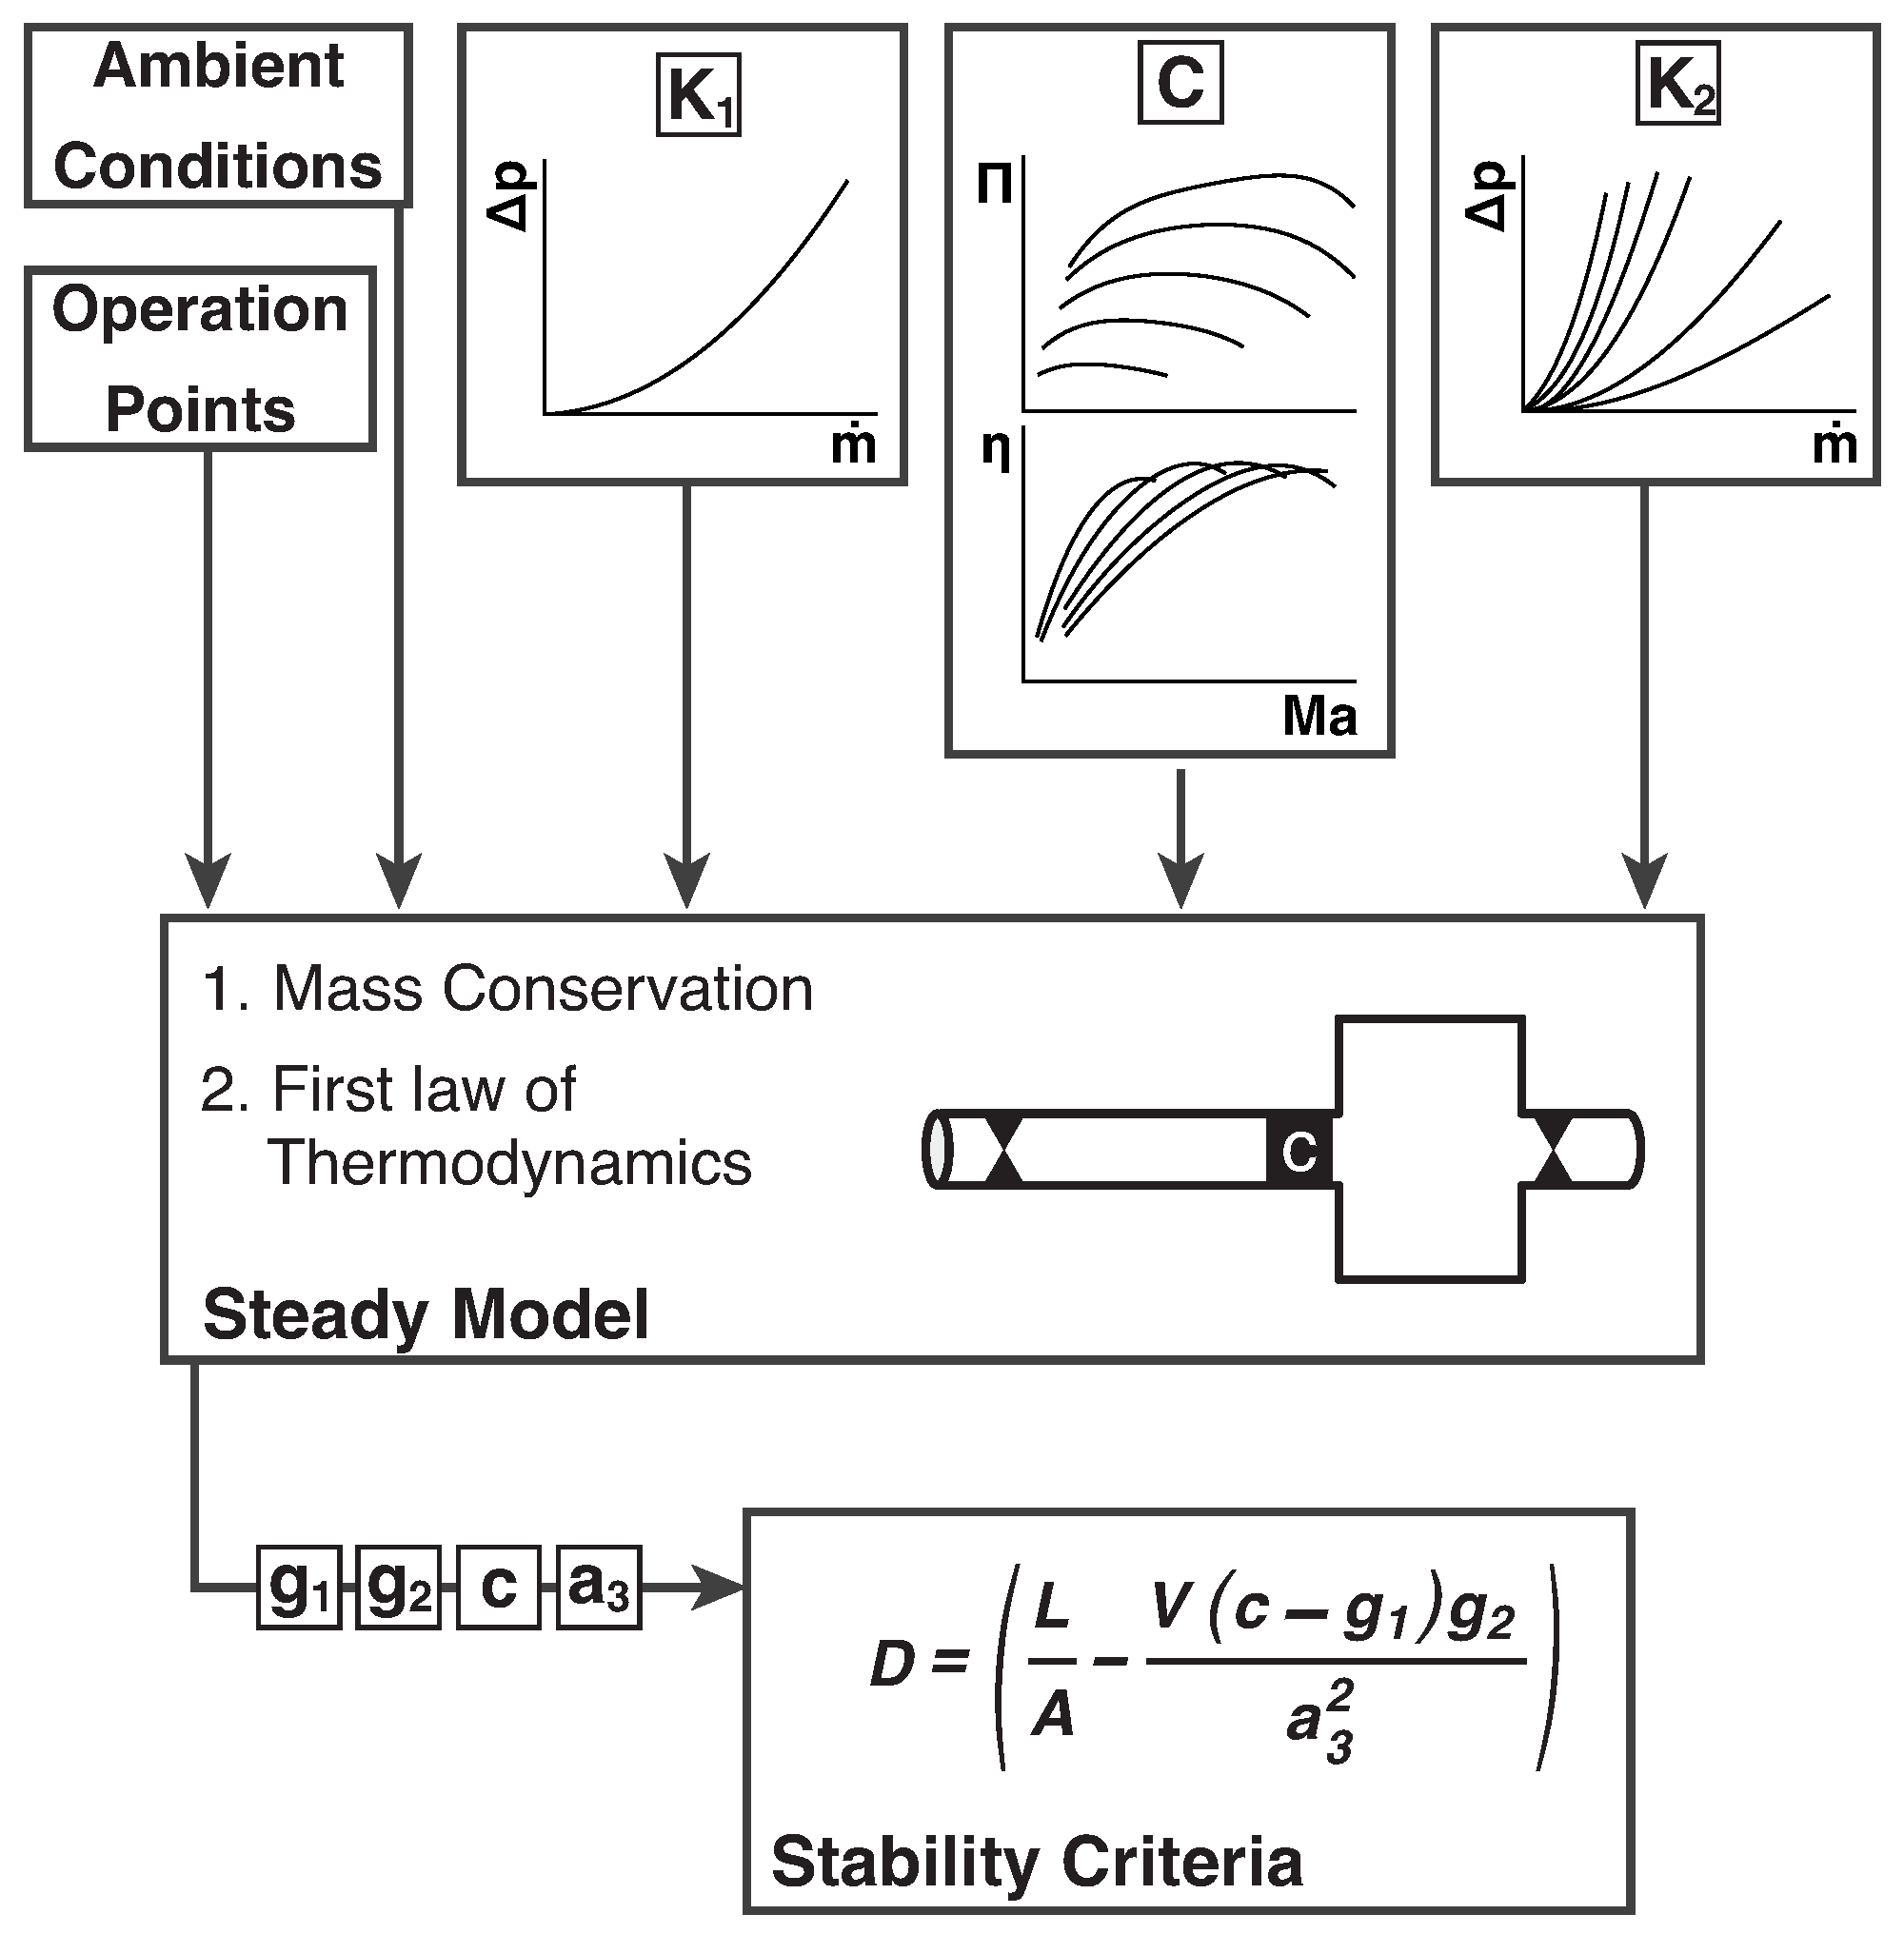
The damping factor consists of constant and variable values, when the compression system is throttled. The constant values are the inlet piping length L, the inlet area A, and the compressor discharge plenum V. The throttle and compressor characteristics as well as the speed of sound in the plenum have to be determined based on the operating point and throttle conditions. To calculate them, an additional steady compression model is set up. The aim of this model is to determine the state and component values for each compressor operating point. The value of the damping factor D can be calculated using these parameters, determining stable or unstable operating conditions for each operating point.
Figure 4 shows the basic principle of this additional steady compression model. The boundary conditions are set to ambient conditions. The compression system can be throttled by changing the valve throttle positions and therefore
and
. The inlet valve is set to a constant position, so the fixed throttling characteristic can be used in the model. This is a realistic application, as the typical components of the suction side of the compressor, such as air filter, elbows and flow straighteners, have a fixed geometrical shape and therefore a certain flow resistance characteristic, which can be described by Equation (
4). The performance map and the efficiency characteristic have to be implemented in the model to describe the compressor c. The experimental data of the components are approximated to generate steady model input values. A compressor characteristic, from zero mass flow rate to choke condition, is needed to apply this model to each operating point. Leufven [
15] presented a compressor flow model that extrapolates the measured performance map to zero mass flow rate. However, for the speed line slopes, especially at near surge, deviations between measured data and Leufven’s modeled performance map data occur. As the prediction of surge is sensitive to small variations in speed line gradient, only experimentally measured enhanced performance maps are used here. To calculate the state values of the charged-air system, a set of equations is set up that consists of the ideal gas law and the conservation of mass and energy. The component values
are calculated for each operating point. These values are inserted into the damping factor D. The calculation of the state values using the steady model is performed at each operation point of the compressor map. This produces the system-dependent compressor surge line.
7. Validation
As mentioned above, the state values, as well as throttle and compressor characteristics for each operating point, are calculated in the steady model. This information is used for the system damping factor. The analytic approach presented here describes the surge limit of the compression system. Two experiments are presented. First, validity is proven for a compression system, similar to Greitzer’s experimental setup. The inlet valve is fully open. The only resistances in the suction system are the measuring orifice, several bends, and the sieve cascade, which is needed to gather reasonable information from the hot-wire anemometry measurements. Although the pressure drop across these resistances is low, the throttle curves for each inlet piping component is measured and considered in parameter
. The validity of Greitzer’s approach has been proven by various authors by changing the compressor’s exit plenum volume, which is also performed for the first validity measurement. The different exit volume sizes are realized by changing the length of the exit piping (
–
,
Table 1). An additional variation of the exit plenum geometry (
) is added to the measurement plan to exclude the impact of acoustic effects on surge limit due to the exit piping length variations.
The surge limit was measured for three different speed lines. By closing the compressor exit valve (
), the system was throttled, changing valve characteristic (
) at each operating point.
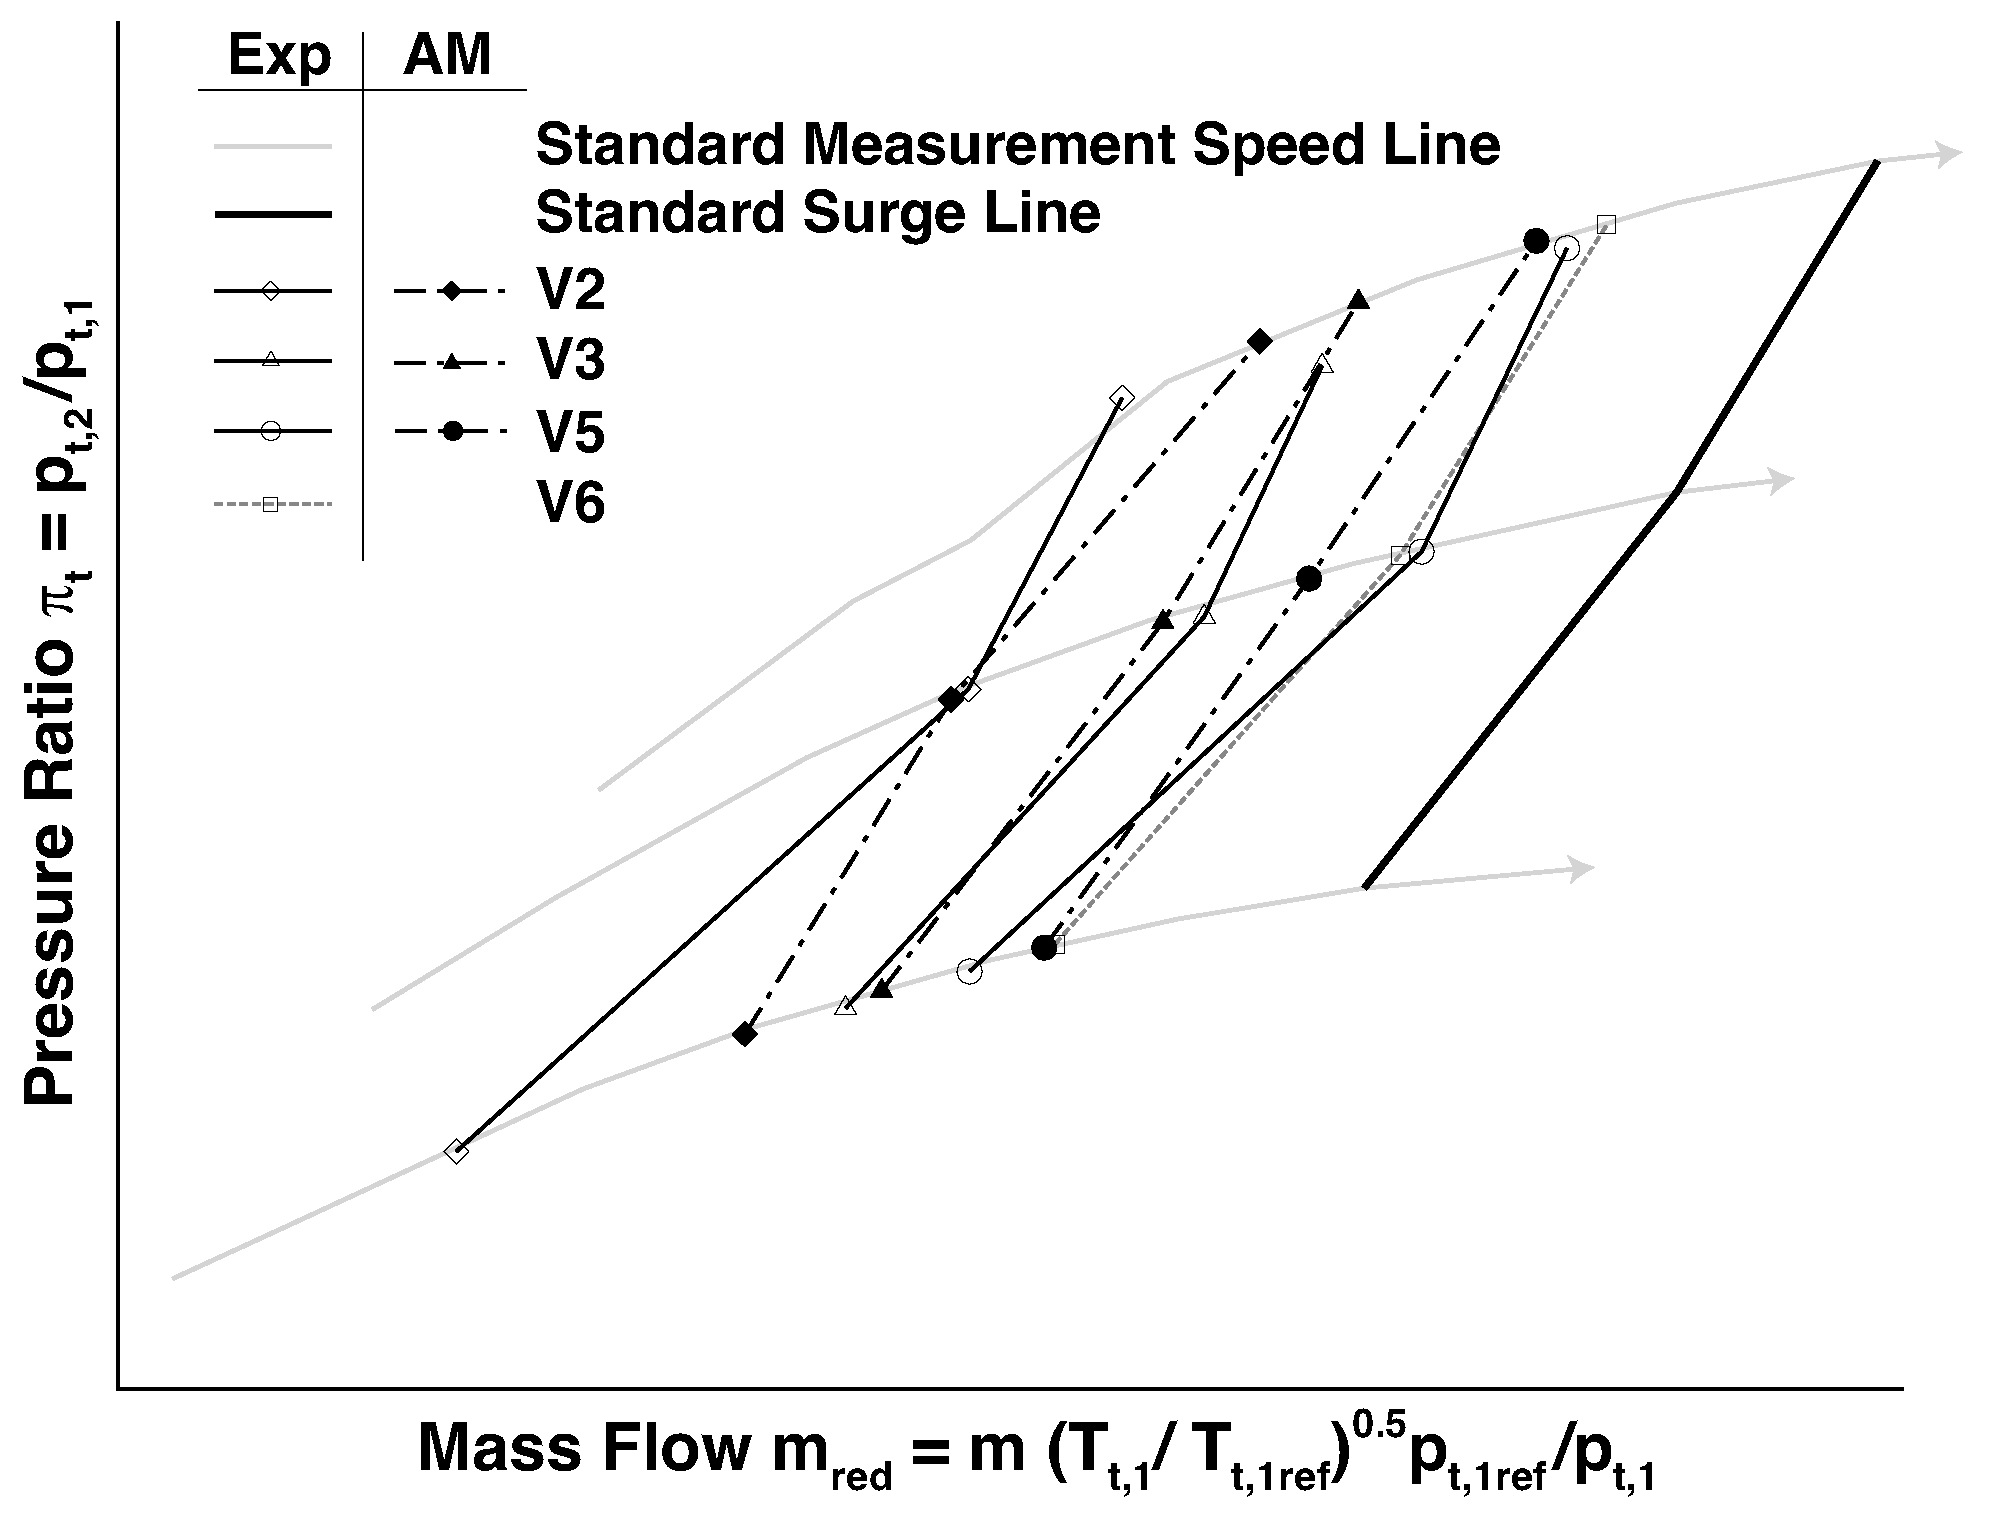
Figure 5 illustrates the simulated and experimentally detected surge lines. The data show that the surge mass flow rate can be shifted towards lower values by decreasing the exit volume. The surge line does not shift linearly with the exit plenum volume, as can be seen for the smallest volume size. The surge mass flow rate gap between
and
is distinctive. In experimental and simulated data, the surge limits match for all speed lines. Deviations in surge mass flow rate for the highest speed line appear, with a maximum deviation of
for volume
. This variance is caused by the approximation of the compressor characteristic
c, which does not precisely replicate the measured speed line. However, the overall performance of the damping model predicts the surge mass flow rate with only small deviations for all speed lines. The surge mass flow rate for
and
deviates about
for all speed lines, which is considered to be negligible in the geometrical differences of both plenums. This means that geometrical consideration of the plenum have only a minor influence on the surge limit.
To evaluate the data, the gain in mass flow rate is described by a surge limit coefficient
, which is described as:
The reference volume
is at 9.8 dm
and corresponds to the standard setup for turbocharger compressor measurements. Premeasurements showed that an additional shift in surge mass flow rate, by increasing the plenum volume, cannot be captured by the measurement setup due to minimal impact on stability.
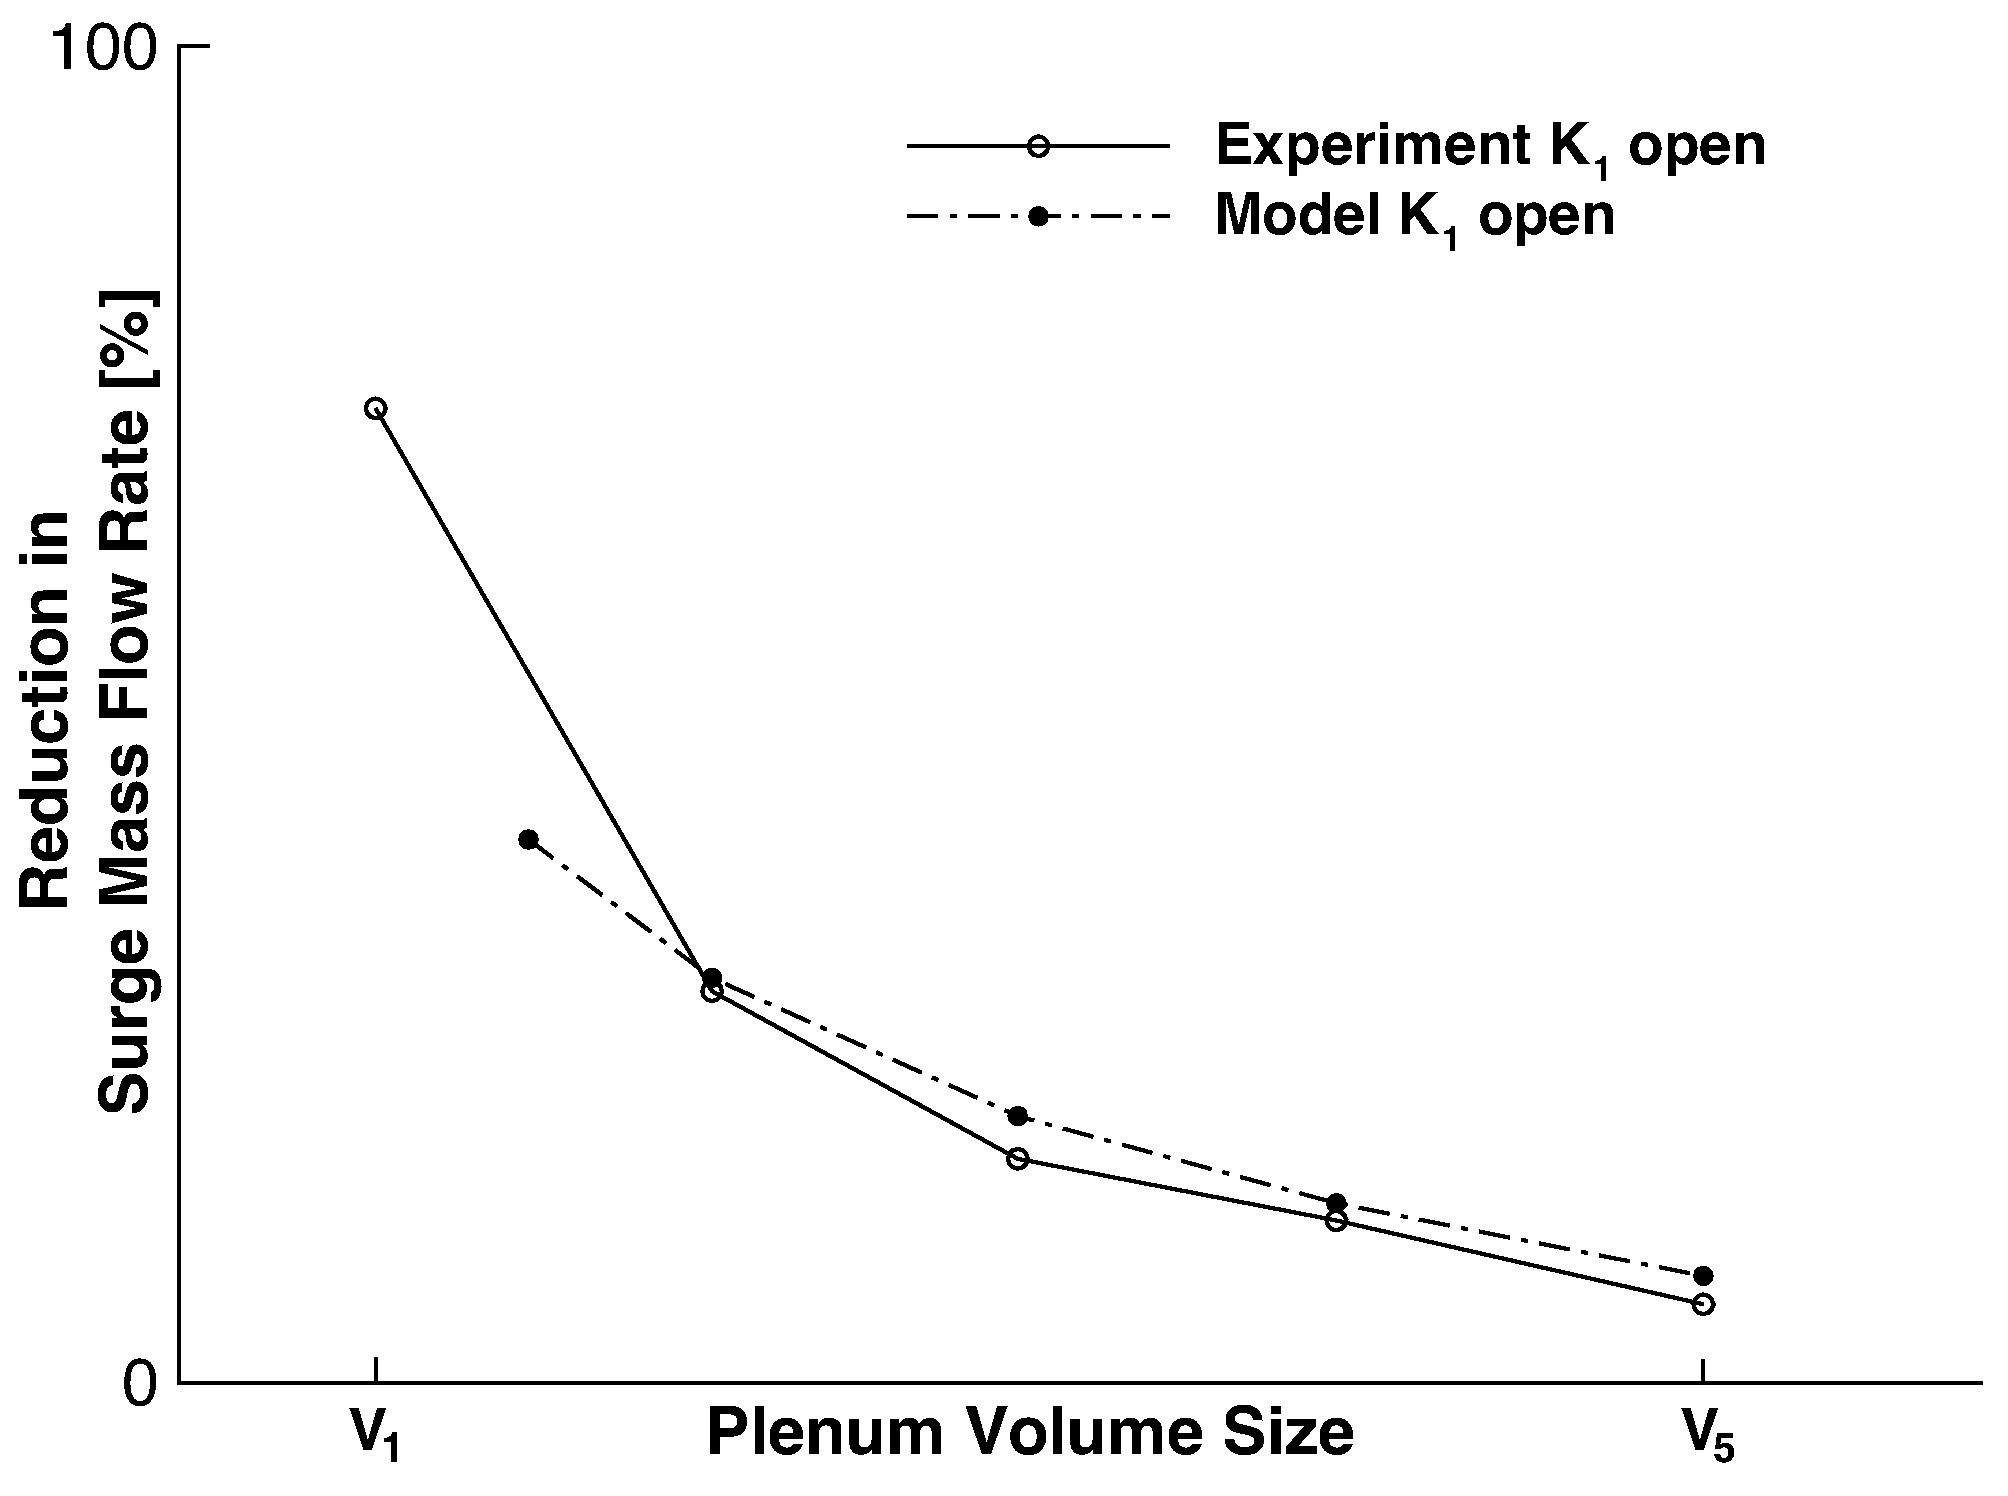
Figure 6 shows the shift in surge mass flow rate
for the volume variation presented. The mean deviation between the approximated and measured data is lower than
. Both curves show nonlinear behavior in
for reduced plenum volume. For higher plenum volumes, the curve progression approaches asymptotically zero mass flow rate shift. This confirms experimental experiences. For smaller plenum sizes, the impact of changes in exit volume increases. Theoretically, surge can be prevented by the application of zero plenum volume.
The second measurement sequence was performed to validate the impact of inlet resistances on surge limit. The inlet valve was throttled to ensure a pressure drop of 10 kPa at peak efficiency for the lowest speed line. The exit volume was then varied according to the plenum variations shown in
Table 1. Only the downstream valve (
) is used to throttle the compressor.
Figure 7 shows the results for various volume measurements. All surge lines are shifted to lower mass flow rates compared to the open valve (
) configuration (compared to
Figure 5). The experimental and modeled data do not match exactly. Distinct differences in surge mass flow rate occur, especially at the highest speed line for volume
. For volume
, experimental and modeled surge mass flow rate data differ by about
for the lowest speed line. When throttling the compressor with increased pressure losses at the compressor inlet, the transition of stable to unstable operation mode is not as readily apparent as for the open valve
configuration. Pressure and mass flow fluctuations as well as inlet temperature increase incrementally, while slowly throttling the compressor, which makes it difficult to precisely determine deep surge for volume
.
As in the measurements with open inlet valve, surge limits match for different plenum geometries with the same volume size.
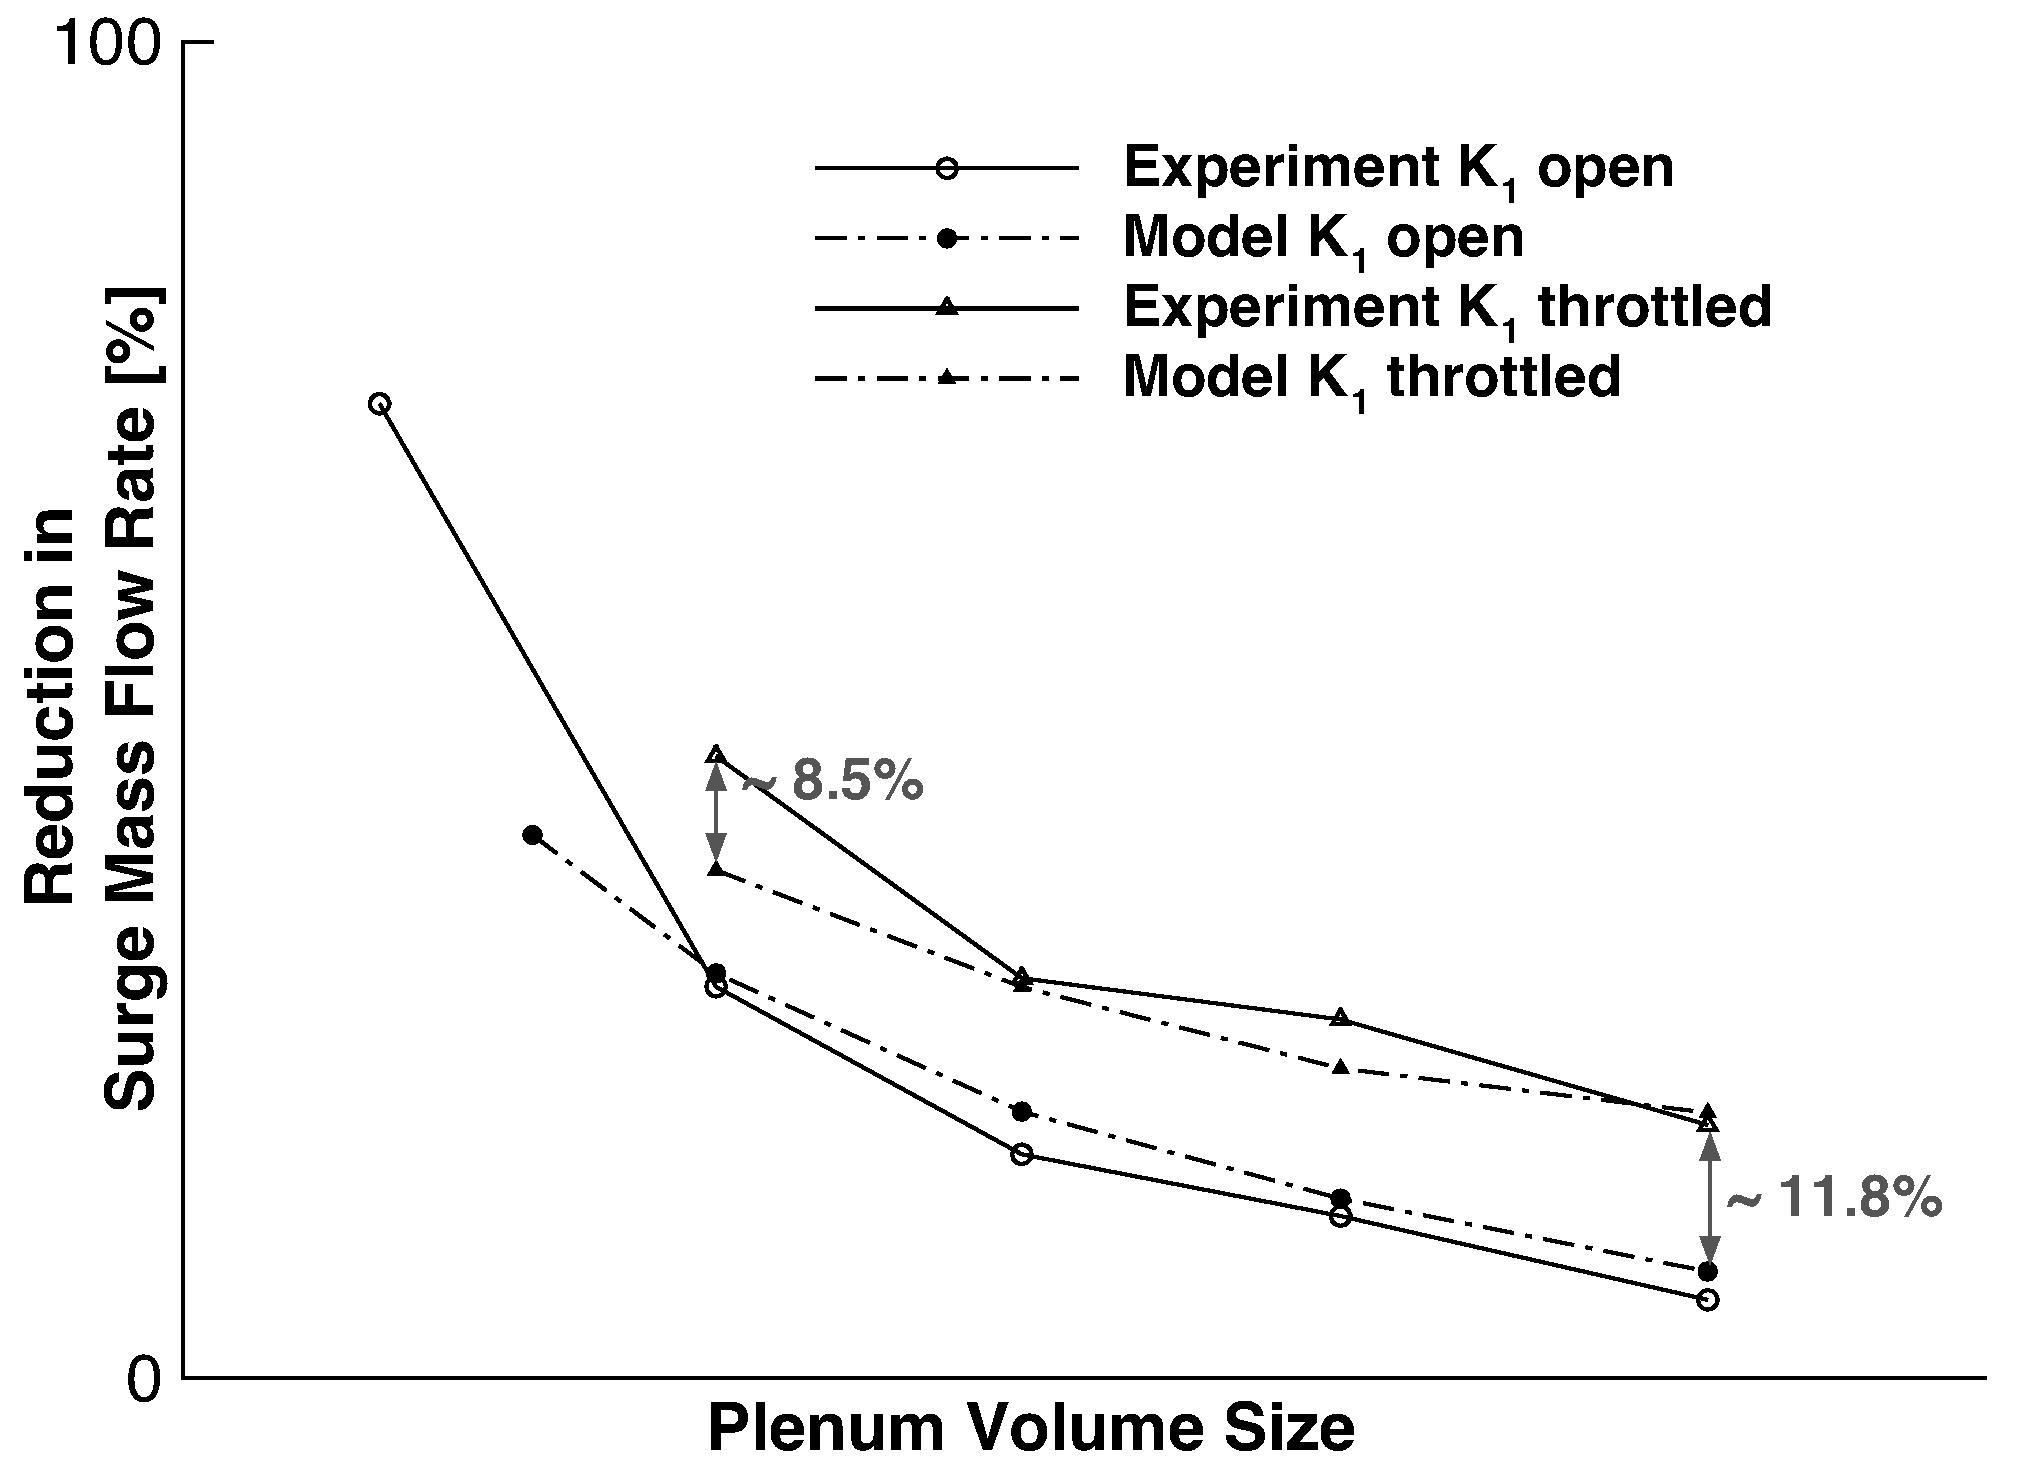
Figure 8 shows the trend in surge line shift compared to the previously measured volume variation. Deviations in surge line shift for
and
are evident. The overall shift of the surge line between open valve
and throttled setup is clearly detectable. Considering the validity of the analytical approach, the modeled and experimental data demonstrate a high level of consistency, in the absolute values and the overall trend in the surge line shift. As the analytical model represents an oscillating pneumatic system, the eigenfrequency of the system should match the measured surge frequencies. For the surge models presented in [
16,
17], the unsteady operation characteristic could be derived from Greitzer’s approach, however distinct differences in the deep surge frequencies occur between analytic and experimental data. Using Equation (
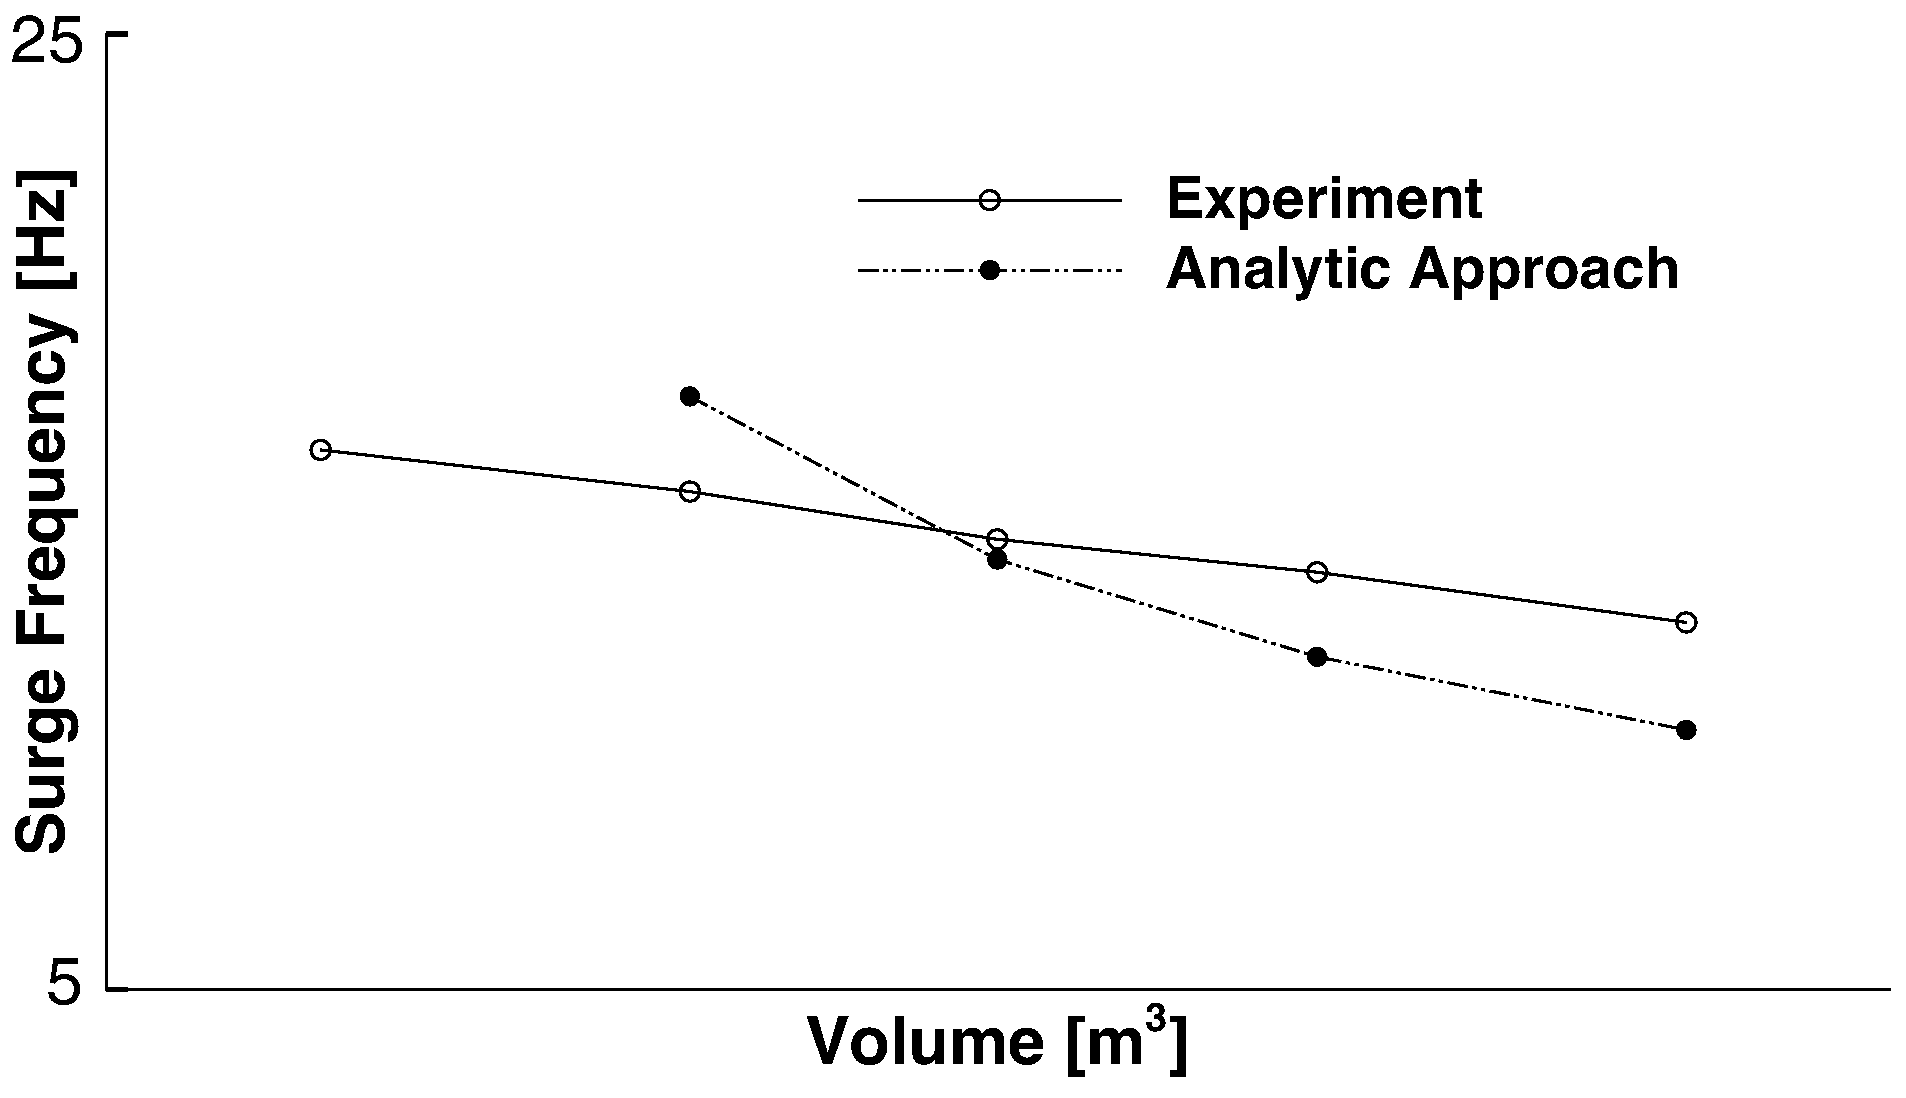
8), the eigenfrequency can be calculated:
System frequency is a function of all system components, not only the geometric values, and is described by the Helmholtz frequency. Although changes to the inlet throttle characteristic have a minor influence to the surge frequency, the geometric properties and the exit throttle characteristic play more significant roles.
Figure 9 compares the deep surge frequency of measurement and analytic model. The curves differ over the changing mass flow rate, however the frequency value matches.
8. Boundary Conditions
The trend towards very small turbocharged piston engines leads to an increased need to understand the interaction between turbocharger and piston engine. This is especially challenging for three-cylinder engines since all intake valves are closed simultaneously for certain periods during the engine cycle, which increases mass flow and pressure fluctuations.
In the development strategy for a new turbocharger compressor, it is common practice to determine the compressor map and operating range with hot gas test stands. This kind of testing takes place under laboratory conditions with ideal, steady inflow and outflow conditions. The resulting compressor characteristics are used to match turbocharger and piston engine. The main differences between hot-gas test bench measurements and real application conditions are the components in the piping system and the unsteady exit boundary conditions. The impact of oscillating boundary conditions on compressor performance and therefore on stability limits are discussed.
The presented and validated model extension enables the observed surge limit variations for steady air-charged systems to be explained and to estimate them early on in the development cycle. However, this analytical approach relies on the assumption that the compressor’s performance map is not influenced by the upstream and downstream boundary conditions of the compressor. Modifying the inflow conditions of the impeller influences compressor characteristics, for example, the use of inlet guide vanes or casing treatment designs. Several publication are available to analyze the extent to which turbulence and homogeneous flow profiles impact compressor characteristics, but no generally valid conclusion can be drawn for automotive applications. As mentioned above, the compressor stage is characterized by a distinct development of blockage zone near shroud, which severely impacts inflow. Therefore, turbulence and homogeneous inflow upstream of the compressor stage are seen as not altering the compressor characteristics significantly. The trend of downsizing piston engines leads to three- and two-cylinder engine solutions. As all intake valves can be shut during periods of the engine cycle, the pressure amplitudes and mass flow fluctuations of the compressor exit increase when compared to four-stroke engines. Several authors [
16,
18,
19] have addressed the question of how pulsating exit boundary conditions affect the compressor surge limit: Correlations between among, pressure amplitude and surge mass flow rate are drawn. Numerical investigations by Shu [
20] indicate that pulsating boundary conditions are advantageous in delaying the stall behavior to lower mass flow rates. In contrast to those investigations, the impact of fluctuating exit conditions on performance characteristic c are investigated in the following. Measurements, including on a three-cylinder engine, are presented in this section.
9. Unsteady Operating Point
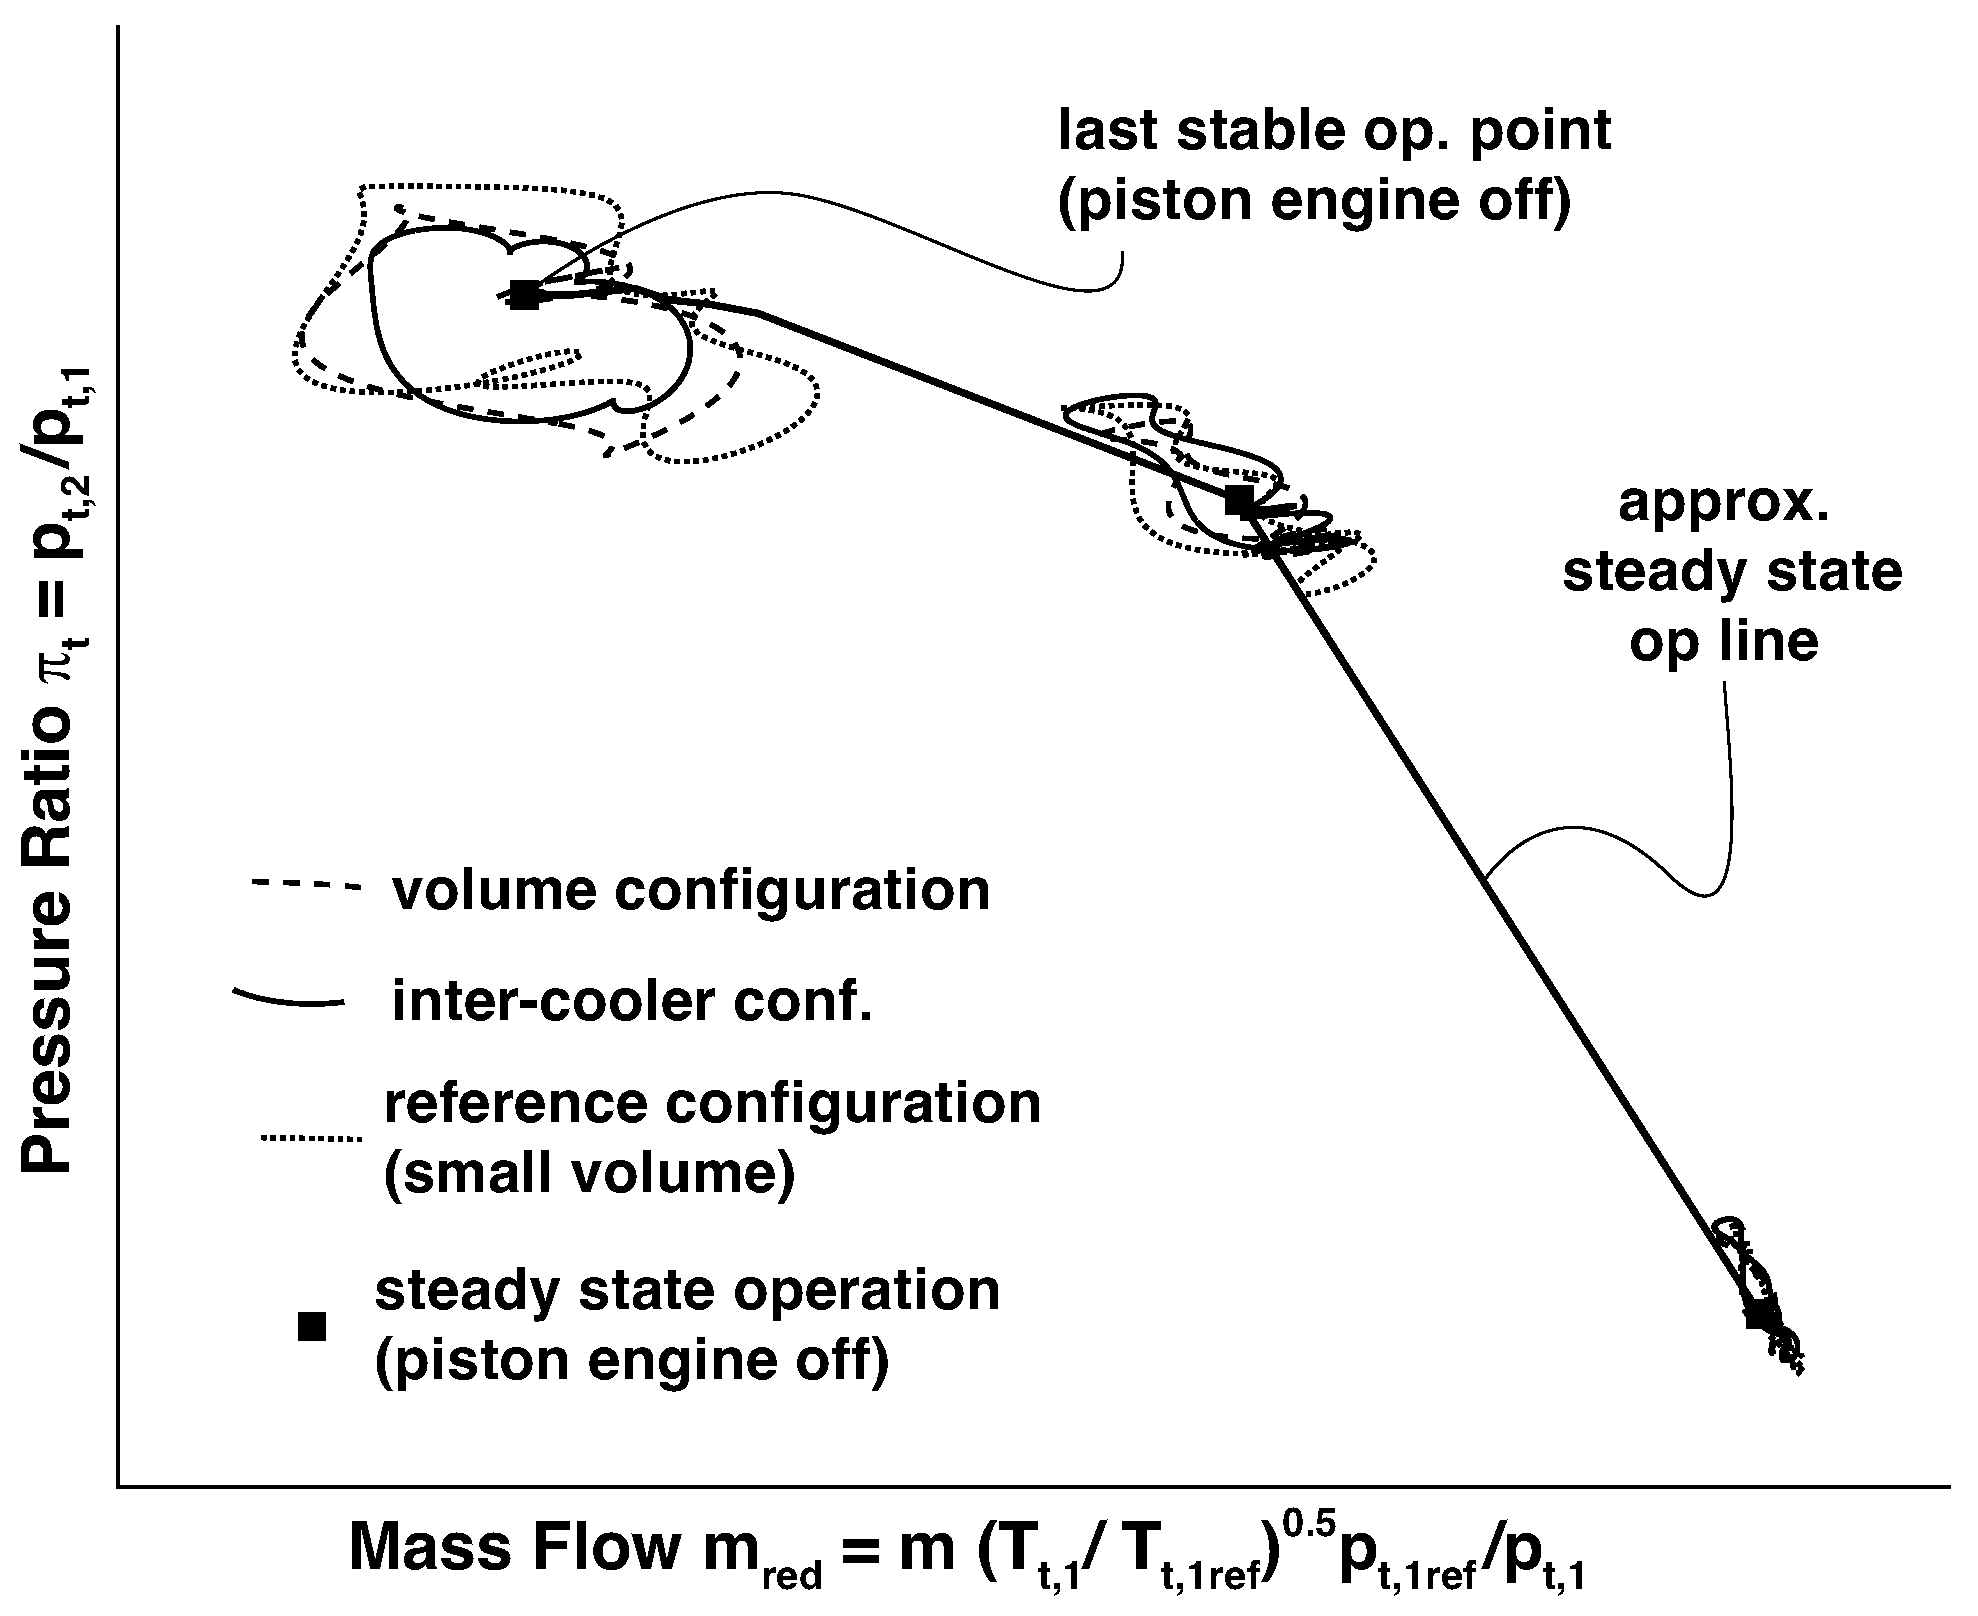
Figure 10 shows unsteady compressor operating points with running piston engine. The periodic operating point behavior is ensemble averaged over 30 s. Measurements at three operating points (near choke, at peak efficiency and near surge) are all adjusted with piston engine speed. The corresponding standard hot gas test stand compressor map is plotted in the background for orientation. In addition to the operating point variation, three volume configurations are used between the outlet of the compressor stage and the inlet of the piston engine: a reference piping setup with small volume; a larger piping setup with a more realistic, engine-like volume; and a configuration with an inter-cooler, resulting in the same total volume as the second configuration but a different excitation frequency. For these configurations, the unsteady operation lines are visualized. Three observations were made:
Unsteady operating points can cross the previously determined surge limit for a short duration.
The size and extent of unsteady operation loops depend on the throttling point of the compressor and therefore correspond to the slope of the compressor characteristic.
The volume between piston engine and compressor exit influences the size and extent of operation loops. The smallest volume tested exceeds surge sensitive variations (
Figure 10). A large volume has a damping effect on the pulsation at compressor exit because of its capacitive impact. This trend counteracts the steady state behavior of compressor stages stabilized with small exit volumes. The volume size has a dominant effect and integrating an inter-cooler does not make a difference apart from its effect on volume size.
10. Pulsating Conditions and Compressor Range
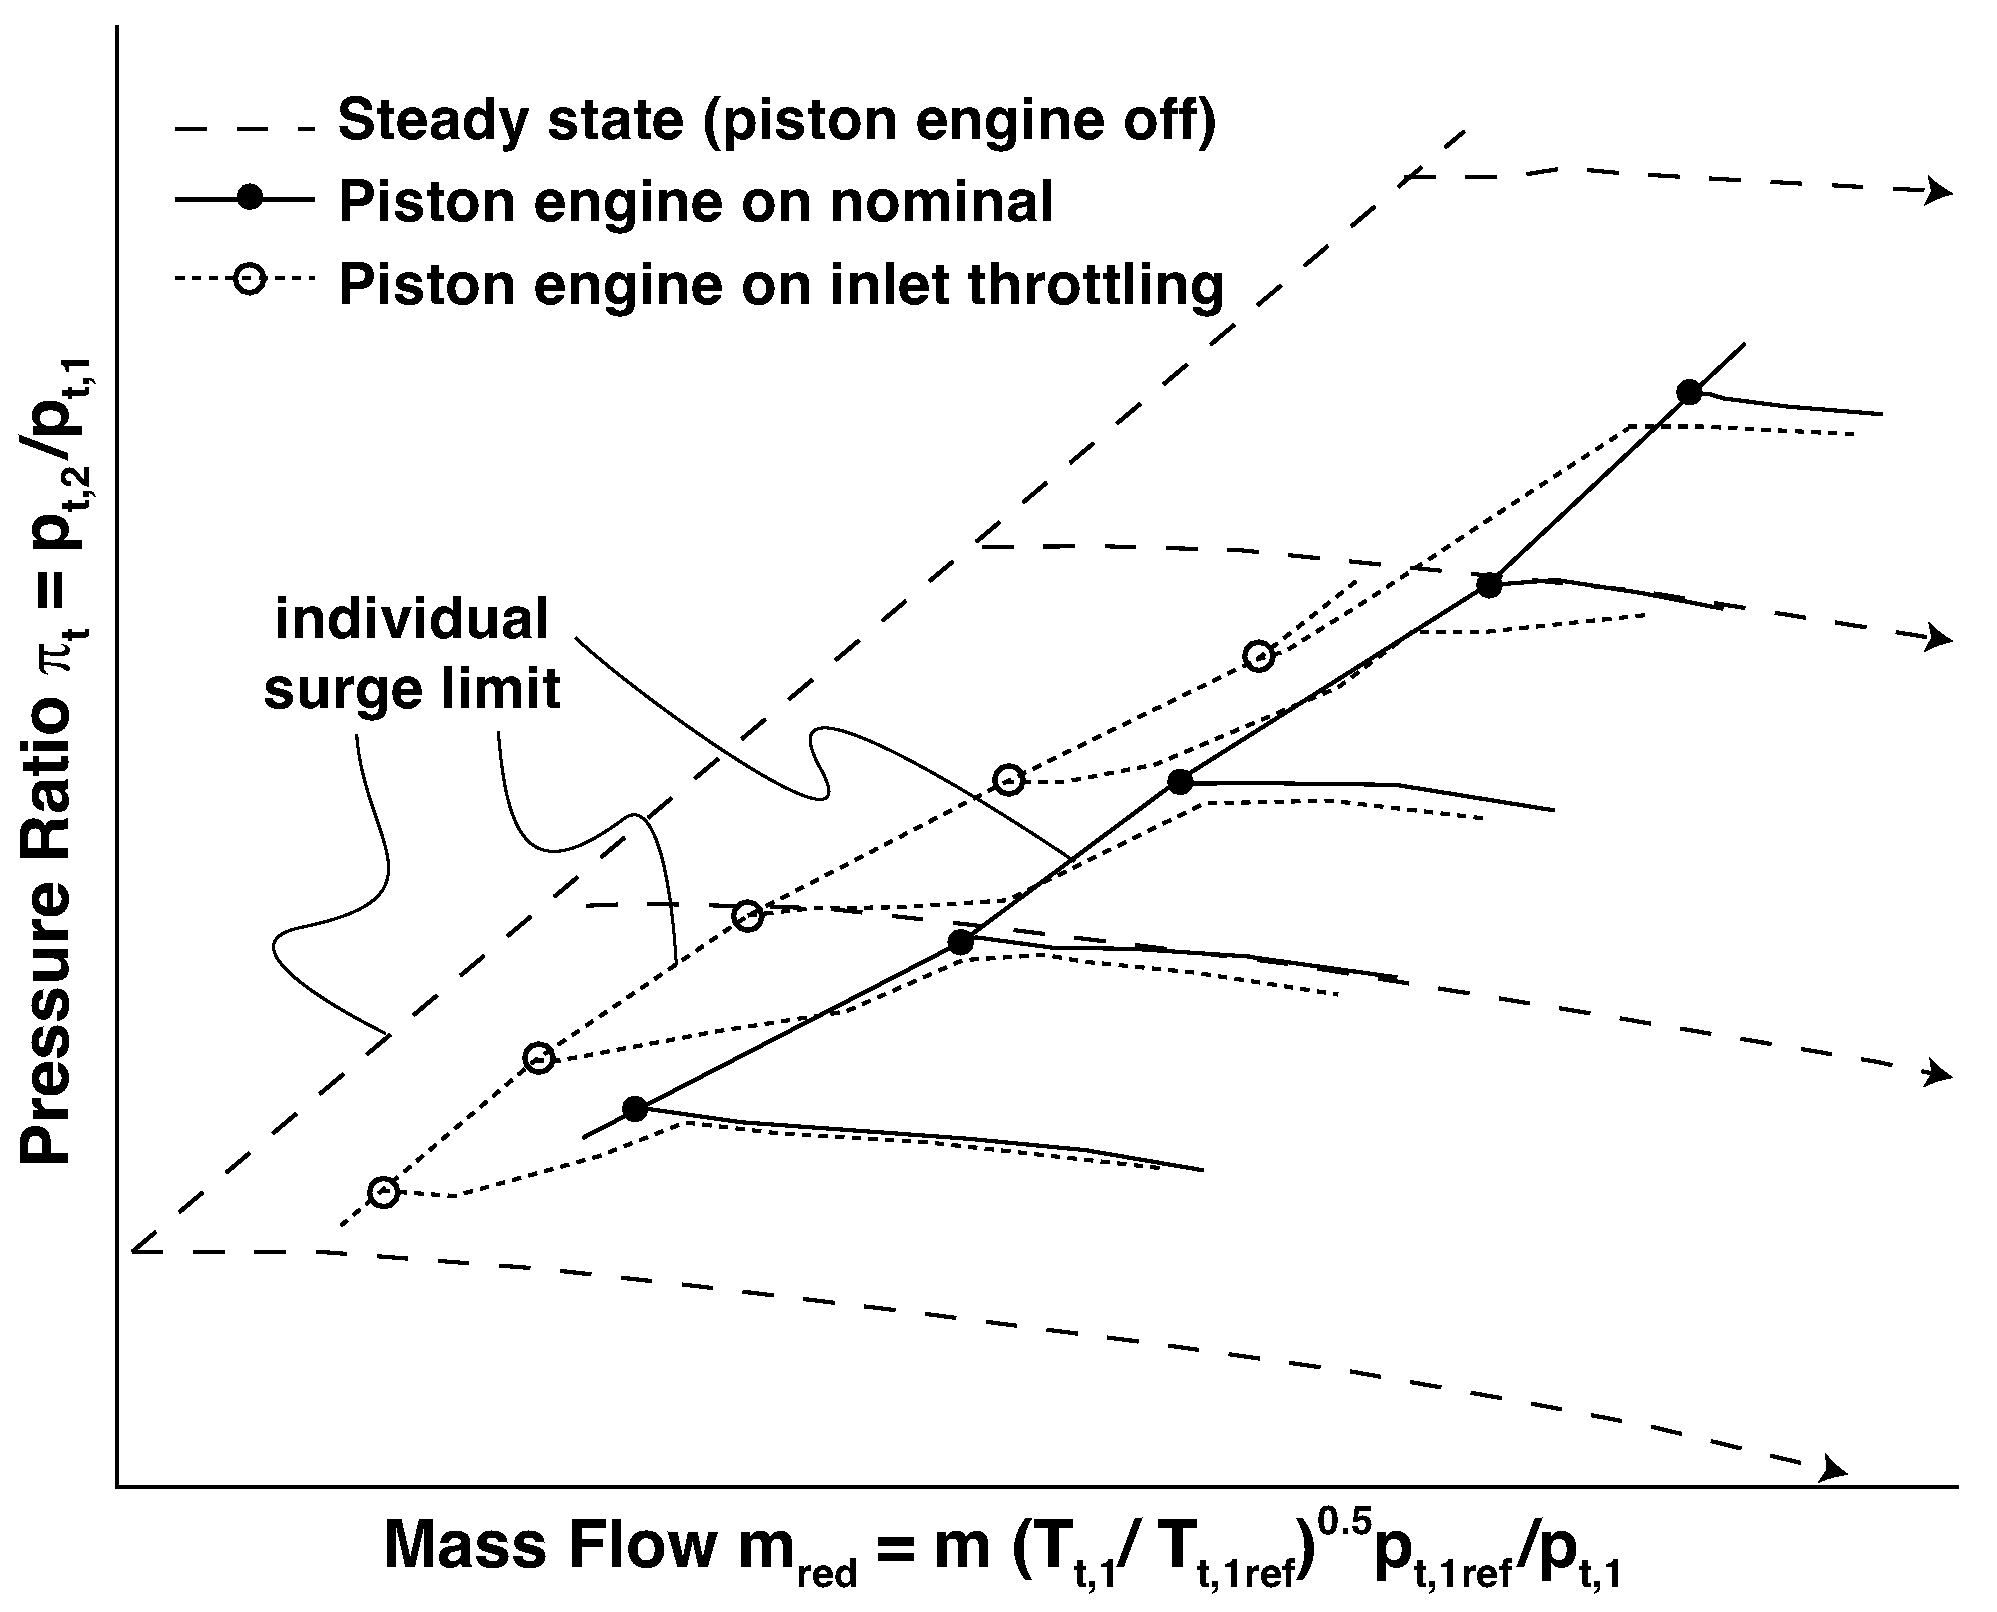
The observations in
Figure 11 show the strong unsteadiness of aerodynamics and compressor operation; the global effect on surge limit is visualized. The compressor throttle valve in the bypass section is fully closed. Piston engine speed is decreased to throttle the compressor until surge is recorded at each compressor speed line. Experiments were performed with two distinct inlet throttling conditions. First, the surge line was detected with fully open inlet valve for steady and unsteady operating conditions. Second, the inlet throttle valve was used to extend the stable operation of the previously determined unsteady measurement setup to lower mass flow rates. For the presented operating points, mass flow and pressure ratio are averaged over the piston engine cycle. For the configuration with open inlet valve, the shift in surge line between steady and unsteady conditions is obvious. As the geometrical values are kept constant, stable operation is only influenced by the unsteady exit boundary condition. The total pressure ratio and efficiency are the same in steady and unsteady operation in the stable region of the performance map. The compressor is throttled by the inlet valve to stabilize the system and investigate the performance characteristic of the unsteady operation mode. No changes are visible between the compressor map of throttled and fully open inlet valve measurement setup. In comparison to the steady operation performance characteristic, the slope of the speed lines change under pulsating conditions. The surge line shifts to lower mass flow rates by using the inlet throttle, similar to steady operating conditions. The gradient of the speed lines switches to positive values under pulsating operating conditions. The analytic surge model presented here is derived assuming constant boundary conditions between different application setups. The compressor characteristic c is set to a constant value. However, unsteady measurements show that c changes significantly under pulsating boundary conditions, which means that the surge lines shift to higher reduced mass flow rates. The findings of the unsteady measurements are:
The compressor surge lines shift under pulsating boundary conditions.
The compressor characteristic is altered by throttling the compressor in a running piston engine.
The surge line shifts to lower mass flow rates under pulsating conditions when using the inlet throttle.
The analytic surge model works when considering the changed unsteady performance characteristic. Surge prediction is therefore not possible, as the impact of pulsating boundary conditions on the compressor characteristic has not yet been investigated.
The extent to which unsteady aerodynamics caused by the piston engine impacts the compressor performance characteristic c is not addressed here. However, there is evidence that these effects are design dependent and pulsating amplitude is important.
11. Conclusions
The surge model extension for turbochargers is an analytic tool for understanding and prescribing surge limit variations in a charged-air system. It is based on the established surge model presented by Greitzer. The analytic approach differentiates by deriving a damping factor and extending to inlet throttling components. Extensive, systematic variations were experimentally investigated to validate the model and demonstrate its applicability. The main outcomes were:
Deep surge is a system-dependent phenomenon. The compressor, that is compressor aerodynamic c, is a component of the compression system.
Deep surge only occurs at positive compressor speed line gradients.
The compressor characteristic c is influenced by unsteady exit boundary conditions.
Pneumatic resistances in the suction piping of the compressor stabilize the system. The analytic model is able to predict the gain or loss in surge margin for different suction components.
Experimental and modeled deep surge mass flow rates match, without the implementation and adjustment of empirical factors or determination of critical surge criteria, which both depend on special compression system configurations.
To match compressor and compression systems, the enhanced performance map has to be measured, ideally down to zero mass flow rate. Enhancing a compressor map, measured on a hot-gas test bench, using an extrapolation of near surge speed line characteristics is not expedient as the stability criterion is sensitive to deviations in speed line gradient.
The impact of the compressor characteristic, its boundary conditions, and the compression system on the onset of surge are related. The compressor characteristic is mainly influenced by the design of the compressor wheel, the diffuser and the volute. The compressor characteristic c is determined through these components. The stable operating regime of the compressor map is defined by the compressor characteristic c, the system components and geometrical values. The analytic surge model predicts the onset of surge using these values. However, the compressor characteristic c changes with varying boundary conditions. While the analytic surge model enables surge to be understood at a system level, the effect of unsteady boundary conditions on detailed aerodynamics is yet to be analyzed. They need to be investigated and understood so that their influence on compressor characteristics can be described: this is essential for detailed surge prediction.


