Article

Flat Plate and Turbine Vane Film-Cooling Performance with Laid-Back Fan-Shaped Holes †

DIEF Department of Industrial Engineering, University of Florence, Via S. Marta 3, 50139 Florence, Italy
*
Author to whom correspondence should be addressed.
This paper is an extended version of our paper published in the Proceedings of 13th European Conference on Turbomachinery Fluid Dynamics & Thermodynamics, ETC13, Lausanne, Switzerland, 8–12 April 2019, Paper No. 314.
Int. J. Turbomach. Propuls. Power 2019, 4(2), 14; https://doi.org/10.3390/ijtpp4020014
Submission received: 3 May 2019 / Revised: 16 May 2019 / Accepted: 21 May 2019 / Published: 5 June 2019

Abstract

:
Shaped holes are considered as an effective solution to enhance gas turbine film-cooling performance, as they allow to increase the coolant mass-flux, while limiting the detrimental lift-off phenomena. A great amount of work has been carried out in past years on basic flat plate configurations while a reduced number of experimental works deals with a quantitative assessment of the influence of curvature and vane pressure gradient. In the present work PSP (Pressure Sensitive Paint) technique is used to detail the adiabatic effectiveness generated by axial shaped holes with high value of Area Ratio close to 7, in three different configurations with the same 1:1 scale: first of all, a flat plate configuration is examined; after that, the film-cooled pressure and suction sides of a turbine vane model are investigated. Tests were performed varying the blowing ratio and imposing a density ratio of 2.5 . The experimental results are finally compared to the predictions of two different correlations, developed for flat plate configurations.

1. Introduction

To prevent jet lift-off and consequently a loss of film efficiency, film cooling schemes of vane and blade generally adopt fan shaped film holes instead of standard cylindrical holes at the cost of increasing manufacturing complexity. Shaped holes are internally characterized by a cylindrical duct followed by a fan shaped style expansion that helps to reduce the jet velocity and to spread the coolant protection. Nowadays, several studies are available on the open literature dealing with shaped holes behaviour. Many of them highlight the effect of different geometric and fluid-dynamic parameters, in order to achieve an effective prediction of their performance [1]. In this context Colban et al. [2] used the results of past studies to develop a correlation to predict the adiabatic effectiveness produced by shaped holes on a flat plate. The correlation includes the influence of several geometrical parameters; however, as far as fluid-dynamics aspects are concerned, only the effect of blowing ratio ( B R ) was accounted for. To overcome this limitation, more recently Chen et al. [3] developed an improved correlation where the effect of density ratio ( D R ) was also considered. Although these correlations constitute powerful means for performance predictions, they have some limitations mainly due to the fact that it is not easy to cover, with a simple equation, the influence of the various parameters affecting the film cooling behaviour. Moreover, it must be considered that the level of knowledge of shaped holes performances drops considerably when the focus is shifted from flat plates to turbine vane/blade configurations. Concerning these cases, additional parameters have been recognized as important ones. Both the mainstream pressure gradient and the surface curvature play an important role in defining the film-cooling performance; the mainstream Mach number was also found to influence the results.
Early studies have been carried out to assess how cylindrical holes behave on either concave (i.e., pressure side) or convex (suction side) surfaces [4,5,6]. According to Han et al. [7], results demonstrated that it is fairly reasonable to state that a convex surface enhances cooling effectiveness at low momentum flux ratios while a concave surface performs better at higher momentum flux ratios. In particular, a concave surface is generally characterized by lower adiabatic effectiveness than a flat plate, due to the static pressure force acting on the jets that moves them away from the surface. Increasing the momentum ratio leads to a reduced coverage in the very proximity of the holes, but the area downstream of it is generally characterized by an improved effectiveness, as a stronger reattachment occurs, since the curvature is along the direction of the lift-off. For convex surfaces, on the other hand, effectiveness is generally higher than for flat plates, but an important drop-off in performance occurs as the momentum ratio overcomes threshold values; the adiabatic effectiveness is always higher in the proximity of the holes, as the surface curvature works against the reattachment. More recent studies focused on the analysis of cylindrical [8,9] and shaped holes [10,11] on actual turbine vane/blade geometries. Despite their conclusions were often qualitatively similar to the ones of the previous base studies, the quantitative behaviour could significantly deviate. Barigozzi et al. [12] and Gritsch et al. [13] also showed that an increase in Mach number (i.e., flow acceleration) could be beneficial to the film coverage, as the positive stream-wise pressure gradient creates higher velocities in the boundary layer and keeps the jets closer to the surface.
Despite these thorough investigations, the early-stage design of film cooling system on vane/blade surface generally adopts, because of their simplicity, correlations developed on flat plate test rig, missing the effects of pressure gradient and curvature. Moreover, the typical correlations for shaped holes have limited validity ranges and frequently, for a first step evaluation of the performance, the designers stress these equation beyond their limits. Therefore, the necessity of benchmarking these predictions with experimental characterizations of the specific configuration still stands. In the present work, pressure sensitive paint (PSP) technique was used to assess the adiabatic effectiveness generated by laid-back fan-shaped holes on a flat plate and on suction and pressure side of a 2D vane model. The test article was installed on a two passages cascade rig, in order to replicate representative conditions in terms of mainstream pressure gradients and aerodynamics. The shaped holes geometry was selected with a high value of Area Ratio (around 7), beyond the typical values considered by published correlations. Finally, these correlations were stressed on the experimental results to check their prediction capability on both the flow stands (i.e., with and without the effect of curvature and pressure gradients).

2. Experimental Apparatus

Two different test rigs were designed: the first one allowed to investigate the turbine vane configuration, while the second was used for the flat plate one.

2.1. Cascade Test Rig

As anticipated, the measurements have been performed on a prismatic vane specimen, built up by extruding the midspan profile of a second stage vane; the resulting vane height is 100 mm. The test article was installed in a cascade rig illustrated in Figure 1a, while a detailed view focussed on the test section is reported in Figure 1b. The test rig is installed in an open-loop wind tunnel, in which the main airflow is provided by two screw compressors. A plenum chamber is used to damp the non-uniformities in the airflow before it reaches the test section. The film-cooling system is fed from the top of the vane model; it presents an internal cavity so to have a feeding-from-plenum configuration for the cooling holes. The casing, where the blade is installed, is made by direct metal laser sintering, and its lateral walls have the same shape of the blade pressure side and suction side to simulate the presence of adjacent vanes. A CFD optimization process has been conducted for the design of both the casing and the downstream duct, to recreate periodic conditions. More details on rig characteristics can be found in Bacci et al. [14]. Three different optical accesses are used to frame a sufficient part of the cooled test article: the first one allows to investigate the lower part of the pressure side (closer to inner endwall), while the second and the third can be used to frame the upstream and the downstream part of the suction side respectively; a more detailed visualization of the investigated area can be obtained from the 2D contour plots reported in the results section. A turbulence grid with square rods is used to increase the mainflow turbulence up to about 10% on the leading edge position as measured using standard hot-wire anemometry technique. A calibrated orifice (standard EN ISO 5167-1) is used to measure the mainstream mass flow rate upstream of the test rig, while a Coriolis flow meter (Bronkhorst Coriflow M 55 ) is used for the coolant. Expected uncertainties stay within 1.3% and 0.5% for main and coolant flow respectively. T-type thermocouples and pressure taps are used to measure temperature and pressure across the mainflow path and inside the coolant cavity, to set and monitor the operating conditions; for the same reason a Kiel probe measures the total pressure at the cascade inlet. The expected uncertainty are ≈0.5 K for temperature measurements and ≈52 Pa for pressure measurements.
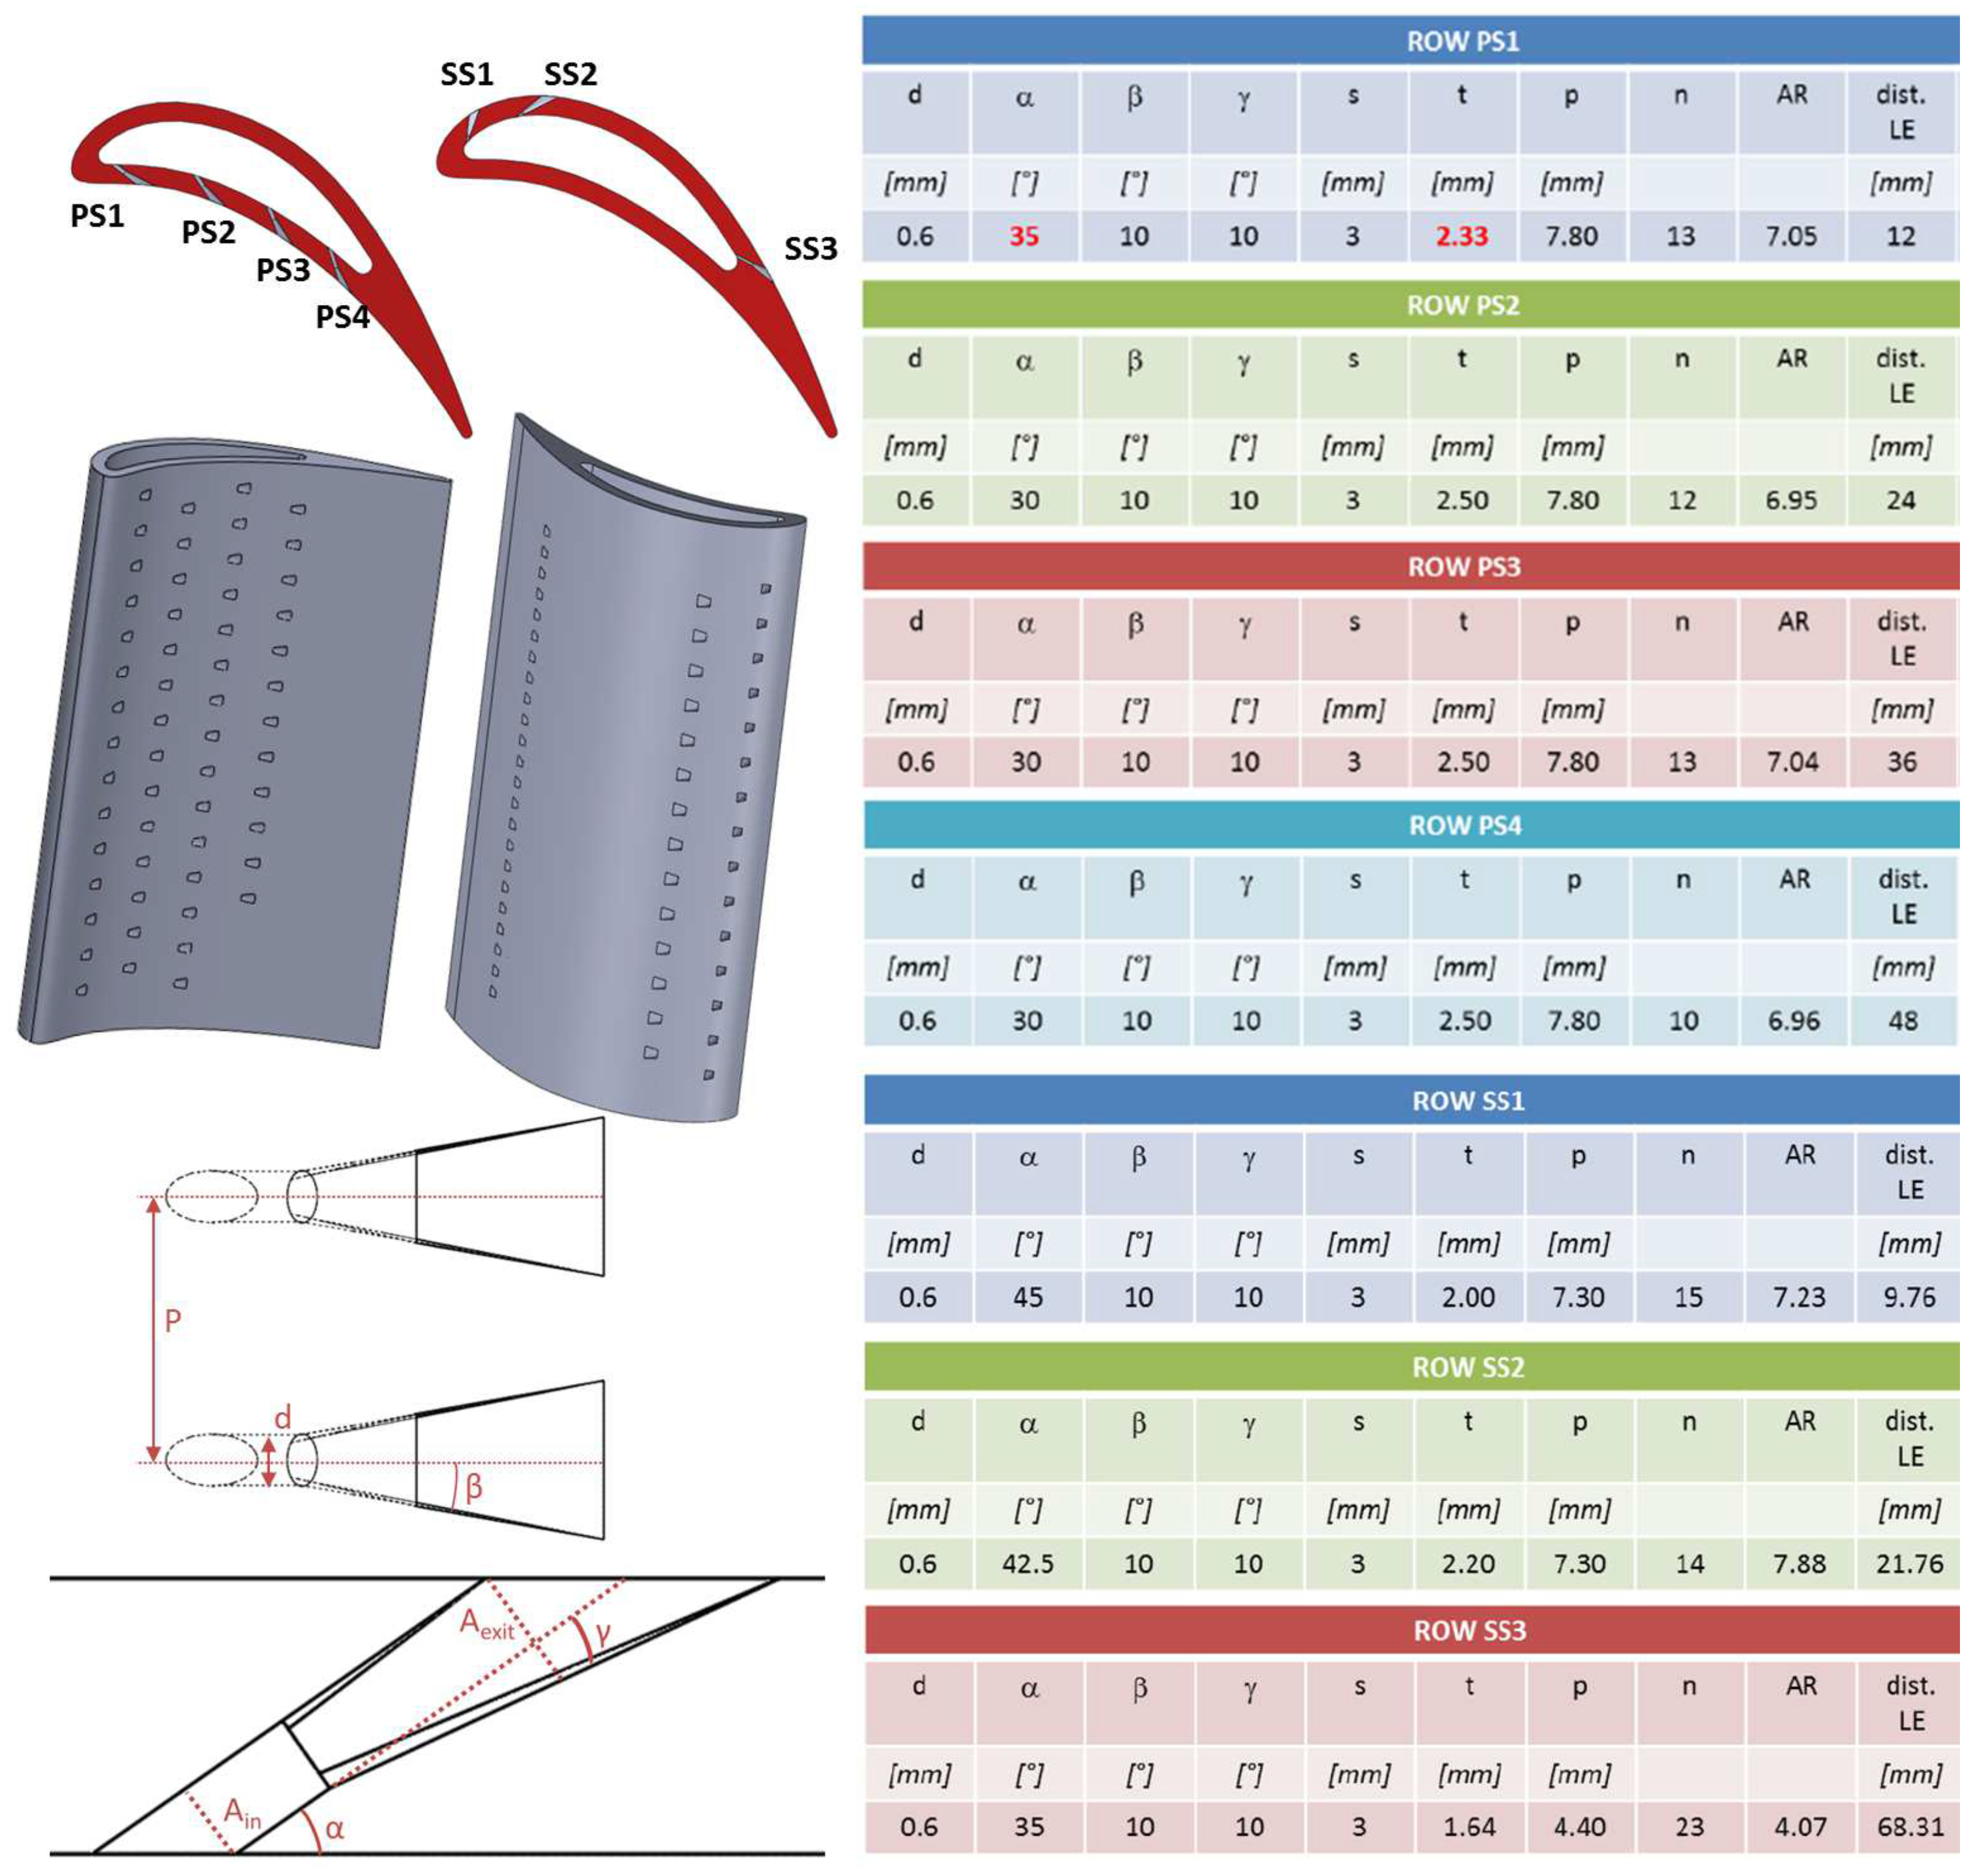
Two different test articles have been investigated: the first one has film-cooling holes only on the pressure side, while the other presents only suction side film-cooling; the choice was made to limit the coolant mass flow used for each test. Figure 2 shows 3D models of both test articles together with the relevant geometric parameters of the film cooling system. The first test article, called P S test article, has four pressure side rows with 10 to 13 film-cooling holes in a staggered configuration. Each rows is 12 mm distant to each other along with the curvilinear abscissa of the vane; the second test article ( S S ) has only three rows: two of them are located in the first part of the surface, while the third is far downstream and close to the trailing edge. All the cooling holes have a the real engine diameter of 0.6 mm. The other geometric parameters of the laid-back fan-shaped holes have been chosen to adapt to the local expected mainstream conditions and can slightly change from row to row. The only relevant variations stay in the surface angle ( α ) and in area ratio ( A R = A e x i t / A i n ) and coverage ratio ( t / p ), for the SS3 row. As stated above the shaping of the hole is quite aggressive with high value of A R close to 7 for all the other rows. All the geometrical details of the holes row-by-row are summarized in the tables of Figure 2. The test articles were manufactured in Inconel material using laser sintering technology and it was externally machined to restore an adequate finishing of the vane profile. The shaped holes were realized using standard EDM procedure which guarantee high fidelity of the internal hole geometry [15].

2.2. Flat Plate Test Rig

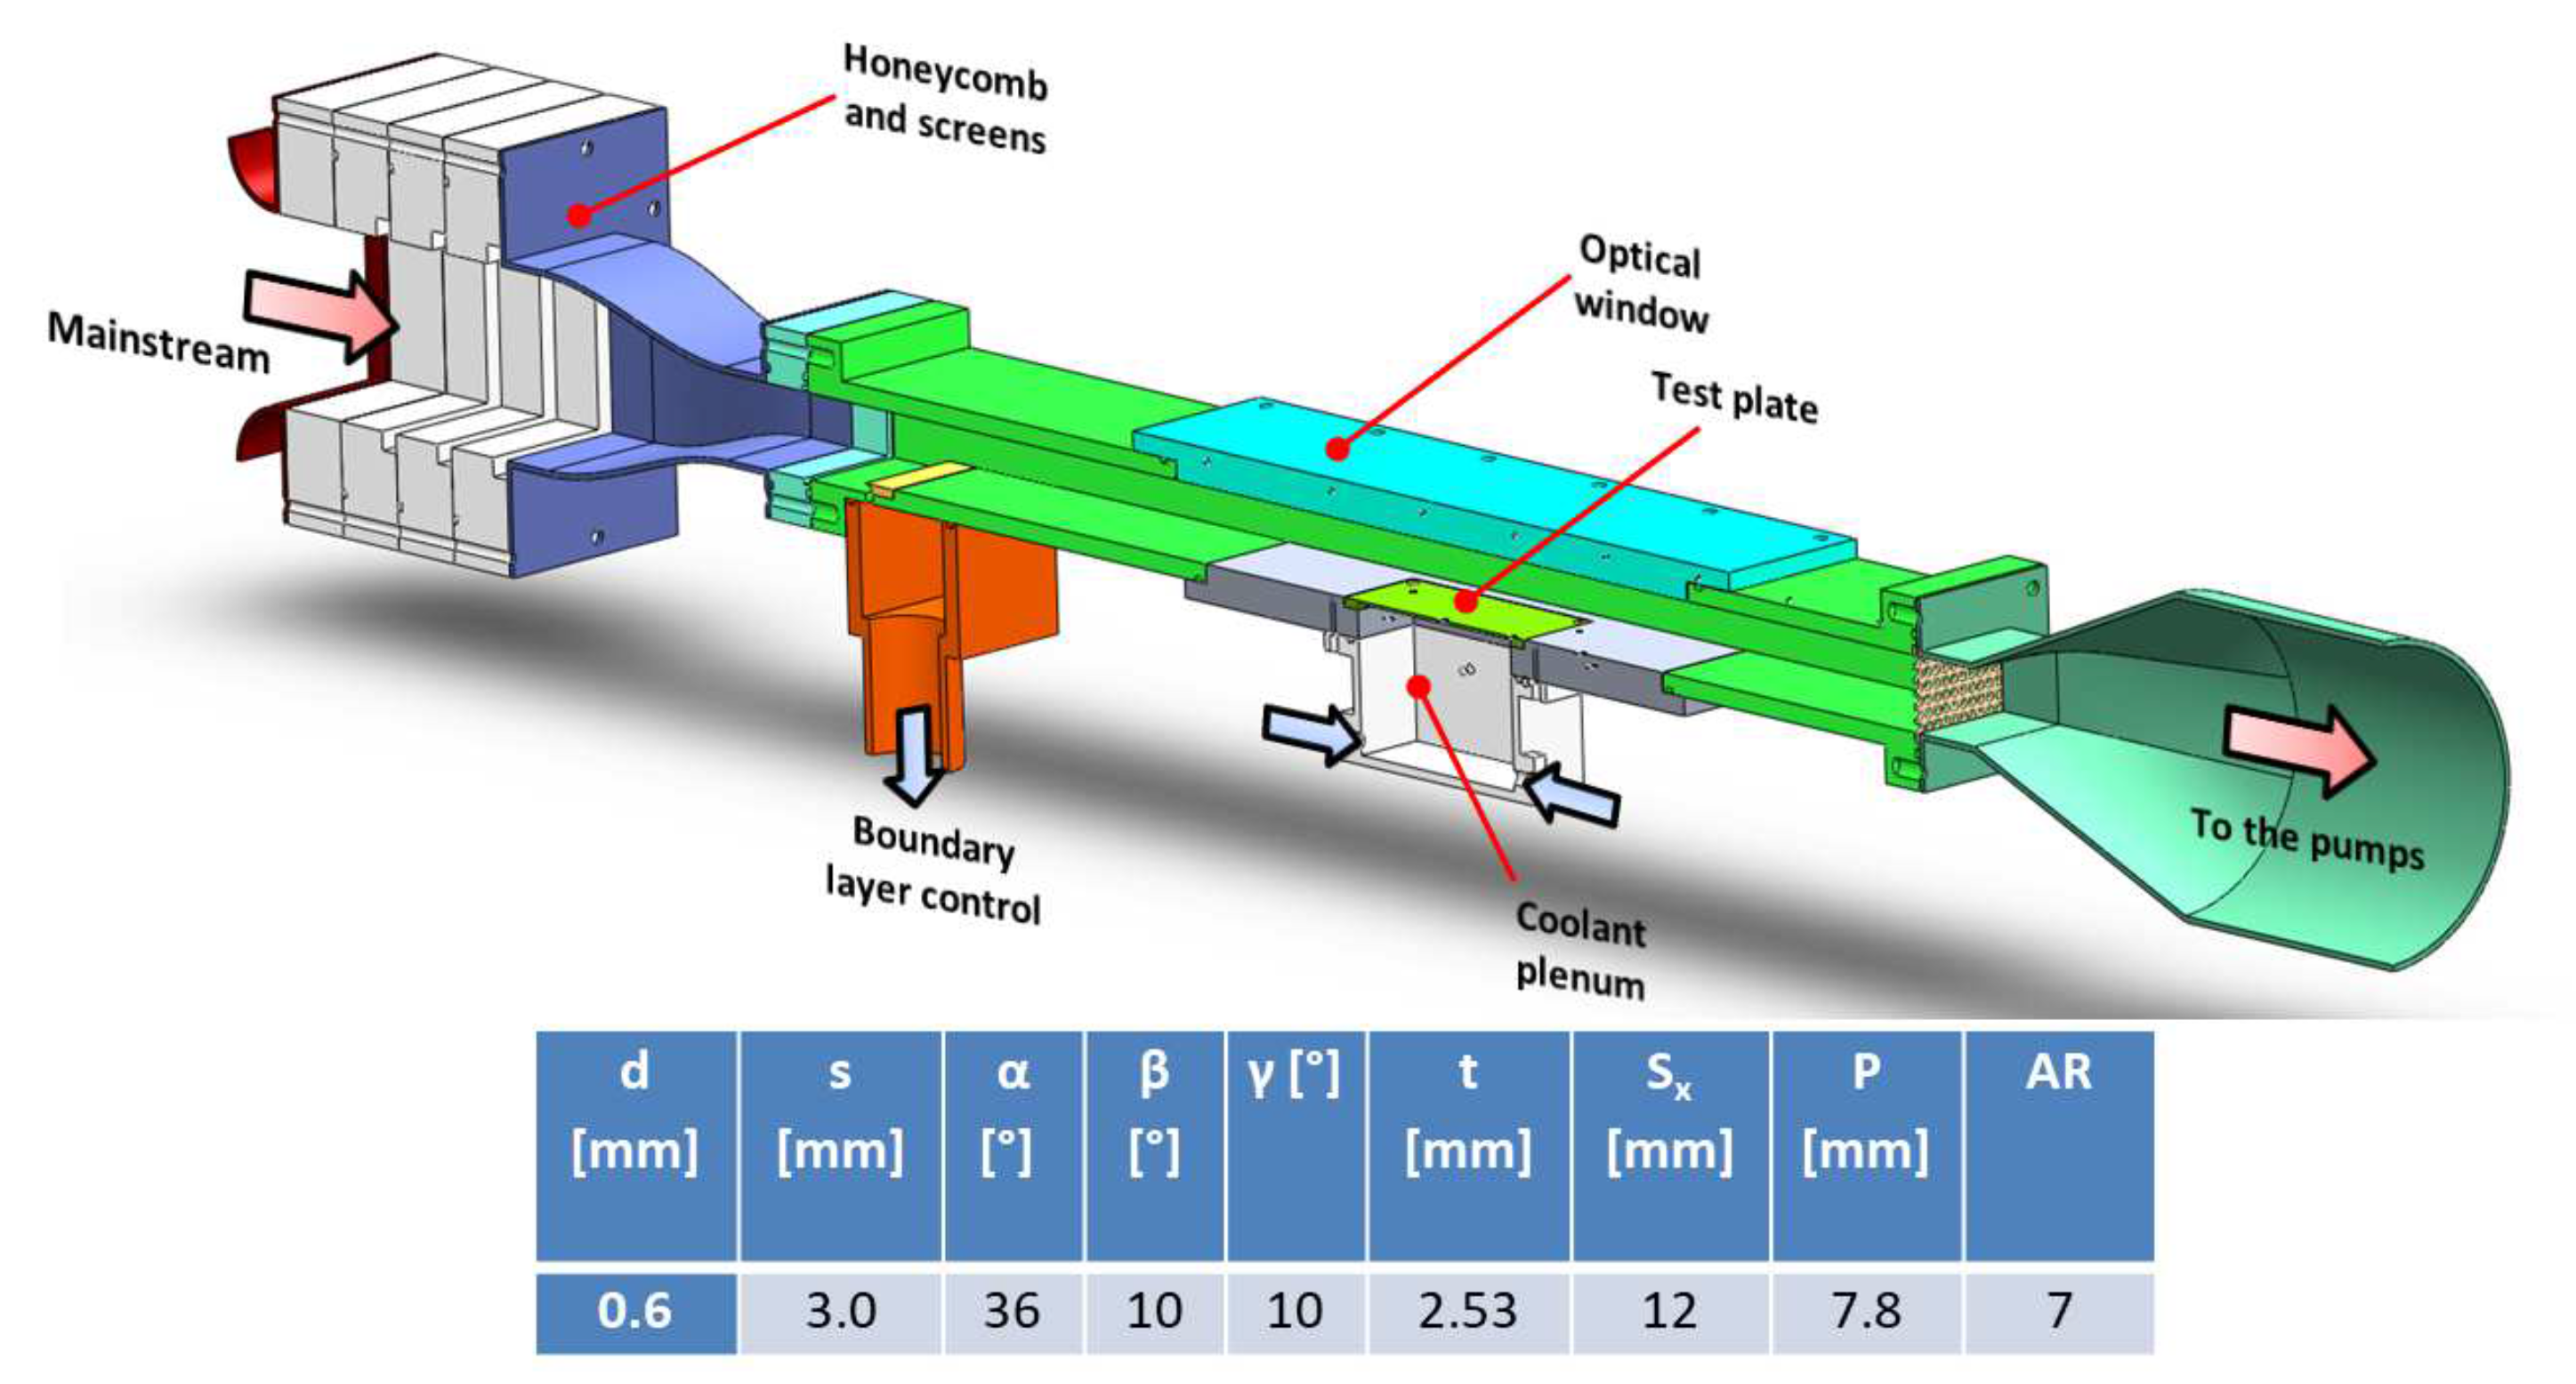
The flat plate investigation was aimed at testing, in a basic configuration, the behaviour of shaped holes selected with geometry parameters far from typical values available in the scientific literature. Tests were carried out using a test rig, depicted in Figure 3 with a constant cross section area ( 120 × 40 mm 2 ) in the mainstream path. The test article is completely made of transparent PMMA (Poly-Methyl Methacrylate), thus allowing the required optical access for PSP measurements. The mainstream is drawn by means of two vacuum pumps; before entering into the test section, it passes through a honeycomb and several screens to set a uniform velocity profile. The mass flow rate is measured with an orifice, suitably placed downstream of the test rig, according to the standard EN ISO 5167-1. Upstream of the measuring section, 12 % of the mainflow is drawn in order to fix the boundary layer starting point and control its thickness; a similar orifice to the one used for the mainflow is used to control the amount of bled air. The film cooling holes are fed by a plenum chamber, connected directly below the test plate. A grid is installed upstream of the test section to increase the turbulence intensity up to the values imposed on the cascade rig. As for the cascade rig, different thermocouples and pressure taps are used to control the operating conditions, with similar uncertainties. The geometric parameters of the film-cooling holes are also reported in Figure 3; all of them are very close to the values of the geometries investigated in the cascade rig including the diameter. Care was also taken selecting the same EDM manufacturing process adopted in the cascade test article. The tested plate ( F P test article) presents five rows with 7 or 8 holes in a staggered configuration. Further details on the film cooling facility can be found in Becchi et al. [16].

2.3. Operating Conditions

The operating conditions for both the test rigs are summarized in Table 1; the operating point of the mainflow in the cascade rig was selected to ensure a representative pressure gradient. Four different blowing ratios were investigated on the cascade rig, while only two for the flat plate. Both main and coolant flows were fed at room temperature, to allow PSP technique to be used. The density ratio was fixed at a representative value of 2.5, choosing an appropriate tracer gas for the cooling system (calibrated mixture of N 2 and S F 6 ). For the flat plate rig, the reported R e number was estimated using the length between the edge of the boundary layer removal plenum and the test section. From the measurement reported by Becchi et al. [16] the height of the approaching boundary layer is approximately 4.5 mm.
It must be pointed out that the reported blowing ratios are average values, while the local ones can slightly change from row to row, due to the variation in the mainstream (i.e., holes discharge) conditions. An account of the actual variations will be provided in the results section. To mitigate the differences in the mainstream Reynolds number, the flat plate tests were also carried out reducing the section of the mainstream flow path in order to twice the Reynolds. Negligible differences were found between the nominal and the high-Reynolds cases.
The throat Mach number was evaluated through preliminary CFD evaluations, aimed at the test rig design. It was also verified, in the commissioning phase, with an additional test article provided with pressure taps at 50% of the span. The results, reported in Figure 4, show a good matching between CFD predictions and experimental findings. The positions of the cooling holes on test articles P S and S S are also reported.

3. Experimental Technique and Data Reduction

The pressure sensitive paints (PSP) are organic substance, composed by oxygen sensitive molecules embedded in the paint solution using a polymer binder permeable to oxygen. If excited with a UV light, the paints can be used as wall oxygen concentration detector. Since the oxygen concentration can be easily linked to the partial pressure of air, the properties of PSP make the mixture adequate for adiabatic effectiveness measurements using heat and mass transfer analogy, as described by Han et al. [7]. To do so, it is necessary to use an oxygen-free tracer gas in the coolant flow. For the present work a N 2 S F 6 mixture was used to reach a density ratio of 2.5. A scientific grade camera (PCO.1600, 1600 × 1200 pixel) was used to acquire the PSP response through PMMA windows installed on the optical accesses highlighted in Figure 1 and Figure 3. The UV light (from a UV LED Illuminator system IL104) passes though the same windows to excite the painted test articles. A blue filter is applied on the UV LED, to filter out the emission components below 470 nm, while a 610 nm red filter is installed on the camera. A thorough description of the measurement technique can be found in Caciolli et al. [17]. The expected uncertainty stays within about 10 % for η a d = 0.2 and 2 % for η a d > 0.8 .

4. Experimental Results

4.1. Adiabatic Effectiveness Measurements

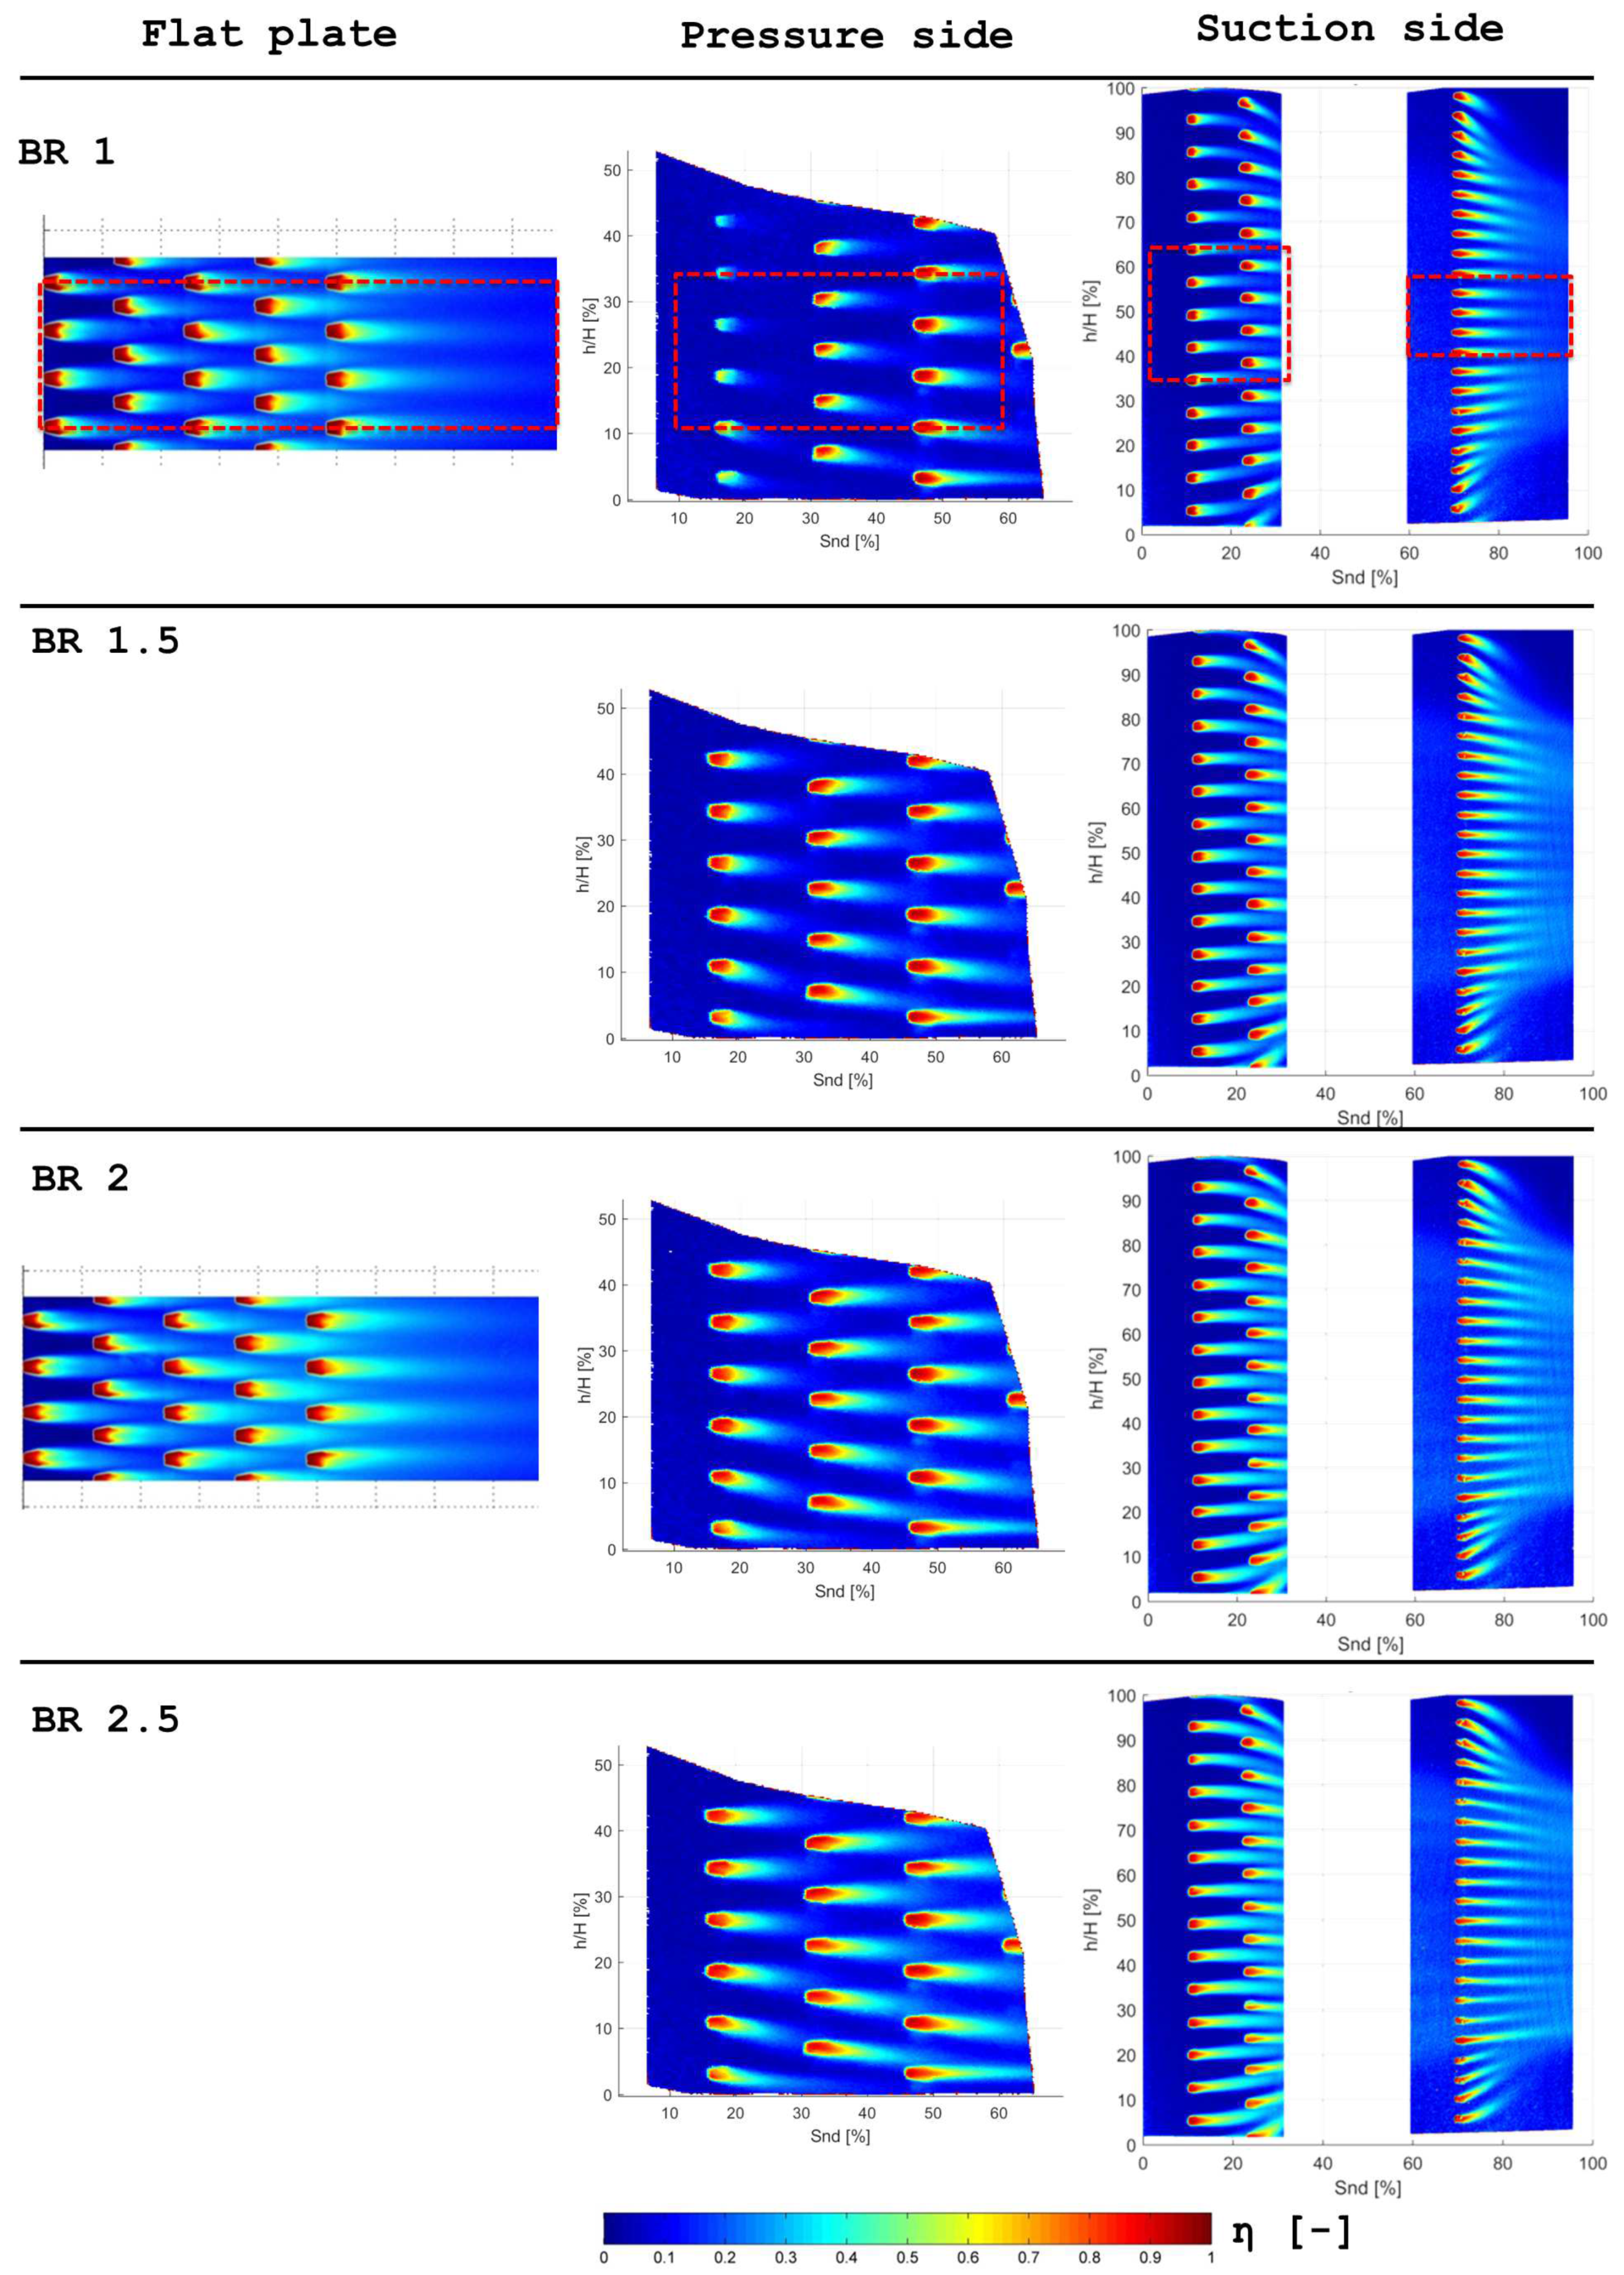
Figure 5 shows the adiabatic effectiveness contour plots for all the tested configurations and blowing ratios. The different camera framings do not allow to cover the whole vane surface; nevertheless, the investigated areas are wide enough to characterize the behaviour of the film-cooling holes on the different surfaces. At a first sight it is possible to note, for the suction side results, a strong effect of the secondary flows, as the coolant traces are driven away from the endwalls towards the midspan; this well-known effect [10,11] determines the presence of uncovered areas close to the endwalls, in the region between rows SS2 and SS3 and close to the trailing edge. In the latter location, this phenomenon also creates two areas (h/H = 65%–80% and 20%–35%) where the effectiveness is slightly higher than at midspan, due to the superposition of the converging coolant traces. On the pressure side the effects of secondary flows, that generally moves the traces towards endwalls, can be hardly noted on the maps.
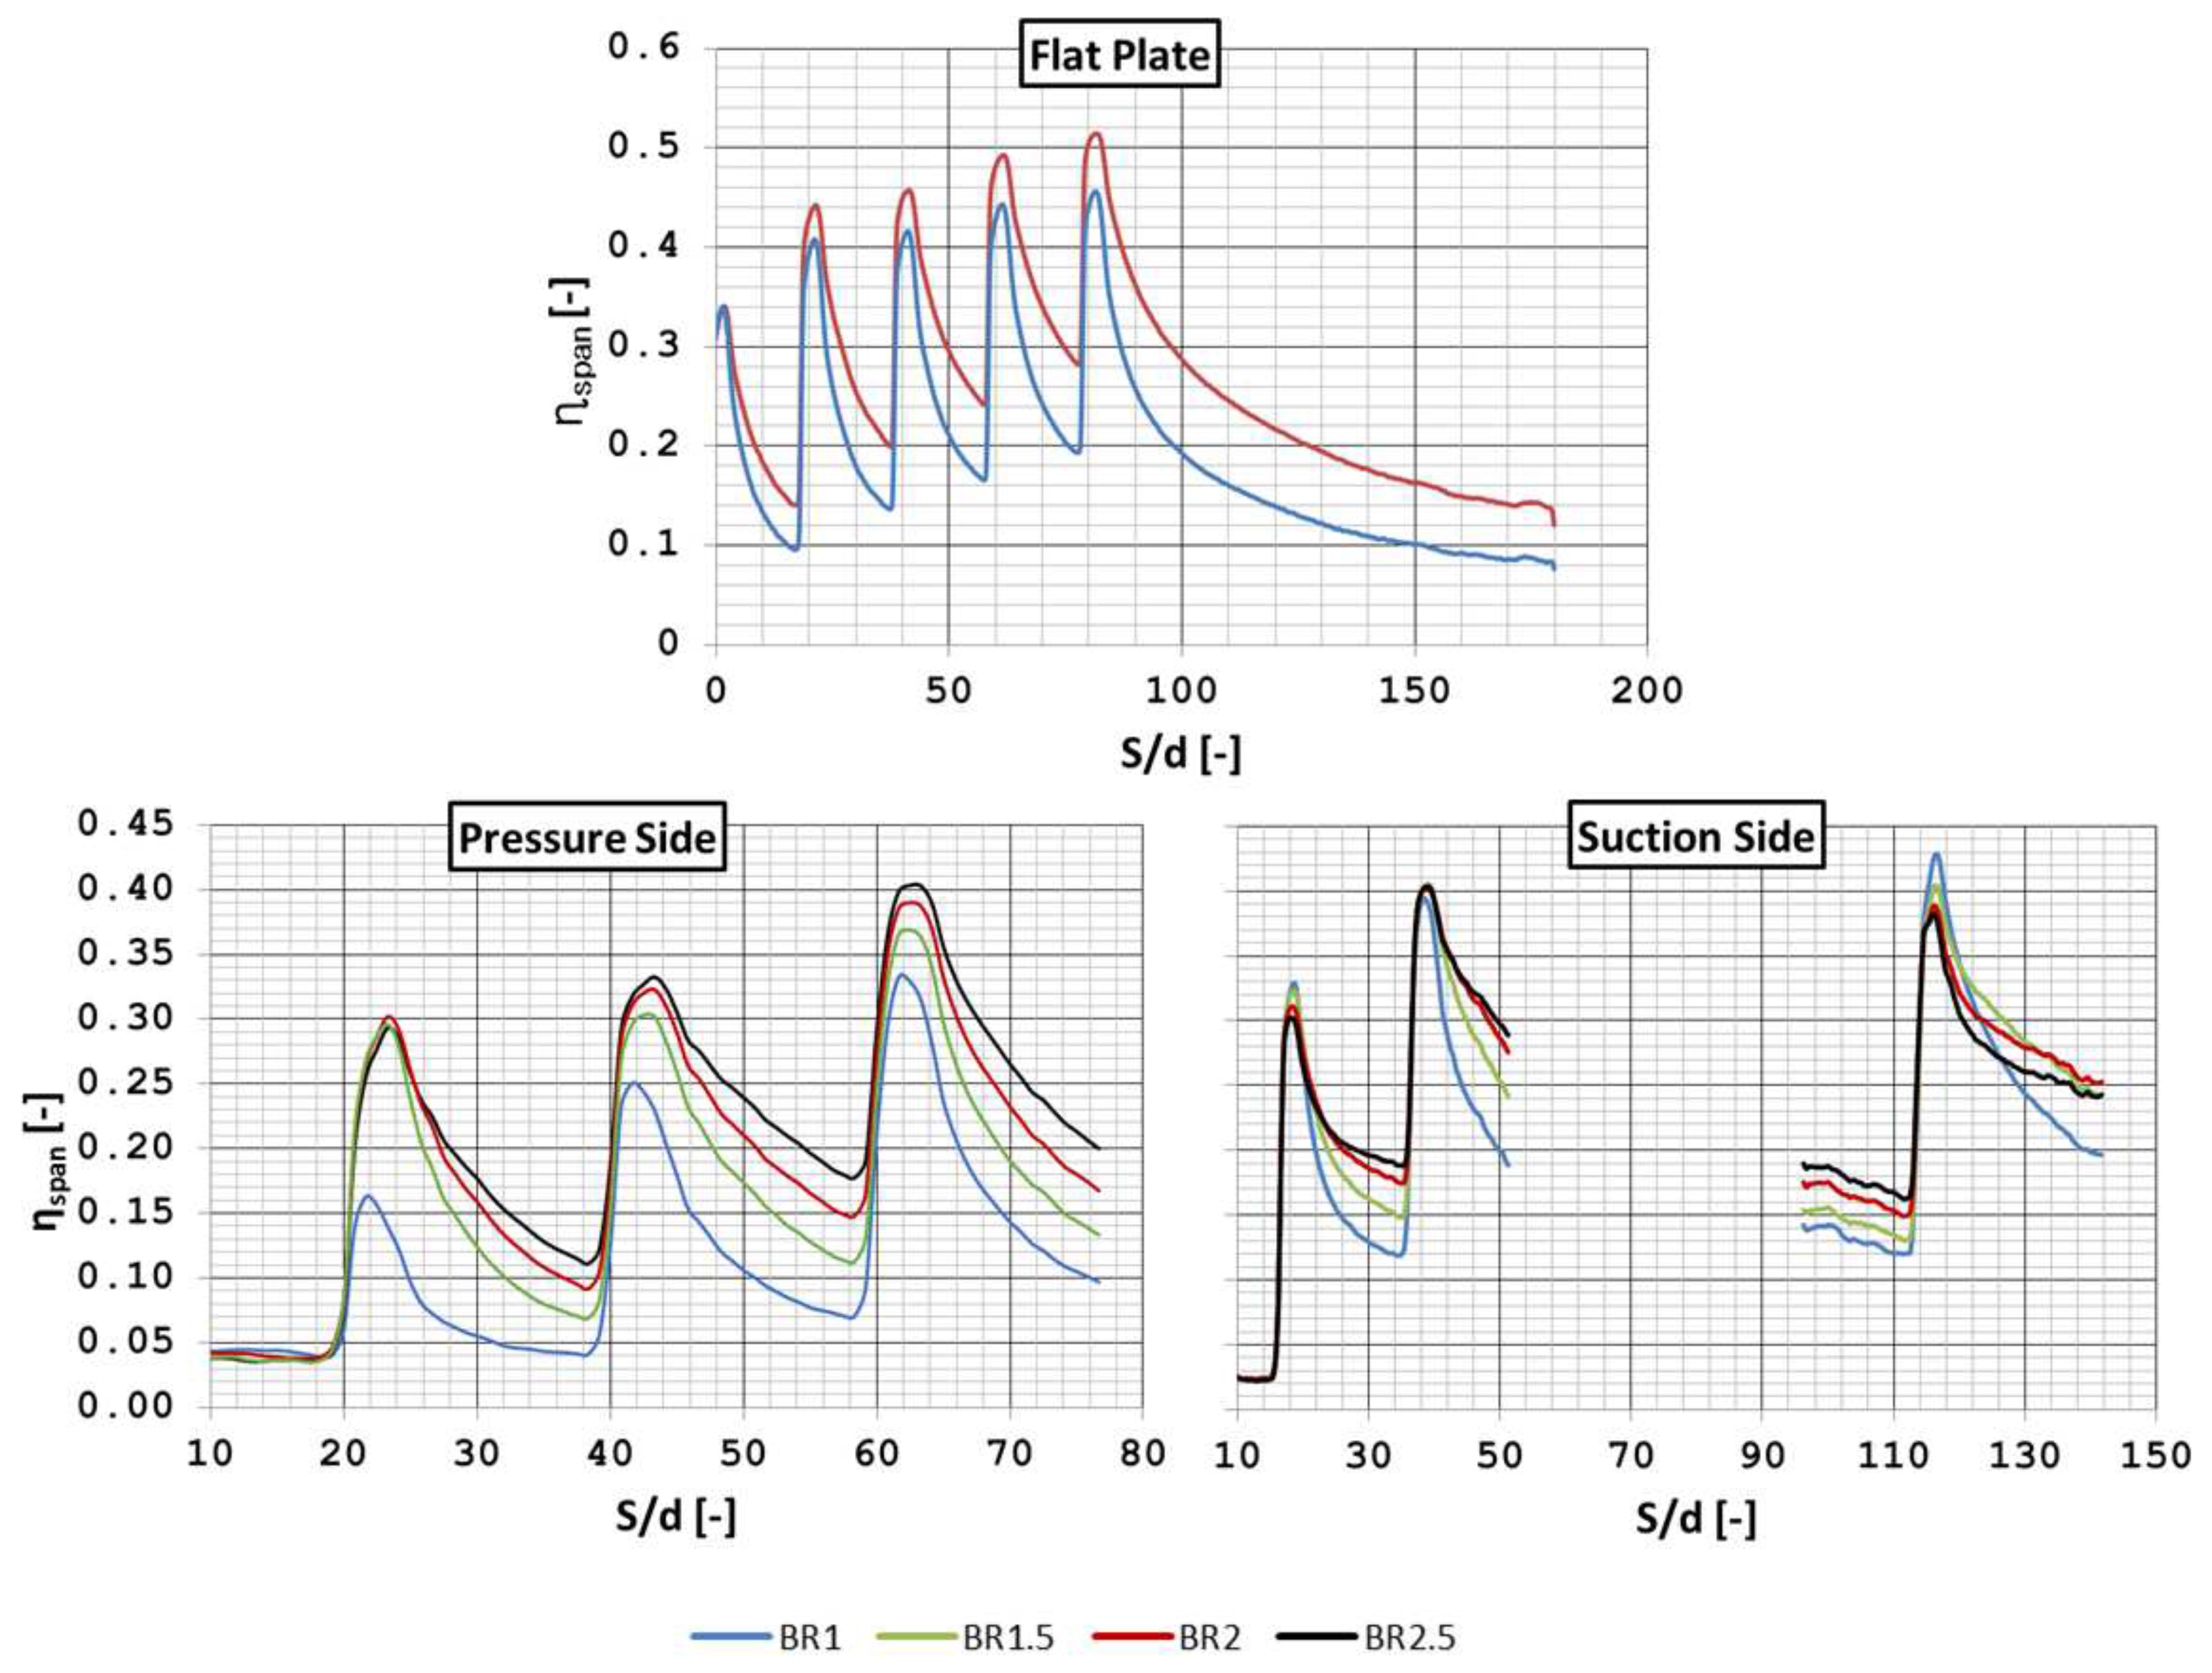
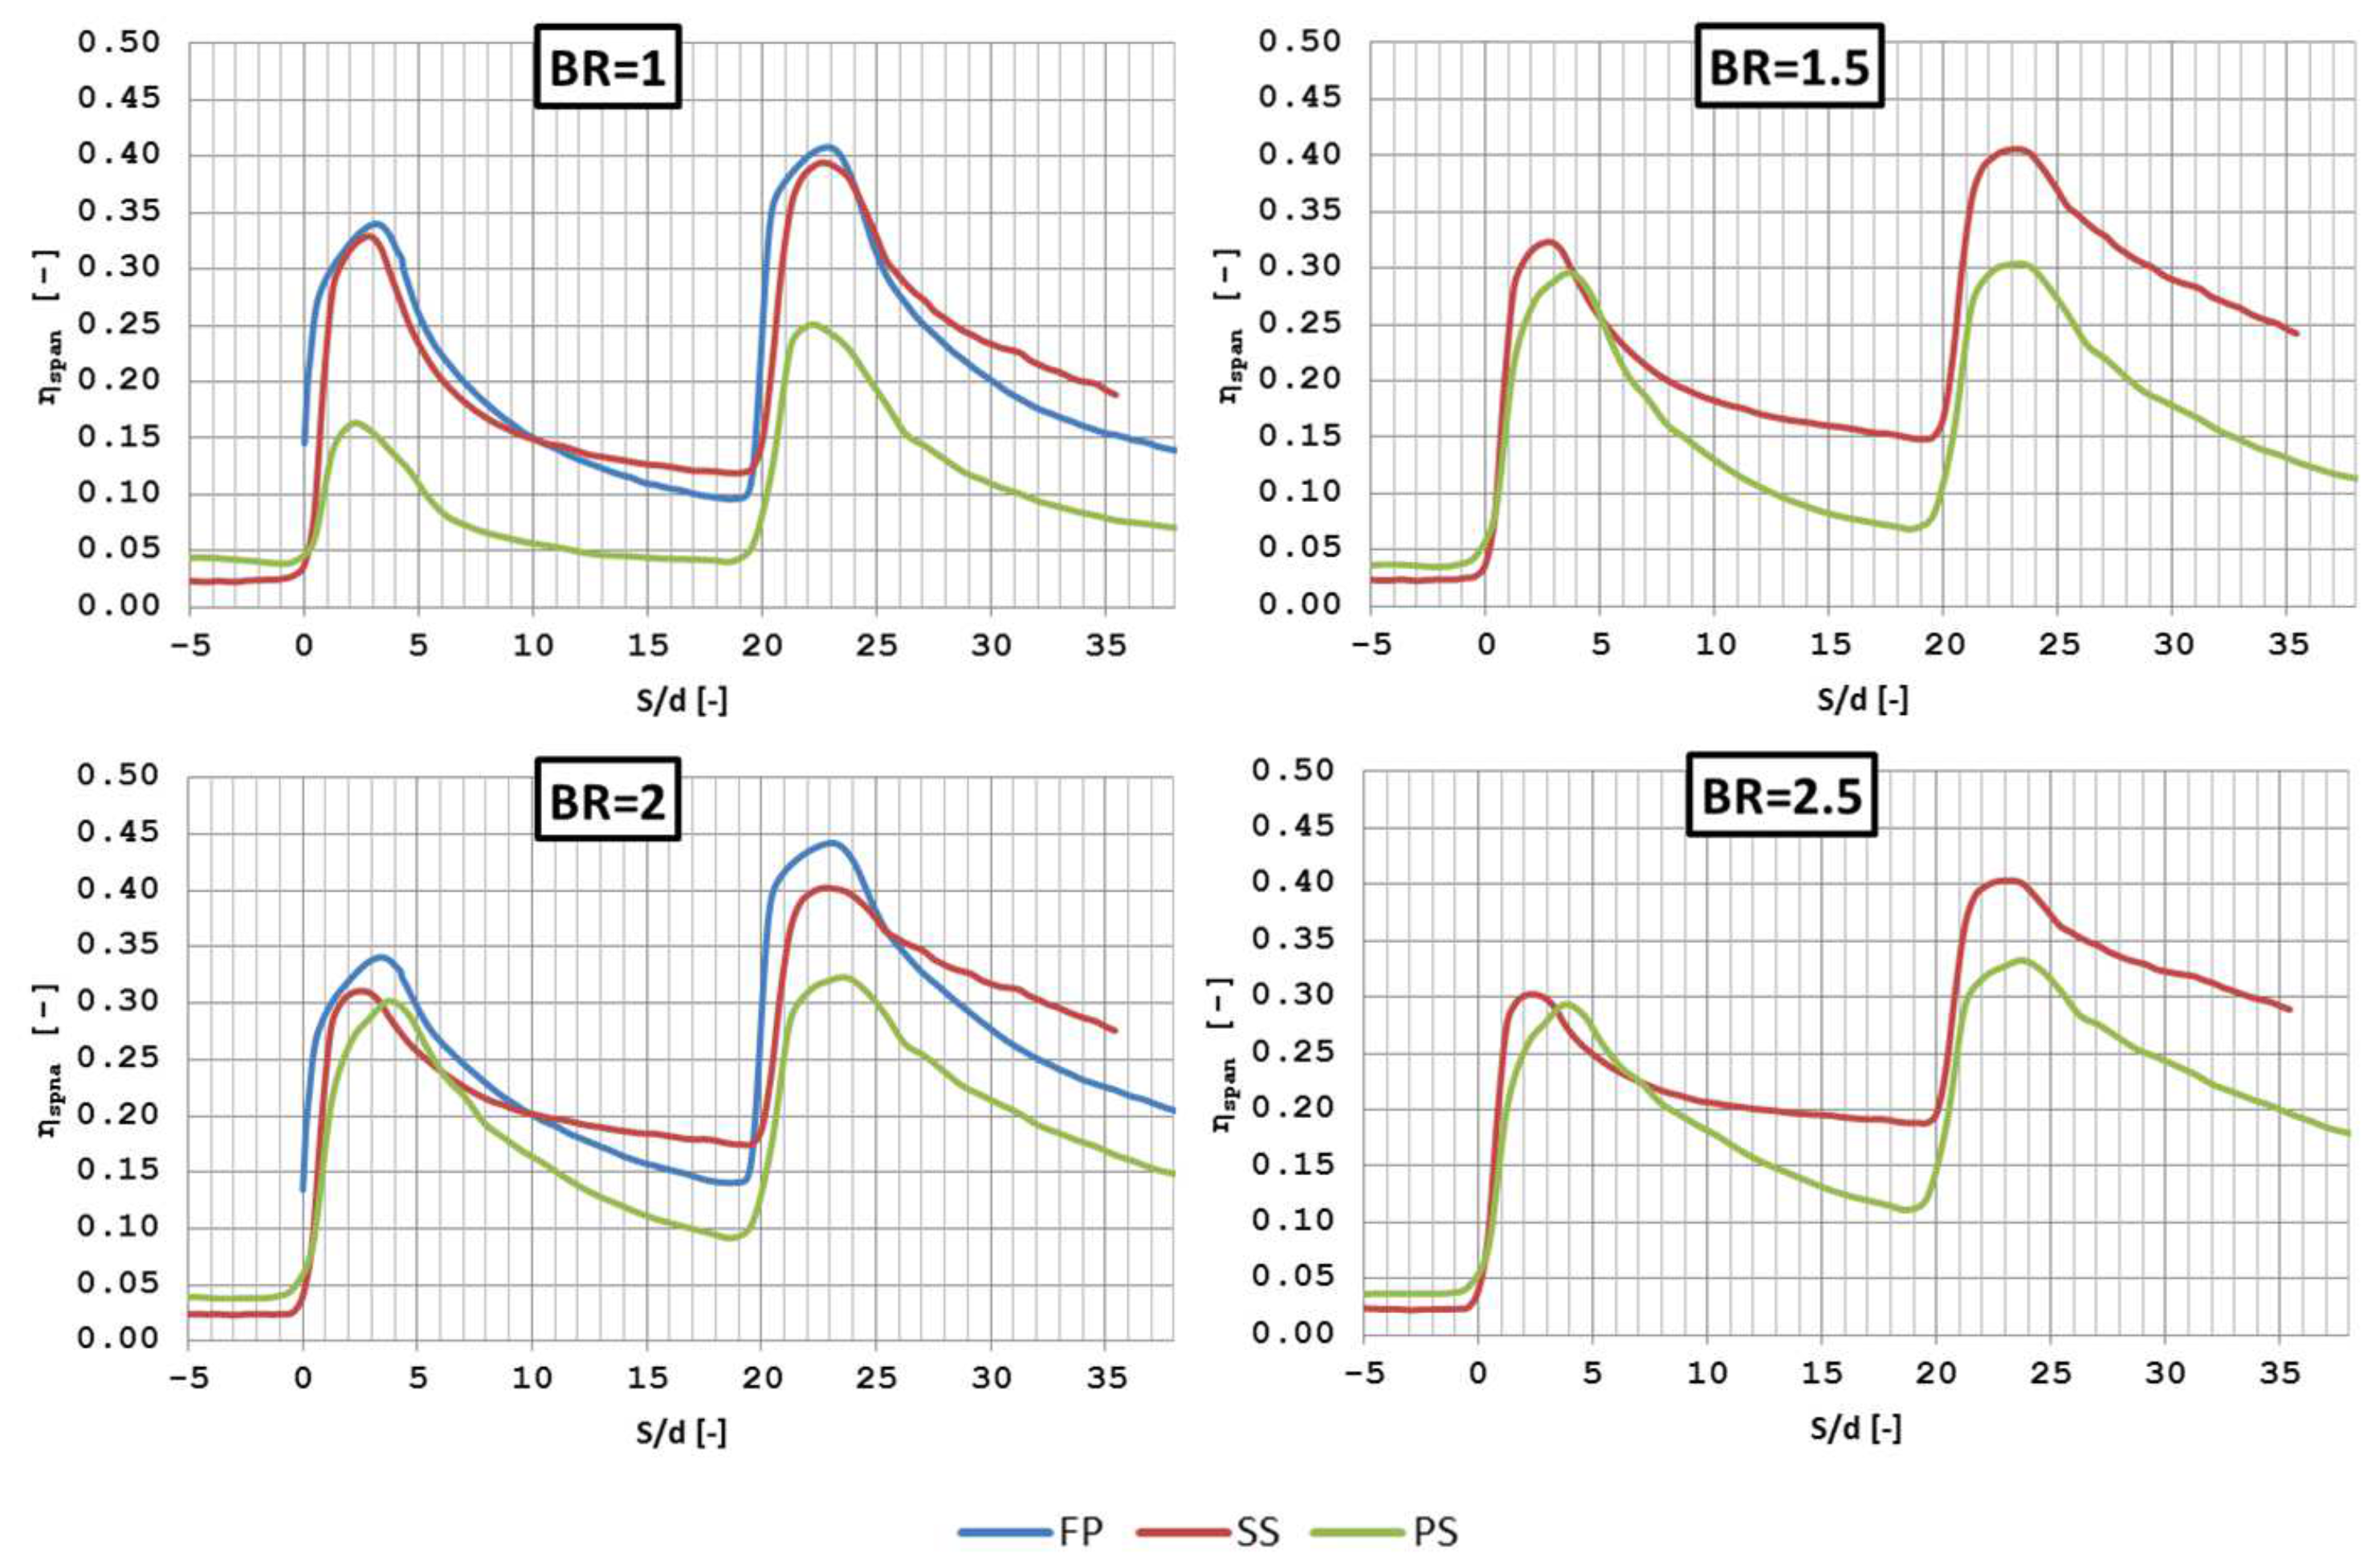
An increase in blowing ratio determines important improvements, with longer coolant traces, in the film coverage on PS and FP results; for row PS1, at BR = 1, the local pressure ratio across the holes is very low and hence the performances near the exit of the hole is affected by the ingestion of mainstream. To better explain the behaviour, Figure 6 shows the 1D profiles of spanwise averaged effectiveness. The averaging areas, reported in Figure 5 with dotted red boxes, were selected far from the effects of secondary flows. The profiles confirm that an increase in the adiabatic effectiveness occurs for both PS and FP, as long as the B R is enhanced: on the pressure side, in particular, the increase in the jets momentum is beneficial, as it works against the effect of the vane pressure gradient that tends to move the jets away from the surface. Regarding the suction side, the increase in B R is detrimental for the film protection especially close to the holes break-out position where the surface curvature enhance the lift off phenomena. On the other hand, an increase of cooling flow helps the film coverage in the downstream areas where the higher amount of coolant injected reattach to the airfoil surface. For these phenomena, the SS averaged trends present a steep decay of adiabatic effectiveness close to the hole break-out, while the results get flatter downstream. This particular behaviour seems more emphasized by the blowing ratio and it strongly affects the shape of the averaged profiles downstream the row SS3.
In Figure 7 a direct comparison between FP, SS and PS results is reported varying the mean blowing ratio. The comparison has to be limited to the first two rows of cooling holes, as they are the only ones where the streamwise pitch is the same for all the configurations. It is worth to notice that, for the cascade rig, tests are setup imposing an averaged value of B R : differences between the averaged values and real local B R can occur especially at the lower coolant conditions. However, the intent of the Authors in this part of the data analysis is to emphasize the role of curvature and pressure gradient mainly on the shape of film effectiveness instead of comparing local values. The measured values are quite similar for SS and FP configurations. In particular, very similar peak values, are achieved while the decay rate slightly differs: for B R = 1 and 2 the SS results show a steeper decay close to the hole exit, while they tend to recover downstream and their values are slightly higher respect to the flat plate. Increasing B R , the FP configuration tends to provide the better results in the peak locations.
On the other hand, the PS results show significantly lower adiabatic effectiveness levels. Looking to the the full set of trends from B R = 1 to B R = 2.5 , the main difference between SS and PS can be found on the different shape of the film effectiveness downstream the hole exit: the PS trends have a strong drop off of film covering and just upstream the second row of holes the effectiveness is far below the set of data collected on the SS. At B R = 1 the difference is appreciable, even if the PS result is biased by the very low local B R of the first row. The differences between PS and the other two configurations tends to reduce as the BR is increased: at B R = 2 , the peak adiabatic effectiveness of the first cooling row is very similar between PS and SS.
Clearly, this comparison is affected by the local row-by-row values of B R that can not be precisely the same for FP and vane results since the mainstream conditions will induce a B R variation among the cooling rows of the vane configurations. In the next paragraph an attempt to scale this effect and achieve a more effective comparison will be provided, thanks to the adoption of a correlative approach.

4.2. Comparison with Correlations

Once the experimental results have been described and analysed, it is possible to provide a comparison with the values predicted by two correlations, developed for flat plate configurations (no effects of curvature and pressure gradient). The considered correlations were developed and described in the works of Colban et al. [2] and Chen et al. [3]; as described in the introduction, the second one provides little modification with respect to the first one, aimed at including the effect of the density ratio. The superposition effect between different rows is considered using Sellers’ superposition approach [18]. Concerning the geometrical parameters, the cited correlations were developed within the following ranges of area ratio, hole spacing and coverage ratio:
2.5 < A R < 4.7 ; 4 < p / d < 8 ; 0.31 < t / p < 0.75
The film cooling arrangements tested in this work actually present values outside of this ranges, or at the lower limit for t / p , for FP, PS and for most of the SS configuration. Only the last row of the SS geometry presents values that fall within the correlations limits. For this reason it could be expected that some discrepancies could exist between the predicted values and the experimental findings. Despite that, the used correlations constitute, in the authors’ knowledge, the most accurate and comprehensive tools to describe the performance of shaped film-cooling holes, as well as the most adopted ones. The intent of the authors by comparing the experimental database with the outputs of these correlations is to asses their reliability in predicting the film performances of holes with an aggressive shaping ( A R 7 ) and to underline a possible under/over estimations when the pressure gradients and surface curvature are considered.
The local values of B R , for the different rows, to be used in the correlations, were calculated knowing the mainstream local conditions, by CFD results, and an average holes discharge coefficient value, through the results of a preliminary flow check. The local, row-by-row, values of B R is provided in Table 2.
As it can be noted from the table, some consistent discrepancies between the local values and the nominal B R occur, especially concerning the PS. Row PS1 shows the maximum variation of B R with very low values at the average B R = 1 , due to the very low pressure ratio across the holes, and very high values at B R = 2.5 , due to the fairly limited mainstream velocity. Consequently the downstream rows show opposite behaviours in order to reach the nominal average value, while the suction side holes are much closer to the nominal one. Since these differences, not present in the flat plate configuration, can not be considered through the simple analysis of the experimental results, the comparison with the correlations assumes mandatory importance as it allows to account for the actual local values of B R . Summarizing, the comparison with these correlations is useful to complement the presented experimental data for the following reasons:
  • Compare correlation predictions to a baseline flat plate configuration, in the case of film-cooling holes with aggressive shaping, so to assess their prediction capability.
  • Remove the effect of the variations of fluid-dynamic and geometric parameters, from row to row and between different configurations, that could bias the FP-vane comparisons reported in Figure 7, since they are accounted for in the adopted correlations.
  • Assess how the actual performance on the vane can deviate from what would be calculated through common correlations.
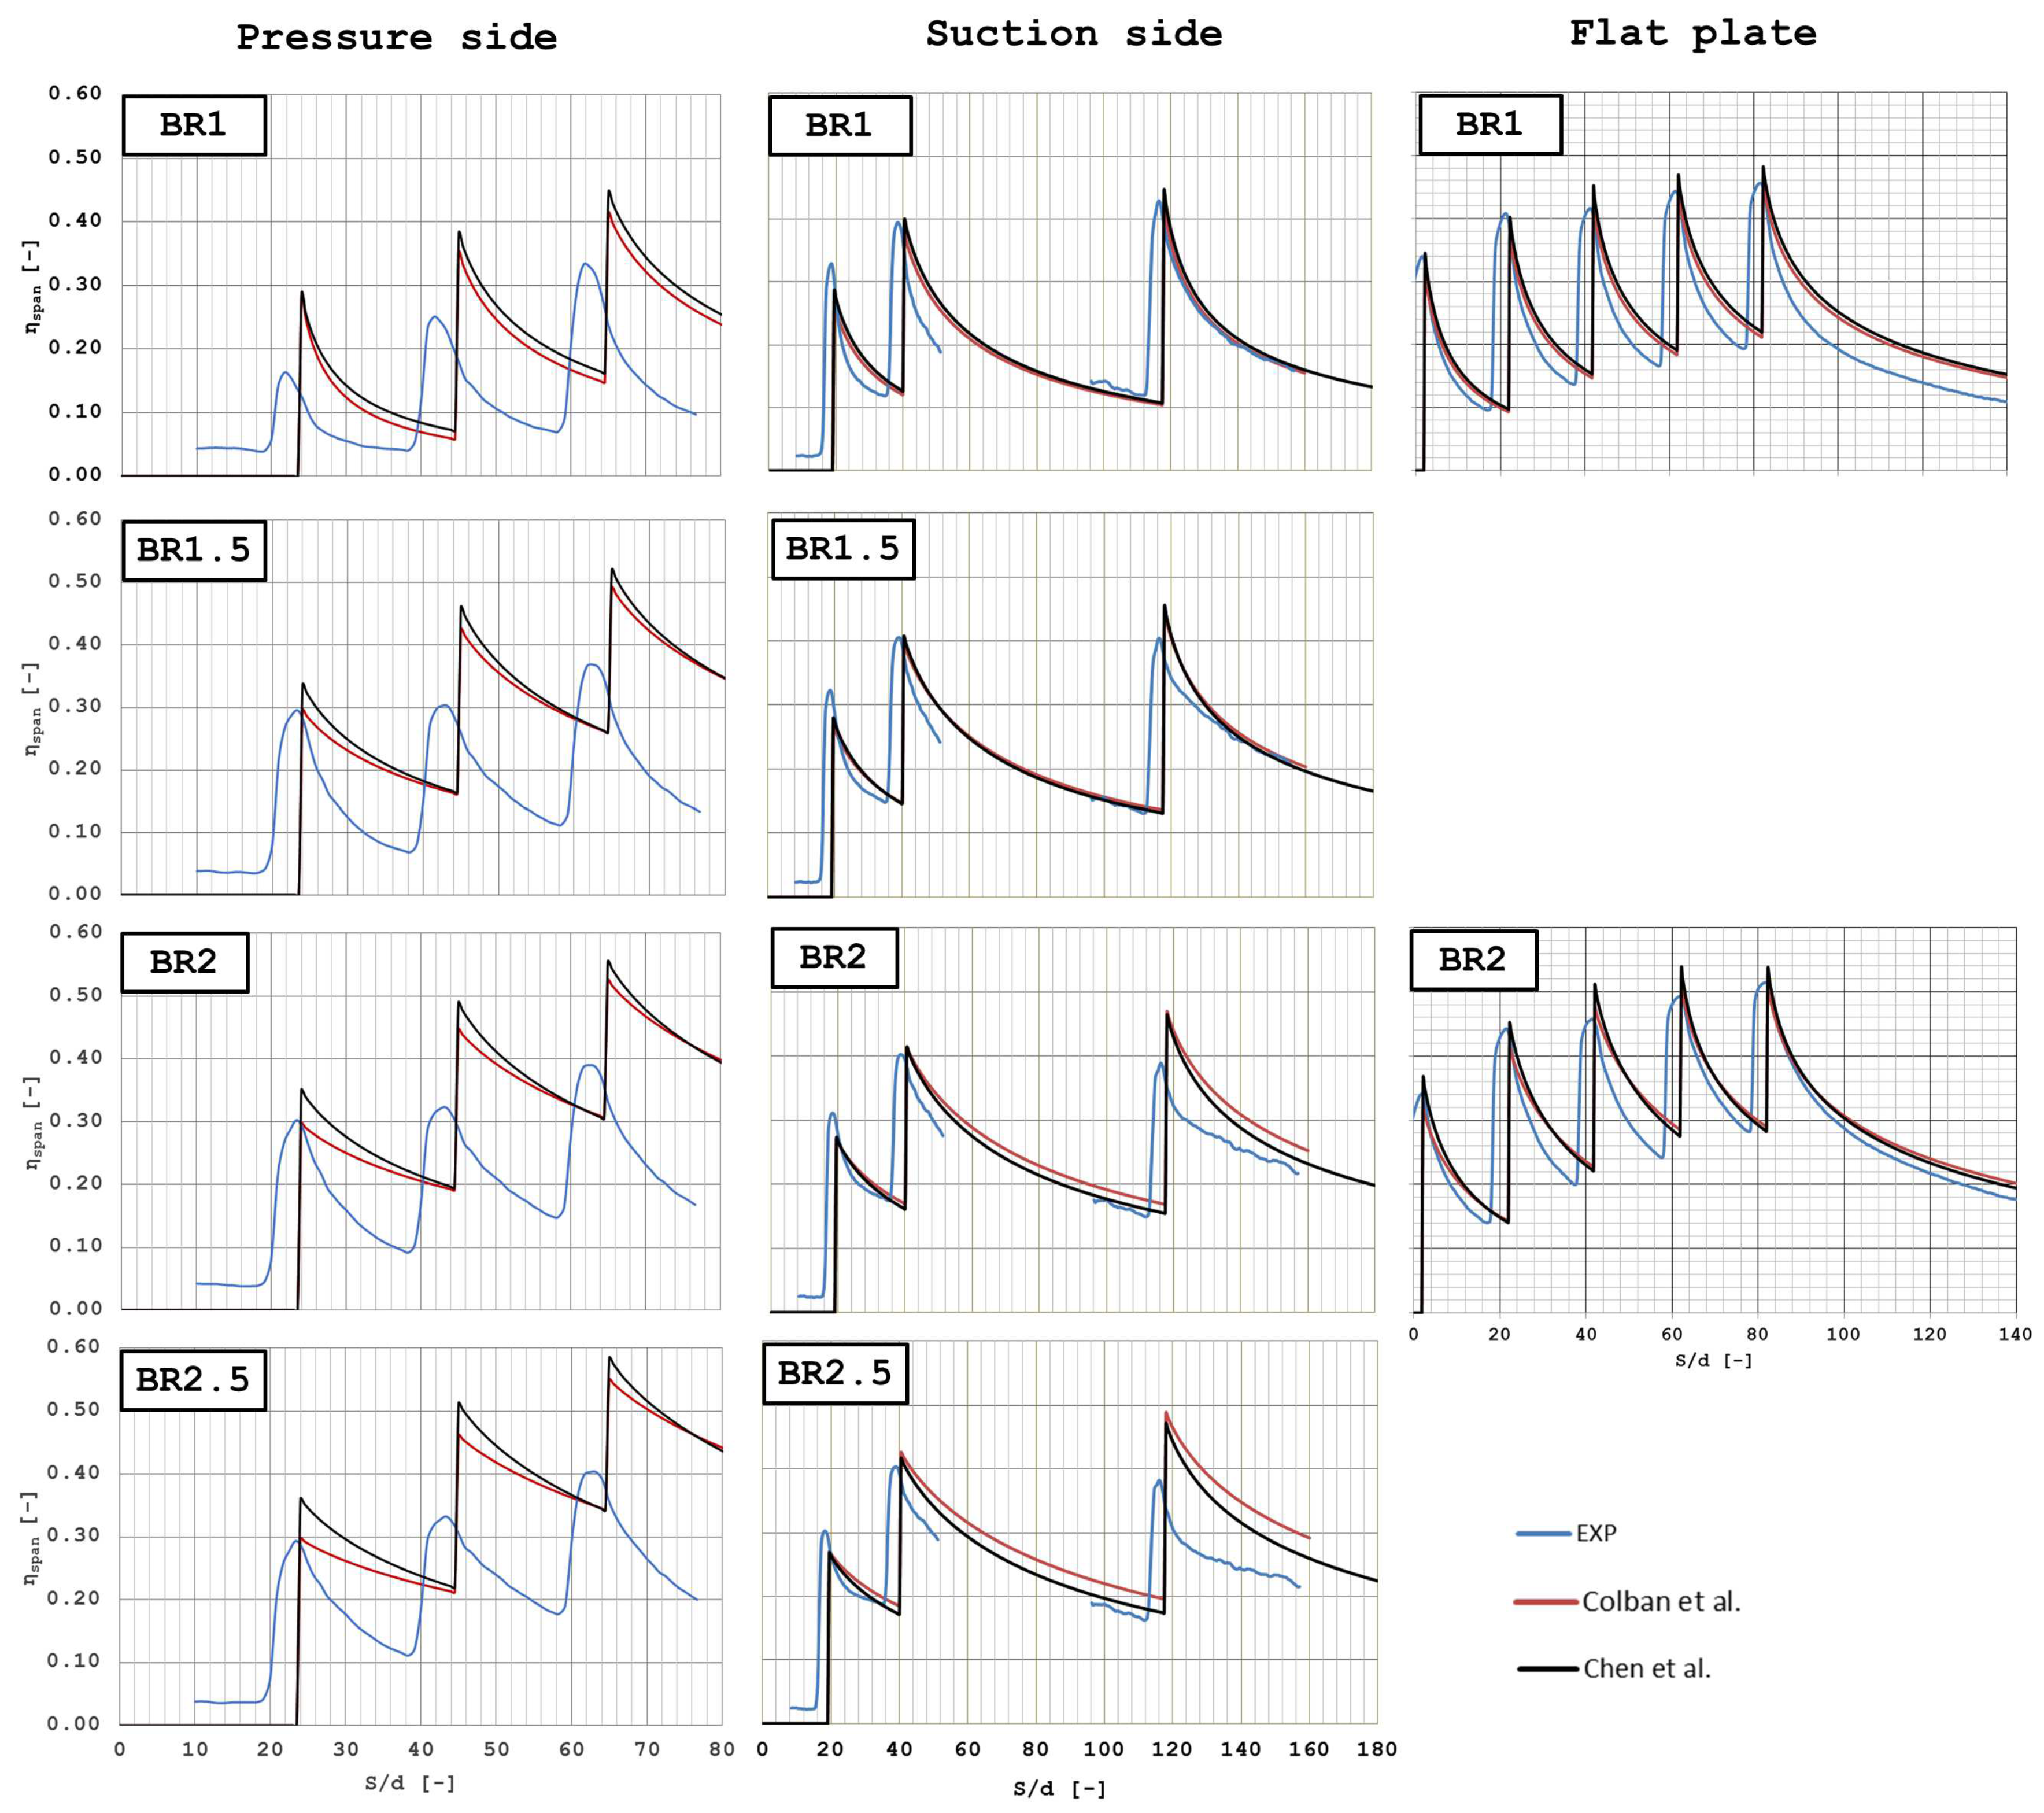
The comparisons are reported in Figure 8 for all the configurations and test points. It is worth to underline that the correlations locate the peak values at the hole break-out position; its intensity only depends on the coverage ratio of the holes, assuming η = 1 over the whole spanwise length of the hole t. These hypothesis clearly represent an approximation of the coolant behaviour since in the experiment the adiabatic effectiveness starts to increase upstream of the break-out and the peak value can be lower if the hole is overly diffused and jet separation occurs inside it. Analysing the results of Figure 8, the hypothesis of the correlative approach must be considered especially looking to the film values near the rows of holes.
Starting from the FP configuration, the correlations tend to predict slightly higher peak values and a reduced decay rate, with respect to the measurements. In the authors’ opinion this is due to the effect of the area ratio since the correlations have been developed using experimental data collected on configurations whose AR ranged from 2.5 to 4.7; according to this data, an increase in the adiabatic effectiveness with the AR is predicted by the correlations. On the other hand, Gritsch et al. [19], showed that the effect of AR was marginal beyond 3.5. For these reasons it is reasonable to assume that the extrapolation of the correlations predictions at a higher AR (more than 7 for the tested configurations) could provide an overestimation of the adiabatic effectiveness. The hole spacing could also play a role, if the correlations underestimated the decrease in effectiveness, increasing p / d beyond their limits ( p / d = 8 ), but, in the authors’ knowledge, there is no proof of this in the open literature. A slightly better prediction of the decay rate is provided by the correlation that accounts for the actual D R value, but the impact of this parameter is very limited. Despite these difference, the matching between correlations and experiments is acceptable, pointing out at the reliability of the correlative model to quantify the effectiveness generated by the tested hole pattern and flow conditions. Therefore, an effective comparison between the vane experimental results and a flat plate configuration, described through the correlation-predicted values, accounting for the actual and local fluid dynamic conditions of the vane configurations, can be carried out in the following.
The correlations always over predict the PS results in a significant way. Even if the increase in B R is beneficial to the pressure side behaviour, as showed previously, it doesn’t actually result in an improvement in the comparison and the plots remain quite far from each other. The correlative approach seems not able to predict effectiveness peaks and decay shape. The strong differences in the peak values of effectiveness is ascribable to the behaviour of the holes on the vane surface which present values below η = 1 in hole traces due to a strong interaction with the mainstream.
Concerning the SS, experiments and correlations are in a good agreement especially at lower B R conditions. In addition, the different trend of the adiabatic effectiveness decay downstream of the holes is confirmed: the decay is steeper for the experiments, close to the break-out position, while the trend is flatter moving downstream. This behaviour well highlights the tendency of the coolant to lift off from a convex surface, while, downstream, the vane pressure gradient counteracts this effect pushing the cooling flow towards the surface. As a result, flat plate correlations reveals inaccuracy near the SS1 and SS2 holes, while downstream the agreement with experiments is acceptable (see for example the region upstream the SS3). The biggest differences between experiments and correlations are located downstream the last row of holes and they are enhanced increasing the B R value. Since SS3 presents some differences in the coverage ratio and in the area ratio, with respect to the other rows, it could be thought that this is the reason of the mismatch. However, SS3 geometrical parameters values fall well within the range of the experimental data used for developing the correlations: therefore, it should not be expected to be the cause of the detected differences. For these reasons the behaviour of SS3 should be expected to be caused by the suction side configuration itself: it is worth to notice, in fact, that in the final part of the suction side the pressure gradient (i.e., pressure different between pressure and suction side), which generally help the film protection increasing the B R , is significantly lower than in the upstream region. Therefore, it is reasonable to conclude that the reduction of this beneficial effect is responsible for the drop of performance with respect to the predicted values of correlations.

5. Conclusions

Adiabatic effectiveness measurements were carried out, by means of PSP technique, on a film-cooled plate and a 2D turbine vane model; the fan shaped hole geometry selected for the present research was characterised by a high value of Area Ratio (around 7) not covered by the validity range of available correlations.
The results showed a coherent behaviour with the available literature, from a qualitative point of view, regarding different aspects as the effect of secondary endwall flows, the trend of the decay rate downstream of the holes and the effect of the blowing ratio. The comparison between the output of correlations and the flat plate tests showed the reliability of the correlative equations to describe the film behaviour with acceptable agreements beyond their validity range.
A direct comparison between flat plate, suction side and pressure side results highlighted significantly worse performance for the PS configuration, while the SS test articles behaved quite similarly to the FP one. The comparison of the experimental results with the prediction of correlations developed for flat plate configurations revealed an important overestimation in the predicted PS effectiveness, which represents a critical region for the correlative methods. Moreover, an overestimation was also detected for the final cooling row of the suction side, located in the final part of the surface where the beneficial pressure gradient is significantly reduced and the film cooling performance drops below the predicted values.
All these results point out to the inaccuracies that can be introduced by the adoption of common prediction tools for the evaluation of the film-cooling performance on turbine vanes as well as to the necessity to carry out ad-hoc experimental analysis, to avoid dangerous underestimation of the resulting vane temperature, with particular attention to the pressure side and to the final part of the suction side.

Author Contributions

T.B., A.P. and B.F. conceived and designed the experiments; T.B. and A.P. performed the experiments, analyzed the data and wrote the paper; B.F. supervised the whole process and checked the paper.

Funding

This research was funded by Ansaldo Energia. The APC was funded by Euroturbo.

Acknowledgments

The authors would like to express their gratitude to Ansaldo Energia for the permission to publish this work and for the valuable contribution in the conception and realization of the experimental campaign. The authors also wish to gratefully acknowledge Euroturbo for funding the APC.

Conflicts of Interest

The authors declare no conflict of interest. The funders had no direct role in the collection, analyses, or interpretation of data; in the writing of the manuscript, or in the decision to publish the results.

Nomenclature

B R Blowing Ratio [-]
D R Density Ratio [-]
hVane height coordinate [m]
HVane height [m]
R e Reynolds number [-]
PPressure [Pa]
S n d Non-dimensional axial coordinate [-]
Greeks
η Adiabatic Effectiveness
Acronyms
F P Flat plate
P S Pressure Side
S S Suction Side

References

  1. Bunker, R. A Review of Shaped Hole Turbine FilmCooling Technology. ASME J. Heat Transf. 2005, 127, 441–453. [Google Scholar] [CrossRef]
  2. Colban, W.; Thole, K.; Bogard, D. A film-cooling correlation for shaped holes on a flat-plate surface. J. Turbomach. 2010, 133, 011002. [Google Scholar] [CrossRef]
  3. Chen, A.; Li, S.; Han, J. Film cooling for cylindrical and fan-shaped holes using pressure-sensitive paint measurement technique. J. Thermophys. Heat Transf. 2015, 29, 775–784. [Google Scholar] [CrossRef]
  4. Ito, S.; Goldstein, R.J.; Eckert, E. Film Cooling of a Gas Turbine Blade. ASME J. Eng. Power 1978, 100, 476–481. [Google Scholar] [CrossRef]
  5. Schwarz, S.; Goldstein, R. The Two-Dimensional Behavior of Film Cooling Jets on Concave Surfaces. ASME J. Turbomach. 1989, 111, 124–130. [Google Scholar] [CrossRef]
  6. Pedersen, D.; Eckert, E.; Goldstein, R.J. Film-Cooling with Large Density Differences Between the Mainstream and Secondary Fluid Measured by the Heat-Mass Transfer Analogy. ASME J. Heat Transf. 1977, 99, 620–627. [Google Scholar] [CrossRef]
  7. Han, J.; Dutta, S.; Ekkad, S. Gas Turbine Heat Transfer and Cooling Technology; Taylor & Francis: Abingdon, UK, 2000. [Google Scholar]
  8. Naik, S.; Krueckels, J.; Gritsch, M.; Schnieder, M. Multirow film cooling performancs of a high lift blade and vane. ASME J. Turbomach. 2013, 136, 051003. [Google Scholar] [CrossRef]
  9. Narzary, D.; Liu, K.; Rallabandi, A.; Han, J. Influence of Coolant Density on Turbine Blade Film-Cooling Using Pressure Sensitive Paint Technique. ASME J. Turbomach. 2011, 134, 031006. [Google Scholar] [CrossRef]
  10. Liu, K.; Yang, S.; Han, J. Influence of coolant density on turbine blade film-cooling with axial shaped holes. In Proceedings of the ASME Conference Proceedings, Copenhagen, Denmark, 11–15 June 2012. HT2012-58144. [Google Scholar]
  11. Gao, Z.; Narzary, D.; Han, J. Film cooling on gas turbine blade pressure side or suction side with axial shaped holes. Int. J. Heat Mass Transf. 2007, 51, 2139–2152. [Google Scholar] [CrossRef]
  12. Barigozzi, G.; Ravelli, S.; Armellini, A.; Mucignat, C.; Casarsa, L. Effects of injection conditions and Mach number on unsteadiness arising within coolant jets over a pressure side vane surface. Int. J. Heat Mass Transf. 2013, 67, 1220–1230. [Google Scholar] [CrossRef]
  13. Gritsch, M.; Schulz, A.; Wittig, S. Adiabatic wall effectiveness measurements of film-cooling holes with expanded exits. ASME J. Turbomach. 1998, 120, 450–456. [Google Scholar] [CrossRef]
  14. Bacci, T.; Gamannossi, A.; Mazzei, L.; Picchi, A.; Winchler, L.; Carcasci, C.; Andreini, A.; Abba, L.; Vagnoli, S. Experimental and CFD analyses of a highly-loaded gas turbine blade. Energy Procedia 2017, 126, 770–777. [Google Scholar] [CrossRef]
  15. Stimpson, C.; Snyder, J.; Thole, K.; Mongillo, D. Effects of Coolant Feed Direction on Additively Manufactured Film Cooling Holes. ASME J. Turbomach. 2018, 140, 111001. [Google Scholar] [CrossRef]
  16. Becchi, R.; Facchini, B.; Picchi, A.; Tarchi, L.; Coutandin, D.; Zecchi, S. Film cooling adiabatic effectiveness measurements of pressure side trailing edge cooling configurations. Propuls. Power Res. 2015, 4, 190–201. [Google Scholar] [CrossRef] [Green Version]
  17. Caciolli, G.; Facchini, B.; Picchi, A.; Tarchi, L. Comparison between psp and tlc steady state techniques for adiabatic effectiveness measurement on a multiperforated plate. Exp. Thermal Fluid Sci. 2013, 48, 122–133. [Google Scholar] [CrossRef]
  18. Sellers, J. Gaseous film cooling with multiple ejection stations. AIAA J. 1963, 1, 2154–2156. [Google Scholar] [CrossRef]
  19. Gritsch, M.; Colban, W.; Schar, H.; Dobbeling, K. Effect of hole geometry on the thermal perfomance of fan-shaped film cooling holes. ASME J. Turbomach. 2005, 127, 718–725. [Google Scholar] [CrossRef]
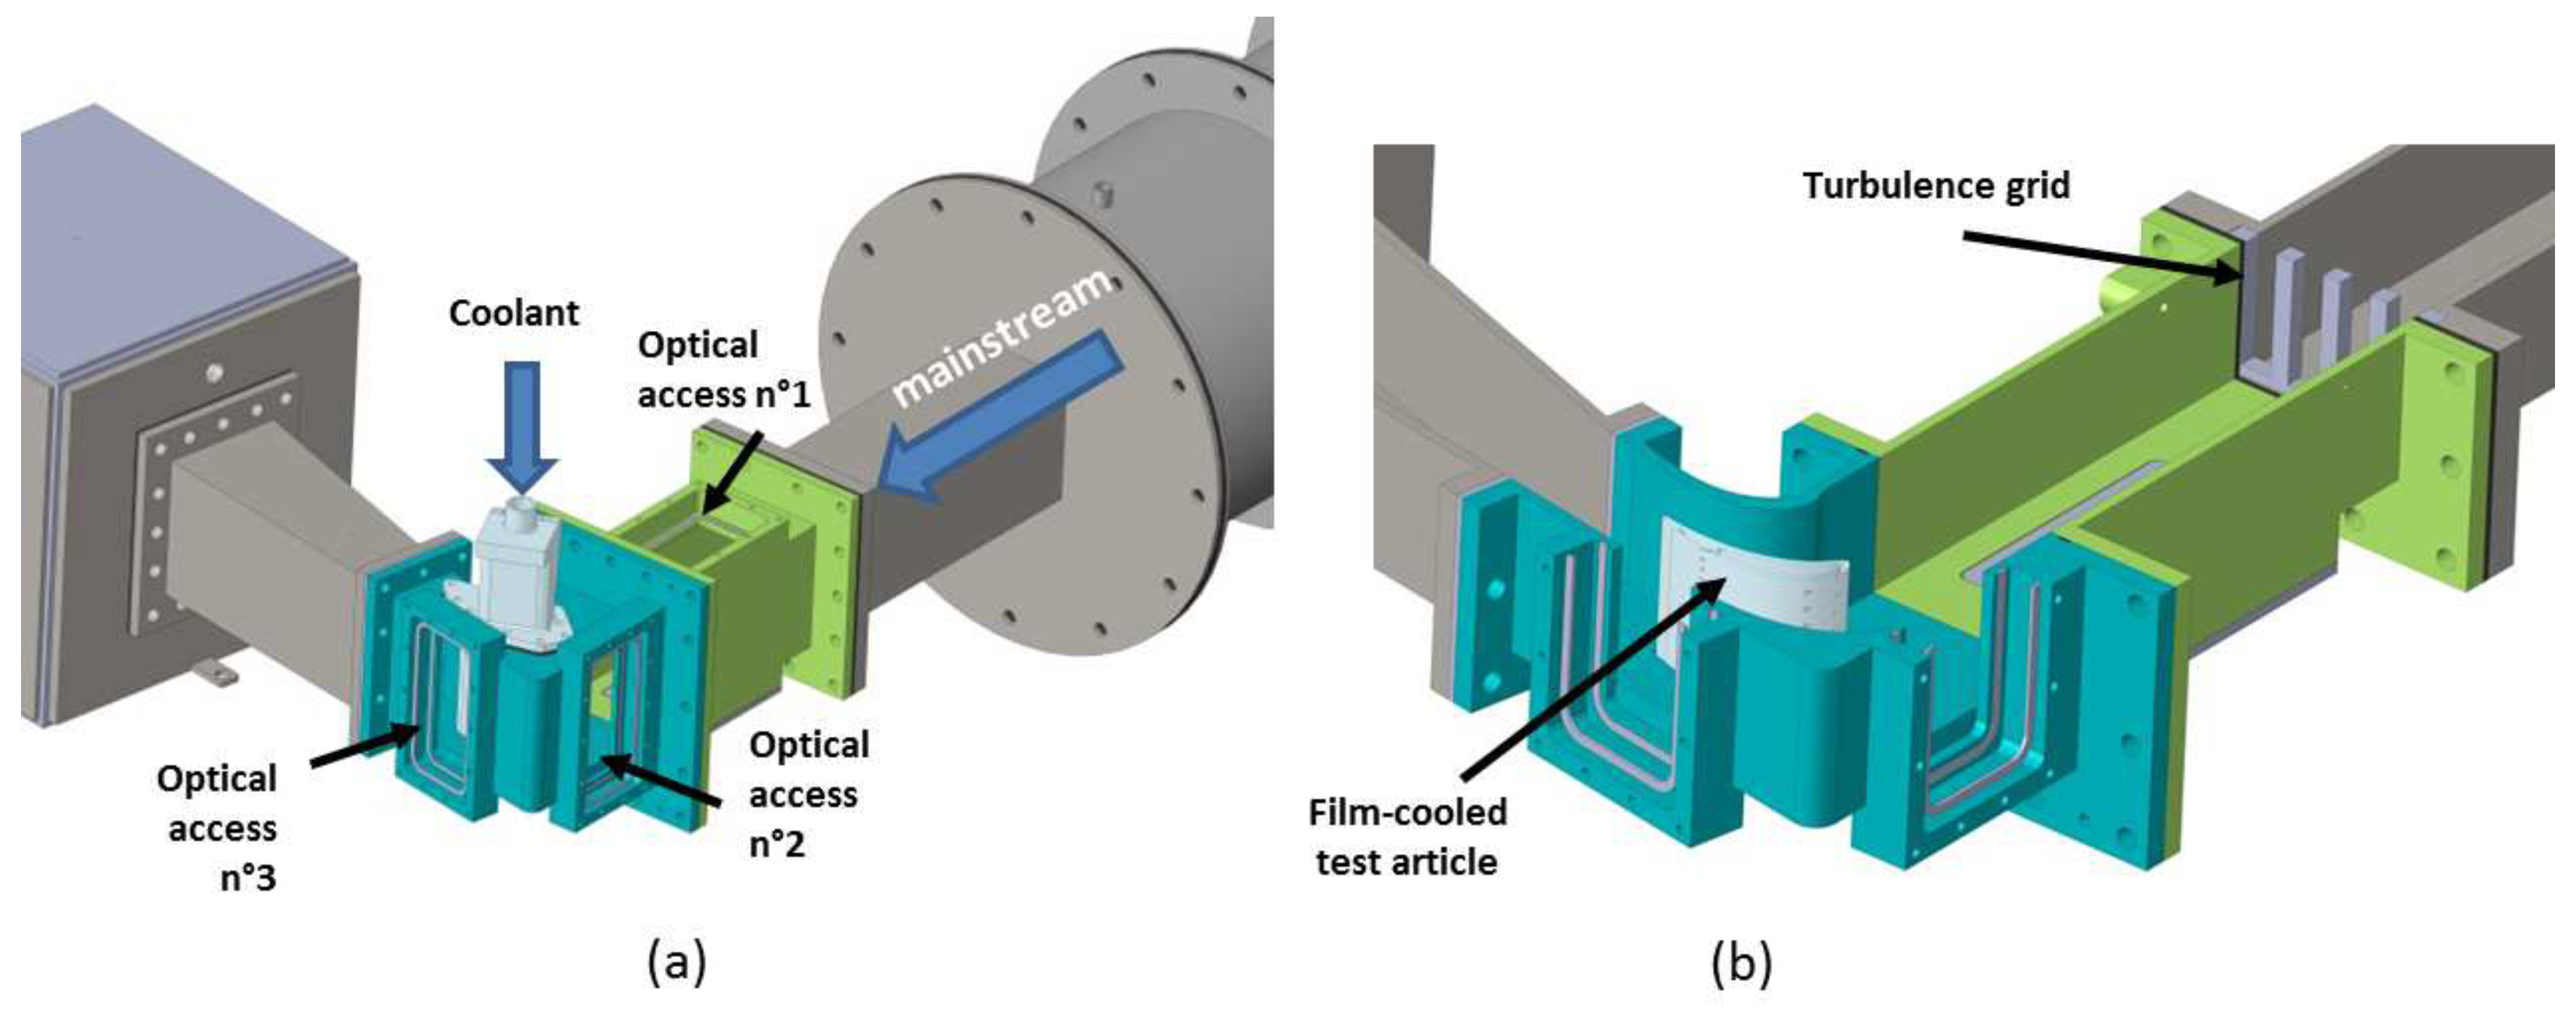
Figure 1. Sketch of the cascade test rig: overall view (a) and section of the test article area (b).
Ijtpp 04 00014 g001
Figure 2. Vane models and geometric parameters.
Ijtpp 04 00014 g002
Figure 3. Sketch of the flat plate test rig and film-cooling geometric parameters.
Ijtpp 04 00014 g003
Figure 4. Vane pressure and Mach number distribution.
Ijtpp 04 00014 g004
Figure 5. Adiabatic effectiveness contour plots.
Ijtpp 04 00014 g005
Figure 6. Spanwise average effectiveness 1D profile: effect of blowing ratio.
Ijtpp 04 00014 g006
Figure 7. Spanwise average effectiveness 1D profile: comparison between investigated configurations.
Ijtpp 04 00014 g007
Figure 8. Spanwise average effectiveness 1D profile: comparison with correlations.
Ijtpp 04 00014 g008
Table 1. Film cooling parameters estimated at nominal conditions.
Cascade Rig Flat Plate
Mainstream Mainstream
Inlet total pressure [Pa]125,000 Inlet total pressure [Pa]90,300
Inlet total temp. [K]300 Inlet total temp. [K]300
Mass flow [g/s]930 Mass flow [g/s]250
Re inlet [-]5.62 × 10 5 Re [-]9 × 10 5
Re throat [-]9.34 × 10 5
Mach throat [-]0.54
Coolant Coolant
BR [-]1, 1.5, 2, 2.5 BR [-]1, 2
DR [-]2.5 DR [-]2.5
Table 2. Row-by-row values of BR.
PSSS
Average BRPS1PS2PS3PS4SS1SS2SS3
10.80.991.081.131.011.040.95
1.51.761.511.391.341.571.461.46
22.612.051.761.592.131.91.97
2.53.42.592.141.872.682.352.47