Article

Simulating Sediment Erosion in a Small Kaplan Turbine

Laboratory of Energy Conversion Systems, Faculty of Mechanical Engineering and Process Engineering, University of Science and Technology Houari Boumediene, BP 32 El-Alia, Bab-Ezzouar, Algiers 16111, Algeria
Int. J. Turbomach. Propuls. Power 2025, 10(4), 44; https://doi.org/10.3390/ijtpp10040044
Submission received: 14 June 2025 / Revised: 15 August 2025 / Accepted: 25 August 2025 / Published: 5 November 2025

Abstract

Sediment erosion is a persistent problem that leads to the deterioration of hydro-turbines over time, ultimately causing blade failure. This paper analyzes the dynamics of sediment in water and its effects on a small Kaplan turbine. Flow data is obtained independently and transferred to a separate Lagrangian-based finite element code, which tracks particles throughout the computational domain to determine local impacts and erosion rates. This solver uses a random walk approach, along with statistical descriptions of particle sizes, numbers, and release positions. The turbine runner features significantly twisted blades with rounded corners, and complex three-dimensional (3-d) flow related to leakage and secondary flows. The results indicate that flow quality, particle size, concentration, and the relative position of the blades against the vanes significantly influence the distribution of impacts and erosion intensity, subsequently the local eroded mass is cumulated for each element face and averaged across one pitch of blades. At the highest concentration of 2500 mg/m3, the results show a substantial erosion rate from the rotor blades, quantified at 4.6784 × 10⁻³ mg/h and 9.4269 × 10⁻³ mg/h for the nominal and maximum power operating points, respectively. Extreme erosion is observed at the leading edge (LE) of the blades and along the front part of the pressure side (PS), as well as at the trailing edge (TE) near the hub corner. The distributor vanes also experience erosion, particularly at the LE on both sides, although the erosion rates in these areas are less pronounced. These findings provide essential insights into the specific regions where protective coatings should be applied, thereby extending the operational lifespan and enhancing overall resilience against sediment-induced wear.

1. Introduction

In hydraulic machinery, erosion occurs when silt carried by water strikes the surfaces of various components. This sediment abrasion negatively affects turbine efficiency and significantly reduces both the service life of the turbine and the maintenance cycle, leading to increased maintenance costs [1]. Additionally, damage to the material can alter a component’s shape, which can cause or exacerbate cavitation damage [2]. Hydroelectric facilities located near mountainous areas face significant challenges. For instance, the efficiency of Francis turbines at the Jhimruk-HP hydropower facility in Nepal and the TDHP power plant in Pakistan, which are situated close to the Himalayas, has decreased by 4% [3,4]. Major hydropower plants in India [5] and Peru (Andean Valley) [6] have reported similar issues. According to Koirala et al. [7], sediments ranging in size from 125 to 200 microns can accumulate upstream of hydraulic turbines, reaching concentrations of up to 50,000 parts per million (ppm). At the TDHP power plant, sediments with an average size of 40 microns were found at concentrations as high as 60,000 ppm [4].
Hydro-abrasive erosion is a complex mechanism that is not yet fully understood. Several variables influence how sediments erode in hydraulic machinery, including the concentration of abrasive particles in the flow, the impingement velocity and angle, the size, shape, and hardness of the particles, as well as the characteristics of the surfaces being impacted. The first comprehensive review of abrasive wear in hydraulic machinery was conducted by Truscott [8]. Following this, Brekke [9] reviewed the advancements in the understanding of erosion in hydraulic machines and conducted an in-depth investigation of sediment erosion, classifying it into three categories: secondary flow vortex erosion, erosion caused by the acceleration of large particles (greater than 500 microns), and micro-erosion caused by fine particles (smaller than 60 microns) at high velocities. Brekke [9] also proposed fundamental design criteria for hydro-turbines that operate in sediment-laden flows. Later, Padhy and Saini [10] provided a comprehensive description of experimental research focused on erosion in hydraulic turbines. They found that high-head Francis and Pelton turbines are particularly susceptible to erosion damage, while low-head Kaplan turbines are more prone to erosion due to their exposure to higher sediment content [11].
Although there are numerous published research reports, only a limited number of experiments with small samples have been conducted to study erosion in hydro-turbines. These studies did not accurately represent the erosive behaviour that occurs in real-world settings. Padhy and Saini [12] conducted experiments on the erosion mechanism of Pelton turbines and found that particle size significantly affects the wear sustained by the buckets. Thapa et al. [13,14] designed a one-guide vane cascade for a Francis turbine distributor to investigate the leakage flow caused by the increasing clearance gap between deteriorated vanes and cover plates. Additionally, Rai and Kumar [15] developed a simple and effective method for measuring erosion in the draft tubes and runner chambers. They also identified erosion-prone areas at the outer TE of the blade and in the top runner chamber.
Despite the absence of reliable models for predicting erosion, using numerical simulations seems to be more advantageous than conducting costly tests. Eltvik et al. [6] demonstrated through numerical simulations that there is a significant relationship between the erosion of a Francis turbine runner and its operating conditions. To assist with the design, operation, and maintenance of Francis turbine runners under specific site conditions, Thapa et al. [16] developed a basic erosion model. From their CFD study of simultaneous cavitation and silt erosion in a 7 MW Kaplan turbine, Dinesh and Bhingole [17] found that increased cavitation affects efficiency, particularly as the size and concentration of particles increase. Leguizamón et al. [18] used a prototype-scale Pelton bucket to simulate the erosion process caused by a sediment-laden water jet. They concluded that the average impact angle and velocity on bucket surfaces provided valuable insights into the erosion process, aligning with experimental data reported in the literature. Shen et al. [19] performed numerical analyses on impeller erosion wear in a double-suction pump utilised in the Jingtai Yellow River Irrigation Project (JYRIP). They have reported that erosion damage was most concentrated near the LE and TE of the impeller, noting that particle size and concentration had a more significant impact on performance than particle shape. In a recent study, Ghenaiet [20] analyzed particle paths in a small Francis turbine and portrayed erosion patterns. The areas of the vanes, PS, especially beyond the throat, experienced the most erosion, while the runner showed substantial erosion at the blade entry.
Sediment erosion in hydraulic machinery is a significant concern that is likely to persist into the future. Most research has concentrated on erosion in Pelton turbines [21,22,23,24,25,26] and Francis turbines [27,28,29], whereas Kaplan turbines have received less attention. It is important to note that small horizontal Kaplan turbines, which are commonly used in small hydropower systems serving off-grid and isolated communities, are particularly vulnerable to erosion due to challenges associated with silt removal.
This research aims to fill the knowledge gap regarding the erosion of small Kaplan turbines by examining how sediment moves within the components. The study will provide both quantitative and qualitative assessments of the erosion process, with careful consideration of the relative position between the blades and the distributor vanes. To conduct this analysis, particle trajectory and erosion calculations will be performed using a validated in-house code [30,31], which has been successfully applied in various studies focused on turbomachinery erosion [32,33,34,35]. Through this comprehensive approach, it is aimed to enhance the understanding of erosion in these critical machines and guide future design improvements.

2. Kaplan Turbine Model

The Kaplan turbine model (Figure 1) is part of a hydraulic test bench that features a distributor with four variable-opening vanes, a runner with four adjustable blades, and a conical draft tube. When operating at 2000 rpm, this turbine delivers a maximum power output of 0.52 kW, achieved with a blade setting angle of 30 degrees and a vane opening of 20 degrees. Additional details about the turbine’s performance and geometric characteristics can be found in Table 1 and Table 2.

3. Flow Computation

The 3-D non-cavitating water flow through the computational domain (shown in Figure 1), comprising the distributor vanes, runner blades, and draft tube, was solved using the code CFX. The steady Reynolds-averaged Navier–Stokes (RANS) equations modelled water flow, assumed to be isothermal.
V i x i = 0 V j V i x j = P ρ x i + g i + ν 2 V i x j x i x j v i v j ¯ + S i
where V i is the average relative velocity component. The term g i the gravity component, S i represents a component of the Coriolis and centripetal forces   S = 2 Ω × V + Ω × ( Ω × r ) , V relative flow velocity vector and Ω (rad/s) rotational velocity. The term v i v j ¯ is the turbulent stress evaluated from the turbulence model k-ω based SST turbulence model. Although the k-ω based SST turbulence model has limitations in handling high separations [36], it, along with automatic near-wall treatment, has produced satisfactory results in hydraulic machinery computations [37].
As boundary conditions, a total pressure (head) was imposed at the inlet, while static pressure was assigned at the exit of the conical draft tube. The blades, hub and bulb were treated as rotating smooth non-slip walls, whereas a counter-rotating wall is set for the shroud. The values of the boundary conditions correspond to the measurements of rotational speed, flow rate, net pressure head and static pressure, including the estimated losses at inlet and outlet.
The inlet turbulence intensity was evaluated using a correlation for fully developed pipe flow [38].
i = v ~ / V = 0.16 R e d h 1 / 8
with R e d h  = 342,500 based on d h yielding a turbulence intensity of about 3.2%.
A high-resolution scheme is used for the advection terms in the momentum equations and the turbulent model [39], cast in the form   φ i p = φ u p + a φ r . The blend factor ‘a’ is estimated to be close to 1 in flow regions with low gradients, while it approaches 0 in areas where the gradients change sharply, ensuring robustness. The pressure–velocity coupling is achieved via SIMPLE algorithm [40] in conjunction with the momentum interpolation technique [41].
The flow field was initialized in the Kaplan turbine based on the operating flow rate, power, rotational speed, and velocity triangles to obtain a preliminary solution using the robust scheme upwind in the CFX–solver. Subsequently, the flow solution used higher resolution schemes, with at least 1000 steps to ensure that the solution converges. The time step control used the auto timescale calculated from the domain geometry, boundary conditions, and flow conditions, with a convergence residual set at 10−6.
The flow in the runner is defined in a rotating frame, while the vane and draft tube remained in a stationary frame. Consequently, the multiple reference frames (MFR) approach used a mixing plane (stage interface), where discrete fluxes through the interface are circumferentially averaged and transferred to the adjacent zone as boundary conditions.

3.1. Mesh Generation

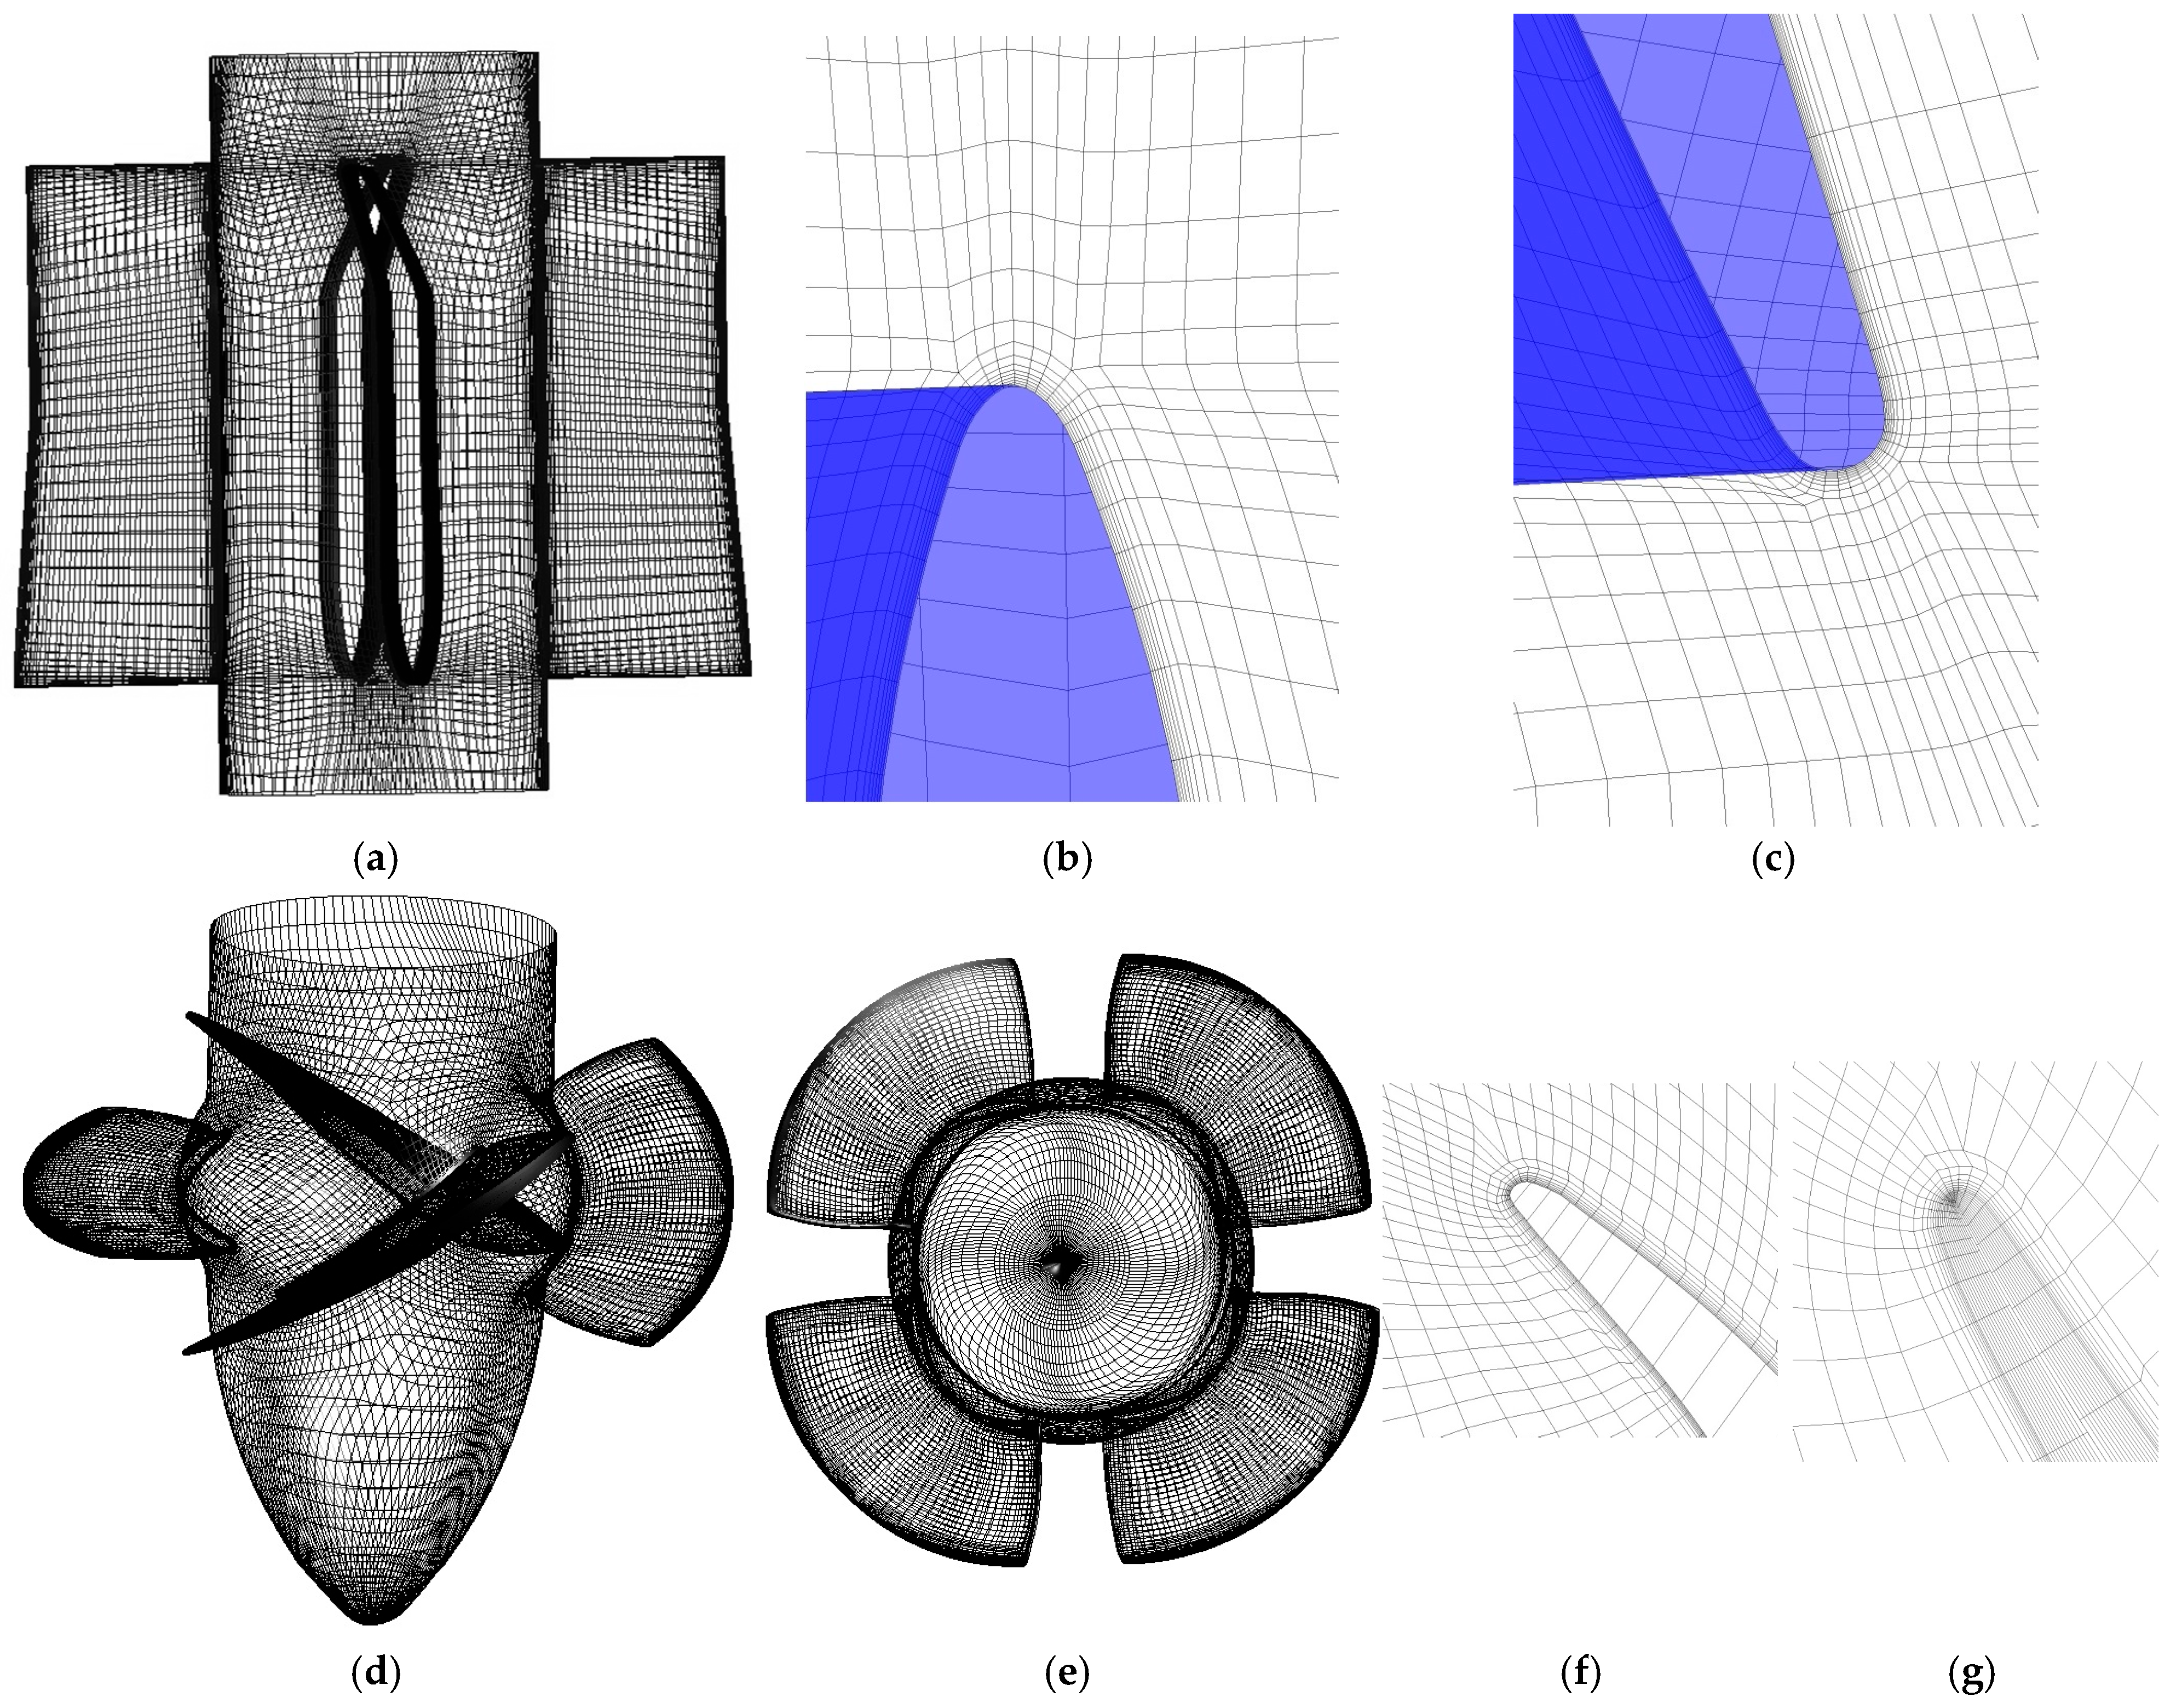
The distributor and the runner were meshed separately using hexahedral elements. Figure 2 presents the meshes generated for the distributor vanes and runner with their refinements. Figure 2a illustrates the mesh of the distributor, while Figure 2b,c display the mesh quality near the LE and TE of vanes. Figure 2d,e display the runner mesh in side and front views, whereas Figure 2f,g shows the refinements around the blades near the hub and tip. O-grids were applied around the vanes and blades, featuring 12 mesh lines around the vanes and blades, and 15 mesh lines in the tip clearance.
The first layer of nodes was determined according to [42].
y = y + μ / ρ V y C f / 2
with
  C f = 0.026 R e c 1 / 7
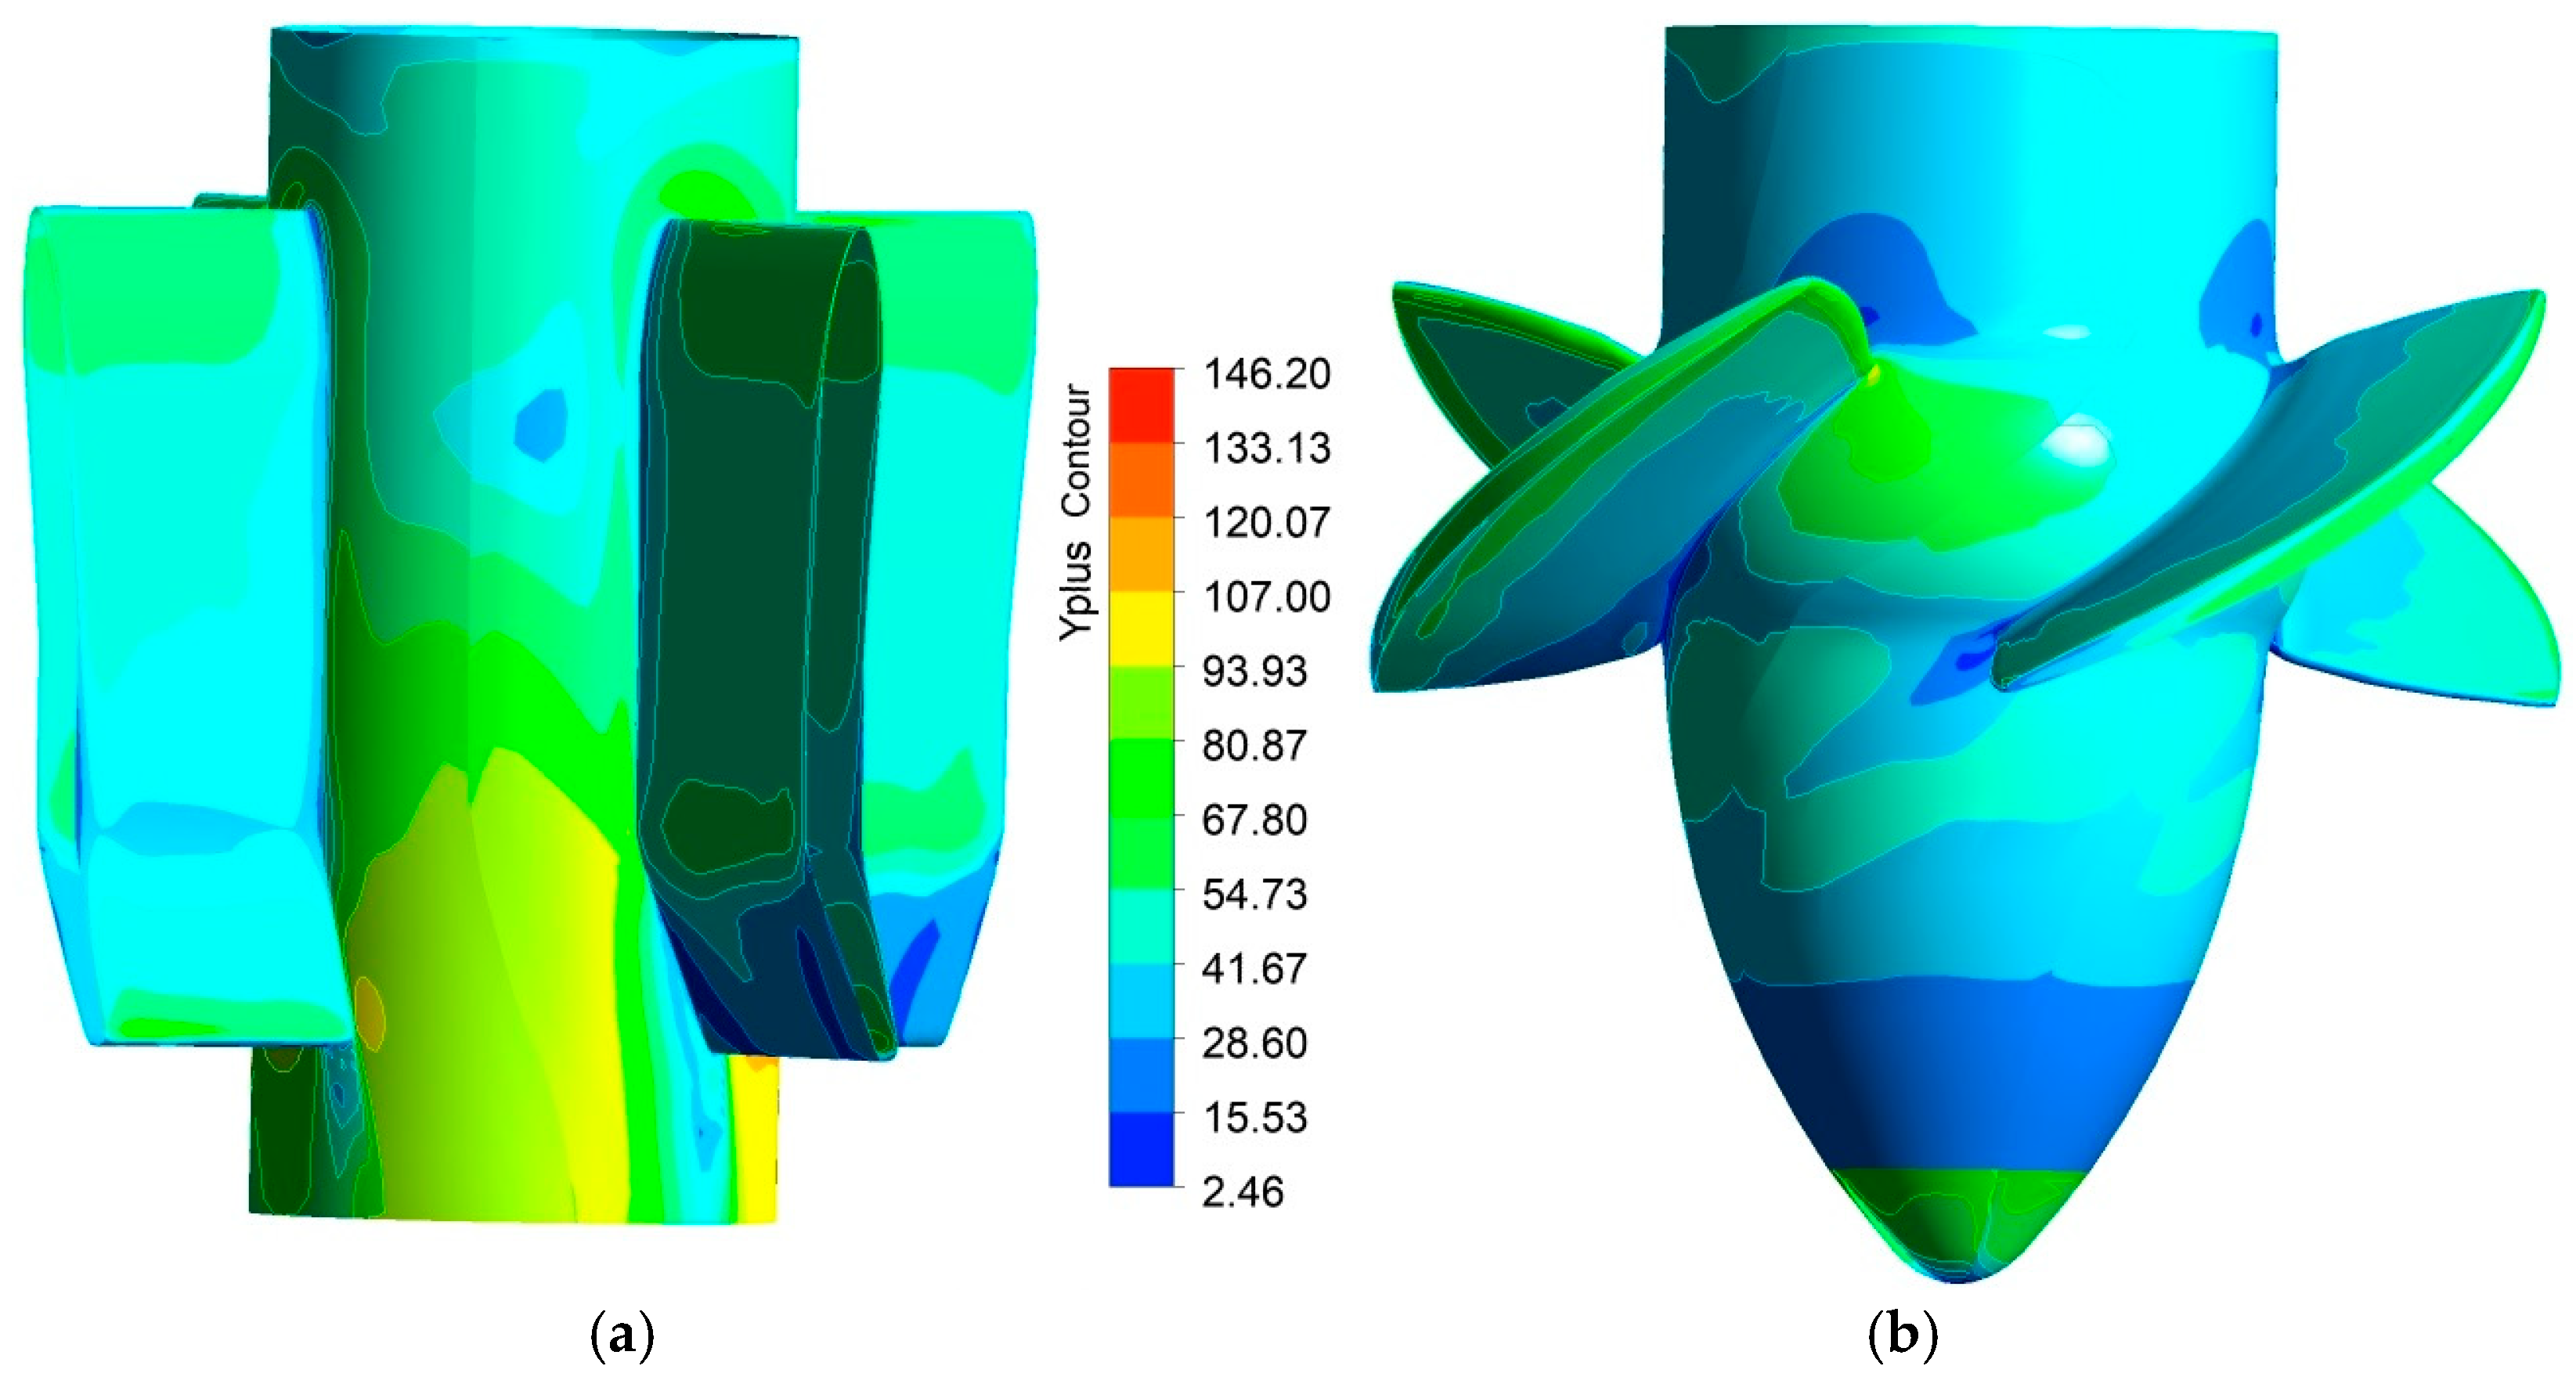
where R e c is based on the chord length of the vane/blade. In the distributor, the largest values of y + (Figure 3a) are located at the LE of vanes and the hub near the TE. For the runner (Figure 3b), the highest values of y + are found at the LE and the junction with the hub of the blades, added to the bulb summit. Also, the vanes’ hub is characterized by the highest y + values from the throat area, but do not exceed 146, which is acceptable for the k-ω based SST turbulence model.
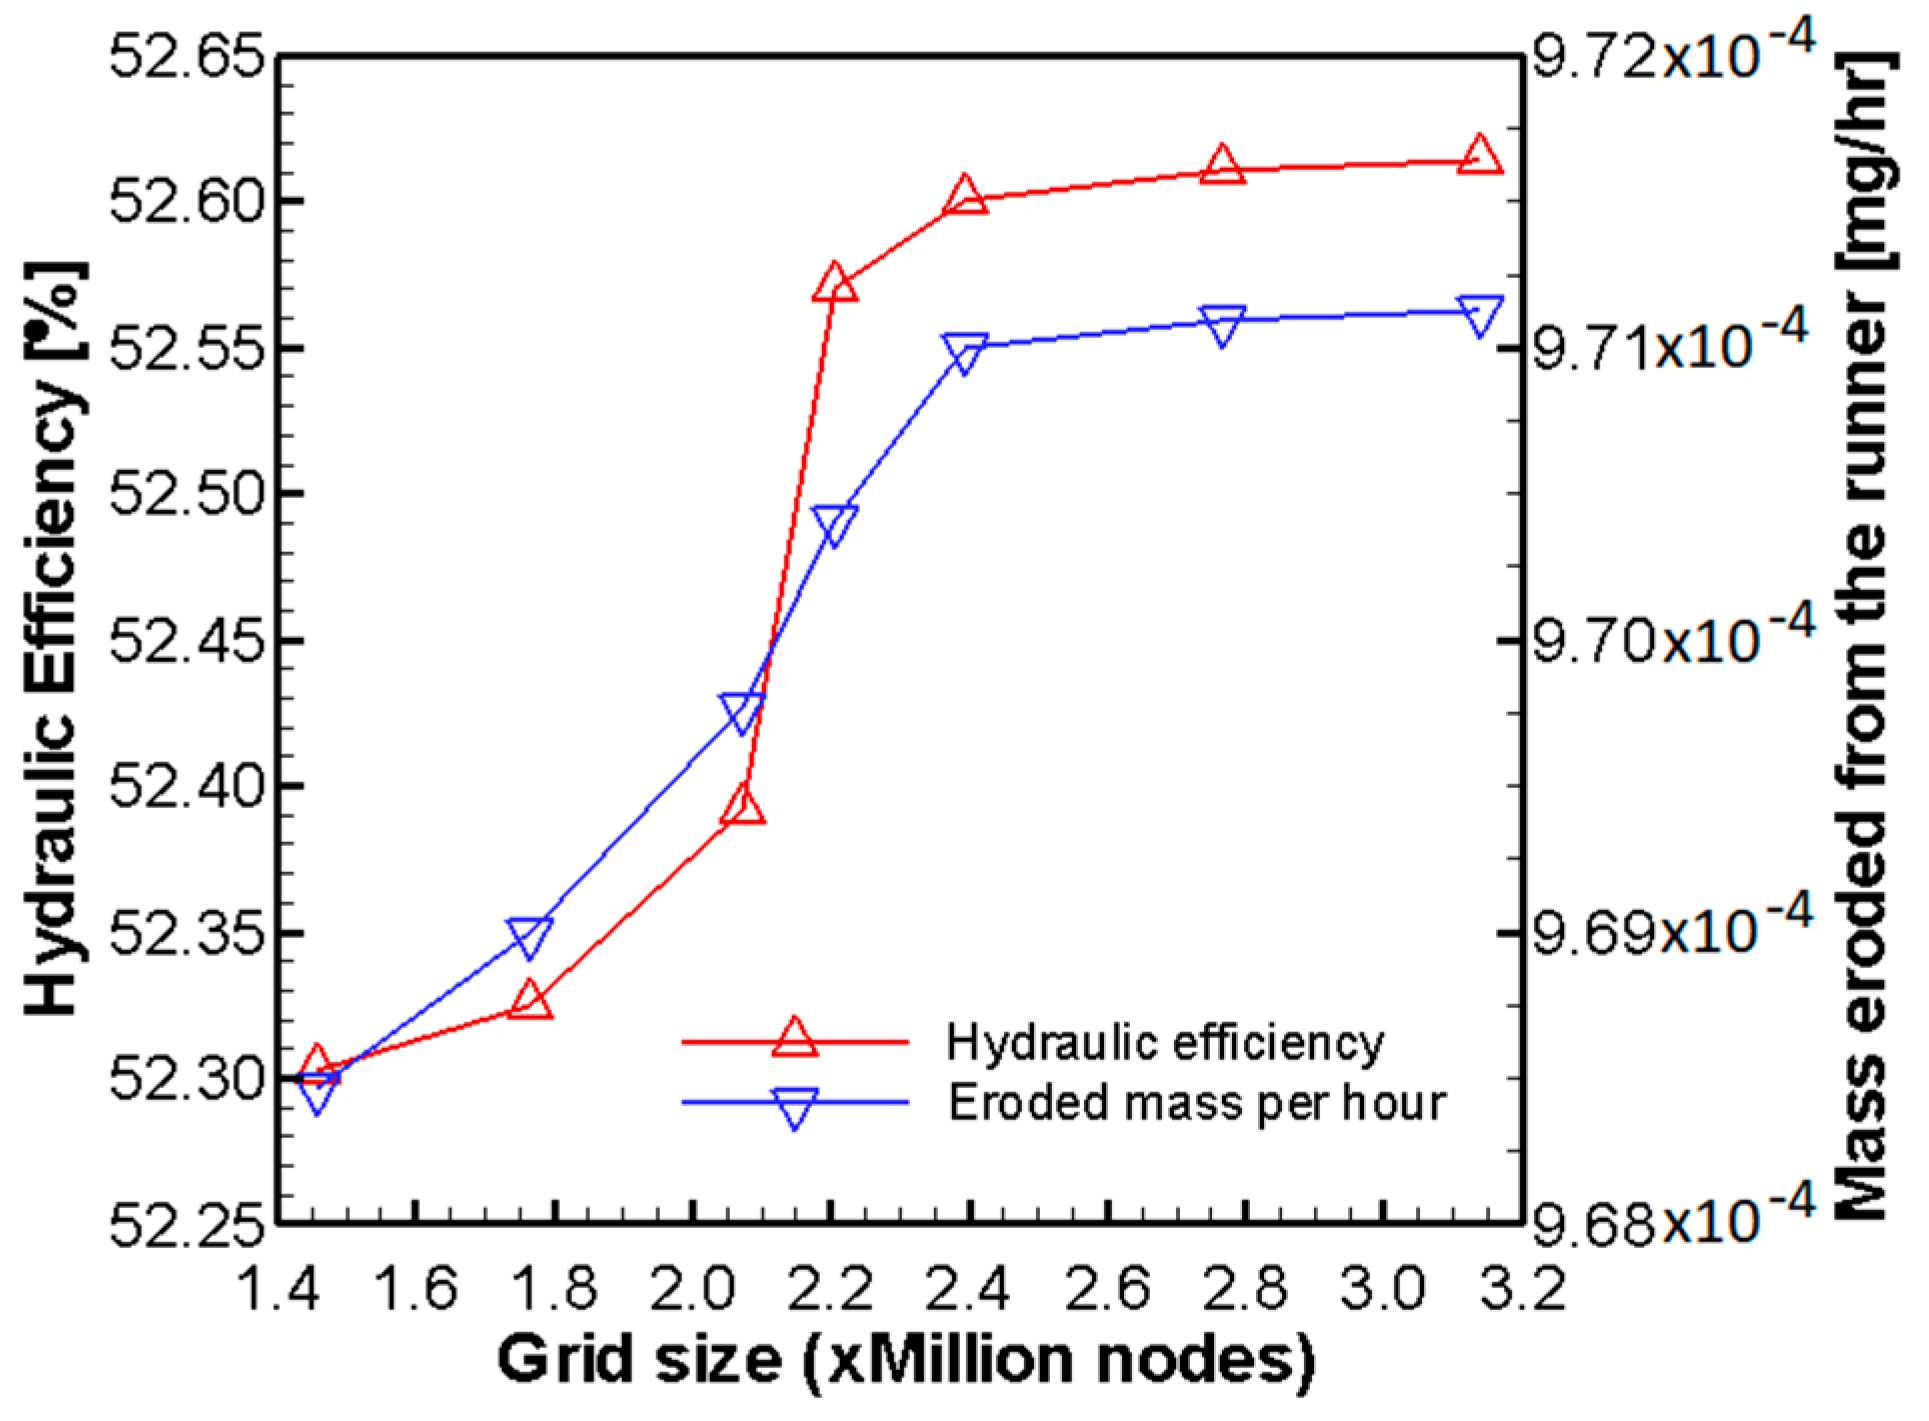
Figure 4 indicates a stabilized hydraulic efficiency between the fifth and seventh mesh sizes. Additionally, when evaluating the runner’s erosion at the nominal point and considering TDHP sediments with a concentration of 500 mg/m3, only slight changes in the mass eroded per hour for the entire rotor and bulb are observed beyond the fifth mesh size. To summarise, a total mesh size of 2,392,960 nodes was deemed sufficient (given the available computing power) for performing the flow and particle trajectory calculations.

3.2. Flow Results

The CFD model was validated against test data from a closed-loop test rig. The steady flow simulations were conducted at a water head of 3.05 m, with a blade setting angle of β = 30 degrees and a vane opening α = 20 degrees. The results from the CFD analysis confirm that the best setting angle for the runner is 30 degrees, while for the vane opening is 20 degrees, as will be discussed later.

3.2.1. Turbine Performance Validation

The stage interface, also known as the mixing plane, was considered to compute the stable non-cavitating flow solution. This process led to the calculation of flow parameters, which were mass-averaged at both the inlet and outflow planes. The power is calculated as
P = T · Ω
where the torque is determined by integrating the static pressure and shear stress over the surfaces of the runner.
  T = N b r × p + τ d s
Subsequently the hydraulic efficiency is given by
η h = P ρ g Q H
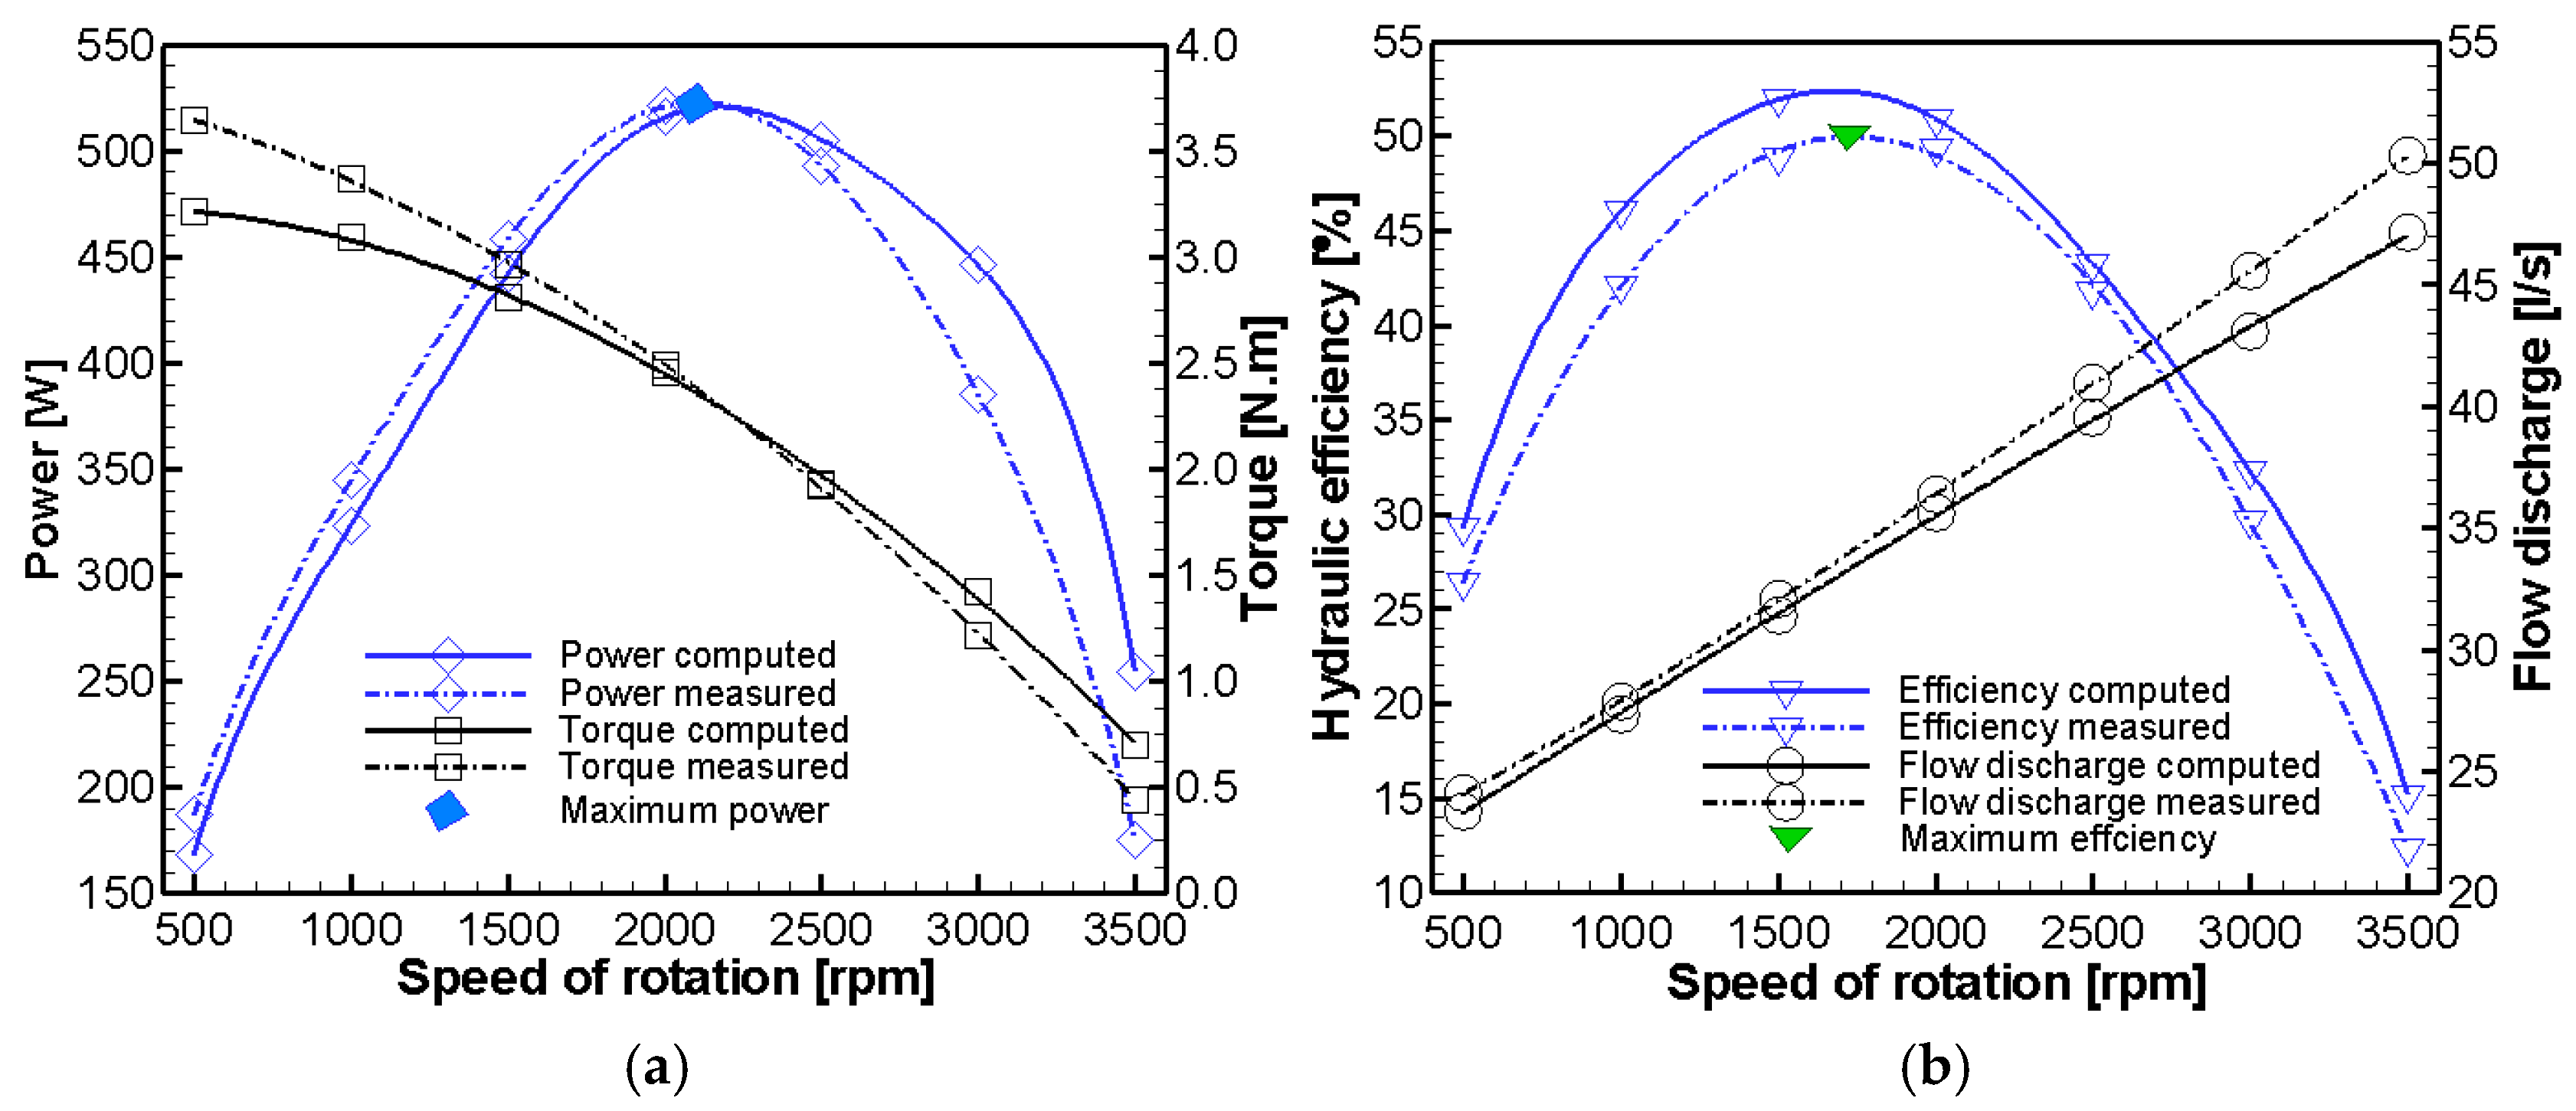
Figure 5 presents the calculated performance of the Kaplan turbine and compares it with experimental data. It shows two peaks in hydraulic performance: the first peak corresponds to a maximum power of approximately 520 W when operating at 2000 rpm and a flow rate Q = 36.3 l/s, while the second represents the maximum efficiency of 52.6% at 1700 rpm and a flow rate Q = 33.8 l/s. Beyond these two points, the hydraulic performance declines due to factors such as high flow incidence, wake, secondary flows, and leakage losses. While the experimental measurements indicated peaks of 523 W and 51.2% efficiency, the computed maximum power is 520 W and the peak efficiency is 52.6%. It is worth noting that the torque and water flow rate displayed higher measurement errors.

3.2.2. Flow Structures

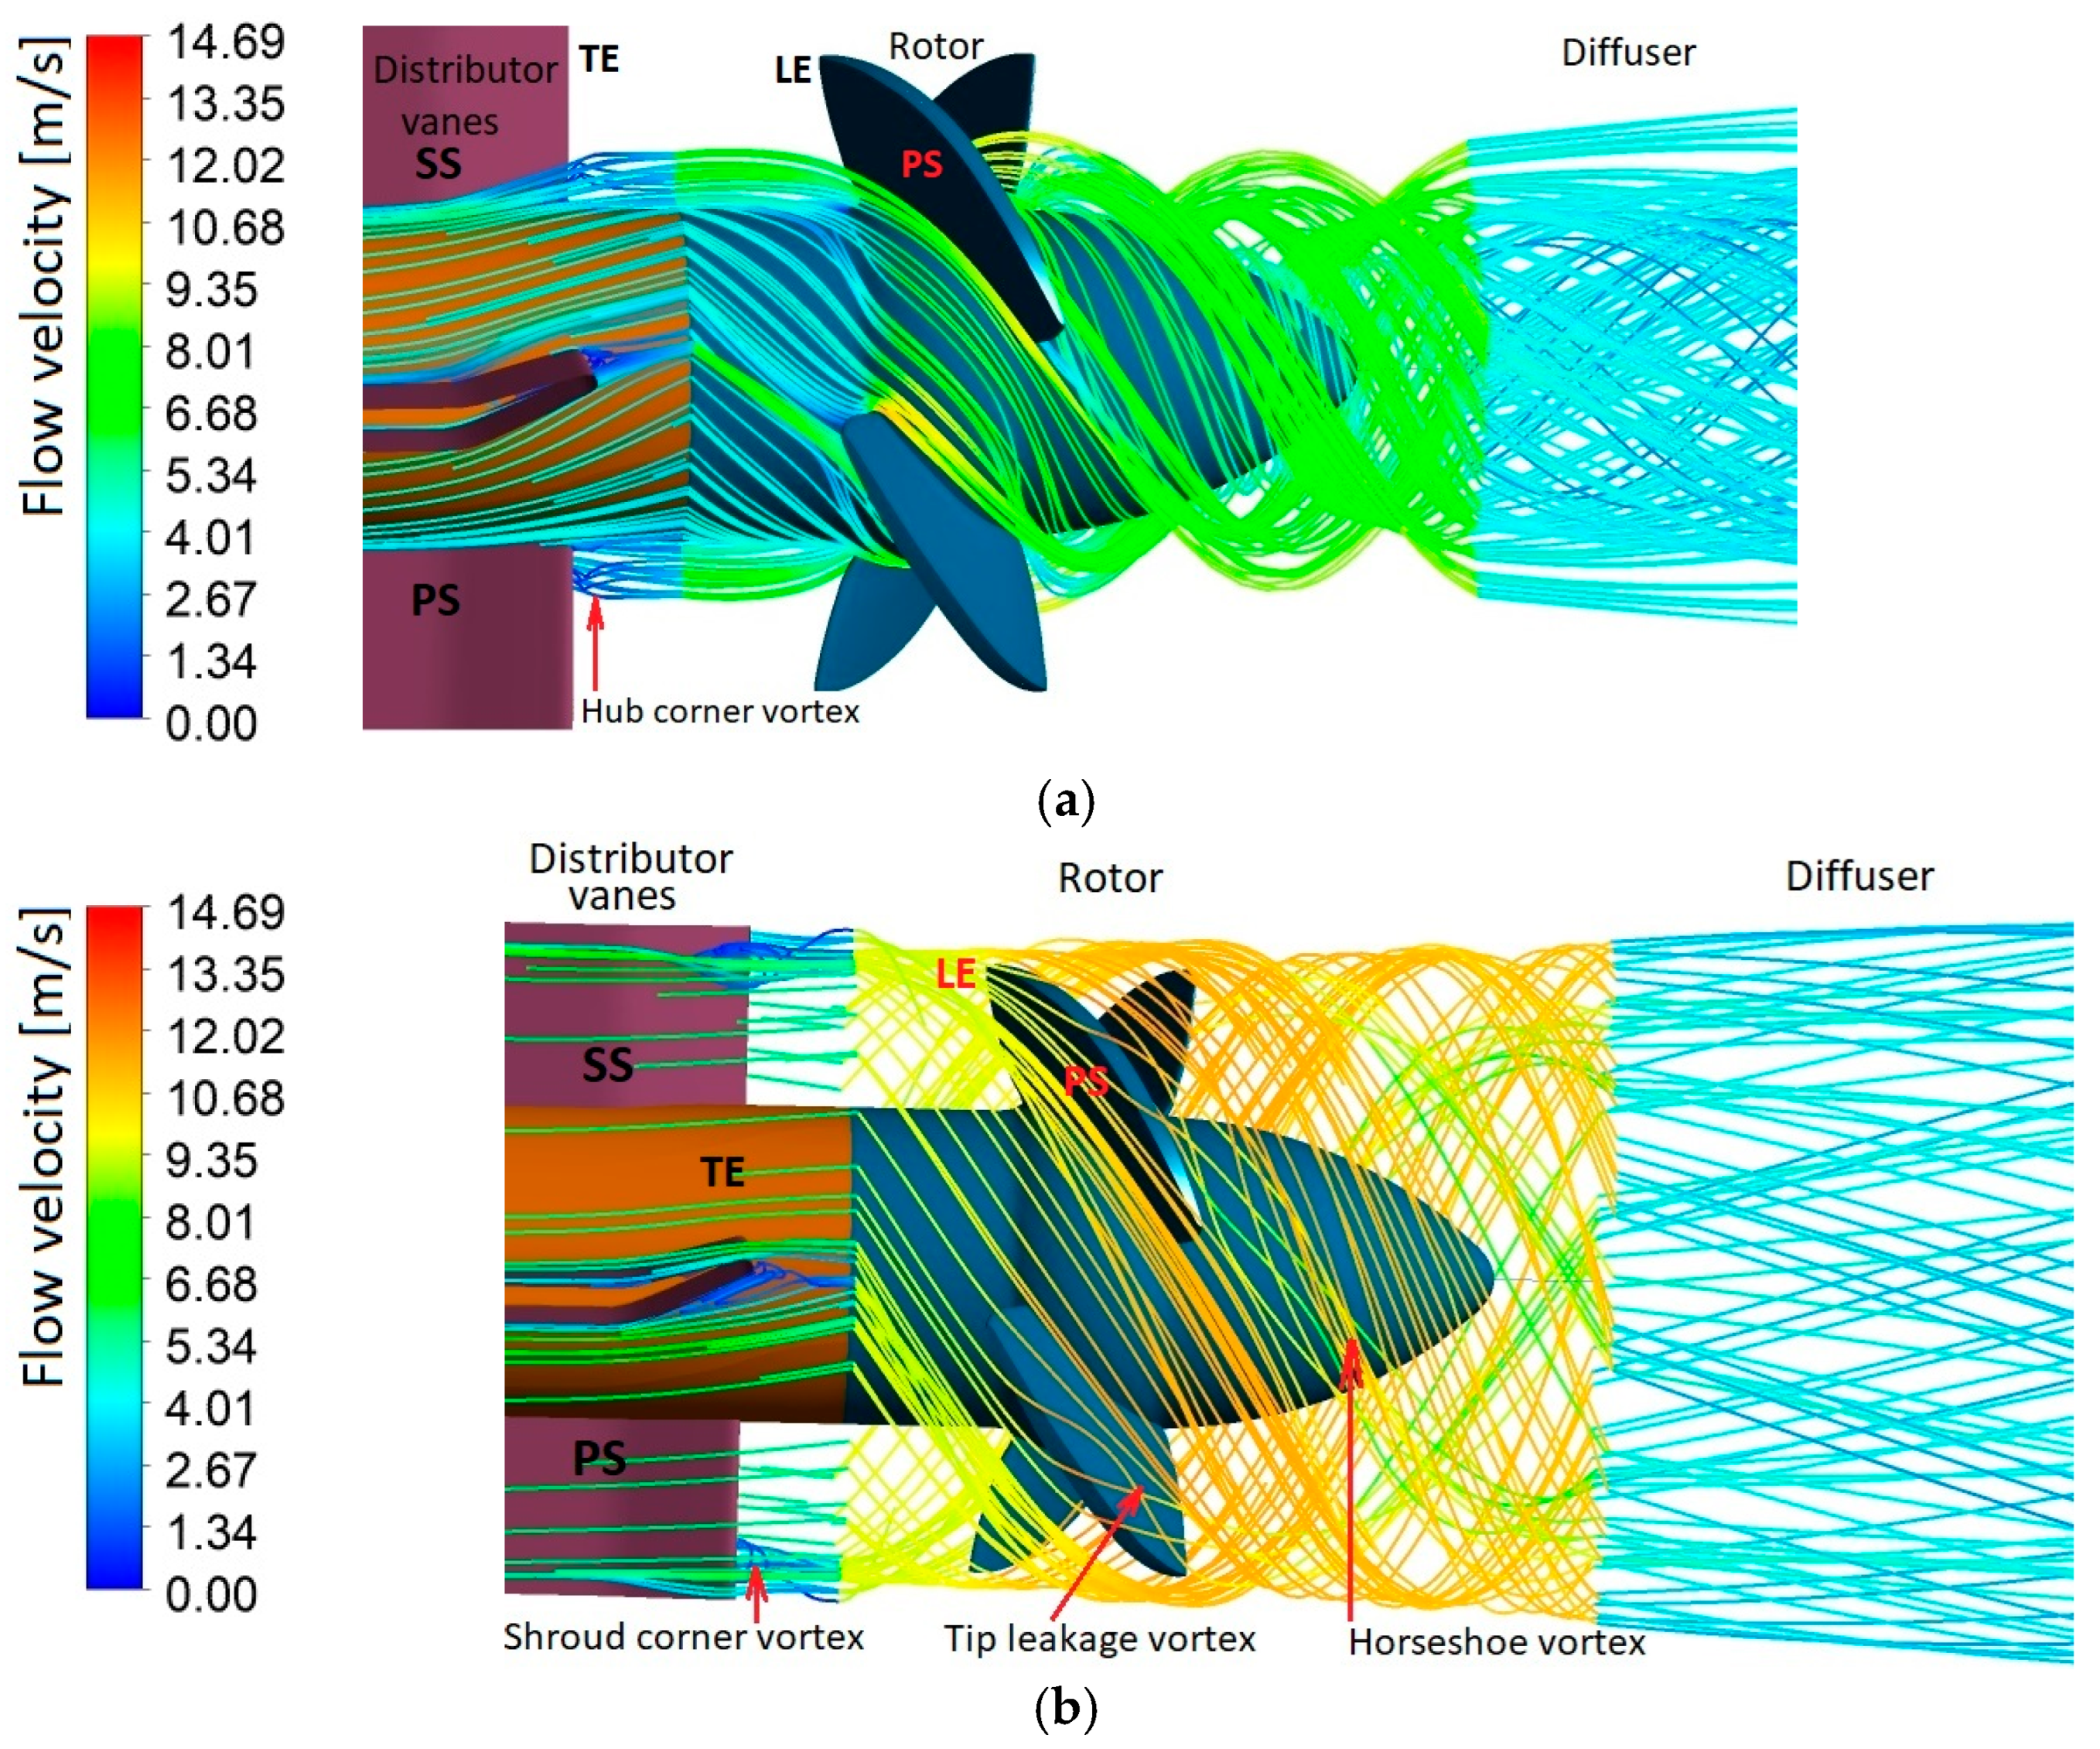
Figure 6 and Figure 7 present the details of the flow field in the Kaplan turbine, as simulated. However, the discussions on flow structures focus on the nominal operating conditions. As the fluid accelerates down the distributor vanes, the static pressure drops and continues decreasing along the runner due to work extraction. Diffusion process continues in the conical draft tube. The streamlines (Figure 6a,b) illustrate how the flow is deflected by the vanes and how vortices are formed at the TE from the lower and upper corners, which is caused by the large flow deviation and pressure gradient. As water enters the rotating frame, it experiences a change in flow direction at the LE of the blades. The varying gap between the blade and the shroud, combined with the strong pressure gradient, results in a complex flow pattern that curls and generates a tip leakage vortex. As shown in Figure 7a, this vortex extends along the suction side (SS) and is accompanied by a low-pressure core that is convected by secondary flows. The wakes, tip leakage, horseshoe vortices, and hub corner vortex, depicted in Figure 7b,c, undergo significant changes downstream of the blade’s TE, enlarging and mixing with the hub corner vortex as they move circumferentially.

3.2.3. Effect of Blade Setting Angle and Vane Opening

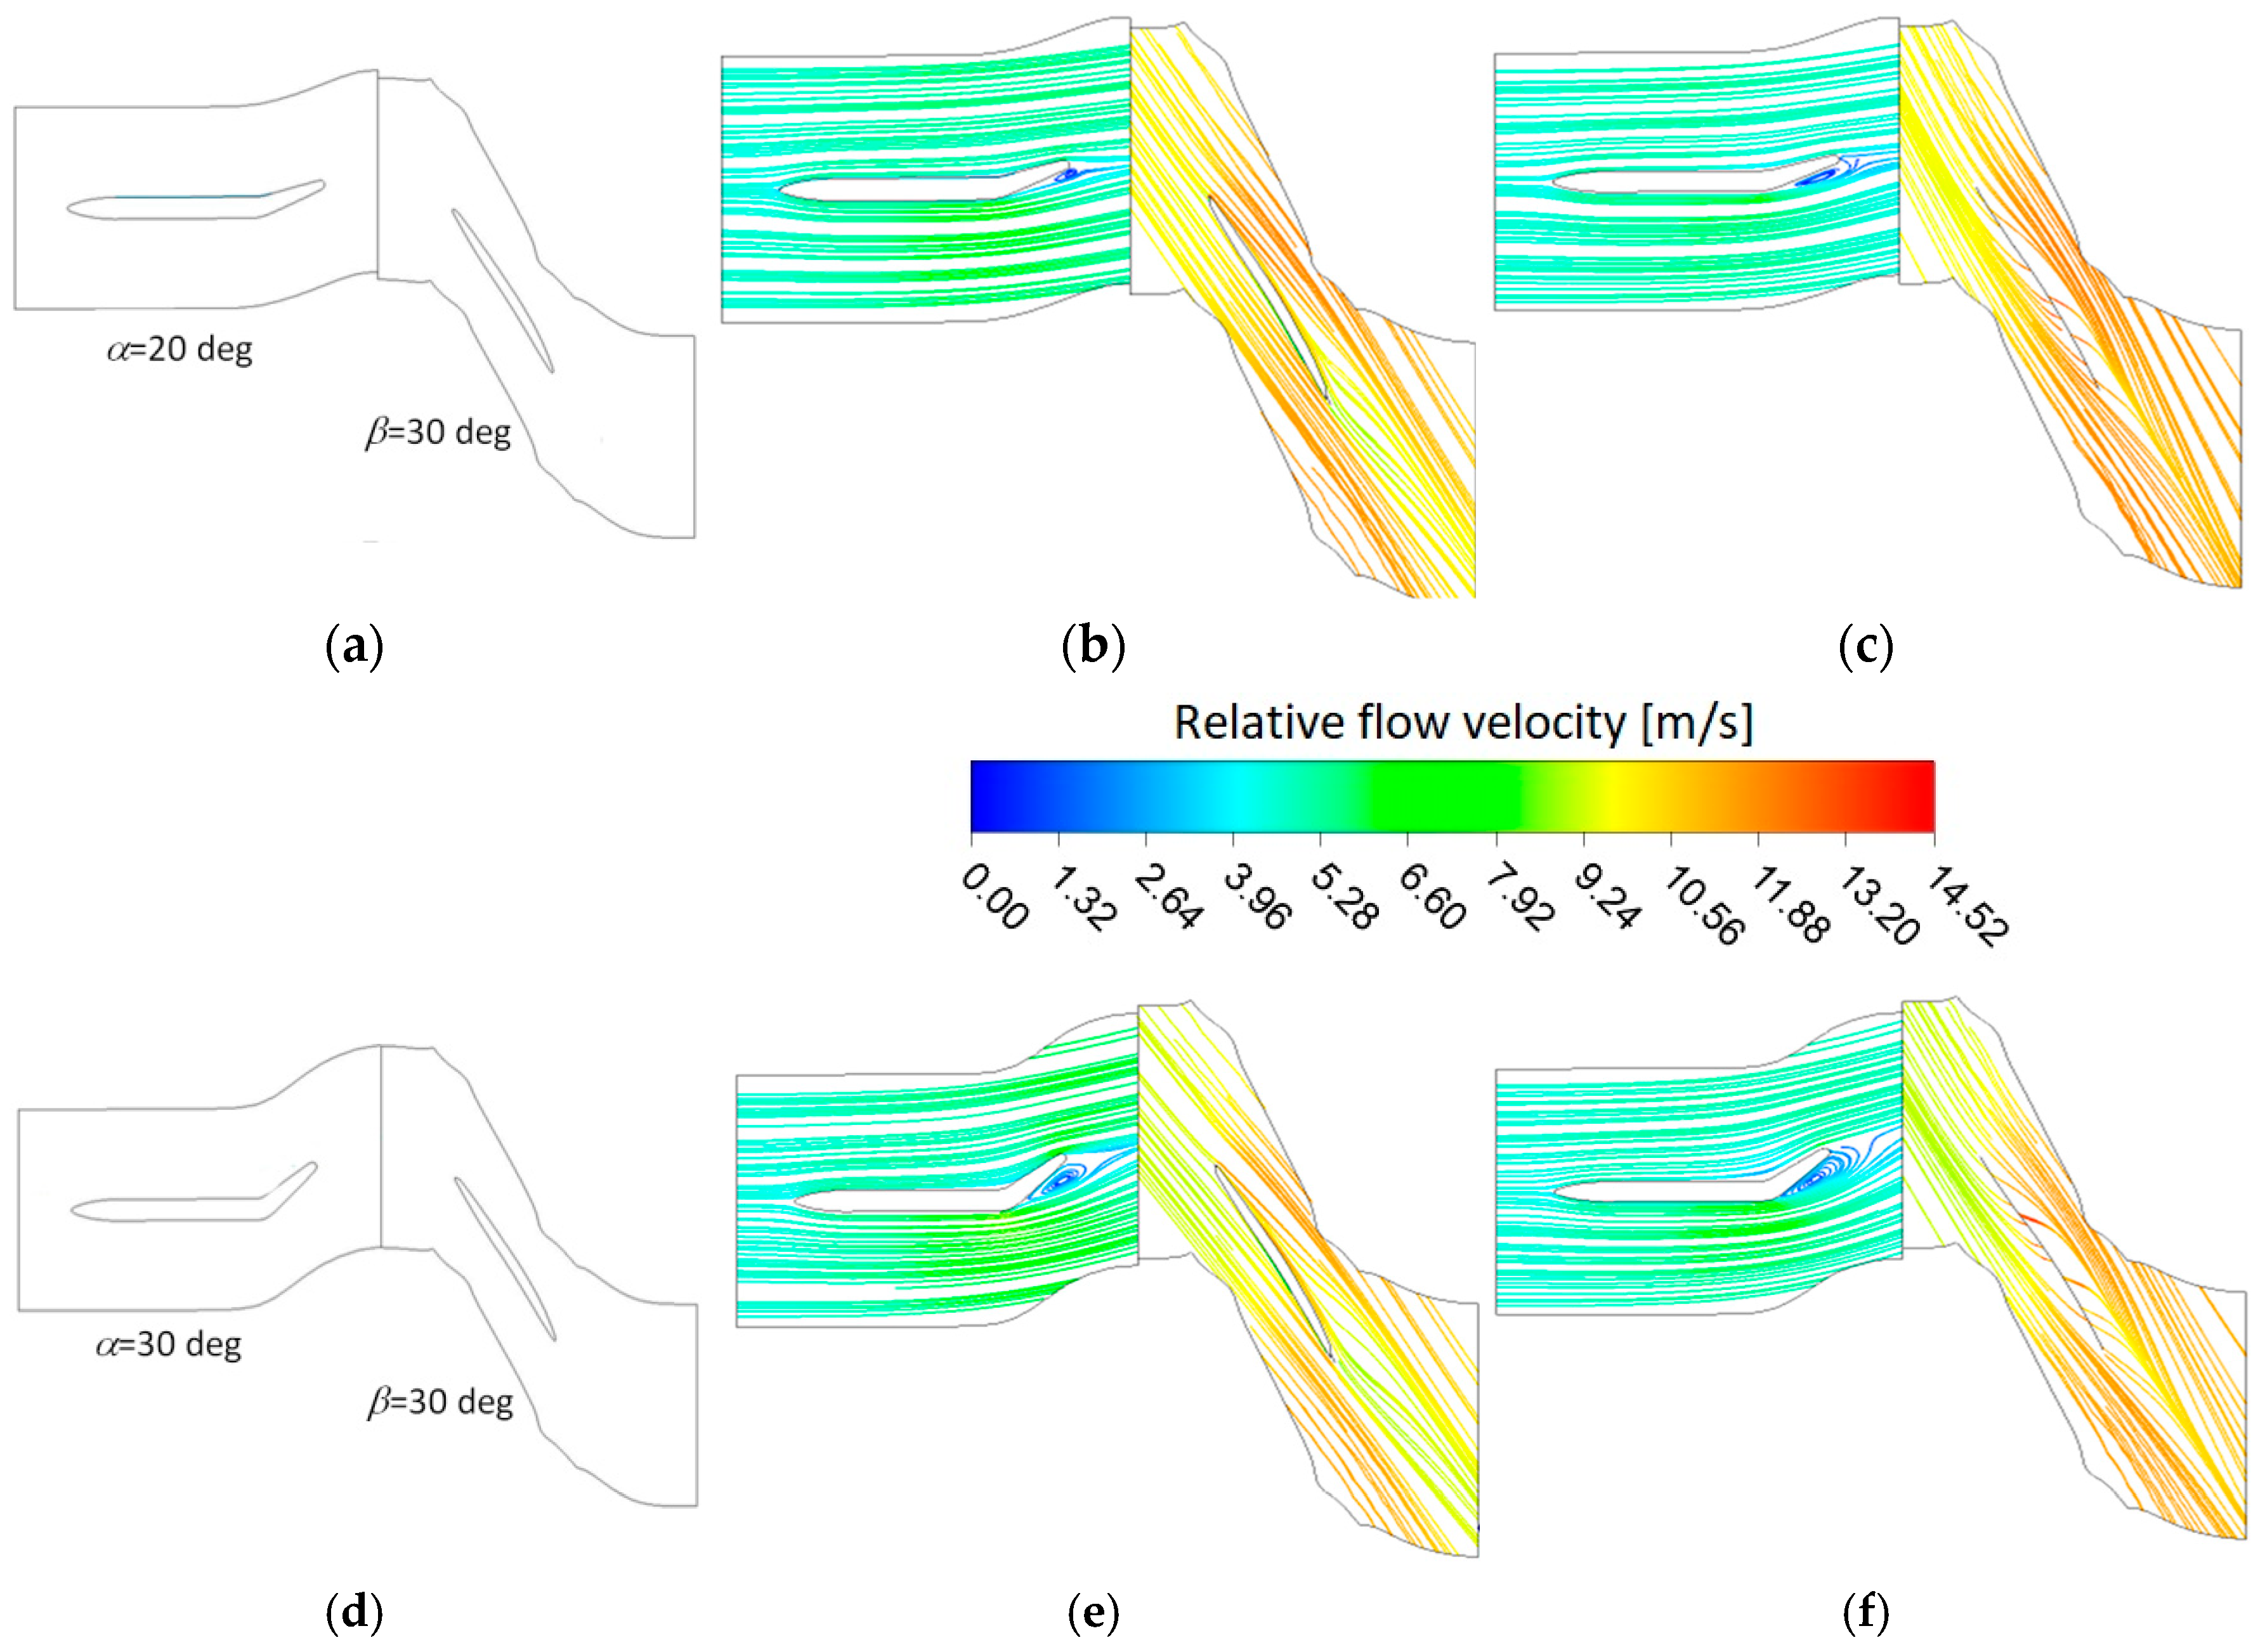
Figure 8 and Figure 9 reveal the effect of the blade setting angle and the vane opening on the flow structures and the blade loading. The vane opening imposes the flow direction upstream of the runner blades. Figure 8 presents the streamlines coloured with the relative flow velocity at 50% and 95% span, for the blade setting angle β = 30 degrees and the vane openings α = 20 and 30 degrees. As shown for an opening of 30 degrees, the flow separation increases on the SS of the vane. The variation in blade setting β imposes the stagnation point to shift from the LE and incurs significant losses. The position of the stagnation line moves toward the SS, depending on the operating conditions, and thus implies a variation in the effective angle of attack to the blade. Another consequence is the appearance of recirculation zones near the hub and close to LE and TE from the SS, as attributed to the flow separations. The effects of rotation on boundary layers contribute to the development of vortex structures in many parts of the runner blade. The secondary flows are indicated by a deflection of streamlines upward and downward from both sides, in addition to a clear structure of the passage vortex formed around the hub corner. At a blade setting angle β = 30 degrees, the streamlines are better aligned with the front part of the SS compared to β = 20 degrees, and the flow over the PS appears more uniform, with less deviation due to secondary flows. By considering a blade setting angle of 30 degrees alongside a vane opening angle of 20 degrees, there are improvements in flow homogeneity and turbine performance.
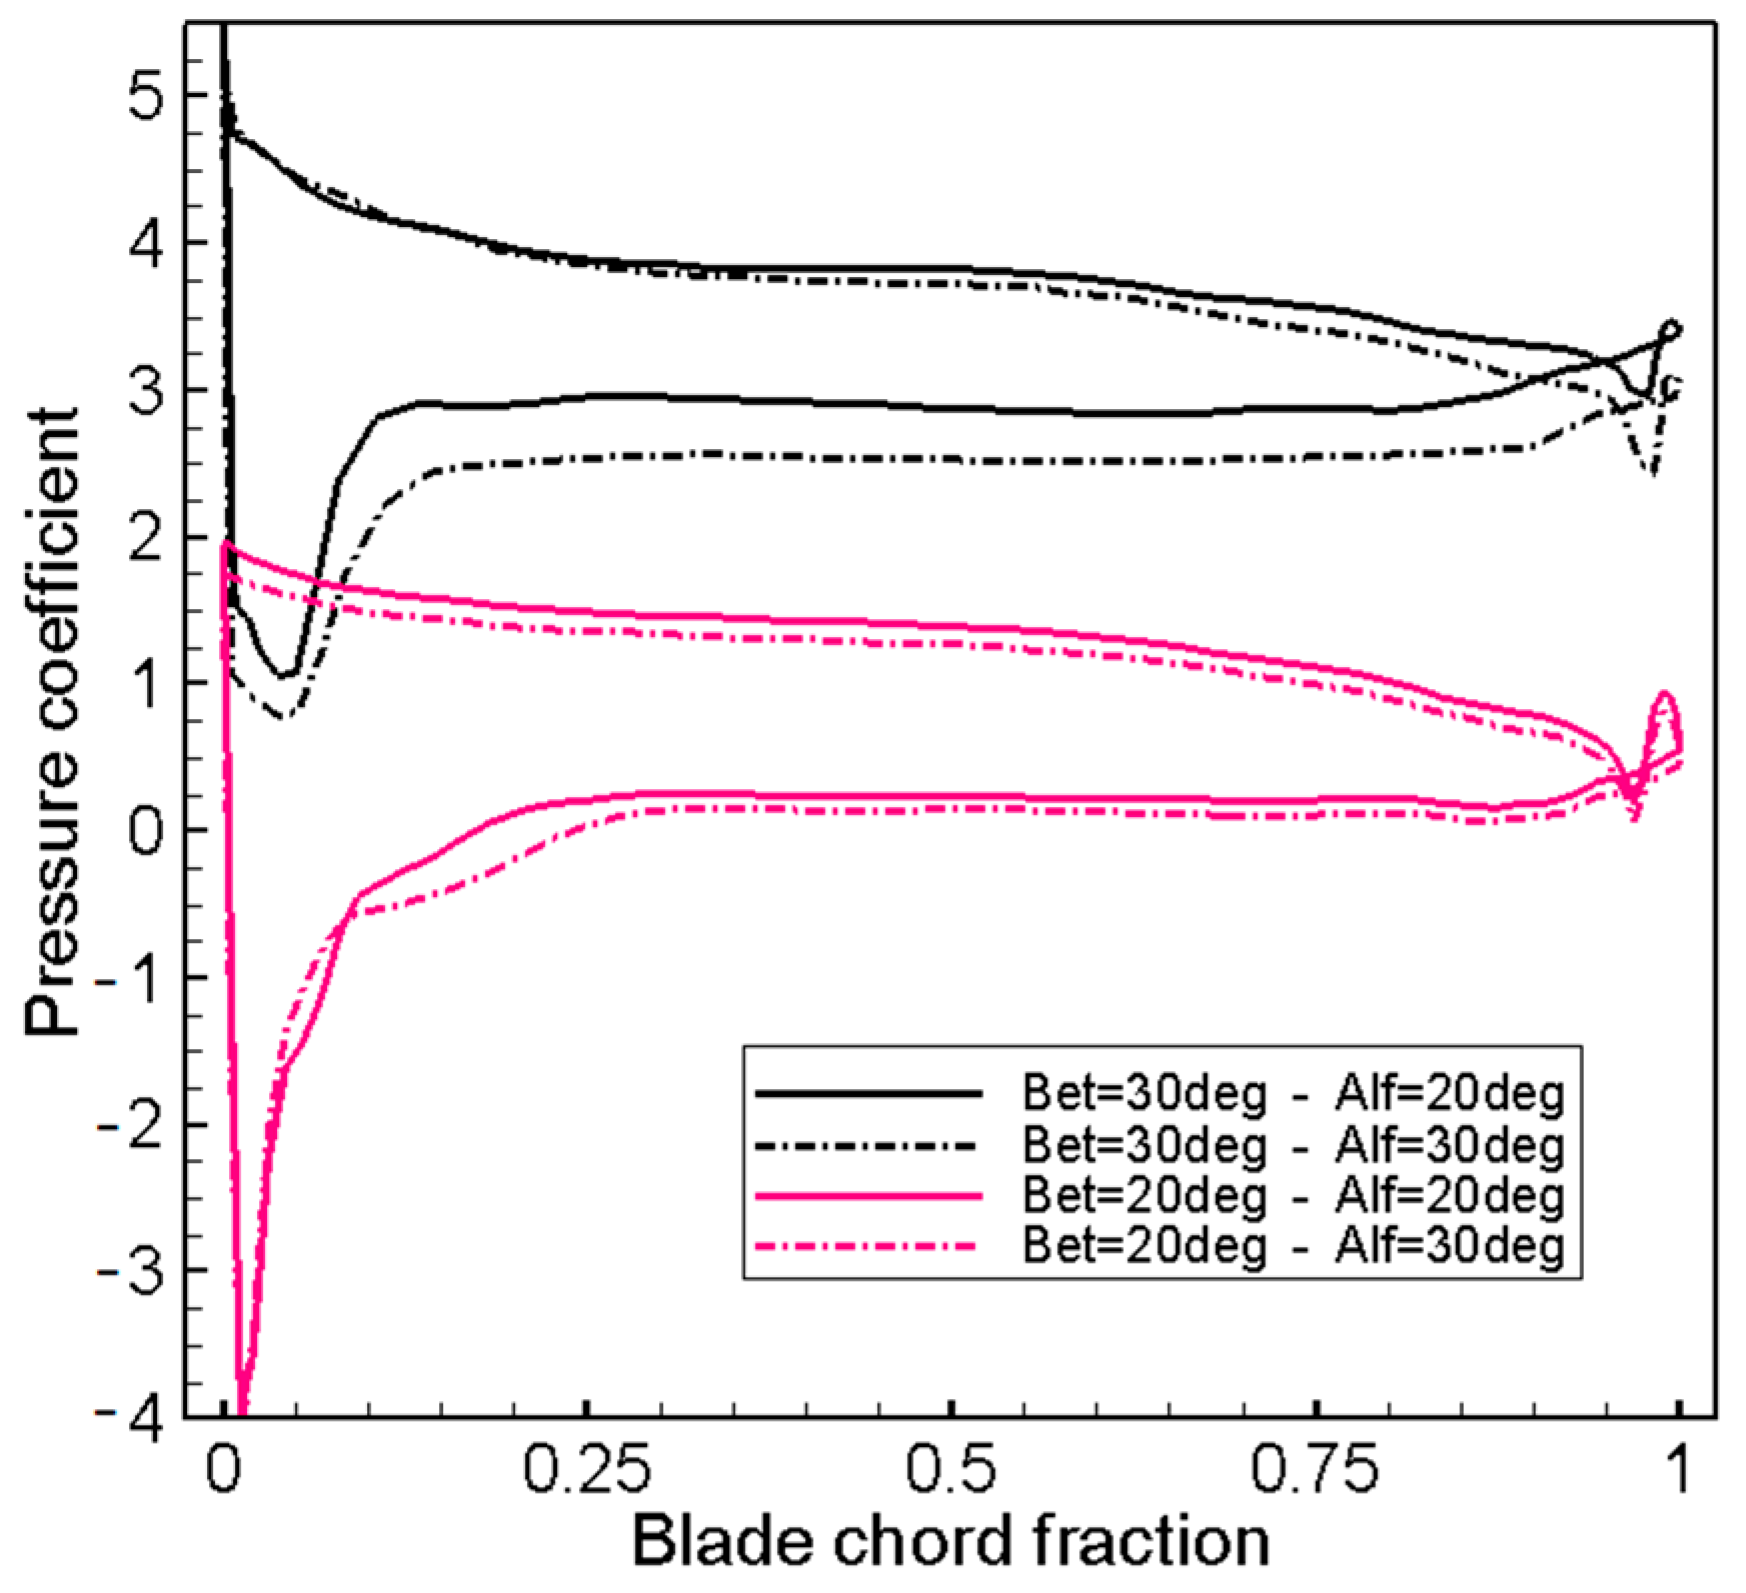
Figure 9 displays the variation in the pressure coefficient C p = p p r e f / 1 2 ρ W r e f 2 at mid-span, revealing a clear dependence on both β and α. As the blade setting angle increases from 20 to 30 degrees, the area corresponding to the pressure coefficient shifts upward, indicating higher loading. This variation can be attributed to the shift in the stagnation point, leading to rapid flow deceleration across the front of the PS. In contrast, a blade setting angle of 20 degrees results in increased leakage flow. Additionally, changing the vane angle from 20 to 30 degrees increases the tangential velocity component and the work output. However, exceeding this angle range can lead to flow separation and decrease in efficiency. Overall, adjusting the blade setting angle from 20 to 30 degrees improves power and efficiency by approximately 25% and 15%, respectively. The optimal performance is obtained for a blade setting of 30 degrees and the vane opening of 20 degrees.

4. Particle Trajectory Calculation

Elghobashi [43] has suggested that when the volume fraction of particles is less than 10−6, the particles do not significantly influence the carrier phase. In this case, the gas-particle flow is referred to as ‘one-way coupling’, and the Lagrangian approach is employed to track particles within the flow. This method is superior for controlling particle interactions with walls and for modeling all necessary forces. The equation of motion for particles, with all terms normalized by the mass of the particles, is modelled in polar coordinates as follows:
d 2 r p d t 2 r p d θ p d t + ω 2 e r + r p d 2 θ p d t 2 + 2 d r p d t d θ p d t + ω e θ + d 2 z p d t 2 e z = f D + f G B + f P +   f S
The left side of Equation (8) contains, successively, the inertia, centrifugal and Coriolis forces, while the right side contains the drag force   f D , combined gravity and buoyancy force   f G B , pressure gradient force f P , and the slip shear layer induced force   f S .
The drag force is the dominant force, developed in terms of drag factor and Reynolds number, and normalized by the mass of particle as follows:
f D = 3 4 μ f R e p ρ p d p 2 C D V f V p
and the Reynolds number given by
R e p = ρ f μ f d p V f V p
For R e p below 0.1 in the Stokes regime, the drag coefficient is given by
C D = 24 / R e p
For the range of R e p = 0.01 − 2.6 × 10⁵, Haider and Levenspiel [44] proposed the four-parameter drag coefficient as follows.
C D = 24 R e p 1 + a R e p b + c 1 + d R e p
Haider and Levenspiel [44] reassessed the constants a , b , c and d based on the shape factor ϕ = A S / A P which is the ratio of actual surface area A P to area of a sphere A S of equivalent volume. Thompson and Clark [45] proposed a unified diagram for predicting C D as a function of R e p and a particle shape descriptor known as scruple S , which characterizes particle shape, roughness or irregularity. The essential relationship between the scruple and the sphericity is given by S = α 10 γ ϕ with α and γ constants.
The combined gravitational force and buoyancy force per unit of mass is as follows:
f G B = 1 ρ f ρ p g
The pressure gradient force is only important if large gradients exist. When normalized by the mass, it becomes
f P = ρ f ρ p p ρ f
Saffman [46] produced the first expression for the slip-shear lift force, which when developed in 3-d and normalized by particle mass becomes
f S L = 3 4 ρ f ρ p   C L S V f V p × ω f
With the lift coefficient:
  C L S = 4.1126 R e s f R e p ,   R e s
The correction function f R e p ,   R e s is proposed by Mei [47] for particle Reynolds number in the range 0.1 R e p 100 and β = 0.5   R e s   R e p :
f R e p ,   R e s = 1 0.3314 β e R e p / 10 + 0.3314 β R e p 40 =   0.0524 β R e p   R e p > 40
The shear flow Reynolds number ( R e s ) is as follows:
R e s = ρ f d p 2 μ f ω f       where   ω f = × V f

4.1. Turbulence Effect

The eddy interaction model of Gosman and Ioannides [48] is a stochastic random walk treatment in which a particle interacts with a fluid eddy as long as the interaction time t i n (minimum between eddy lifetime t e and transit time t r [49]) is less than the eddy lifetime and the particle displacement relative to the eddy is less than the eddy length l e ; the expressions [50] are given as follows:
l e = 0.3 k 3 / 2 ϵ   and   t e = 0.37 k ε
The transit time is taken by a particle to traverse an eddy. Its linearized form is given below:
t r = τ p L n 1 l e τ p V f V p   and   the   relaxation   time   τ p = 4 3 ρ p ρ f d p C D V f V p
During an eddy interaction, the turbulent components are added to the mean velocity components through a Gaussian-generated random number ξ .
u ´ , v ´ , w ´ = ξ 2 / 3 k
The turbulence effect is updated every time the particle enters a new mesh cell or exceeds the eddy lifetime.

4.2. Particle Tracking

This section discusses the tracking of particle trajectories for the Kaplan turbine operating at maximum power. The Runge–Kutta–Fehlberg seventh-order method was used to integrate the trajectory equations. At each integration step, the nodal data was used to interpolate the local flow parameters. To determine a particle’s position within a mesh cell, its physical coordinates need to be converted into local coordinates. If a local value exceeds one, the particle has exited the cell and requires an update. The time step t c e l l , depend on the cell size and flow velocities; however, the effective time step m i n ( t c e l l ,   t i n ) is used for trajectory integration.

4.3. Boundary Conditions

There are three types of boundary conditions to consider: First, at the inlet plane, the release positions are assigned to particles of varying sizes. According to Ghenaiet et al. [30], the initial slip velocity was determined in terms of the local flow velocities. Second, there are interface planes between the stationary and moving frames. At each interface, the coordinates of a particle are transmitted to the next frame, and the corresponding cell number is updated using a FEM search algorithm. The particle velocity is updated as follows:
  V p a b s = V p r e l + Ω × r
Restitution coefficients are used to characterise variations in both direction and amplitude of particle velocities during collisions with walls. Tabakoff et al. [51] experimentally determined these coefficients for various turbomachinery materials, taking into account the impact angle   β p 1 between the normal and tangential velocity components. Specifically, the coefficients established for stainless steel and quartz as erodent particles are used in the present work. To address various random sources of variation, the mean and standard deviation are combined.
V p 2 / V p 1 = i = 0 4 a i β p 1 i   and   σ V p 2 / V p 1 = i = 0 4 a σ i β p 1 i
β p 2 / β p 1 = i = 0 4 b i β p 1 i   and   σ β p 2 / β p 1 = i = 0 4 b σ i β p 1 i
To prevent non-physical collisions near walls, the true impact distance is set to the particle’s half-diameter, and a more precise time step is evaluated to determine the exact impact.

4.4. Particle Seeding

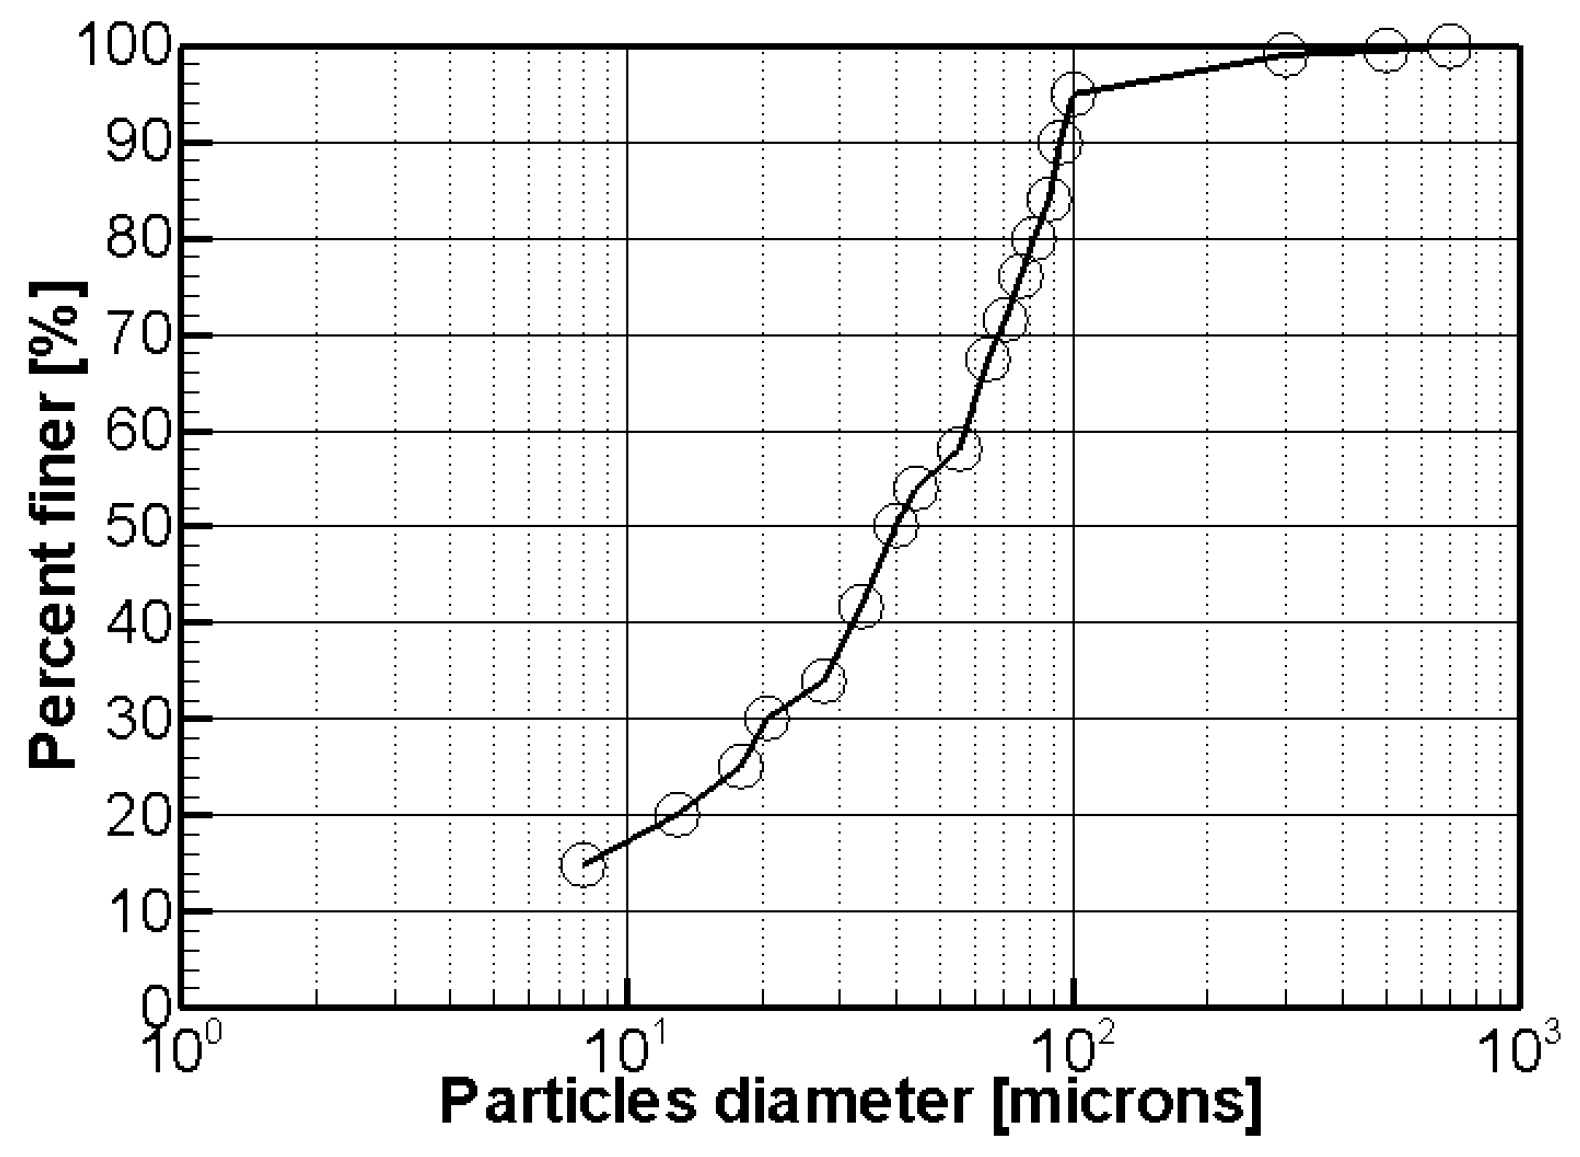
The generation of particles, including their number, sizes, and release positions, was obtained based on a dedicated subrogram that considers the sediment type, size distribution, concentration, and flow conditions. The concentration of particles was varied from 50 to 2500 mg/m3. The sizes of sediments, defined as TDHP [4], are illustrated in Figure 10. The mean particle diameter is approximately 40 microns, with a variance of around 59 microns. The particle mass rate is obtained by multiplying the particle concentration by the actual volume flow rate of the turbine when operating at maximum power. The density of quartz particles is 2600 kg/m3. The subprogram iterates through the number of particles, sizes, and release positions in both radial and tangential directions, until the total particle mass rate converges.

5. Erosion Assessment

Most studies have found that erosion is influenced by various factors, including particle size, shape, hardness, restitution coefficients, duration, impact velocity, and angle. Grant and Tabakoff [52] developed an erosion model specifically for aluminium alloys, which combines two distinct mechanisms: one at high impact angles, leading to deformation, and another at low impact angles, resulting in cutting. The erosion rate is defined as the mass (in milligrams) removed from a surface per gram of impinging particles. Later, Ball and Tabakoff [53] developed erosion models for different materials used in turbomachinery, formulated as follows:
ϵ = k 1 1 + C K . k 12 ψ 2 V p 1 2 cos 2 β p 1 1 R θ 2 + k 3 V p 1 sin β p 1 4
where the tangential restitution factor is approximated as
R θ = 1 0.0017 V p 1 sin β p 1
The different constants are as follows:
C K = 1     i f     β p 1 2.66 β o 0     i f     β p 1 > 2.66 β o
ψ = sin ϕ β p 1 0.1                                                                                 i f   β p 1 β o 1 sin ϕ β p 1 β o 3 + 1 3 sin 2 γ β p 1 β o + ξ       i f   β p 1 > β o
ϕ = 90 / 1.66 β o   , γ = 90 / β o   a n d   ξ = 0.7 0.138 + 0.5 sin γ β p 1 0.212 cos 2 γ β p 1
For the Martensitic stainless steel and quartz as erodent particles, the values of the constants are   k 1 = 0.5225 × 10 5 ,   k 12 = 0.266799 , k 3 = 0.549 × 10 7 , and the angle of maximum erosion β 0 = 15   d e g [53].
At an impact point, the mass lost due to erosion is calculated using the local erosion rate (Equations (25)–(29)). The centred area is determined by taking one-quarter of the area of the four faces that share the same node   A n o d e . By knowing the number of impacts occurring on each mesh element area per second, the eroded mass is summed to calculate the Erosion Rate Density (ERD) in mg/s·mm2 for each node. This value is then divided by the area A n o d e surrounding it:
E R D = i = 1 n i ϵ i m p i A n o d e

6. Results and Discussions

This section presents the results of the particle trajectory analysis and erosion. The following subsections will examine the particle trajectories, investigate the progression of erosion, and report on the ERD and the Eroded Mass Per Hour (EMPH).

6.1. Particle Trajectories

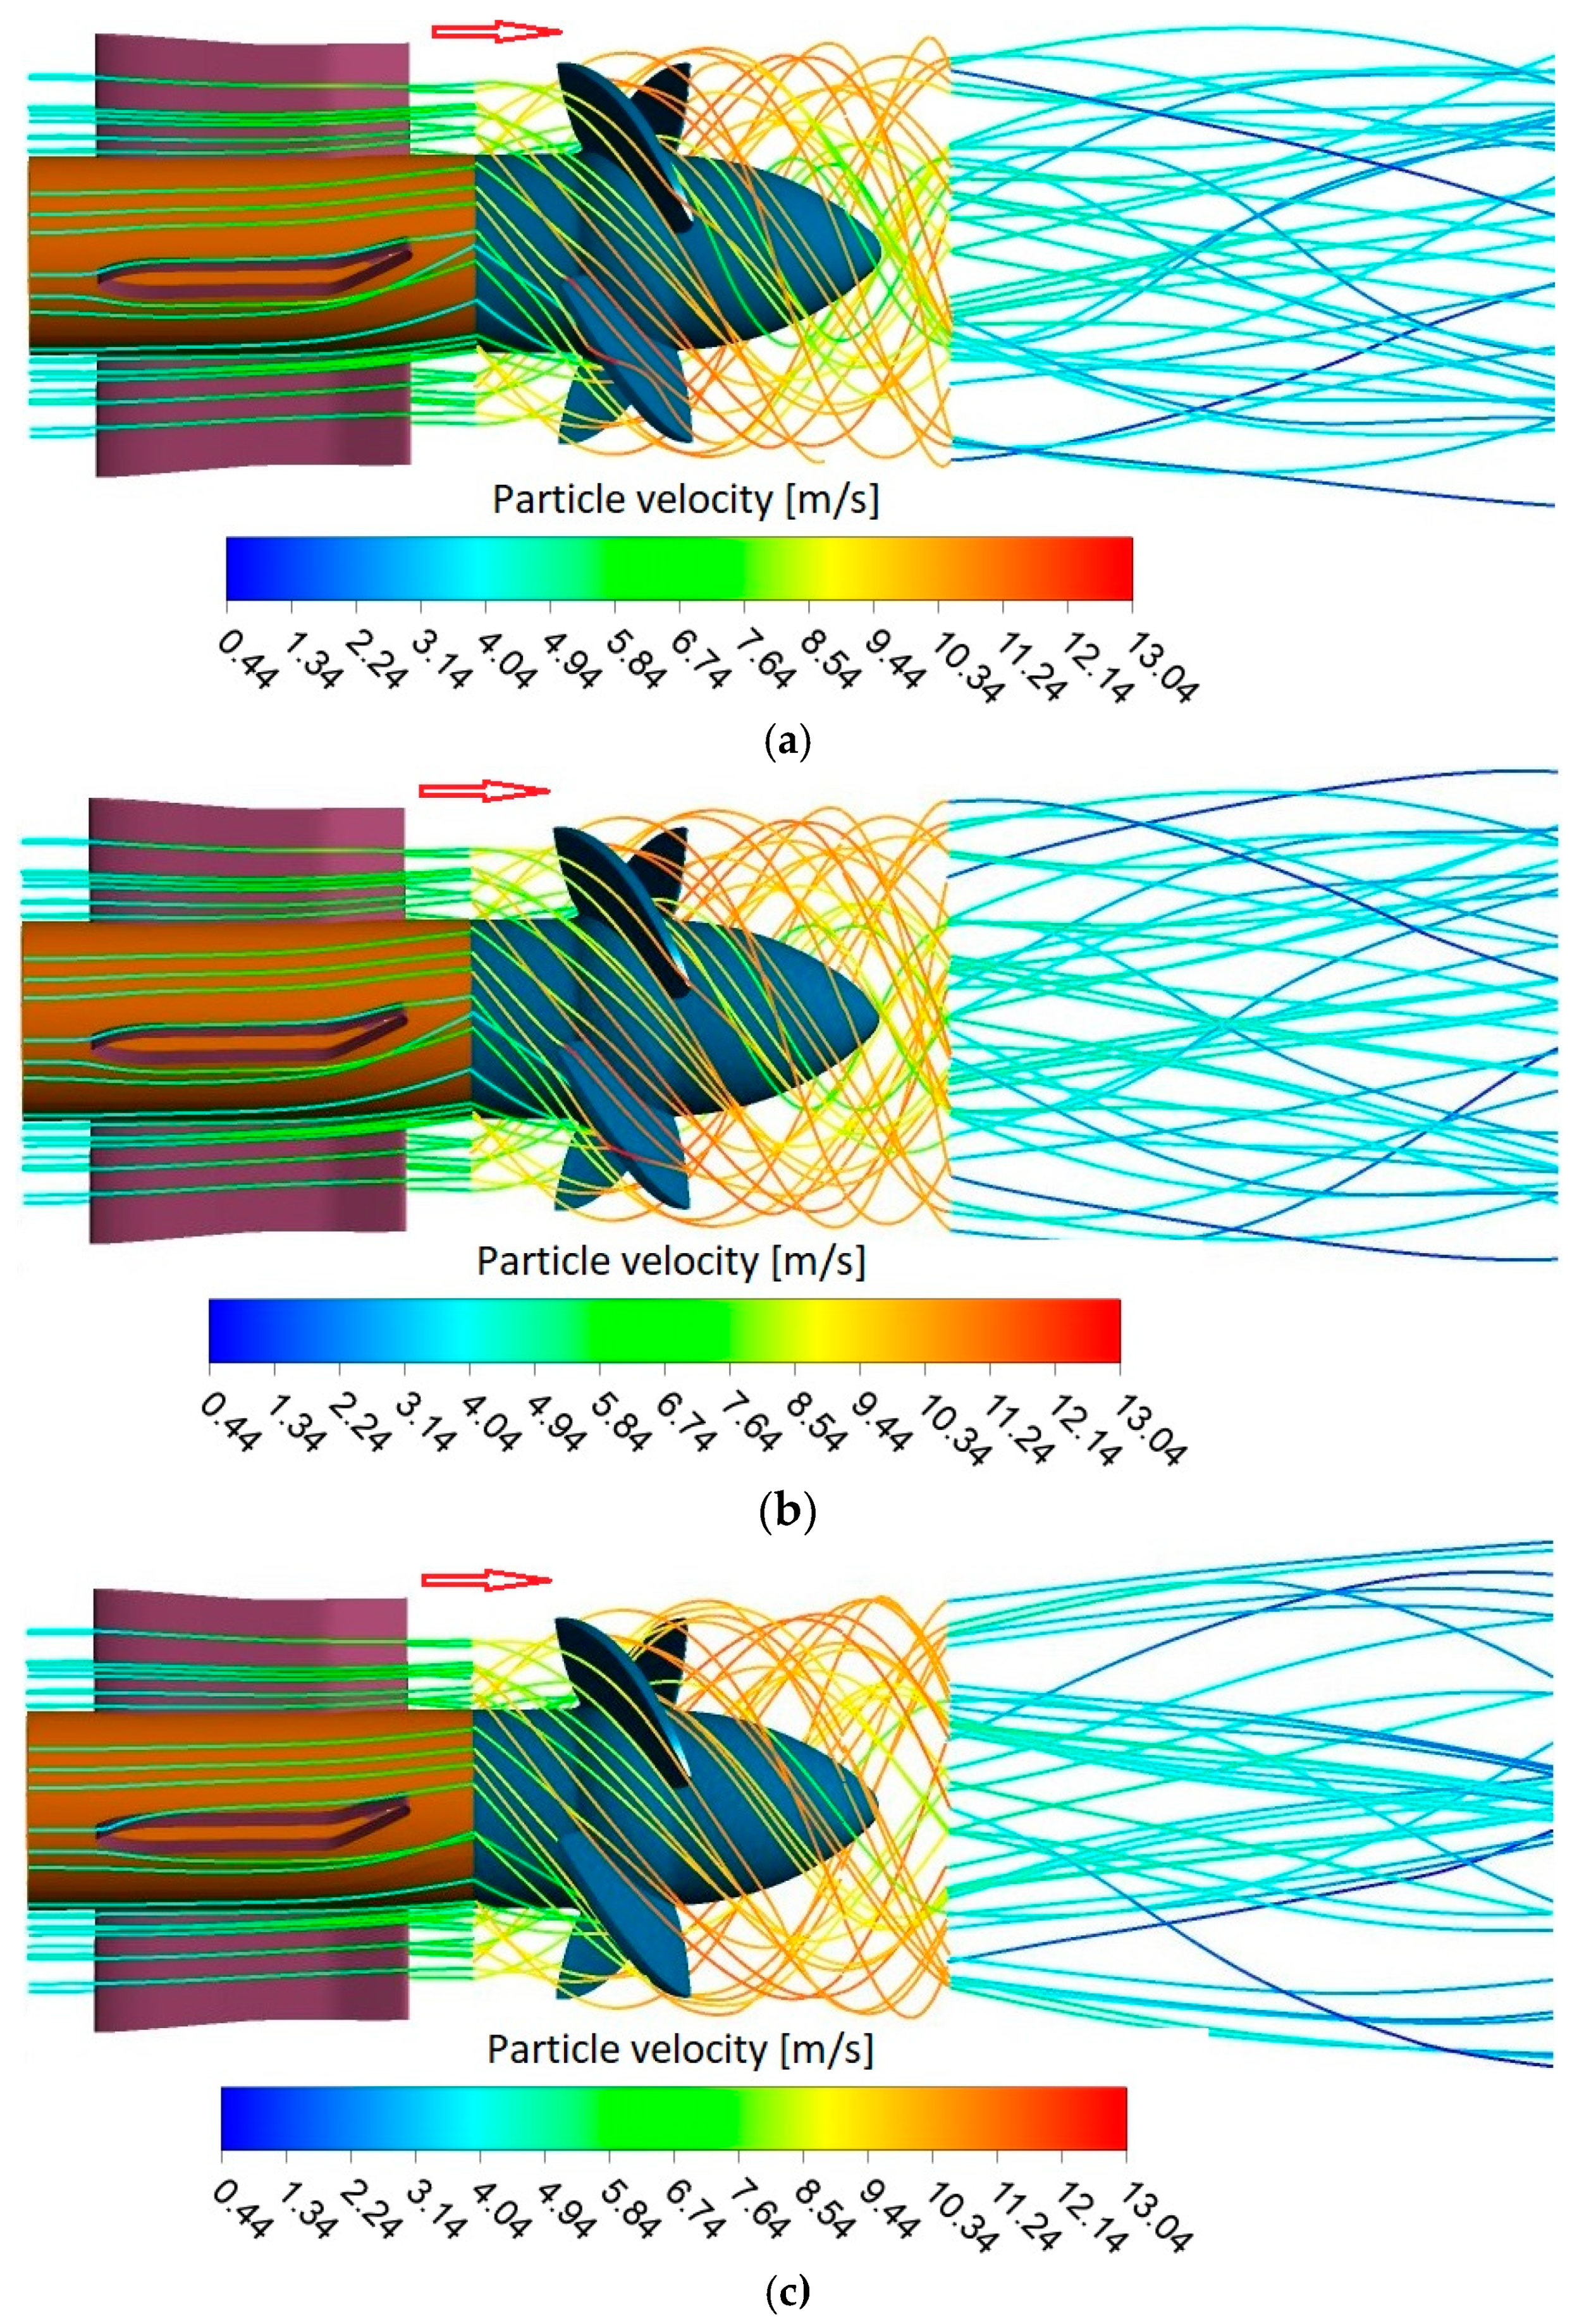
A limited number of 1000 constant-size quartz (sand) particles were released at the inlet of the Kaplan turbine, and their paths were tracked to show the trajectory behaviors for each particle size while operating at nominal point. Figure 11 displays reduced samples of particle trajectories coloured by velocity, and adopts the same scale to compare. Small particles, such as 5 microns (Figure 11a), tend to follow the streamlines due to the effects of drag force, secondary flows, and turbulent flow. For particles of 5 microns, and the maximum value of R e p = 47.71 , the drag factor C D = 1.6088 . As these particles pass through the distributor are deflected by the vanes and align with the flow streamlines at the exit throat. Upon entering the runner, the direction of these particles changes significantly, aligning more closely with the rotor blades. They reach both the LE and PS of the blades, while other particles travel without interacting with the blades. Through the runner, particle velocities can exceed values of 13 m/s for some particles, although most have velocities lower than 10 m/s. The leakage flow across the tip clearance effectively transports these small particles, which tend to follow the tip vortices and collide with the shroud. Due to high centrifugation while travelling through the blades, these small particles continue to circle the bulb, as shown in Figure 11a. When crossing the rotor-draft tube interface, core particles are entrained by the residual flow rotation; many of them follow the core of the bulb vortex, while outer particles are centrifuged toward the draft tube wall. In the stationary components, the particles exhibit velocities of less than 7 m/s. The mid-size particles of 40 microns (Figure 11b), have a maximum R e p = 386.73 , and thus a drag factor C D = 0.6103 , which greatly influences their behaviour. These medium-sized particles are heavily influenced by inertia and centrifugal forces. Most of them travel on ballistic trajectories before reaching the LE and bounce off, as seen in Figure 11b. Many of these particles strike the PS of the blades, while others move directly to reach the TE and collect there. Some particles are seen to follow the core vortex from the bulb, but the majority are centrifuged outward while crossing the draft tube. On the other hand, the larger particles of 300 microns have a maximum R e p = 2804.75 and thus C D = 0.3923 , which is lower than that of small particles, explaining the dominance of inertial forces. These larger particles are less affected by the flow streamlines as they pass through the distributor vanes, as seen in Figure 11c, and they tend to follow ballistic paths. After departing from the vanes, these particles travel in various directions along their ballistic trajectories and cross the interface. Consequently, these large particles arrive at the LE of the rotor blades from different directions due to their increased inertia. As mentioned earlier, these particles undergo significant centrifugation while moving through the rotor, causing them to deviate notably from the flow streamlines because of higher inertia compared to the drag force. The particles are depicted circling several times (Figure 11c), and after exiting the rotor bulb, they move on ballistic trajectories, being centrifuged toward the draft tube wall. The velocities of these particles reach maximum velocities while moving through the rotor, but fall to less than 7 m/s when passing through the distributor and draft tube.
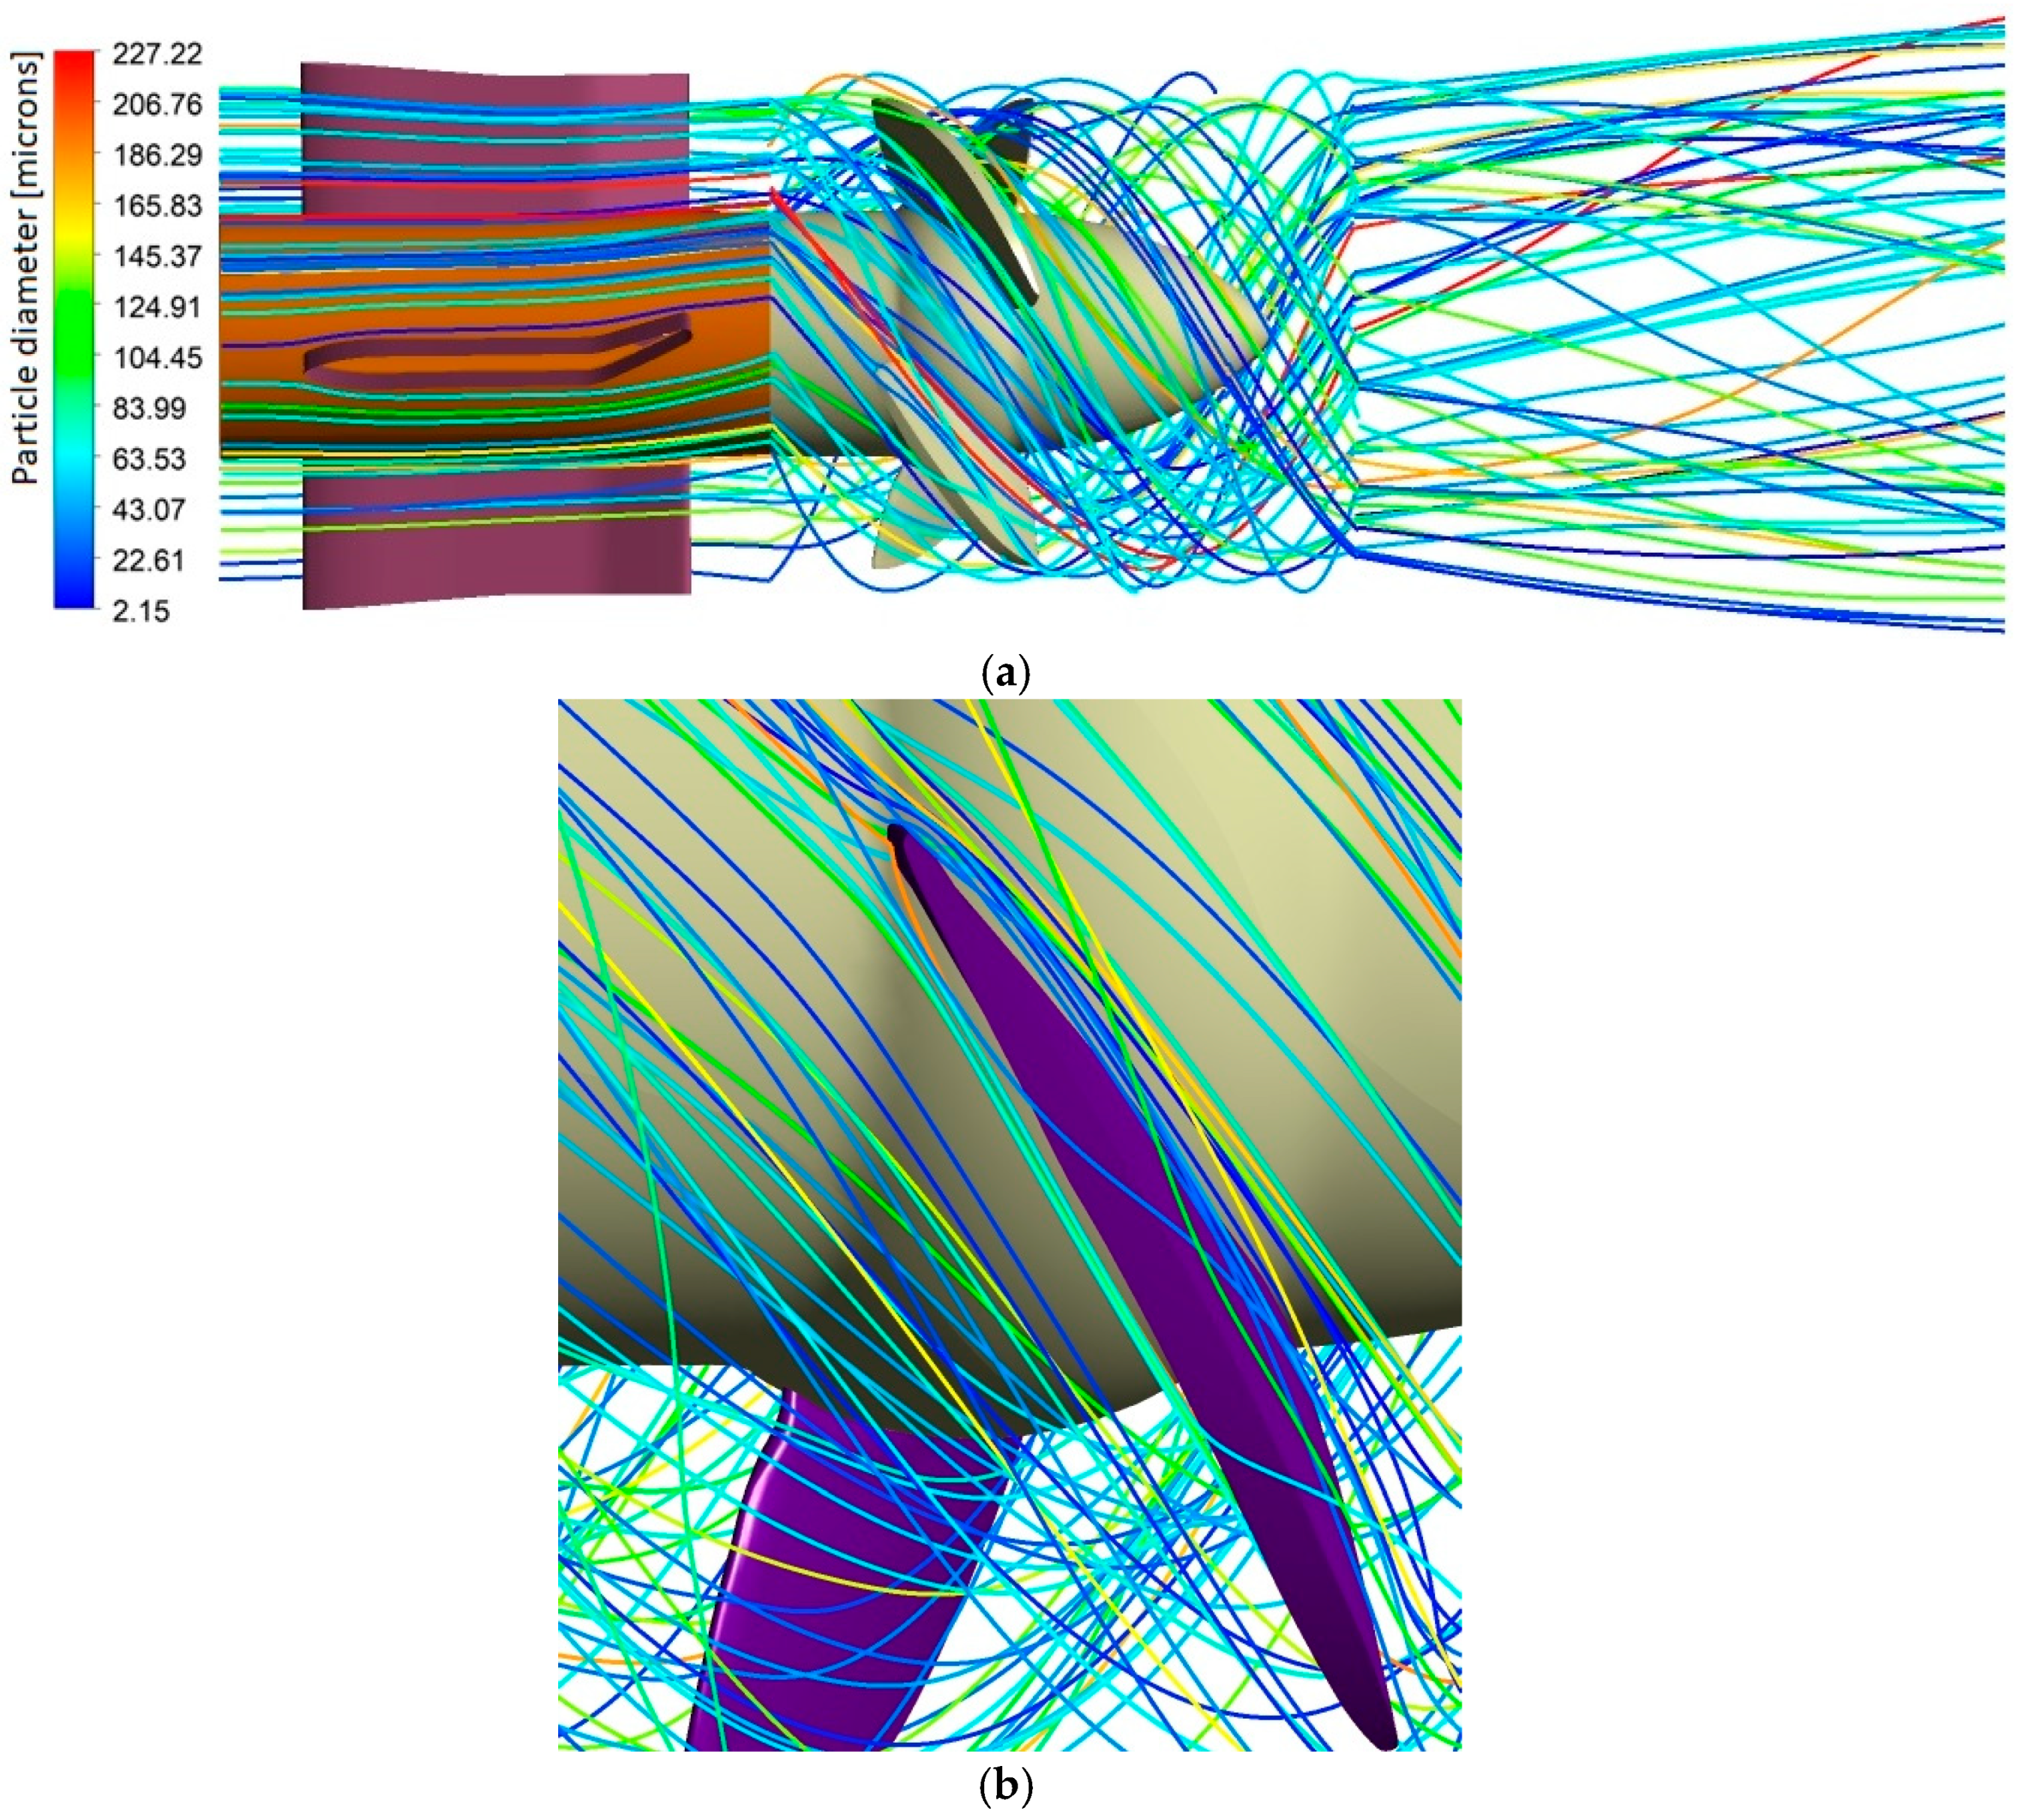
Figure 12 illustrates the paths of particles of random sizes, corresponding to the sediment’s TDHP size distribution. A total of 1000 particles with diameters ranging from 2.15 to 227.22 microns were injected, as seen in Figure 12a. As these particles move through the distributor vanes, they gain an axial velocity component in addition to the tangential component. This causes the particles to be deflected before entering the rotor. Due to the phase shift between the trajectory of the particles and the fluid streamlines, the blade PS does not interact directly with the particles. Larger particles, which have higher inertia, collide with and bounce off the front of the blades and the PS, as depicted in Figure 12b. Some of these particles collide at the TE and hit the area around the hub corner. As sediments travel through the draft tube, they continue to rotate (Figure 12a), influenced by the residual flow rotation. Conversely, smaller particles tend to adhere to the flow path around the LE of the blade, as seen from the SS (Figure 12b). Many of these smaller particles traverse the tip gap and continuously impact the blade tip and the shroud. Larger particles collide with the LE and the front part of the PS (Figure 12b), while the smaller ones hit the blade tip and the rear surface of PS near the hub corner. Due to residual centrifugation, the larger particles travel straight along the draft tube, while the smaller ones follow the core vortex issued from the bulb, as illustrated in Figure 12a.
Figure 13 presents the particle trajectories coloured by the Stokes number S t k , to further characterize the particle dynamics. The Stokes number   S t k compares the ratio of the particle response time ρ p d p 2 / 18 μ to characteristic time scale   c / V f of the fluid. The characteristic length c is the vane or blade chord length at the mid-span. According to Figure 13, the maximum value of   S t k is 1.9. Particles with   S t k < 0.35   tend to follow the streamlines around the vanes, along the LE of the blades, and over the blade tips. In contrast, larger particles with higher   S t k > 0.52 pass through the runner and strike the front part of the blade’s PS with high impact angles. The inner rear part of the blades is impacted at lower angles, allowing the particles to continue on ballistic trajectories afterward.

6.2. Effect of Vane/Blade Position on Erosion Development

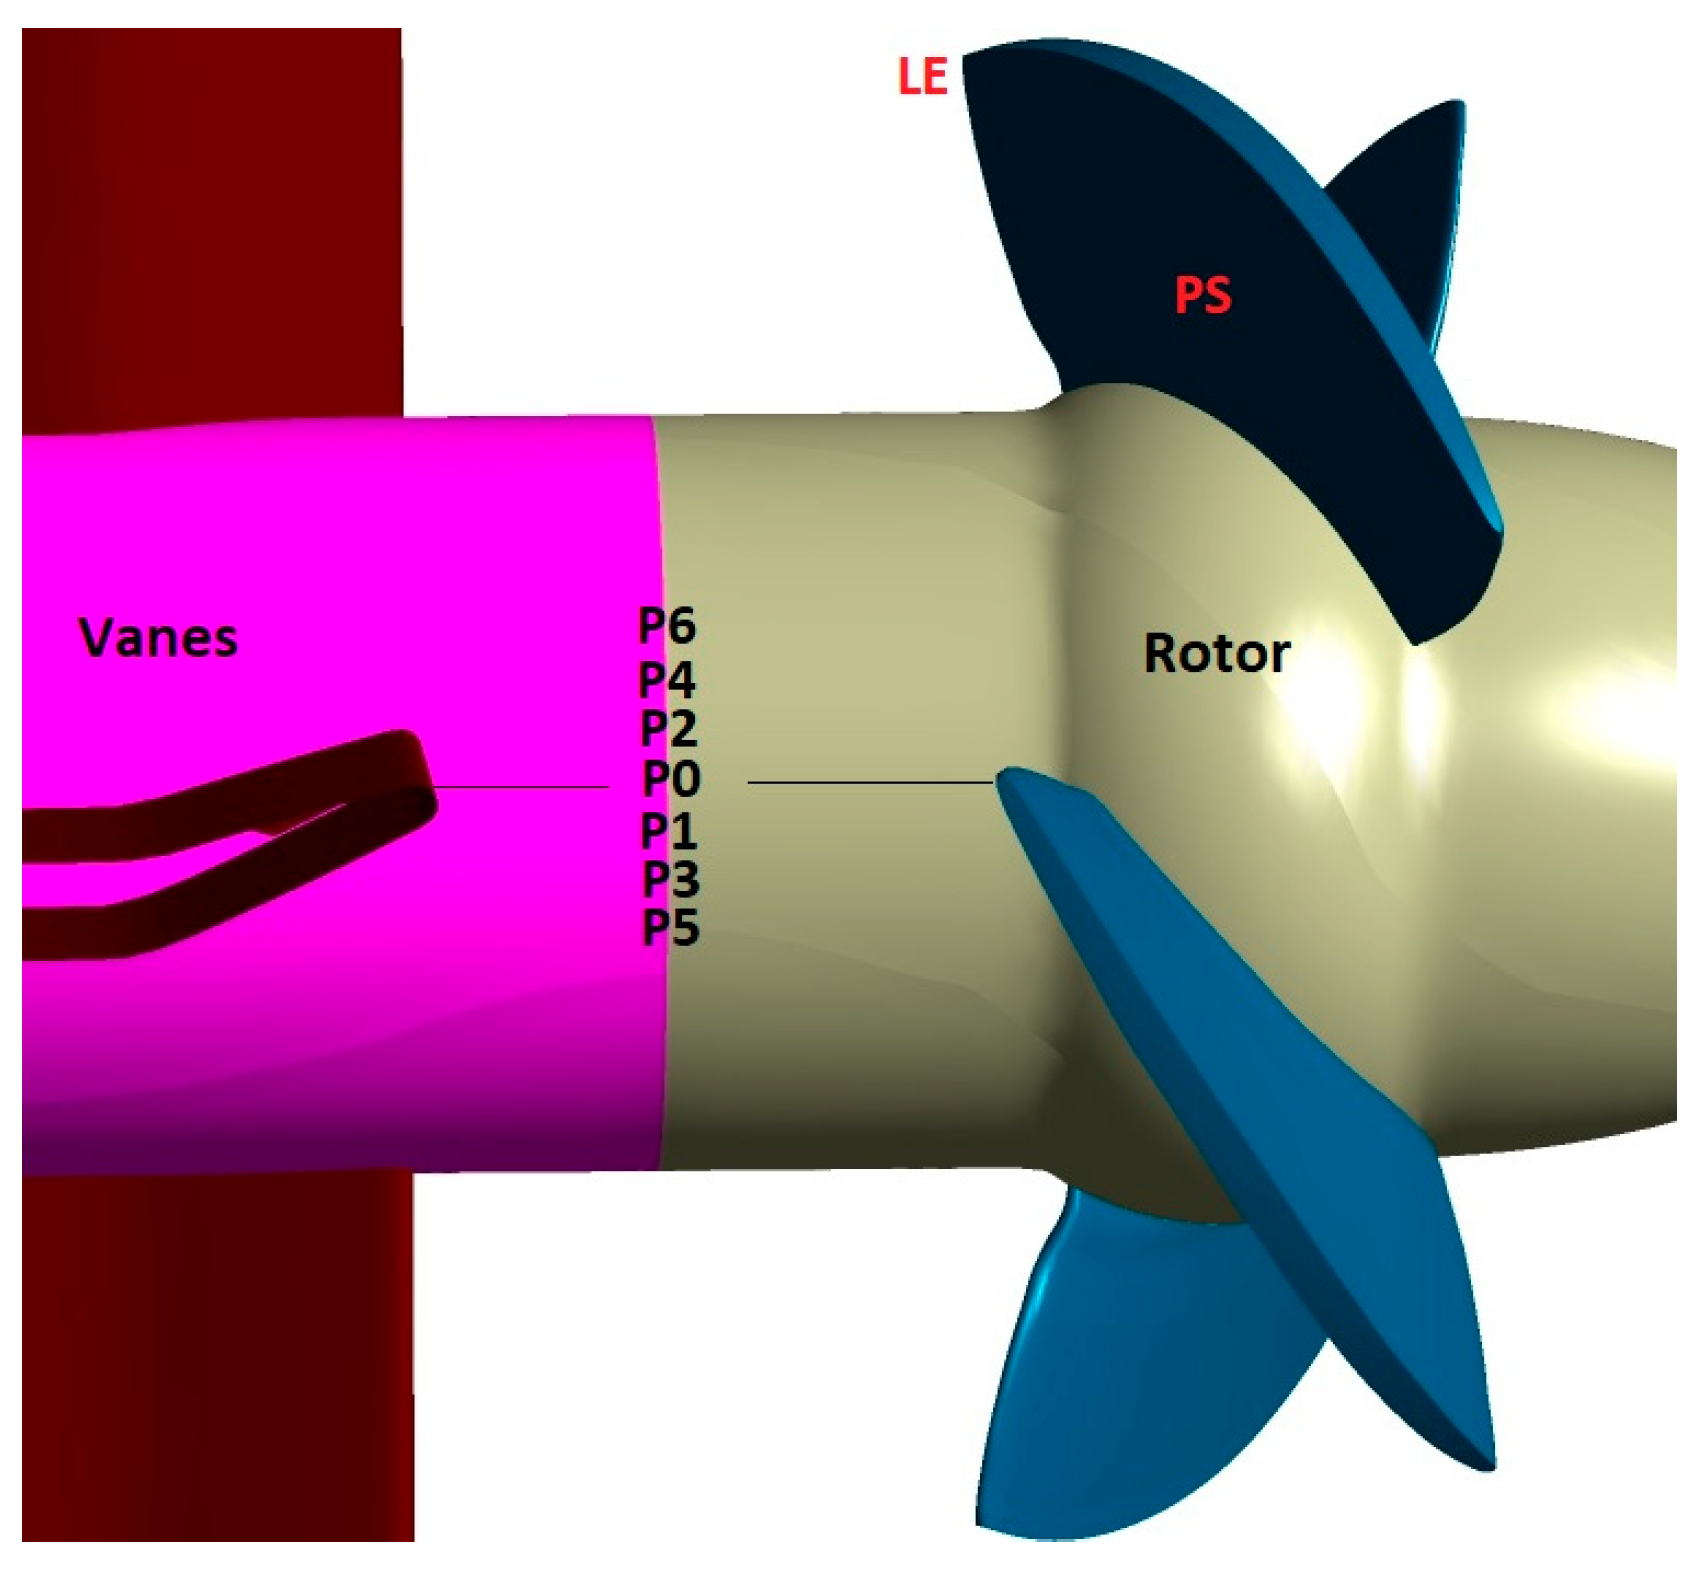
Figure 14 depicts the relative positions of the blade against the vane, P0–P6, where the position ‘P0′ corresponds to the TE of the vane aligned with the LE of the blade. This study assessed the variations in ERD and EMPH and concluded how the erosion patterns and rates evolve between the runner blade positions from P0 to P6. At each blade position, the flow field was solved, and thereafter the data were transferred to the trajectory code.
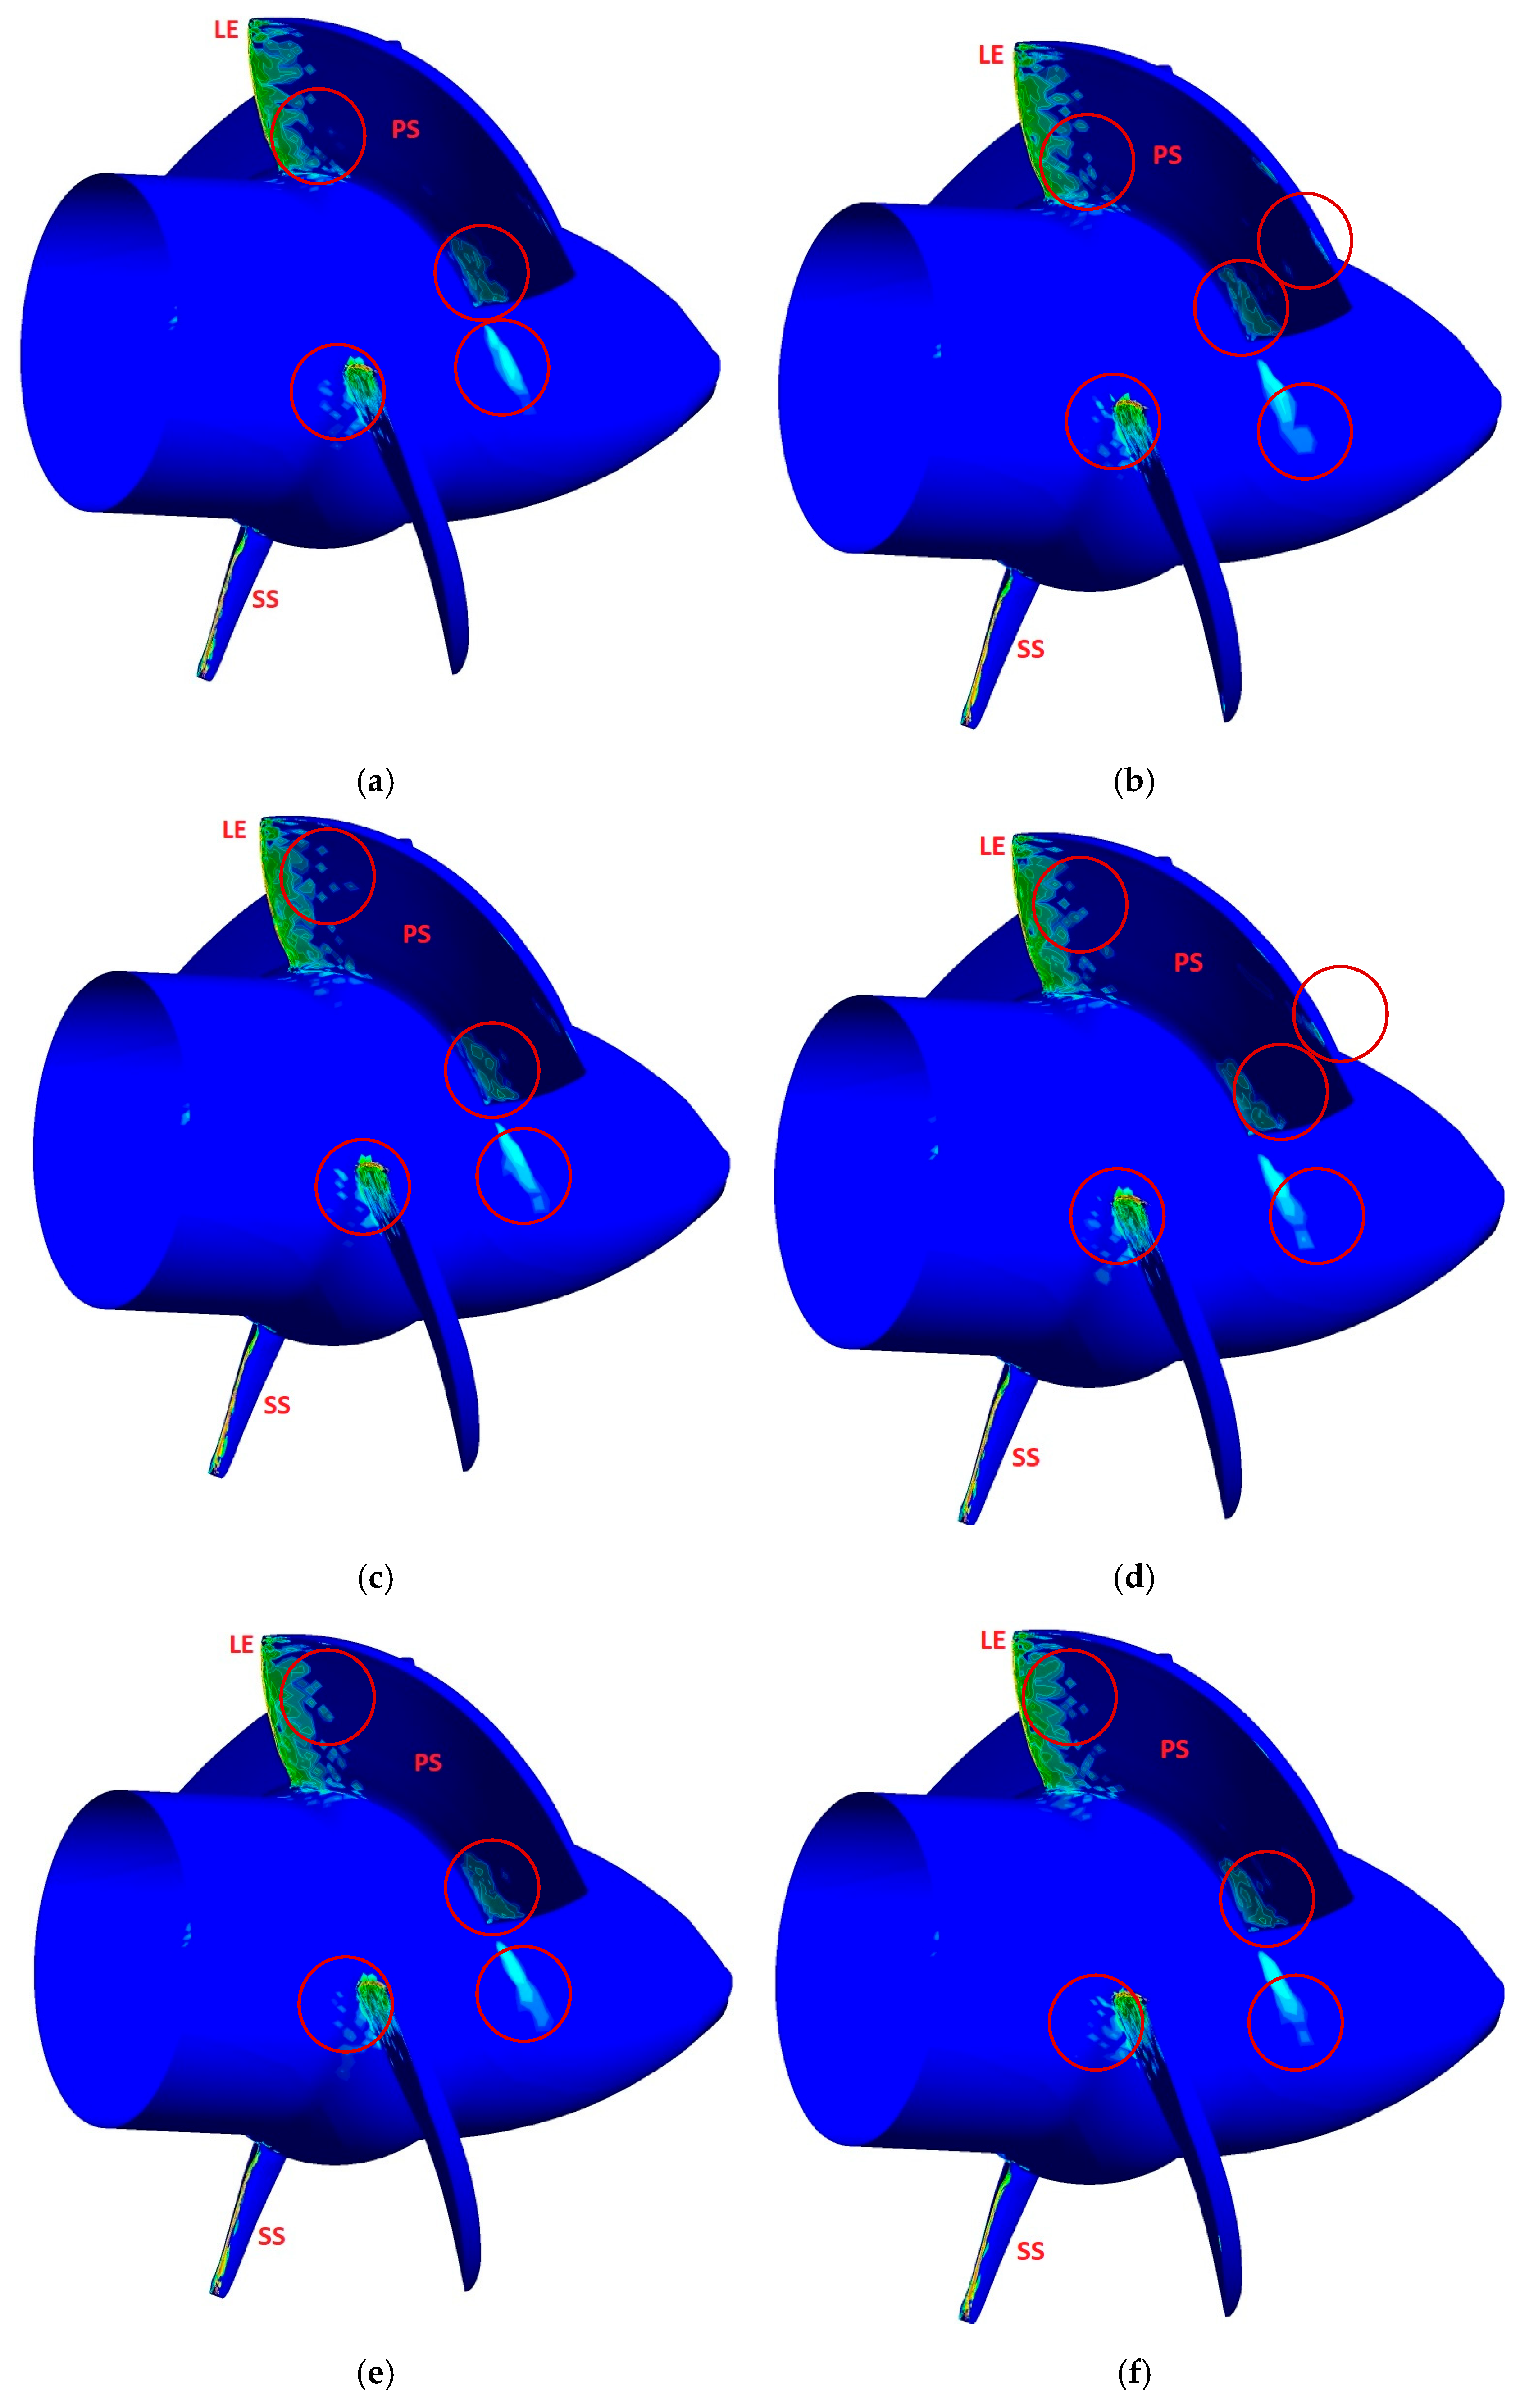
Figure 15a–g plot the computed contours of erosion in terms of ERD resulting from tracking sand particles injected at a concentration of 500 mg/m3, and for different relative positions between the vane and blade from P0 to P6.
The main difference in the erosion patterns is primarily due to the direct exposure to the flux of particles entering the rotor blades at high angles, along with the effects of flow conditions, inertia and centrifugal forces. As shown for the various positions P0–P6, the PS of the rotor blades exhibits a large region of erosion that extends from the LE towards the hub to the tip, with additional erosion visible in the rear region from the hub corner. Meanwhile, the rest of the PS displays traces of erosion near the tip of blades. The SS of the blades is heavily eroded around the LE. The hub depicts erosion traces around the LE of the blades, extending to the rear of the hub corner and the TE of the blades. The observed erosion patterns indicate a dependence on the relative position of the blade, which is highlighted by the varying erosion patterns plotted for the same ERD scale for comparison. The erosion patterns and scatters, presented in terms of local ERD values, are influenced by the different positions P0–P6, particularly around the LE and the rear of the blade hub corner and downstream of the TE. The subsequent values of erosion rate were used to evaluate the Averaged Erosion Rate Density (AERD) averaged between the various positions P0–P6, and the Eroded Mass Per Hour (EMPH). Although the vanes are also affected by the different positions, this effect is somewhat minor, which is related to some particles that impact the LE of the blades and bounce back to strike the rear of the vanes.
Figure 16a–c plot histograms in terms of EMPH values in the vanes, runner blades and shroud, and compares the values for different initial positions of runner blade from P0 to P6. The values of EMPH in the vanes show slight variations of around 0.16%depending on the blade positions, which may be attributed to particles bouncing back from the blades and impacting the vanes a second time. Among the different positions, P1 and P3 resulted in more significant erosion of the vanes with an EMPH of 5.0337 × 10⁻⁵ mg/hr, while the position P0 led to the least erosion with an EMPH of 5.0257 × 10⁻⁵ mg/hr. The positions of the blades appear to have an even greater effect on the EMPH of the blade, with variations of about 8.99%. Position P1 caused the most erosion of the blades, with an EMPH of 1.0094 × 10⁻³ mg/hr, followed by the positions P0 and P3. In contrast, position P2 exhibited the lowest EMPH value at 0.9261 × 10⁻³ mg/hr. With regard to the shroud, the most erosion was observed at position P3, which demonstrated an EMPH of 3.6981 × 10⁻⁵ mg/hr, followed by P4. The position P6 showed the least erosion, with an EMPH of 3.6458 × 10⁻⁵ mg/hr. Overall, these erosion patterns have been averaged to produce more representative ERD contours, allowing for a better assessment of the EMPH on the surfaces of each component.

6.3. Erosion of Kaplan Turbine Components at Different Operating Conditions

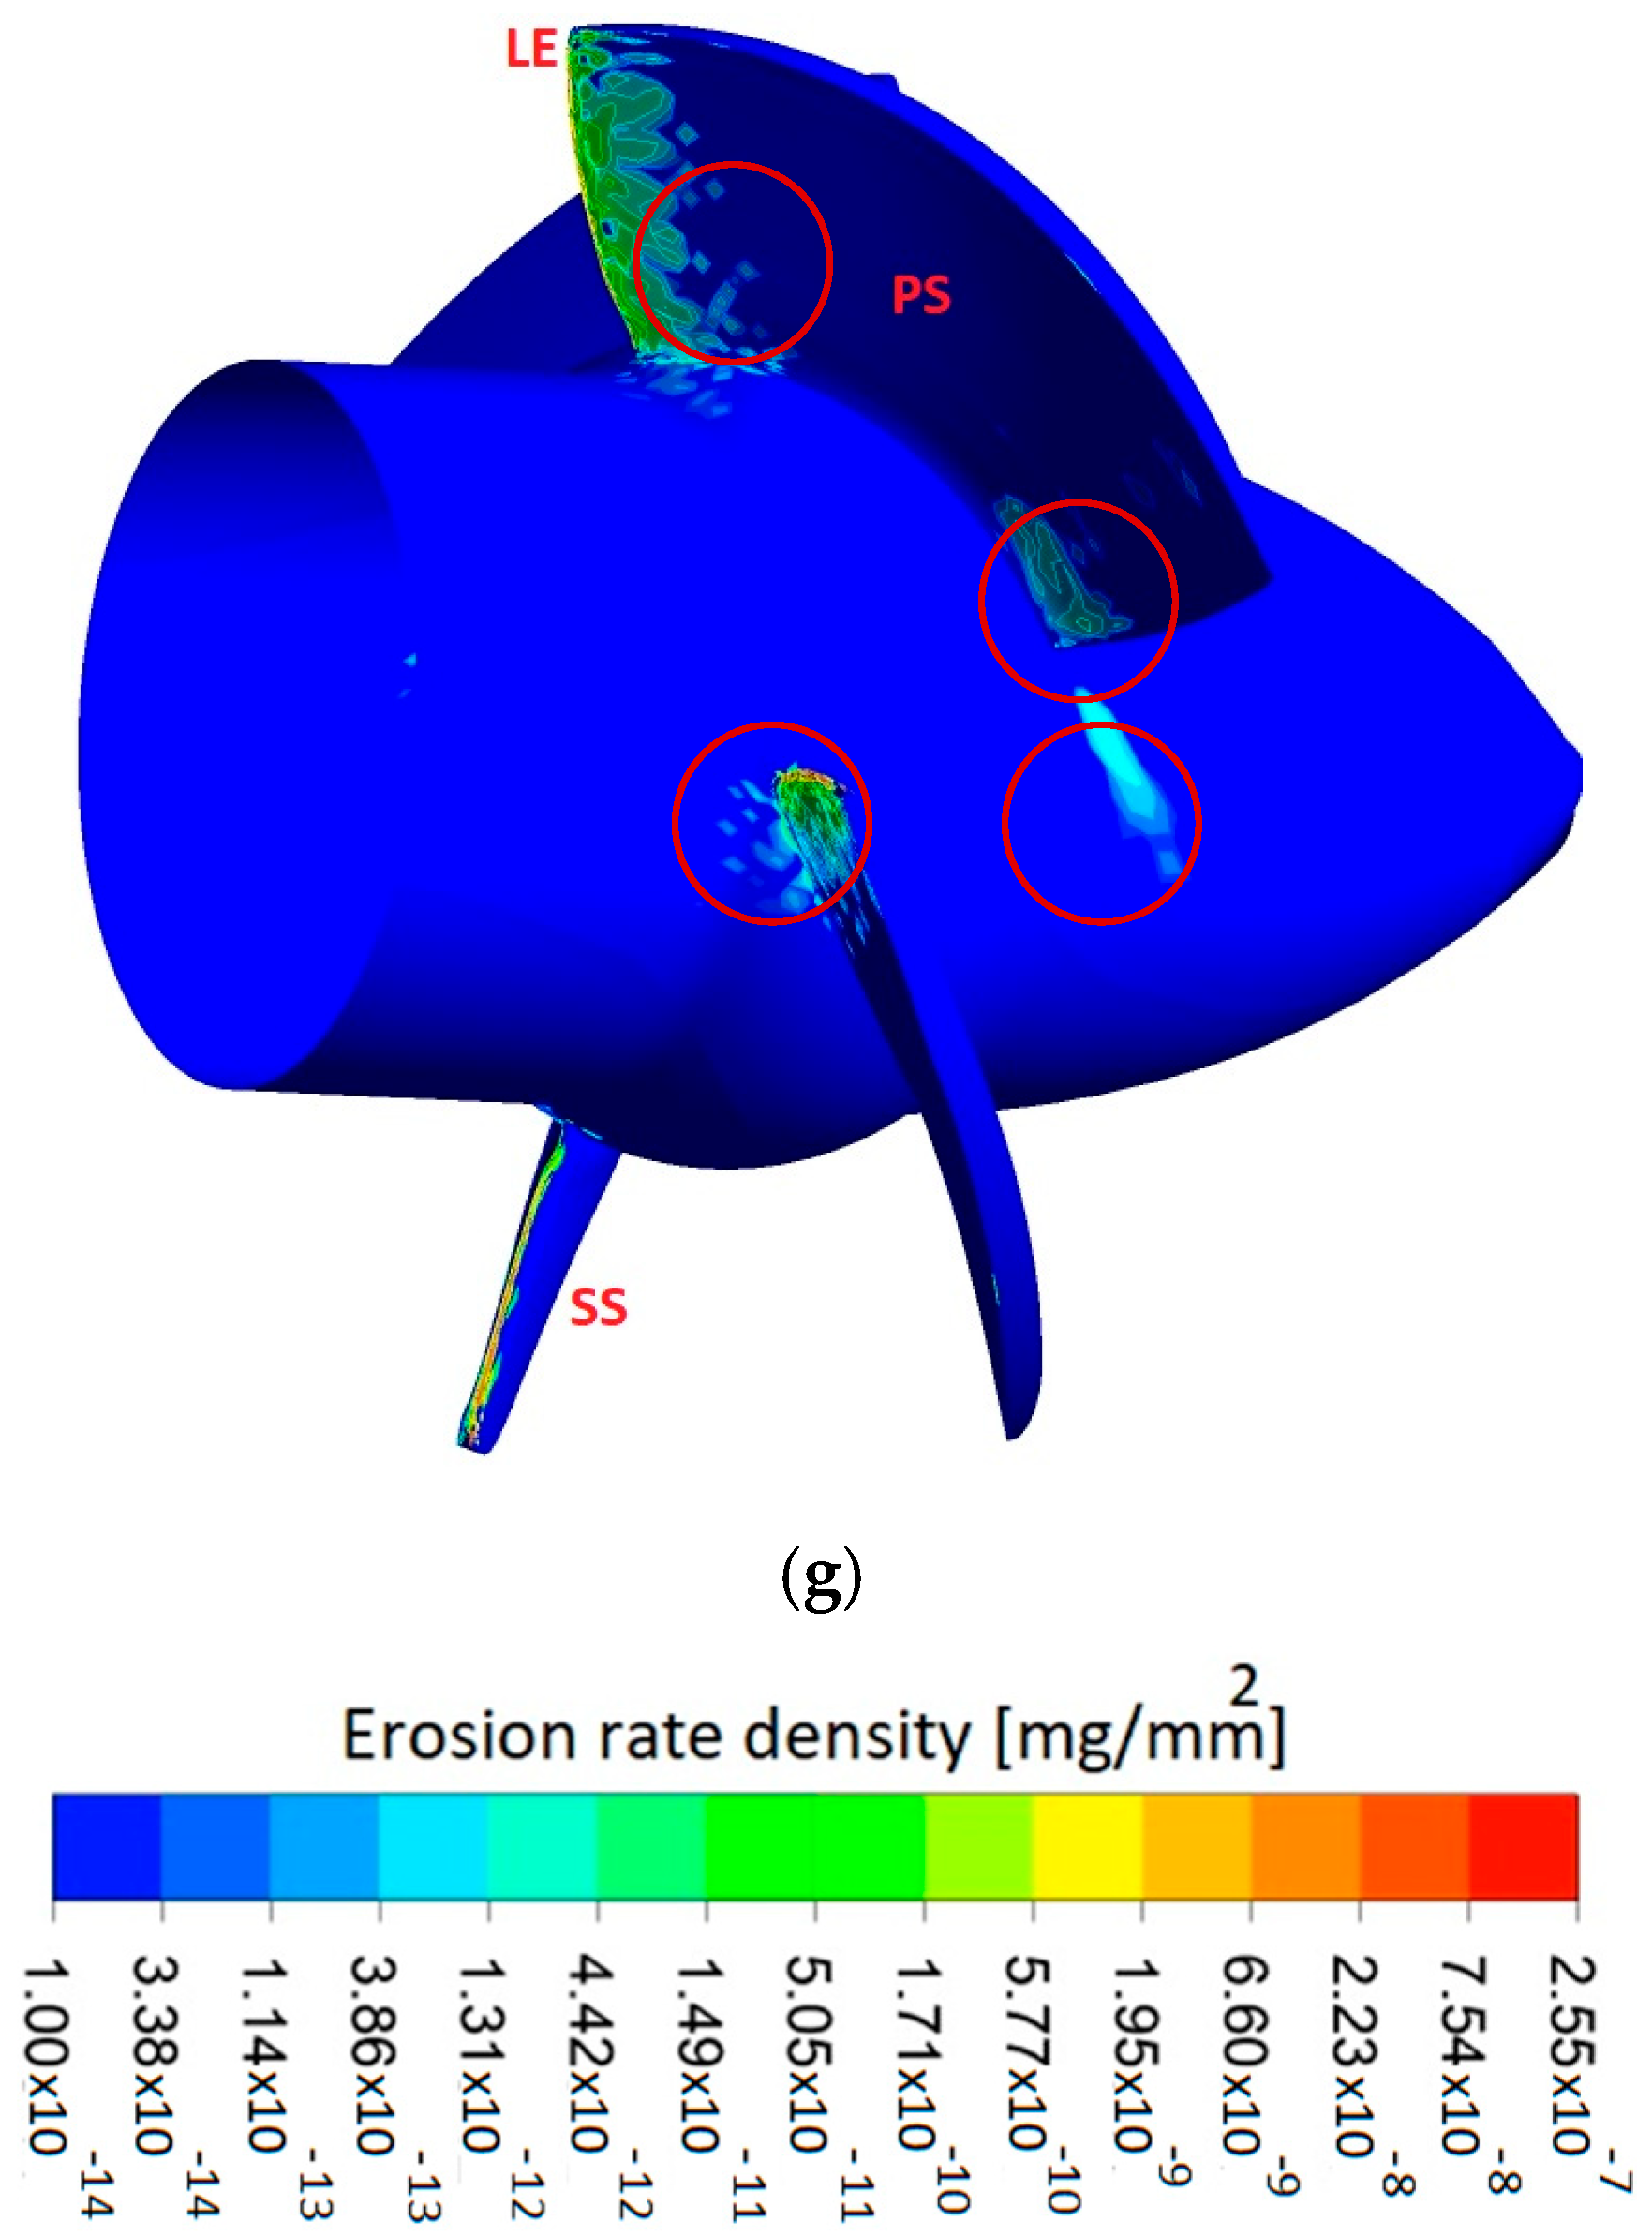
This section discusses the computation of particle trajectories and erosion to reveal different erosion patterns and their development on the surfaces of the vanes and blades. This was done for sediment type TDHP at concentrations ranging from 50 to 2500 mg/m3, while the Kaplan turbine operated at both the nominal point and maximum power. To better characterize the erosion patterns, intensity and development, local erosion rates (mg/g) served to determine the ERD in mg/s.mm2, distributed across the mesh element nodes. Additionally, the AERD in mg/s.mm2, serves as another metric to characterize the erosion wear. This is determined using local erosion rates, mass rate of impacting particles, and the surface of the component being assessed. Moreover, the EMPH indicates the total material removal from a component’s surface. These two parameters are reported for the surfaces of different components.
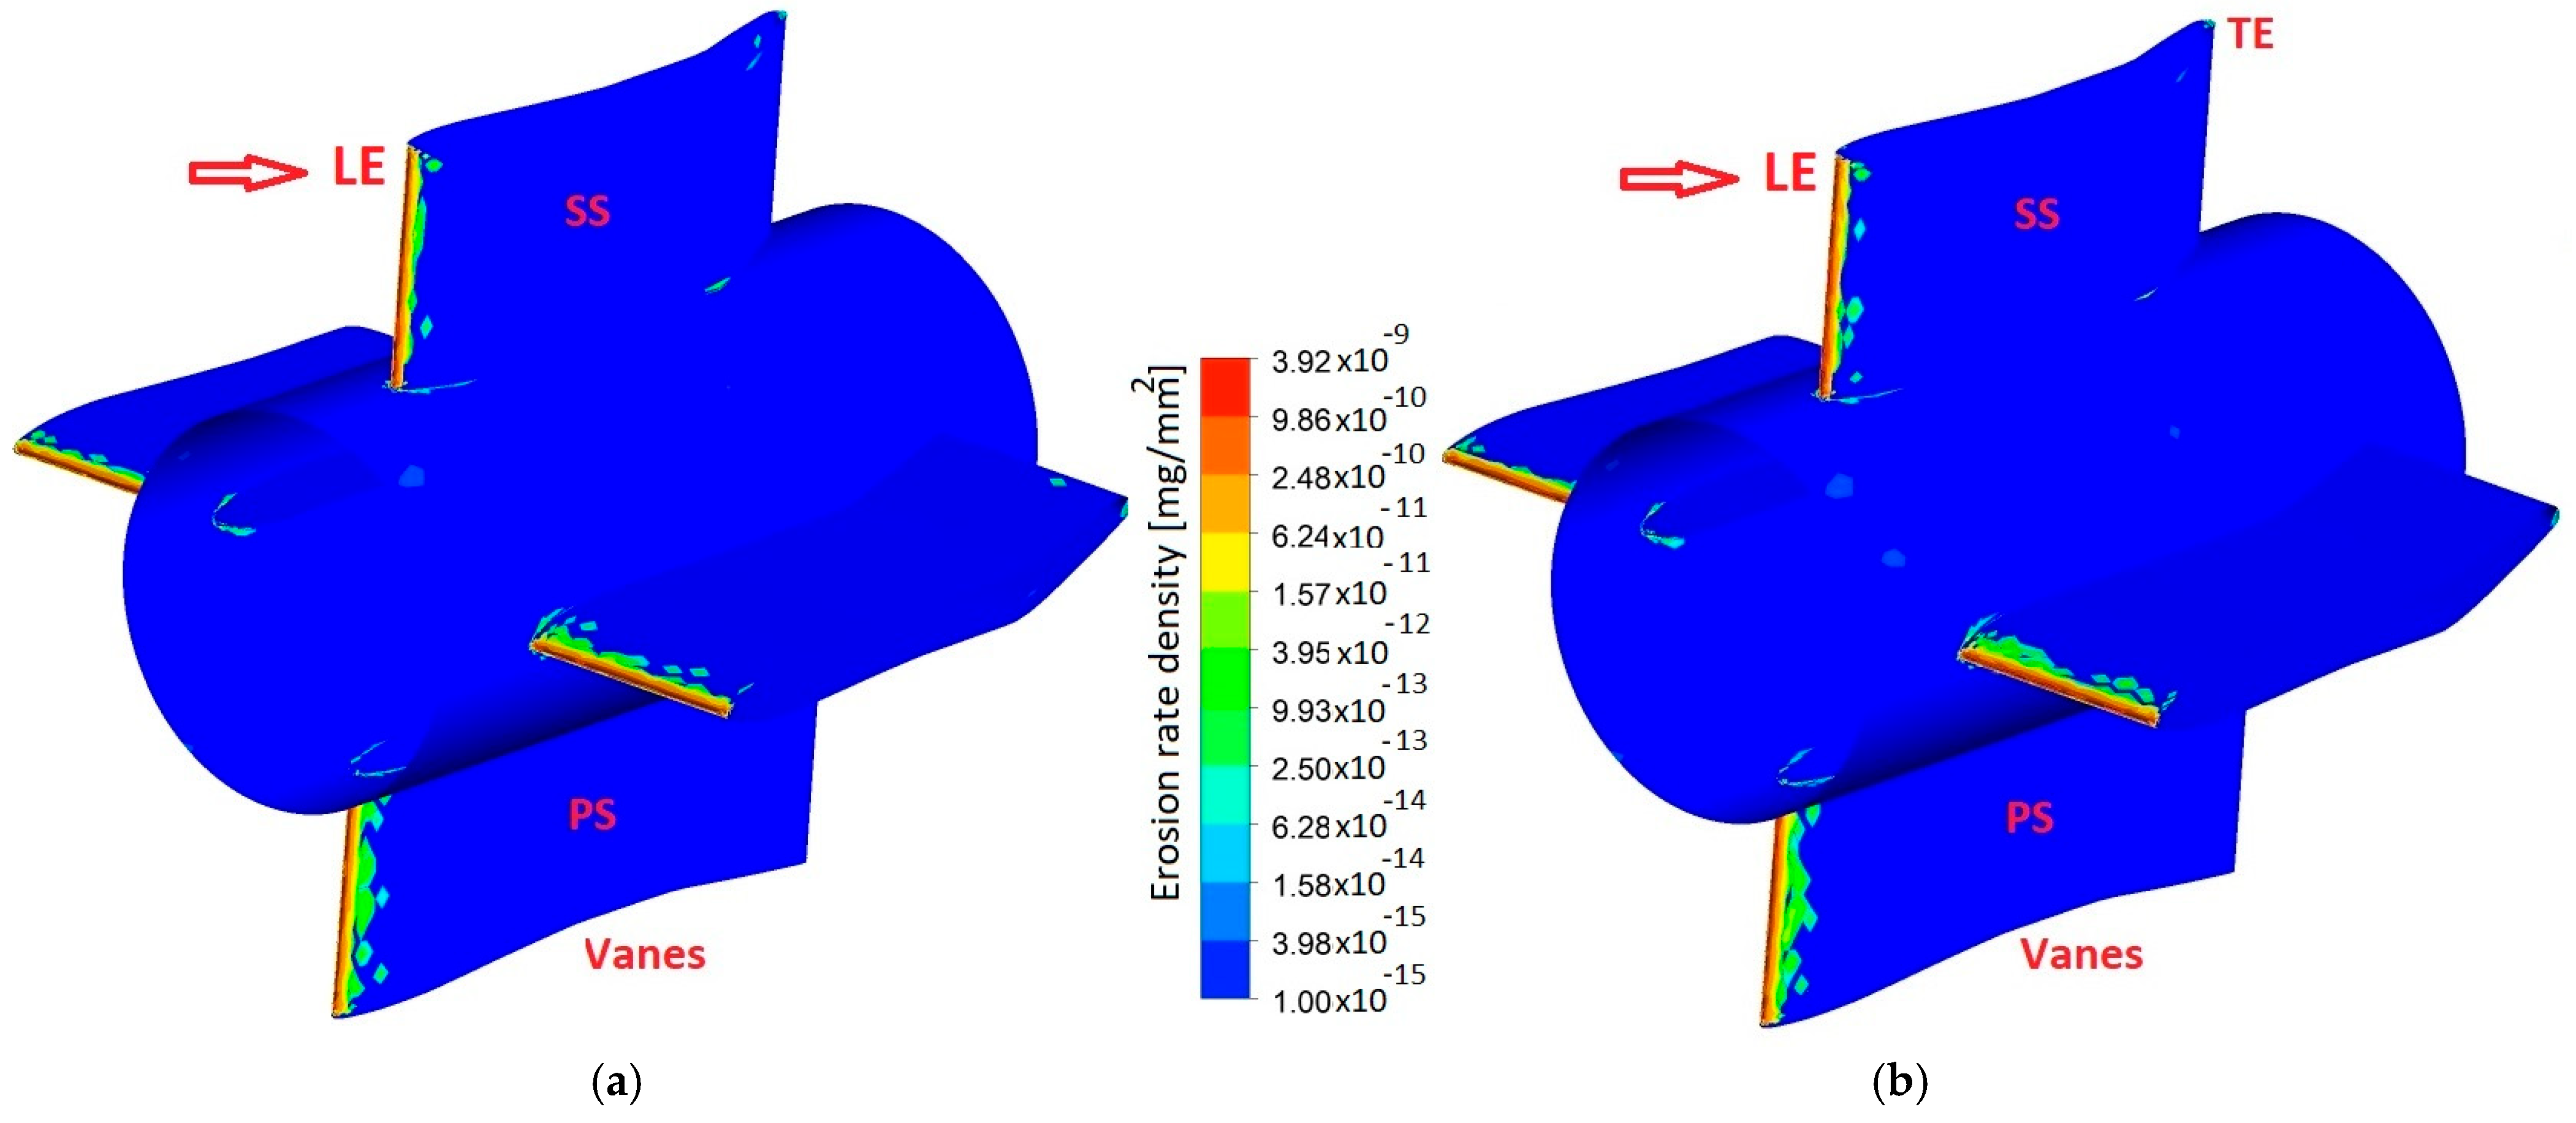
Figure 17, Figure 18 and Figure 19 illustrate the erosion patterns for the distributor vanes, rotor blades and the shroud, calculated at the highest concentration of 2500 mg/m3 and across two operating points, for clarity in the discussions. The same scale is adopted between the different operating conditions for an easy comparison. Overall, the rotor blades suffered more impacts at higher velocities than the vanes, leading to greater erosion rates on their surfaces. The number of impacts and resulting erosion patterns is uneven among the four vanes and four blades. Figure 17a,b present the erosion patterns on the distributor vanes and hub. The particles that arrive immediately at the distributor vanes initially strike the LE from hub to shroud, spreading from both sides, which constitutes a critical area for erosion damage, alongside the observed scatter patterns. The surfaces of the remaining vanes, as well as the hub and shroud, display insignificant erosion, with only a few traces near the TE due to particles being shifted from the surfaces by the flow. When comparing the two operating points, it is evident that the point of maximum power generated more erosion, in both the rates and scatter patterns. Here, the maximum local ERD reached 3.92 × 10⁻⁹ mg/s·mm2, which is higher than that of the nominal point equal to 2.87 × 10⁻⁹ mg/s·mm2.
Depending on their sizes and the deviations imposed by the vanes, particles enter the rotor and travel in various directions to the front of the blades. As illustrated in Figure 18, erosion develops along the LE of blades at both the PS and SS, resulting from direct exposure to a concentrated flux of particles arriving at steep angles. Erosion patterns are clearly displayed at the front part of the PS extending from LE and toward the TE of the blades. Erosion appearing at the TE near the hub corner is caused by larger particles arriving straight to the runner and also due to smaller particles entrained by the secondary flow at the hub corner. At the nominal point, extreme erosion is observed in Figure 18a, with an ERD equal to 5.16 × 10⁻⁷ mg/s.mm2 along the LE, extending to the front part of the PS. Many particles passing through the blades’ passages are more likely to impact the aft area of the PS, causing erosion at the hub corner, but with lesser intensity. The remaining portion of the PS was subjected to impacts at low angles, with some particles colliding at near-zero angles, leading to minor erosion. Figure 18a also shows erosion spreading in a narrow band over the blade SS, with signs of erosion at the front tip corner. The hub exhibits critical regions of erosion around the LE of the blades and areas extending from the TE. Operating at maximum power results in more significant erosion levels, as shown in Figure 18b. For instance, the ERD is 1.28 × 10⁻⁶ mg/s.mm2 compared to 5.16 × 10⁻⁷ mg/s.mm2 at the nominal point. Erosion is scattered less at maximum power due to the higher rotational speed and flow velocities, which reduced the area of impacts while intensifying local erosion rates. The junctions between the front of the blades and the hub, as well as those at the rear junctions, are severely eroded. In contrast, the remaining surfaces of the hub and bulb erode at slower rate.
As anticipated, the runner sustains higher erosion wear than other components of the Kaplan turbine. The AERD in the runner is 2.4206 × 10⁻¹⁰ mg/s.mm2, while in the distributor has a value of 5.6864 × 10⁻¹² mg/s.mm2.
Rai and Kumar [15] noted a small eroded region at the TE in a different configuration of a Kaplan turbine, although the primary erosion area at the front section of the blade PS was not identified. They have shown that the TE of the blade is most prone to erosion, whereas furrows of erosion are caused on the tip side. Sangal et al. [54] carried out simulations to investigate the effect of silt erosion on Kaplan turbines, and concluded that the tips of the blades and the regions around the TE are the most affected due to silt erosion. The present findings align well with the literature and the real cases of Kaplan turbine erosion.
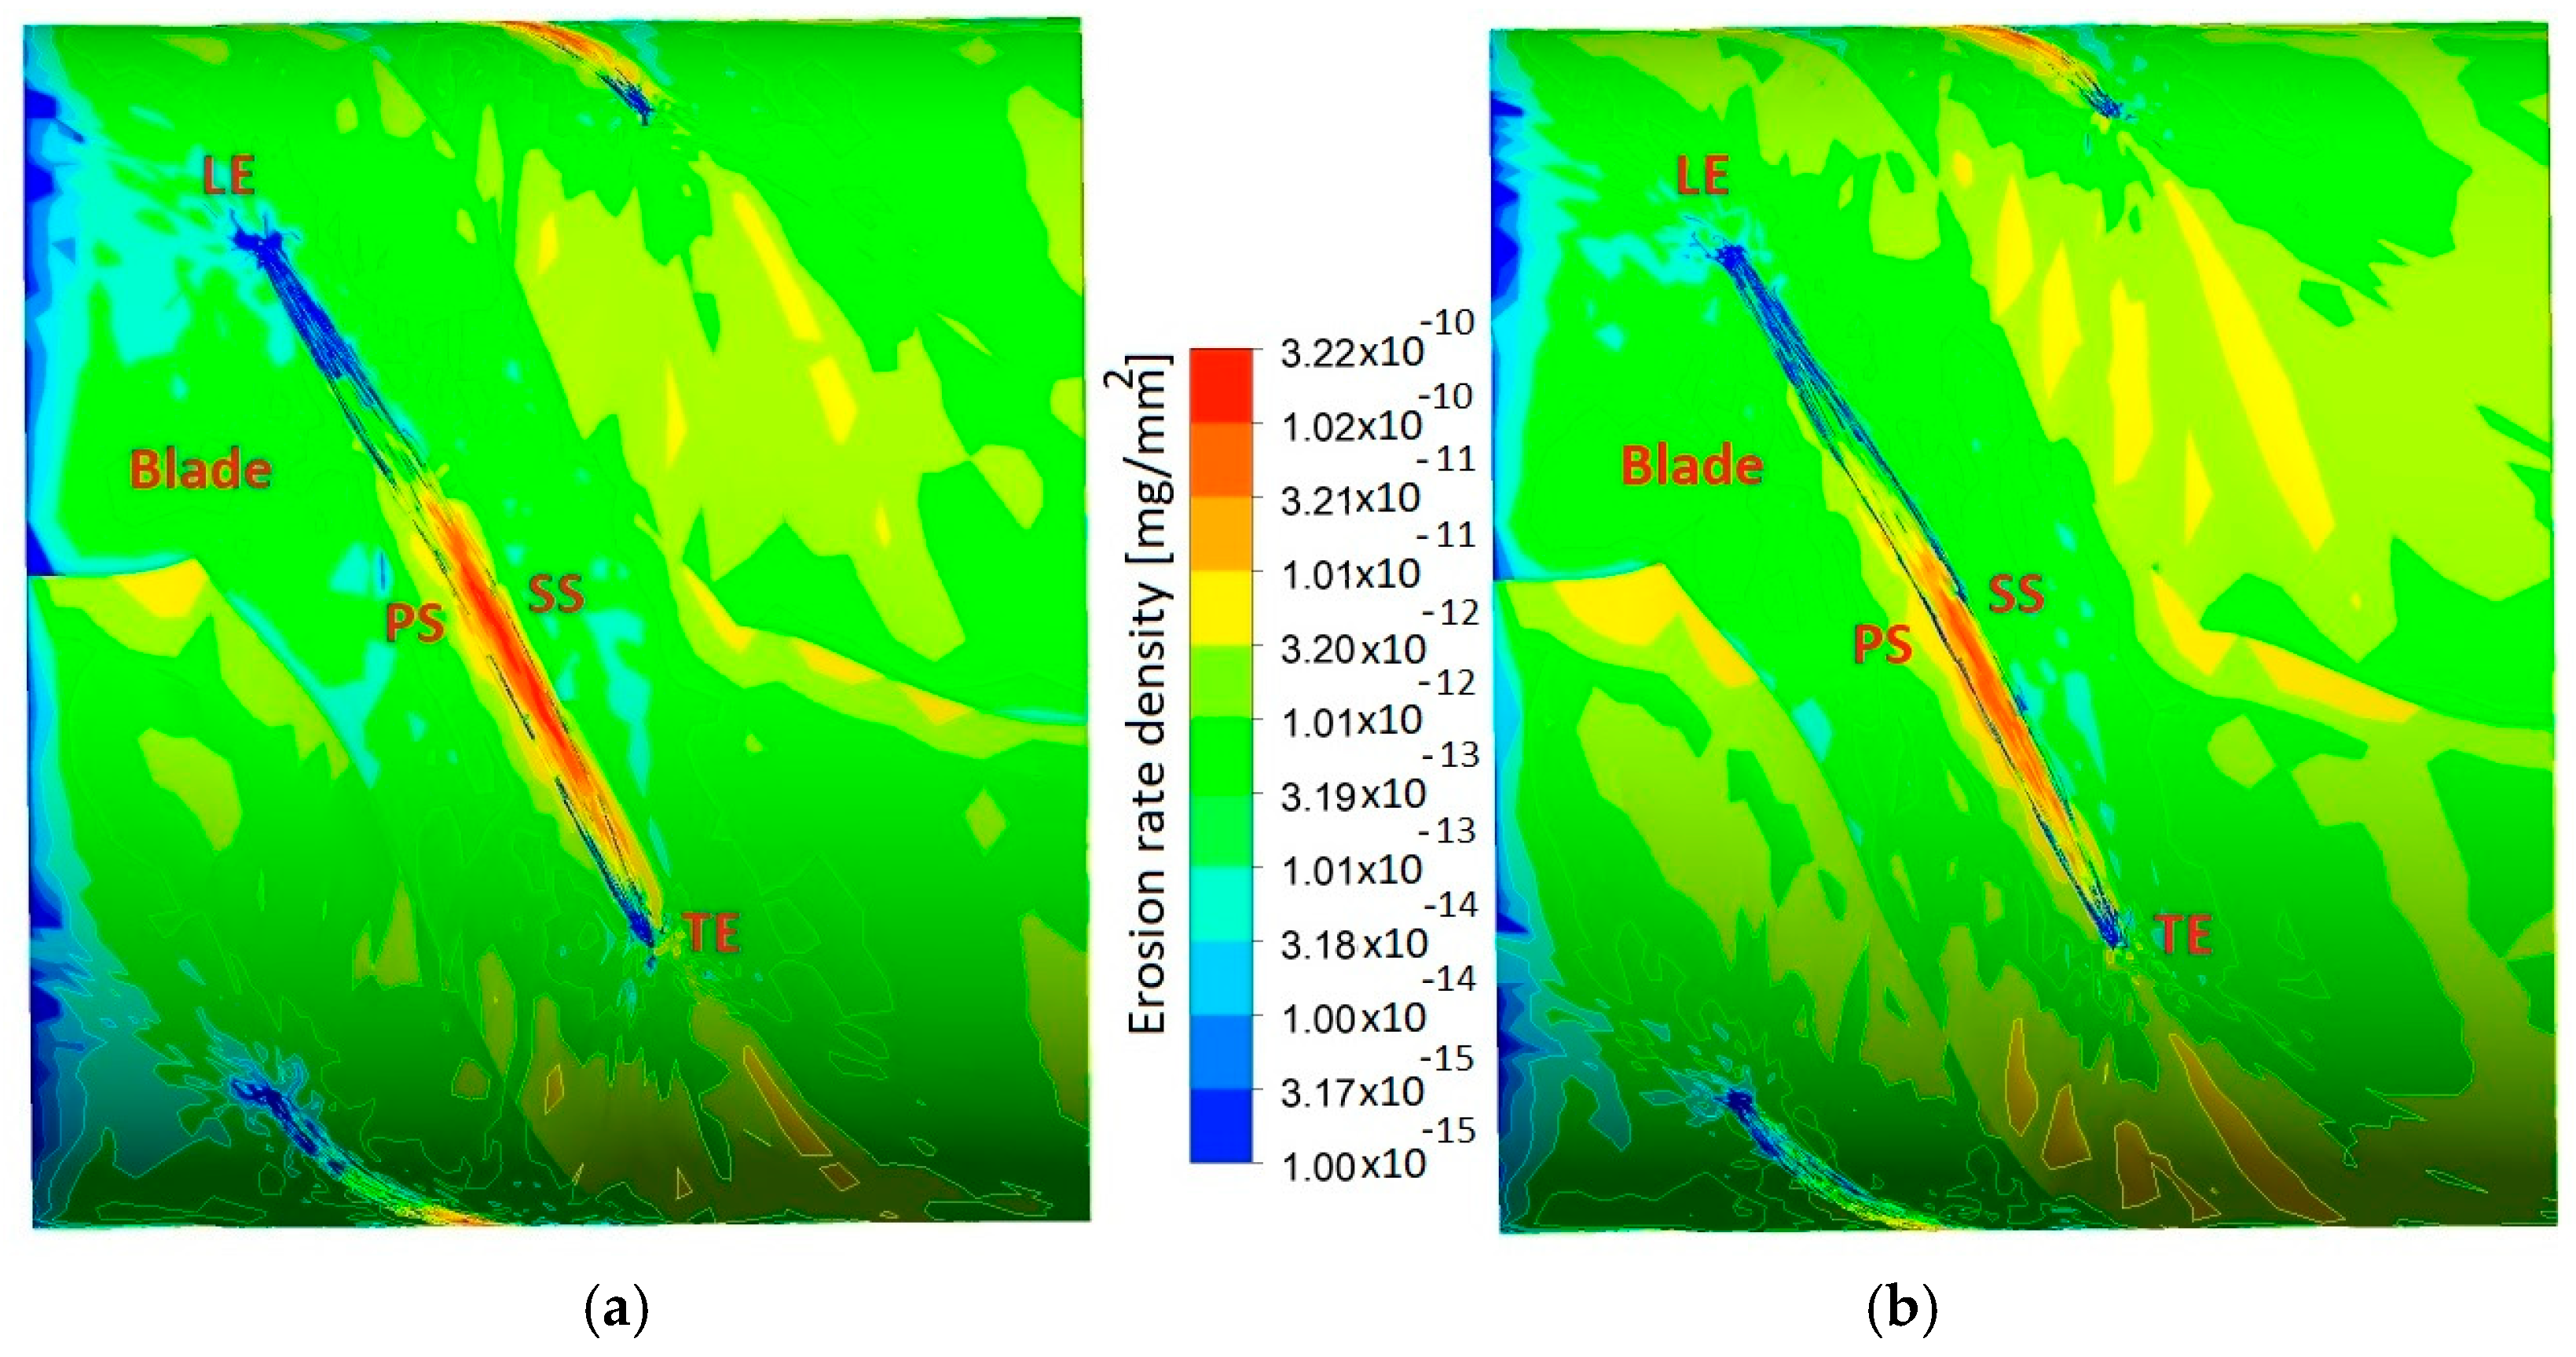
Figure 19 shows that the shroud is typically impacted and damaged by particles becoming centrifuged as they cross the runner. The erosion patterns visible around the blade tip result from the large number of particles entrained by the leakage flow through the relatively large tip gap. It is apparent that the rear two-thirds of the blade chord is more eroded than the front part, mainly due to the effects of leakage flow and the horseshoe vortices, which contribute to shroud erosion. The large spread of erosion facing the rotor channel is primarily attributed to the flow rotation and centrifugation, which cause particles to spin and spread their impacts on the shroud as they cross the blade channel. The two operating points exhibit practically similar patterns of erosion, as revealed in Figure 19a,b, but the levels differ. At the nominal operating point, the rotor exhibits a maximum ERD of 3.22 × 10⁻¹⁰ mg/s·mm2, but has an AERD value equal to 1.3566 × 10⁻¹² mg/s.mm2, which is lower than that at the maximum power, which is 1.4795 × 10⁻¹² mg/s.mm2.
The draft tube revealed helically shaped erosion patterns due to impacts at low velocities and angles resulting from circling motion of particles. The frequency of impacts appeared to decrease at maximum compared to the nominal point, as the axial component is higher than the swirling component. Consequently, the AERD is found equal to 7.7867 × 10⁻¹⁵ mg/s.mm2 compared to the value of 1.0250 × 10⁻¹⁵ mg/s.mm2 obtained at the nominal point.
Table 3 and Table 4 summarize the erosion parameters calculated when the turbine operates at the nominal point and maximum power, and at the range of sand concentration. It is evident that as the concentration increases, so does the EMPH. This is attributed to a higher number of particles, resulting in more frequent collisions, which increases the ERD and accelerates material removal from the surfaces of the vanes and blades. When examining the EMPH at the highest sediment concentration of 2500 mg/m3, it is clear that the runner experiences greater erosion than the distributor vanes. Specifically, with TDHP sediment at this high concentration, the runner blades is characterized by AERD values of 1.2008 × 10⁻¹⁰ mg/s·mm2 and 2.4206 × 10⁻¹⁰ mg/s·mm2, at the nominal point and maximum power point, respectively. In contrast, the distributor vanes show AERD values of 3.8148 × 10⁻¹² mg/s·mm2 and 5.6864 × 10⁻¹² mg/s·mm2. Consequently, the EMPH values for the runner are 4.6784 × 10⁻³ mg/h and 9.4229 × 10⁻³ mg/hr, at the nominal point and maximum power point, respectively. These values are significantly higher than those for the distributor vanes, which are 2.4953 × 10⁻⁴ mg/h and 3.7205 × 10⁻⁴ mg/hr.
According to Table 3 and Table 4, it is evident that the runner’s shroud is the next eroded component. At the nominal point and maximum power point, the shroud’s AERD values are equal to 1.3566 × 10⁻¹² mg/s·mm2 and 1.4795 × 10⁻¹² mg/s·mm2, respectively. In contrast, the erosion rates of the distributor’s shroud are significantly lower, at 7.6279 × 10⁻¹⁵ mg/s.mm2 and 10.9766 × 10⁻¹⁵ mg/s·mm2, respectively. Furthermore, the EMPH for the runner’s shroud is calculated to be 1.85734 × 10⁻⁴ mg/h at the nominal point and 2.0256 × 10⁻⁴ mg/h at the maximum power point, both of which are considerably higher than the distributor’s shroud values of 9.5288 × 10⁻⁷ mg/h and 13.7120 × 10⁻⁷ mg/hr. Comparing the data in Table 3 and Table 4 further reveals that the runner’s hub and bulb have lower EMPH values, recorded at 5.2223 × 10⁻⁶ mg/h and 4.0509 × 10⁻⁶ mg/hr, at the nominal point and maximum power, respectively. It appears that the hub experiences less erosion at maximum power due to particle deflection upwards from centrifugal forces, reducing the frequency of encounters with the runner’s hub and bulb.
Although the draft tube is longer, it exhibits the lowest erosion rates. The AERD values are 7.7867 × 10⁻¹⁵ mg/s·mm2 at the nominal point and 1.0250 × 10⁻¹⁵ mg/s·mm2 at maximum power. Correspondingly, the EMPH values are 2.1554 × 10⁻⁶ mg/h at the nominal point and 2.8372 × 10⁻⁷ mg/h at the maximum power. It seems that the nominal point where the swirling flow has more effect than the flow axiality, which caused higher erosion caused by frequent low-angle impacts. In contrast, the maximum power point is characterized by higher flow axiality, which reduced frequency of impacts over the outer wall, resulting in lower erosion rates.
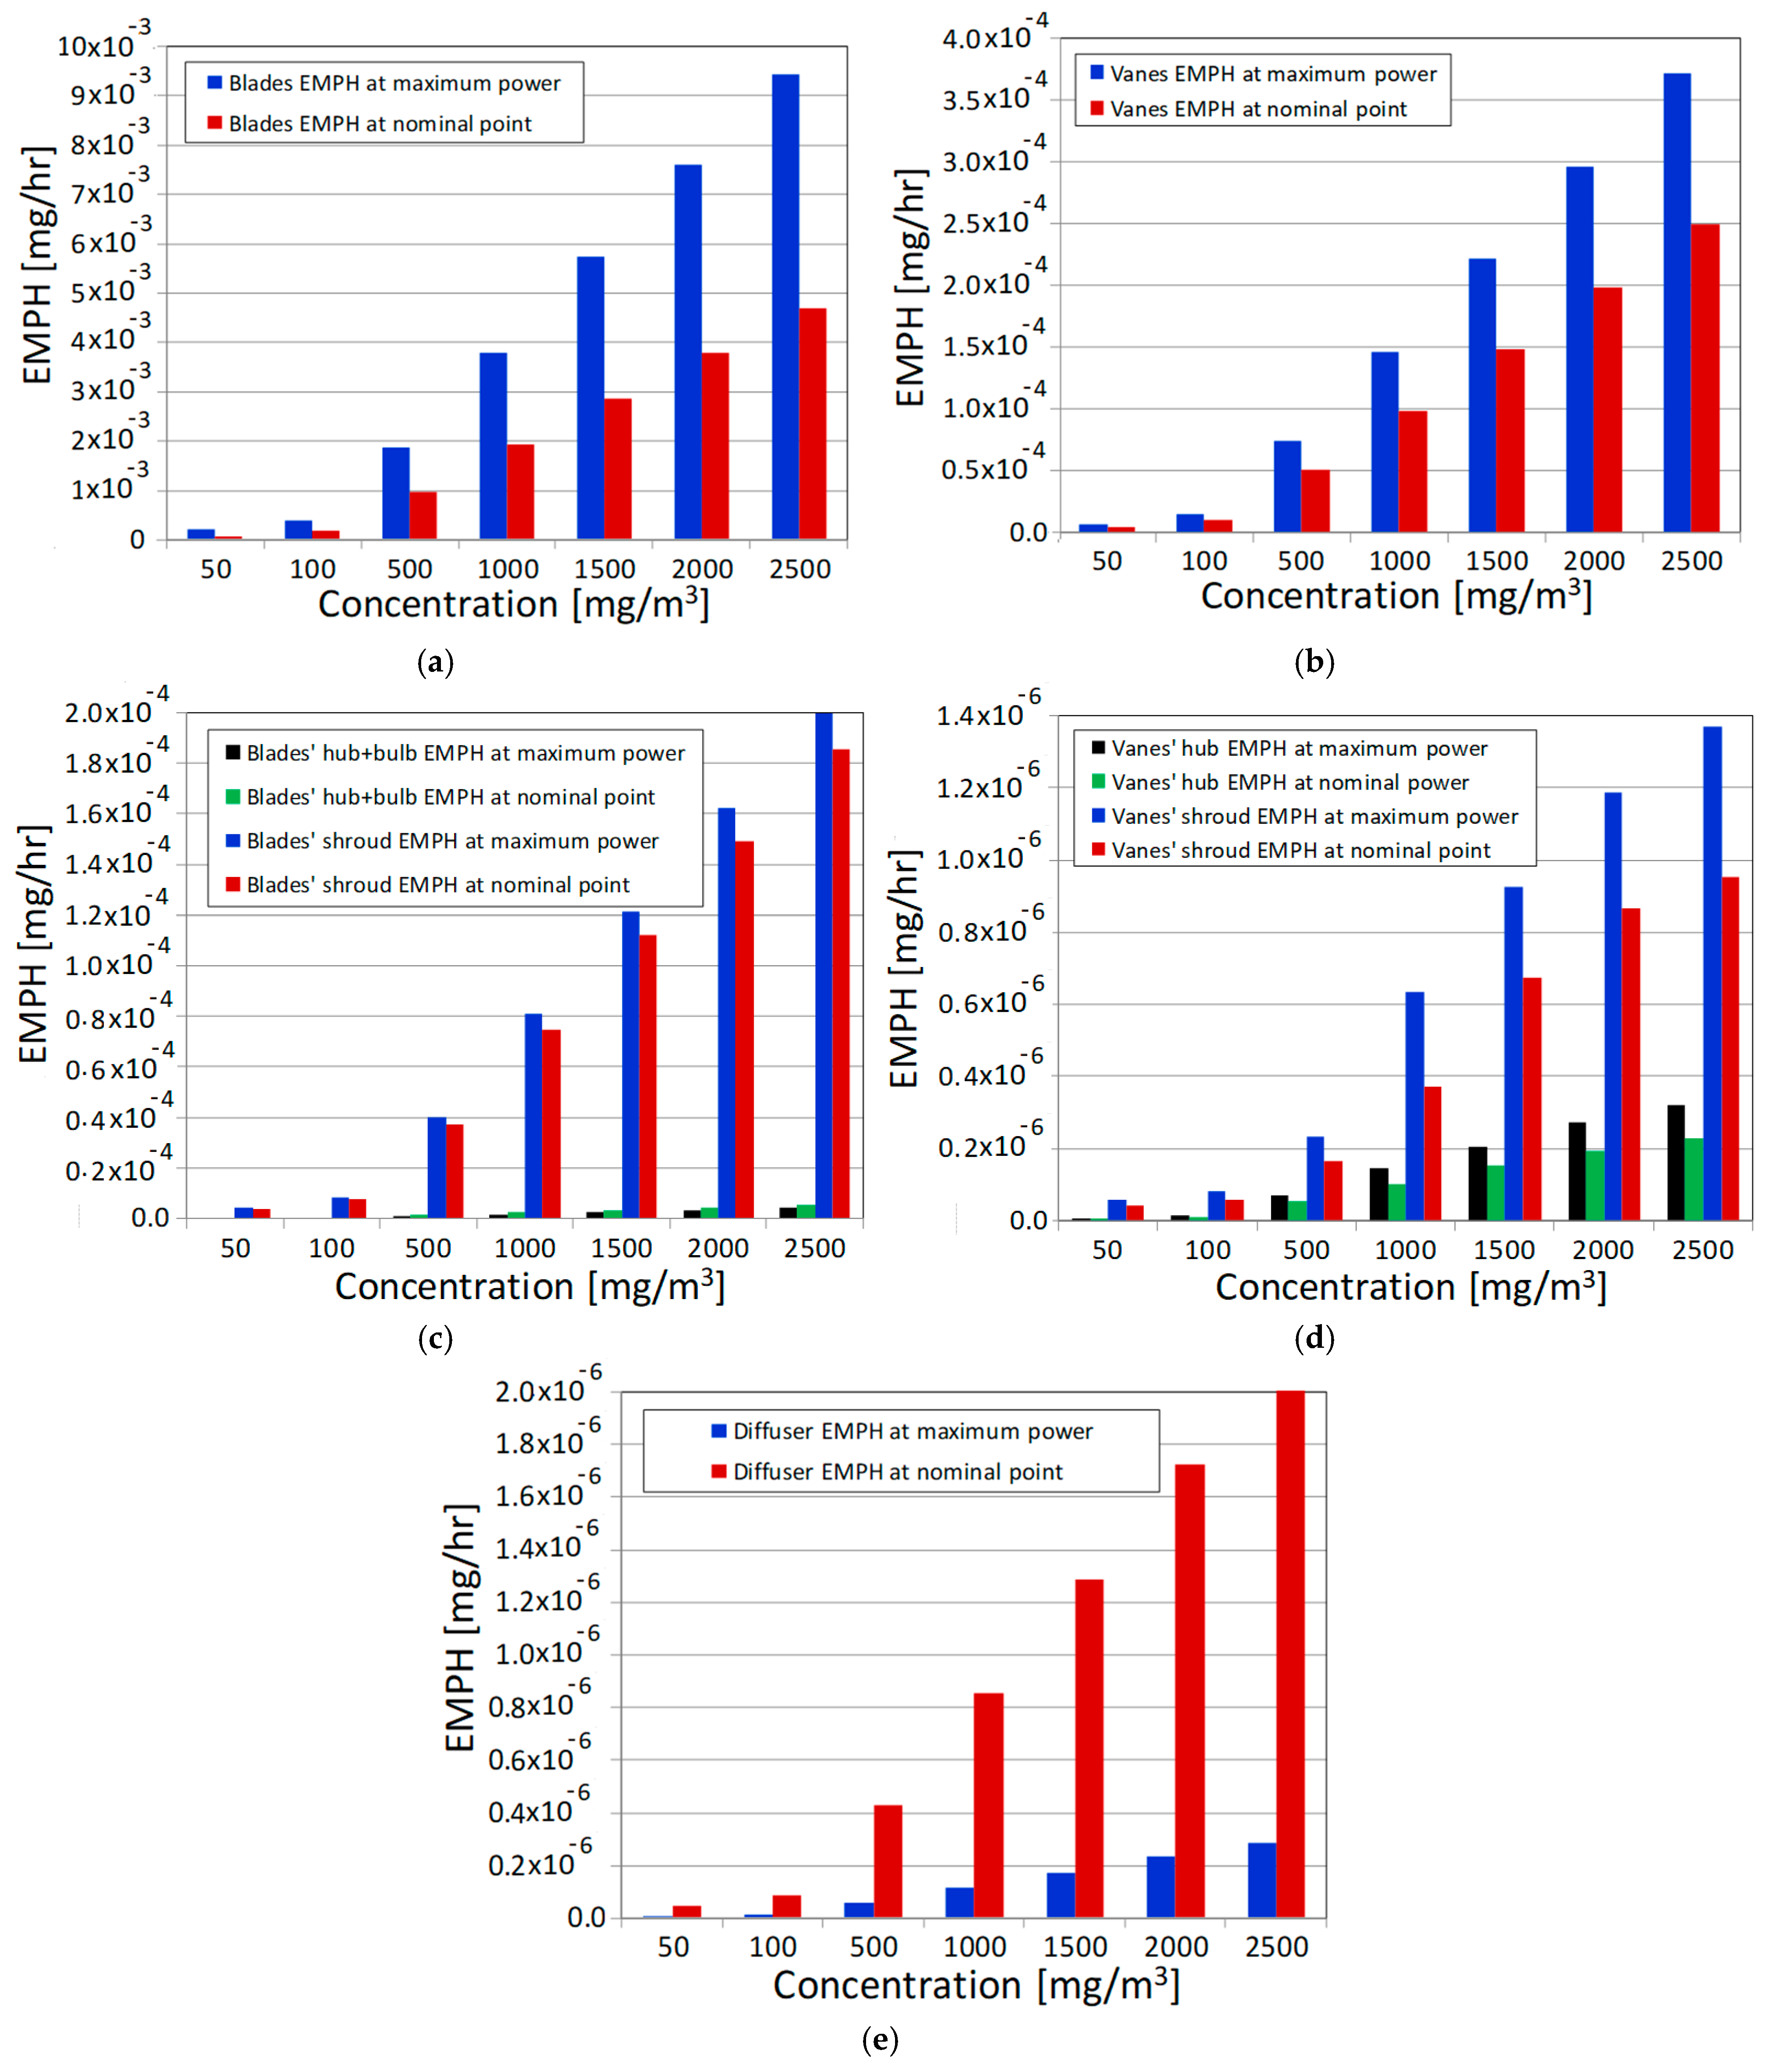
Figure 20 presents histograms comparing the erosion of the surface components of the Kaplan turbine given in terms of EMPH. As clearly shown in Figure 20a, the Runner blades exhibit the most erosion. At the maximum power, EMPH is about 1.5 times that at the nominal point. On the side, the vanes show (Figure 20b) less erosion concentrated mainly at the LE. The eroded mass is practically 1/25 that of the runner, and EMPH at maximum power is more than double that at the nominal point. The runner’s shroud exhibits the third surface of highest erosion in terms of EMPH, and the values at maximum power and nominal point are practically equal, while the hub and bulb exhibit extremely lower erosion compared to the shroud. Also, the vanes’ shroud is more eroded than the hub, and at the maximum power EMPH of the shroud is about 1.4 times that at the nominal point.
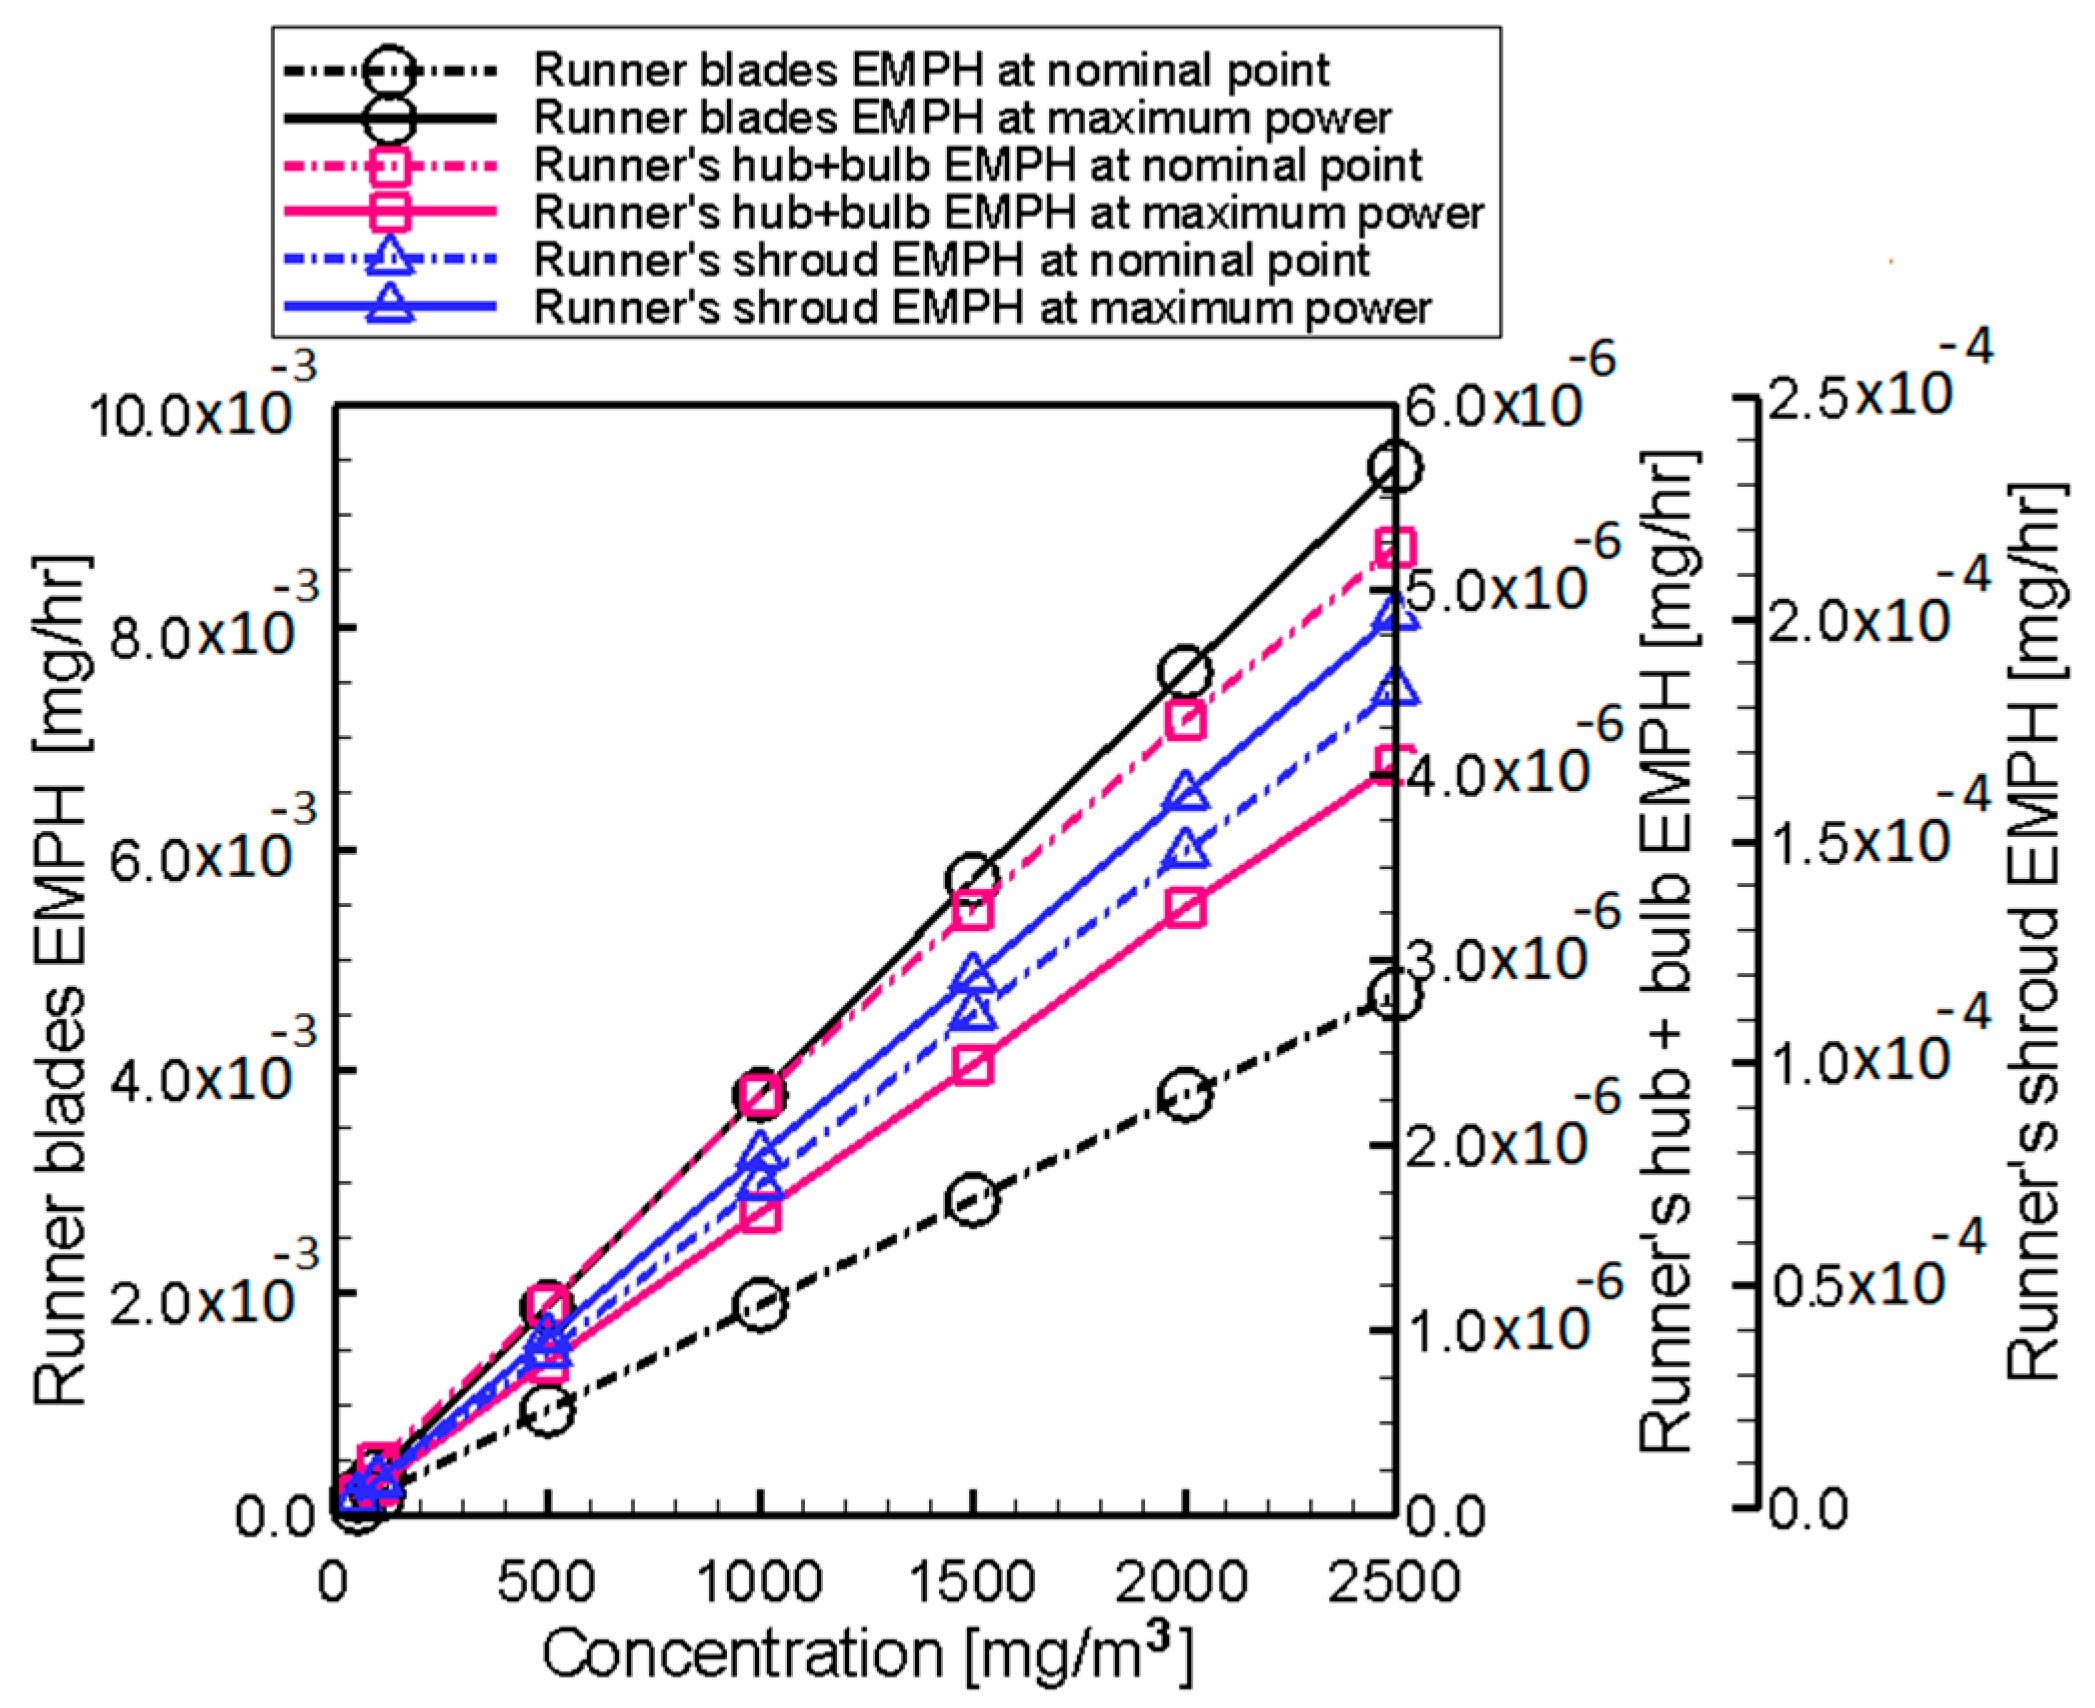
Figure 21 and Figure 22 illustrate the variation in EMPH on the surfaces of the Kaplan turbine components, specifically the distributor vanes and the runner. The results show a clear increase in erosion with higher sediment concentration. Figure 21 confirms these findings, indicating that erosion damage is most pronounced on the blades, followed by the vanes and the draft tube. The blades (Figure 21) show significant erosion, with an EMPH value of 9.4269 × 10⁻³ mg/h at maximum power, nearly double the EMPH of 4.6784 × 10⁻³ mg/h at the nominal point. At maximum power, the vanes (Figure 22) experienced erosion with an EMPH value of 3.7205 × 10⁻⁴ mg/hr, which is approximately 1.5 times greater than the EMPH at the nominal point of 2.4953 × 10⁻⁴ mg/hr. The runner’s shroud comes next, with an EMPH of 2.0256 × 10⁻⁴ mg/h at maximum power, which is 1.1 times higher than the nominal point value of 1.8573 × 10⁻⁴ mg/hr. It is noted that the EMPH values for the hub and shroud displayed irregular trends, as the frequency of impacts and erosion depend on specific flow details near these surfaces. This variability is further influenced by the randomness in particle sizes and release positions. Lastly, the draft tube presents an EMPH of 2.1554 × 10⁻⁶ mg/h at the nominal point, which is higher than the EMPH of 2.8372 × 10⁻⁷ mg/h observed at maximum power, as explained previously.
The anticipated AERD in this small Kaplan turbine is below the values found in other types of turbomachinery components owing to its smaller dimensions and lower flow velocities across the components.
It can be concluded that the areas of this Kaplan turbine model most susceptible to erosion are the LE of the blades, which extend over the front part of the PS and to the rear of blade from the hub corner. Additionally, the vanes show erosion along the LE. The present findings align with the two real cases shown in Figure 23. In the early years of operation, the blades of the Kaplan turbine from the Chilla hydropower plant (India) [15], of a capacity of 36 MW, under the head of 32.5 m and rotational speed of 187.5 rpm, were found to be extremely eroded on the rear part of PS after a few monsoon seasons. Figure 23a illustrates actual erosion patterns in this Kaplan turbine, depicting severe erosion on the runner blades. Figure 23b shows another case of erosion related to the Kaplan turbine blade of Bhudkalan HPP [55]. It depicts extreme erosion over large areas at both the LE and the front part of the PS, as well as a large area from the TE.
The projected erosion patterns for the vanes and blades, particularly over the PS from the entry to the TE, display trends similar to those observed in these two real cases. Despite differences in the runner dimensions, operating flow conditions, Reynolds number, speed of rotation, and the subsequent centrifugal and Coriolis forces, the models being compared exhibit qualitative consistency.

7. Conclusions

Simulations of particle trajectories and erosion in this small Kaplan turbine provided a comprehensive understanding of erosion damage at two operating points across a wide range of sediment concentrations. The rotor blades exhibited significant erosion patterns due to the cumulative effects of high-frequency impacts, especially when compared to the distributor vanes and draft tube.
Notably, erosion was concentrated at the LE of the blades, with notable wear extending to the front of the PS and a limited area near the hub corner from the TE. The LE of the blades is particularly vulnerable as it directly interacts with incoming particles, leading to severe erosion that compromises the overall integrity of the turbine. The runner’s shroud displays lower erosion rates than the blades; however, erosion spreads across its entire surface, particularly intense when facing the blades’ tips. In contrast, the hub depicts erosion concentrated at the blade and hub junction, while the bulb displays traces of insignificant erosion. The draft tube, on the other hand, reveals helically shaped erosion patterns resulting from impacts at low velocities and angles by particles of circling motion. Erosion, in terms of EMPH, increases markedly with sediment concentrations. The blades recorded an EMPH of 4.6784 × 10⁻³ mg/h at the nominal point and 9.4269 × 10⁻³ mg/h at maximum power, respectively, indicating nearly double the erosion wear at the maximum power.
As expected, this small Kaplan turbine is characterized by low flow velocities and impact velocities, and subsequently, ERD have values extremely lower compared to larger turbomachinery units of higher flow capacity and peripheral speed.
By analyzing factors such as sediment type and size, concentration, flow coefficient, rotor peripheral speed, and blade setting angle, a general correlation can be established to evaluate erosion damage.
The results obtained from these simulations enable the monitoring of critical sections that are prone to premature erosion. This valuable information may assist in evaluating the extent of damage sustained by the turbine’s vanes and blades, as well as in selecting appropriate coatings to enhance the longevity and overall efficiency of the Kaplan turbine in operation.

Funding

This research received no external funding.

Institutional Review Board Statement

Not applicable.

Informed Consent Statement

Not applicable.

Data Availability Statement

Data is contained within the article.

Conflicts of Interest

The author declared no potential conflicts of interest with respect to the research, authorship, and/or publication of this article.

Nomenclature

A area (m2)
AERDaverage erosion rate density (mg/s·mm2)
cchord (m)
C D drag coefficient
  C S L shear lift force coefficient
ddiameter of particle (m)
Ddiameter of runner (m)
EMPHeroded mass per hour (mg/hr)
ERDerosion rate density (mg/s·mm2)
Fforce (N)
fforce reduced by mass (N/kg)
ggravity (m/s2)
HWater head (m)
kturbulent kinetic energy (m2/s2)
k1, k2, k3material constants
mmass (kg)
n normal vector
ppressure (Pa)
Ppower (W)
QVolume flow rate (m3/s) or (l/s)
rradius, radial co-ordinate (m)
ReReynolds number
StkStokes number
t time (s)
t tangential vector
T torque (n·m)
V velocity (m/s)
Greek Symbols
βimpact angle (deg)
ϵ local erosion rate (mg/g)
ηefficiency
ρdensity (kg/m3)
μdynamic viscosity (kg/m·s)
νKinematic viscosity(m2/s)
Ω blade speed of rotation (rad/s)
ω f fluid rotation (1/s)
Subscripts
ffluid
pparticle
rradial
θtangential component
zaxial direction
1, 2impact/rebound
Abbreviation
LEleading edge
PSpressure side
SSsuction side
TEtrailing edge

References

  1. Rai, A.K.; Kumar, A.; Staubli, T. Effect of concentration and size of sediments on hydro-abrasive erosion of Pelton turbine, Renew. Energy 2020, 145, 893–902. [Google Scholar]
  2. Felix, D.; Albayrak, I.; Abgottspon, A.; Boes, R.M. Hydro-abrasive erosion of hydraulic turbines caused by sediment—A century of research and development. IOP Conf. Ser. Earth Environ. Sci. 2016, 49, 122001. [Google Scholar] [CrossRef]
  3. Pradhan, P.M.S.; Dahlhaug, O.G.; Joshi, P.N.; Støl, H. Sediment and Efficiency Measurements at Jhimruk Hydropower Plant—Monsoon 2003; Hydro Lab: Kathmandu, Nepal, 2004. [Google Scholar]
  4. Noon, A.A.; Kim, M.H. Erosion wear on Francis turbine components due to sediment flow. Wear 2017, 378–379, 126–135. [Google Scholar] [CrossRef]
  5. Singh, M.; Banerjee, J.; Patel, P.L.; Tiwari, H. Effect of silt erosion on francis turbine: A case study of Maneri Bhalistage-II, Uttarakhand, India. ISH J. Hydraul. Eng. 2013, 19, 1–10. [Google Scholar] [CrossRef]
  6. Eltvik, M.; Dahlhaug, O.G.; Neopane, H.P. Prediction of sediment erosion in Francis turbines. In Proceedings of the 4th International Meeting on Cavitation and Dynamic Problems in Hydraulic Machinery and Systems, Belgrade, Serbia, 26–28 October 2011. [Google Scholar]
  7. Koirala, R.; Thapa, B.; Neopane, H.P.; Zhu, B.; Chhetry, B. Sediment erosion in guide vanes of Francis turbine: A case study of Kaligandaki Hydropower Plant, Nepal. Wear 2016, 362–363, 53–60. [Google Scholar] [CrossRef]
  8. Truscott, G.F. Literature survey of abrasive wear in hydraulic machinery. Wear 1972, 20, 29–50. [Google Scholar] [CrossRef]
  9. Brekke, H. Design of hydraulic machinery working in sand laden water. In Abrasive Erosion and Corrosion of Hydraulic Machinery; Duan, C.G., Karelin, V.Y., Eds.; Imperial College Press: London, UK, 2002; pp. 155–181. [Google Scholar]
  10. Padhy, M.K.; Saini, R.P. A review on silt erosion in hydro turbines. Renew. Sustain. Energy Rev. 2008, 12, 1974–1987. [Google Scholar] [CrossRef]
  11. Padhy, M.K.; Saini, R.P. Study of silt erosion on performance of a Pelton turbine. Energy 2011, 36, 141–147. [Google Scholar] [CrossRef]
  12. Padhy, M.K.; Saini, R.P. Study of silt erosion mechanism in Pelton turbine buckets. Energy 2012, 39, 286–293. [Google Scholar] [CrossRef]
  13. Thapa, B.S.; Dahlhaug, O.G.; Thapa, B. Sediment erosion in hydro turbines and its effect on the flow around guide vanes of Francis Turbine. Renew. Sustain. Energy Rev. 2015, 49, 1100–1113. [Google Scholar] [CrossRef]
  14. Thapa, B.S.; Dahlhaug, O.G.; Thapa, B. Effects of sediment erosion in guide vanesof Francis turbine. Wear 2017, 390–391, 104–112. [Google Scholar] [CrossRef]
  15. Rai, A.K.; Kumar, A. Analyzing hydro abrasive erosion in Kaplan turbine: A Case Study from India. J. Hydrodyn. 2016, 28, 863–872. [Google Scholar] [CrossRef]
  16. Thapa, B.S.; Thapa, B.; Dahlhaug, O.G. Empirical modelling of sediment erosion in Francis turbines. Energy 2012, 41, 386–391. [Google Scholar] [CrossRef]
  17. Dinesh, K.; Bhingole, P.P. CFD based analysis of combined effect of cavitation and silt erosion on Kaplan turbine. Mater. Today Proc. 2015, 2, 2314–2322. [Google Scholar] [CrossRef]
  18. Leguizamón, S.; Jahanbakhsh, E.; Alimirzazadeh, S.; Maertens, A.; Avellan, F. Multiscale simulation of the hydroabrasive erosion of a Pelton bucket: Bridging scales to improve the accuracy. Int. J. Turbomach. Propuls. Power 2019, 4, 9. [Google Scholar] [CrossRef]
  19. Shen, Z.; Chu, W.; Li, X.; Dong, W. Sediment erosion in the impeller of a double-suction centrifugal pump—A case study of the Jingtai Yellow River Irrigation Project, China. Wear 2019, 422–423, 269–279. [Google Scholar] [CrossRef]
  20. Ghenaiet, A. Computation of erosion in a hydro turbine. Eng. Comput. 2022, 39, 1317–1347. [Google Scholar] [CrossRef]
  21. Bajracharya, T.R.; Acharya, B.; Joshi, C.B.; Saini, R.P.; Dahlhaug, O.G. Sand erosion of Pelton turbine nozzles and buckets: A case study of Chilime Hydropower Plant. Wear 2008, 264, 177–184. [Google Scholar] [CrossRef]
  22. Abgottspon, A.; Staubli, T.; Felix, D. Hydro-abrasive erosion of Pelton buckets and suspended sediment monitoring. In Proceedings of the Hydro Vision International, Denver, CO, USA, 23–26 July 2013. [Google Scholar]
  23. Rai, A.K.; Kumar, A.; Staubli, T. Analytical modelling and mechanism of hydro-abrasive erosion in pelton buckets. Wear 2019, 436–437, 203003. [Google Scholar] [CrossRef]
  24. Rai, A.K.; Kumar, A.; Staubli, T.; Yexiang, X. Interpretation and application of the hydro-abrasive erosion model from IEC 62364 (2013) for Pelton turbines. Renew. Energy 2020, 160, 396–408. [Google Scholar] [CrossRef]
  25. Xiao, Y.; Guo, B.; Rai, A.K.; Liu, J.; Liang, Q.; Zhang, J. Analysis of hydro-abrasive erosion in Pelton buckets using a Eulerian-Lagrangian approach. Renew. Energy 2022, 197, 472–485. [Google Scholar] [CrossRef]
  26. Li, L.; Lu, J.; Gong, Y.; Zhao, H.; Liu, X.; Zhu, B. Sediment erosion characteristics of Pelton turbine runner: Effects of sediment concentration and diameter. Renew. Energy 2024, 220, 119679. [Google Scholar] [CrossRef]
  27. Sangal, S.; Singhal, M.K.; Saini, R.P.; Tomar, G.S. Hydro-abrasive erosion modelling in Francis turbine at different silt conditions. Sustain.Vol. Oct. 2022, 53, 102616. [Google Scholar] [CrossRef]
  28. Sharma, S.; Gandhi, B.K. Assessment of erosion wear in low specific speed Francis turbine due to particulate flow. Adv. Powder Technol. 2023, 34, 104065. [Google Scholar] [CrossRef]
  29. Wei, X.-Y.; Pei, J.; Wang, W.-Q.; Yu, Z.-F. Numerical study on sediment erosion characteristics of Francis turbine runner. Eng. Fail. Anal. 2024, 161, 108270. [Google Scholar] [CrossRef]
  30. Ghenaiet, A.; Tan, S.C.; Elder, R.L. Experimental investigation of an axial fan erosion and performance degradation. Proc. Inst. Mech. Eng. Part A J. Power Energy 2004, 218, 437–450. [Google Scholar] [CrossRef]
  31. Ghenaiet, A.; Tan, S.C.; Elder, R.L. Prediction of axial turbomachine performance degradation. Proc. Inst. Mech. Eng. Part A J. Power Energy 2005, 219, 273–287. [Google Scholar] [CrossRef]
  32. Ghenaiet, A. Study of sand particle trajectories and erosion into the first compression stage af a turbofan. J. Turbomach. 2012, 134, 051025. [Google Scholar] [CrossRef]
  33. Ghenaiet, A. Simulation of particle trajectories and erosion in a centrifugal compressor. J. Turbomach. 2012, 134, 051022. [Google Scholar] [CrossRef]
  34. Ghenaiet, A. Effects of solid particle ingestion through an hp turbine. In Proceedings of theASME TurboExpo, Glasgow, UK, 14–18 June 2020; Paper No. GT2012-69875. pp. 1583–1595. 13p. [Google Scholar] [CrossRef]
  35. Ghenaiet, A. Prediction of erosion in radial turbine components. In Proceedings of the ASME TurboExpo, Glasgow, UK, 14–18 June 2020; Paper No. GT2010-22419. pp. 1831–1846. 16p. [Google Scholar] [CrossRef]
  36. Menter, F.R. Two-equation eddy-viscosity turbulence models for engineering applications. AIAA J. 1994, 32, 1598–1605. [Google Scholar] [CrossRef]
  37. Mossinger, P.; Jester-Zuerker, R.; Jung, A. Investigation of different simulation approaches on a high-head Francis turbine and comparison with model test data: Francis-99. J. Phys. Conf. 2015, 579, 012005. [Google Scholar] [CrossRef]
  38. Fluent Theory, General Multiphase Models; Fluent Inc.: New York, NY, USA, 28 November 2001; Chapter 20.
  39. CFX-Pre User’s Guide, CFX-Solver Manager User’s Guide, Theory Guide; release R.16; Ansys Inc.: Canonsburg, PA, USA, 2015.
  40. Patankar, S.V.; Spalding, D.B.A. Calculation procedure for heat, mass and momentum transfer in three-dimensional parabolic flows. Int. J. Heat Mass Transf. 1972, 15, 1778–1806. [Google Scholar] [CrossRef]
  41. Rhie, C.M.; Chow, W.L.A. Numerical study of the turbulent flow past an isolated airfoil with trailing edge separation. AIAA J. 1983, 21, 1525–1532. [Google Scholar] [CrossRef]
  42. White, F.M. Fluid Mechanics, 5th ed.; McGraw-Hill: Blacklick, OH, USA, 2003; p. 467. [Google Scholar]
  43. Elghobashi, S. On the Predicting Particle-Laden Turbulent Flows. Appl. Sci. Res. 1994, 52, 309–329. [Google Scholar] [CrossRef]
  44. Haider, A.; Levenspiel, O. Drag coefficient and terminal velocity of spherical and non spherical particles. J. Powder Technol. 1989, 58, 63. [Google Scholar] [CrossRef]
  45. Thompson, T.L.; Clark, N.N. A holistic approach to particle drag prediction. Powder Technol. 1991, 67, 57–66. [Google Scholar] [CrossRef]
  46. Saffman, P. The lift on a small sphere in a slow shear flow. J. Fluid Mech. 1965, 22, 385–400. [Google Scholar] [CrossRef]
  47. Mei, R. An approximated Expression for the shear lift force on a spherical particle at finite Reynolds number. Int. J. Multiph. Flows 1992, 18, 145–147. [Google Scholar] [CrossRef]
  48. Gosman, A.D.; Ionnides, E. Aspects of computer simulation of liquid fuelled combustors. In Proceedings of the 19th Aerospace Science Meeting, St. Louis, MO, USA, 12–15 January 1981. Paper AIAA 81-0323. [Google Scholar]
  49. Brown, D.J.; Hutchinson, P. The interaction of solid or liquid and turbulent fluid flow fields—A numerical simulation. J. Fluids Eng. 1979, 101, 265–269. [Google Scholar] [CrossRef]
  50. Shirolkar, J.S.; Coimbra, C.F.M.; Queiroz, M.Q. Fundamental aspects of modeling turbulent particle dispersion in dilute flows. Prog. Energy Combust. Sci. 1996, 22, 363–399. [Google Scholar] [CrossRef]
  51. Tabakoff, W.; Hamed, A.; Murugan, D.M. Effect of target materials on the particle restitution characteristics for turbomachinery application. J. Propuls. Power 1996, 12, 260–266. [Google Scholar] [CrossRef]
  52. Grant, G.; Tabakoff, W. Erosion prediction in turbomachinery due to environmental solid particles. In Proceedings of the AIAA 12th Aerospace Sciences Meeting, Washington, DC, USA, 30 January–1 February 1974. AIAA Paper No 74-16. [Google Scholar]
  53. Ball, R.; Tabakoff, W. An Experimental Investigation of the Erosive Characteristics of 410 Stainless Steel and 6AL-4V Titanium. Report No 73-40, AD774325, December 1973. Available online: https://apps.dtic.mil/sti/citations/AD0774325 (accessed on 15 August 2025).
  54. Sangal, S.; Singhal, M.K.; Saini, R.P. CFD based analysis of silt erosion in Kaplan hydraulic turbine. In Proceedings of the International Conference on Signal Processing, Communication, Power and Embedded System, SCOPES 2016—Proceedings, Paralakhemundi, India, 3–5 October 2016; pp. 1765–1770. [Google Scholar] [CrossRef]
  55. Arora, N.; Kumar, A.; Singal, S.K. Hydro-abrasive erosion in Kaplan turbines: A case study. J. Hydroinform. 2024, 26, 2251. [Google Scholar] [CrossRef]
Figure 1. CAD of the Kaplan turbine and computational domain.
Ijtpp 10 00044 g001
Figure 2. Meshes of: (a) distributor vanes, (b) refinement of vane LE, (c) refinement of vane TE, (d) runner mesh side view, (e) runner mesh front view, (f) refinement of blade LE, (g) refinement of blade TE.
Ijtpp 10 00044 g002
Figure 3. Values of y+: (a) distributor vanes, and (b) runner.
Ijtpp 10 00044 g003
Figure 4. Grid size dependence verification.
Ijtpp 10 00044 g004
Figure 5. Computed and measured hydraulic performance: (a) Power and torque, (b) Efficiency and flow rate.
Ijtpp 10 00044 g005
Figure 6. Streamlines coloured by flow velocity (a) near hub, (b) near tip.
Ijtpp 10 00044 g006
Figure 7. Relative total pressure downstream the rotor at: (a) TE, (b) ¼ chord, (c) ½ chord.
Ijtpp 10 00044 g007
Figure 8. Flow structure for the blade setting of 30 degrees: Vane opening of 20 degrees (a) and 30 degrees (d), Streamlines at mid span (b,e) and blade tip (c,f).
Ijtpp 10 00044 g008
Figure 9. Pressure coefficient at mid-span.
Ijtpp 10 00044 g009
Figure 10. Sediment size distributions.
Ijtpp 10 00044 g010
Figure 11. Reduced number of trajectories of constant-size particles coloured by velocity (m/s): (a) 5 microns, (b) 40 microns, and (c) 300 microns.
Ijtpp 10 00044 g011
Figure 12. Reduced number of particle trajectories coloured by the sizes of sediments TDHP: (a) full view, (b) zoom.
Ijtpp 10 00044 g012
Figure 13. Particle trajectory coloured by Stokes number for sediments TDHP.
Ijtpp 10 00044 g013
Figure 14. Initial positions of the blade relative to the vane.
Ijtpp 10 00044 g014
Figure 15. Erosion (ERD) patterns at positions: (a) P0, (b) P1, (c) P2, (d) P3, (e) P4, (f) P5, (g) P6.
Ijtpp 10 00044 g015aIjtpp 10 00044 g015b
Figure 16. EMPH with stator/rotor blade positions: (a) vanes, (b) blades, (c) shroud.
Ijtpp 10 00044 g016
Figure 17. Erosion rate density (mg/s.mm2) in the distributor vanes at a concentration of 2500 mg/m3, while operating at (a) nominal point and (b) maximum power.
Ijtpp 10 00044 g017
Figure 18. Erosion rate density (mg/s·mm2) in the runner blades at a concentration of 2500 mg/m3, while operating at (a) nominal point and (b) maximum power.
Ijtpp 10 00044 g018
Figure 19. Erosion rate density (mg/s.mm2) in the runner shroud at a concentration of 2500 mg/m3, while operating at (a) nominal point and (b) maximum power.
Ijtpp 10 00044 g019
Figure 20. Compared EMPH: (a) blades, (b) vanes, (c) blades hub + bulb and shroud, (d) vanes hub and shroud, (e) diffuser.
Ijtpp 10 00044 g020
Figure 21. EMPH of Kaplan turbine distributor: vanes, hub and shroud.
Ijtpp 10 00044 g021
Figure 22. EMPH of Kaplan turbine: runner blades, hub+bulb and shroud.
Ijtpp 10 00044 g022
Figure 23. Eroded in real runner of Kaplan turbines from hydropower plants: (a) Chilla [15]: (b) Bhudkalan HPP [55].
Ijtpp 10 00044 g023
Table 1. Performance at optimum setting.
ParameterValue
Maximum speed (rpm)3680
Nominal speed (rpm)2000
Maximum power (kW)0.52 @ 2000 rpm
Maximum head (m)3.05
Maximum flow rate (l/s)10–30
Table 2. Geometric parameters.
ComponentParameterValue
DistributorNumber of vanes4
Hub/shroud diameter (mm)50/105.6
Chord (mm)78.3
Vane opening angle (deg) 0–30
RotorNumber of blades 4
Hub/tip diameter (mm)50/100
Tip clearance (mm)0.8
Mid span chord (mm)52.2
Blade setting angle (deg)10–30
Table 3. Computed erosion caused by sediment TDHP operating at nominal point.
AERD (mg/s·mm2)
EMPH (mg/hr)
Sediment concentration (mg/m3)
501005001000150020002500
Distributor vanes
AERD of vanes × 10−120.06870.15110.76921.50342.26523.03583.8148
EMPH of vanes × 10−40.04490.09880.50310.98341.48171.98582.4953
AERD of hub × 10−150.09980.21390.95921.88112.81523.58474.2055
EMPH of hub × 10−70.05400.11580.51901.01781.52321.93962.2755
AERD of shroud × 10−150.34960.46041.32842.97375.39676.92177.6279
EMPH of shroud × 10−70.43670.57511.65953.71476.74168.64669.5288
Runner
AERD of blades × 10−100.01730.04660.24420.48940.73090.97351.2008
EMPH of blades × 10−30.06740.18140.95031.90482.84473.78874.6732
AERD of hub+bulb × 10−140.19170.59012.31074.63446.67618.763210.6691
EMPH of hub+bulb × 10−60.09380.28881.13102.26843.26784.28945.2223
AERD of shroud × 10−120.02730.05530.26810.54450.82121.08911.3566
EMPH of shroud × 10−40.03740.07580.36700.74551.12431.49111.8573
Draft tube
AERD of draft tube × 10−150.17080.31701.53673.08594.65566.22677.7867
EMPH of draft tube × 10−60.04730.08770.42540.85421.28871.72362.1554
Table 4. Computed erosion caused by sediment TDHP operating at maximum power.
AERD (mg/s·mm2)
EMPH (mg/hr)
Sediment concentration (mg/m3)
501005001000150020002500
Distributor vanes
AERD of vanes × 10−120.10640.22831.13502.23853.38174.51915.6864
EMPH of vanes × 10−40.06960.14940.74261.46462.21262.95683.7205
AERD of hub × 10−150.12930.28201.32142.72443.81865.06235.9313
EMPH of hub × 10−70.06990.15260.71491.47402.06602.73883.2090
AERD of shroud × 10−150.47400.65601.88295.08667.42089.508510.9766
EMPH of shroud × 10−70.59210.81942.35206.35419.269911.878013.7120
Runner
AERD of blades × 10−100.04950.09500.47960.96951.47171.94852.4206
EMPH of blades × 10−30.19280.36991.86733.77395.72907.58499.4229
AERD of hub+bulb × 10−140.22960.33081.70053.33694.97936.69798.2757
EMPH of hub+bulb × 10−60.11240.16190.83241.63342.43743.27864.0509
AERD of shroud × 10−120.02970.05800.29370.59240.88431.18511.4795
EMPH of shroud × 10−40.04060.07940.40210.81111.21071.62252.0256
Draft tube
AERD of draft tube × 10−150.02080.04330.20150.41100.62300.83861.0250
EMPH of draft tube × 10−70.05760.11990.55791.13771.72462.32132.8372
Disclaimer/Publisher’s Note: The statements, opinions and data contained in all publications are solely those of the individual author(s) and contributor(s) and not of MDPI and/or the editor(s). MDPI and/or the editor(s) disclaim responsibility for any injury to people or property resulting from any ideas, methods, instructions or products referred to in the content.