1. Introduction
With the aims of higher efficiencies and reduced weight, there is an ongoing trend towards fan designs with higher bypass and lower pressure ratios, as well as composite materials. For such fans, the goals of lower weights and high aerodynamic performance compete with aeroelastic stability, especially near stall conditions. Critical fan blade vibrations near stall conditions can be due to various causes, listed as follows:
Despite the fact that, for NSVs, the physical mechanisms involved are still the subject of active research, fan stall flutter can nowadays be regarded as well understood; the unsteady flow response due to small blade vibration causes unsteady pressure forces, which increase vibrational energy, leading to a positive feedback loop. The aerodynamic work per cycle, which is added to the structure, and the related damping quantity must therefore be estimated at an early design phase in order to ensure flutter-free fans [
4]. Although qualitatively well understood, flutter bite is nevertheless difficult to predict with computational methods for several of the following reasons:
Flutter bite occurs typically for off-design conditions with complex flow structures in the blade tip region. Established CFD methods, in particular turbulence models, bring with them a high degree of uncertainty for these flow conditions.
Flutter onset is often related to the interaction with an acoustic mode which is cut-off downstream but cut-on in the intake where it is partly reflected [
5]. The reflection mechanisms have to be predicted rather accurately for a reliable flutter analysis.
CFD-based flutter analysis of turbomachinery components (not just fans) is highly sensitive to spurious numerical reflections at inlets and outlets.
To advance the understanding of aeroelastic instability mechanisms, Ecole Centrale de Lyon, in cooperation with the Von Karman Institute for Fluid Dynamics, initiated an extensive research program. This included a newly designed fan module, the so-called ECL5, which was developed with the aim of an open test case that is representative of modern low-speed composite fans. The ECL5 has been investigated for a couple of years, with a strong focus on non-synchronous coupling mechanisms between aerodynamics, acoustics, and structure dynamics within the European Clean Sky 2 project CATANA (
catana.ec-lyon.fr) (Composite Aeroelastics and Aeroacoustics).
Although both experimental and computational research in the CATANA project has a strong focus on NSVs, the design of the ECL5 was also thoroughly investigated with respect to potential flutter onset. During these studies, Pagès et al. [
6] found that, at 80% rotational speed, aerodynamic damping of the second eigenmode becomes negative for the nodal diameter of 5, causing a V-shaped spike in the damping curve. The minimal aerodynamic damping ratio was about
and in apparent contradiction to both experiments and computational studies with time-domain methods [
7]. The authors of [
6] suspected that the high negative damping could indicate a lock-in with a counter-rotating disturbance. However, the exact reasons for the unusual value remained unclear.
The aims of this paper are the following:
The reference results in [
6] are used to validate the Harmonic Balance (HB) method of DLR’s turbomachinery flow solver TRACE for fan flutter at near-stall conditions.
Regarding the nodal diameter 5, this paper clarifies whether the above-mentioned spike in the damping curve occurs for linearized methods only.
The HB method is, in principle, capable of predicting highly nonlinear unsteady dynamics. We will use HB here to shed some light on the nonlinear fluid–structure interaction process.
The paper is organized as follows: After introducing the numerical method and configuration, a standard flutter analysis using HB is performed, and several influence parameters are investigated. First, the impact of the turbulence model formulation, as well as the numerical boundary conditions, is studied. Then a frequency sensitivity study is performed to localize resonance frequencies for several nodal diameters. Then the question of nonlinear effects is addressed with simulations including the zeroth and higher harmonics.
This article is a revised version of a paper with the same title, which was presented at European Turbomachinery Conference in Hanover in March 2025 [
8].
2. Configuration and Numerical Setup
The test case studied in this work is the open UHBR Fan ECL5/CATANA. Details about the geometry can be found in [
6]. It comprises a fan section with 16 fan blades, as well as an OGV domain with 31 vanes; see
Figure 1. Note that the computational domain used here does not include the air intake. Otherwise, the mesh is identical to the one used by Fiquet et al. [
7]. All simulations below are carried out for a computational domain, with the inlet boundary placed at an axial position that is marked with a red dashed line in
Figure 1. To investigate the impact of possible numerical reflections, we consider simulations with the long domain.
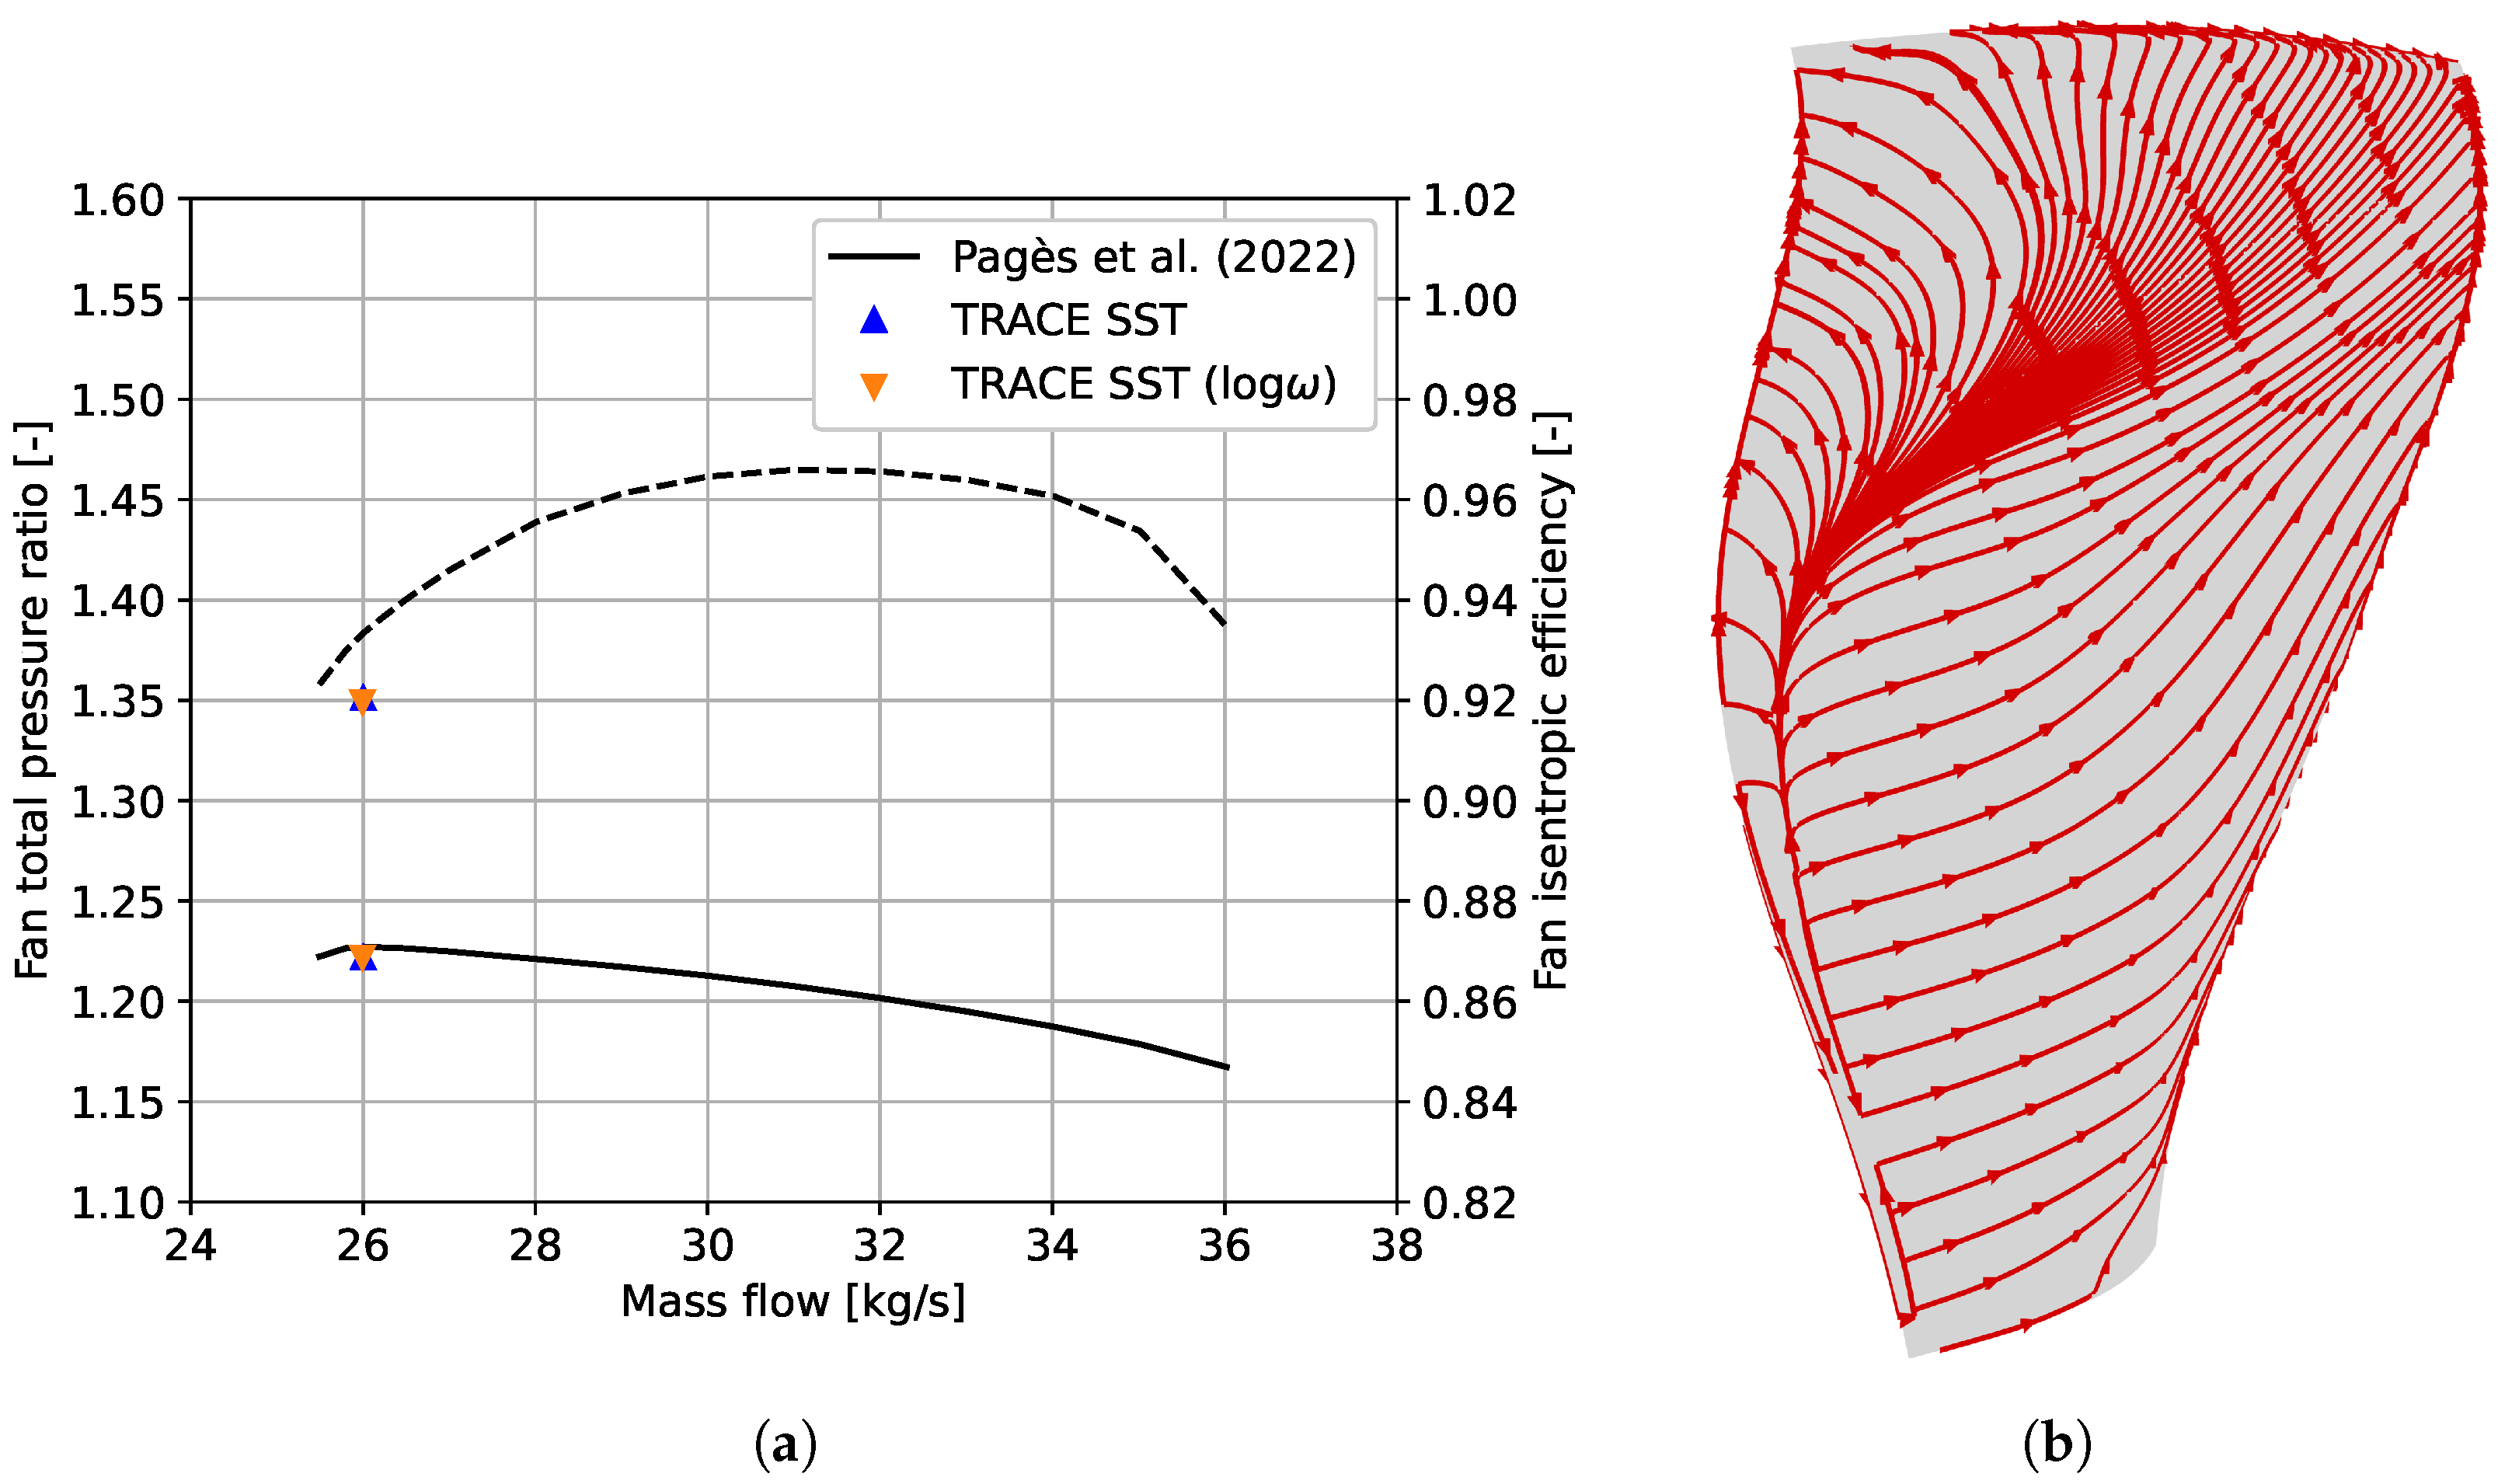
The rotational speed is 80% of the design speed, i.e., 8800 rpm, and the operating point corresponds to 26
and is shown in
Figure 2. This plot also shows, for this operating point, the streaklines along the fan suction side, as predicted by the steady solver of TRACE. As was observed by Pagès et al. [
6], a considerable back flow zone exists in the upper part of the blade.
Throughout this work, Menter’s SST turbulence model [
9] with the stagnation point anomaly fix by Kato et al. [
10] has been used. We consider both the original
- and the
-formulations.
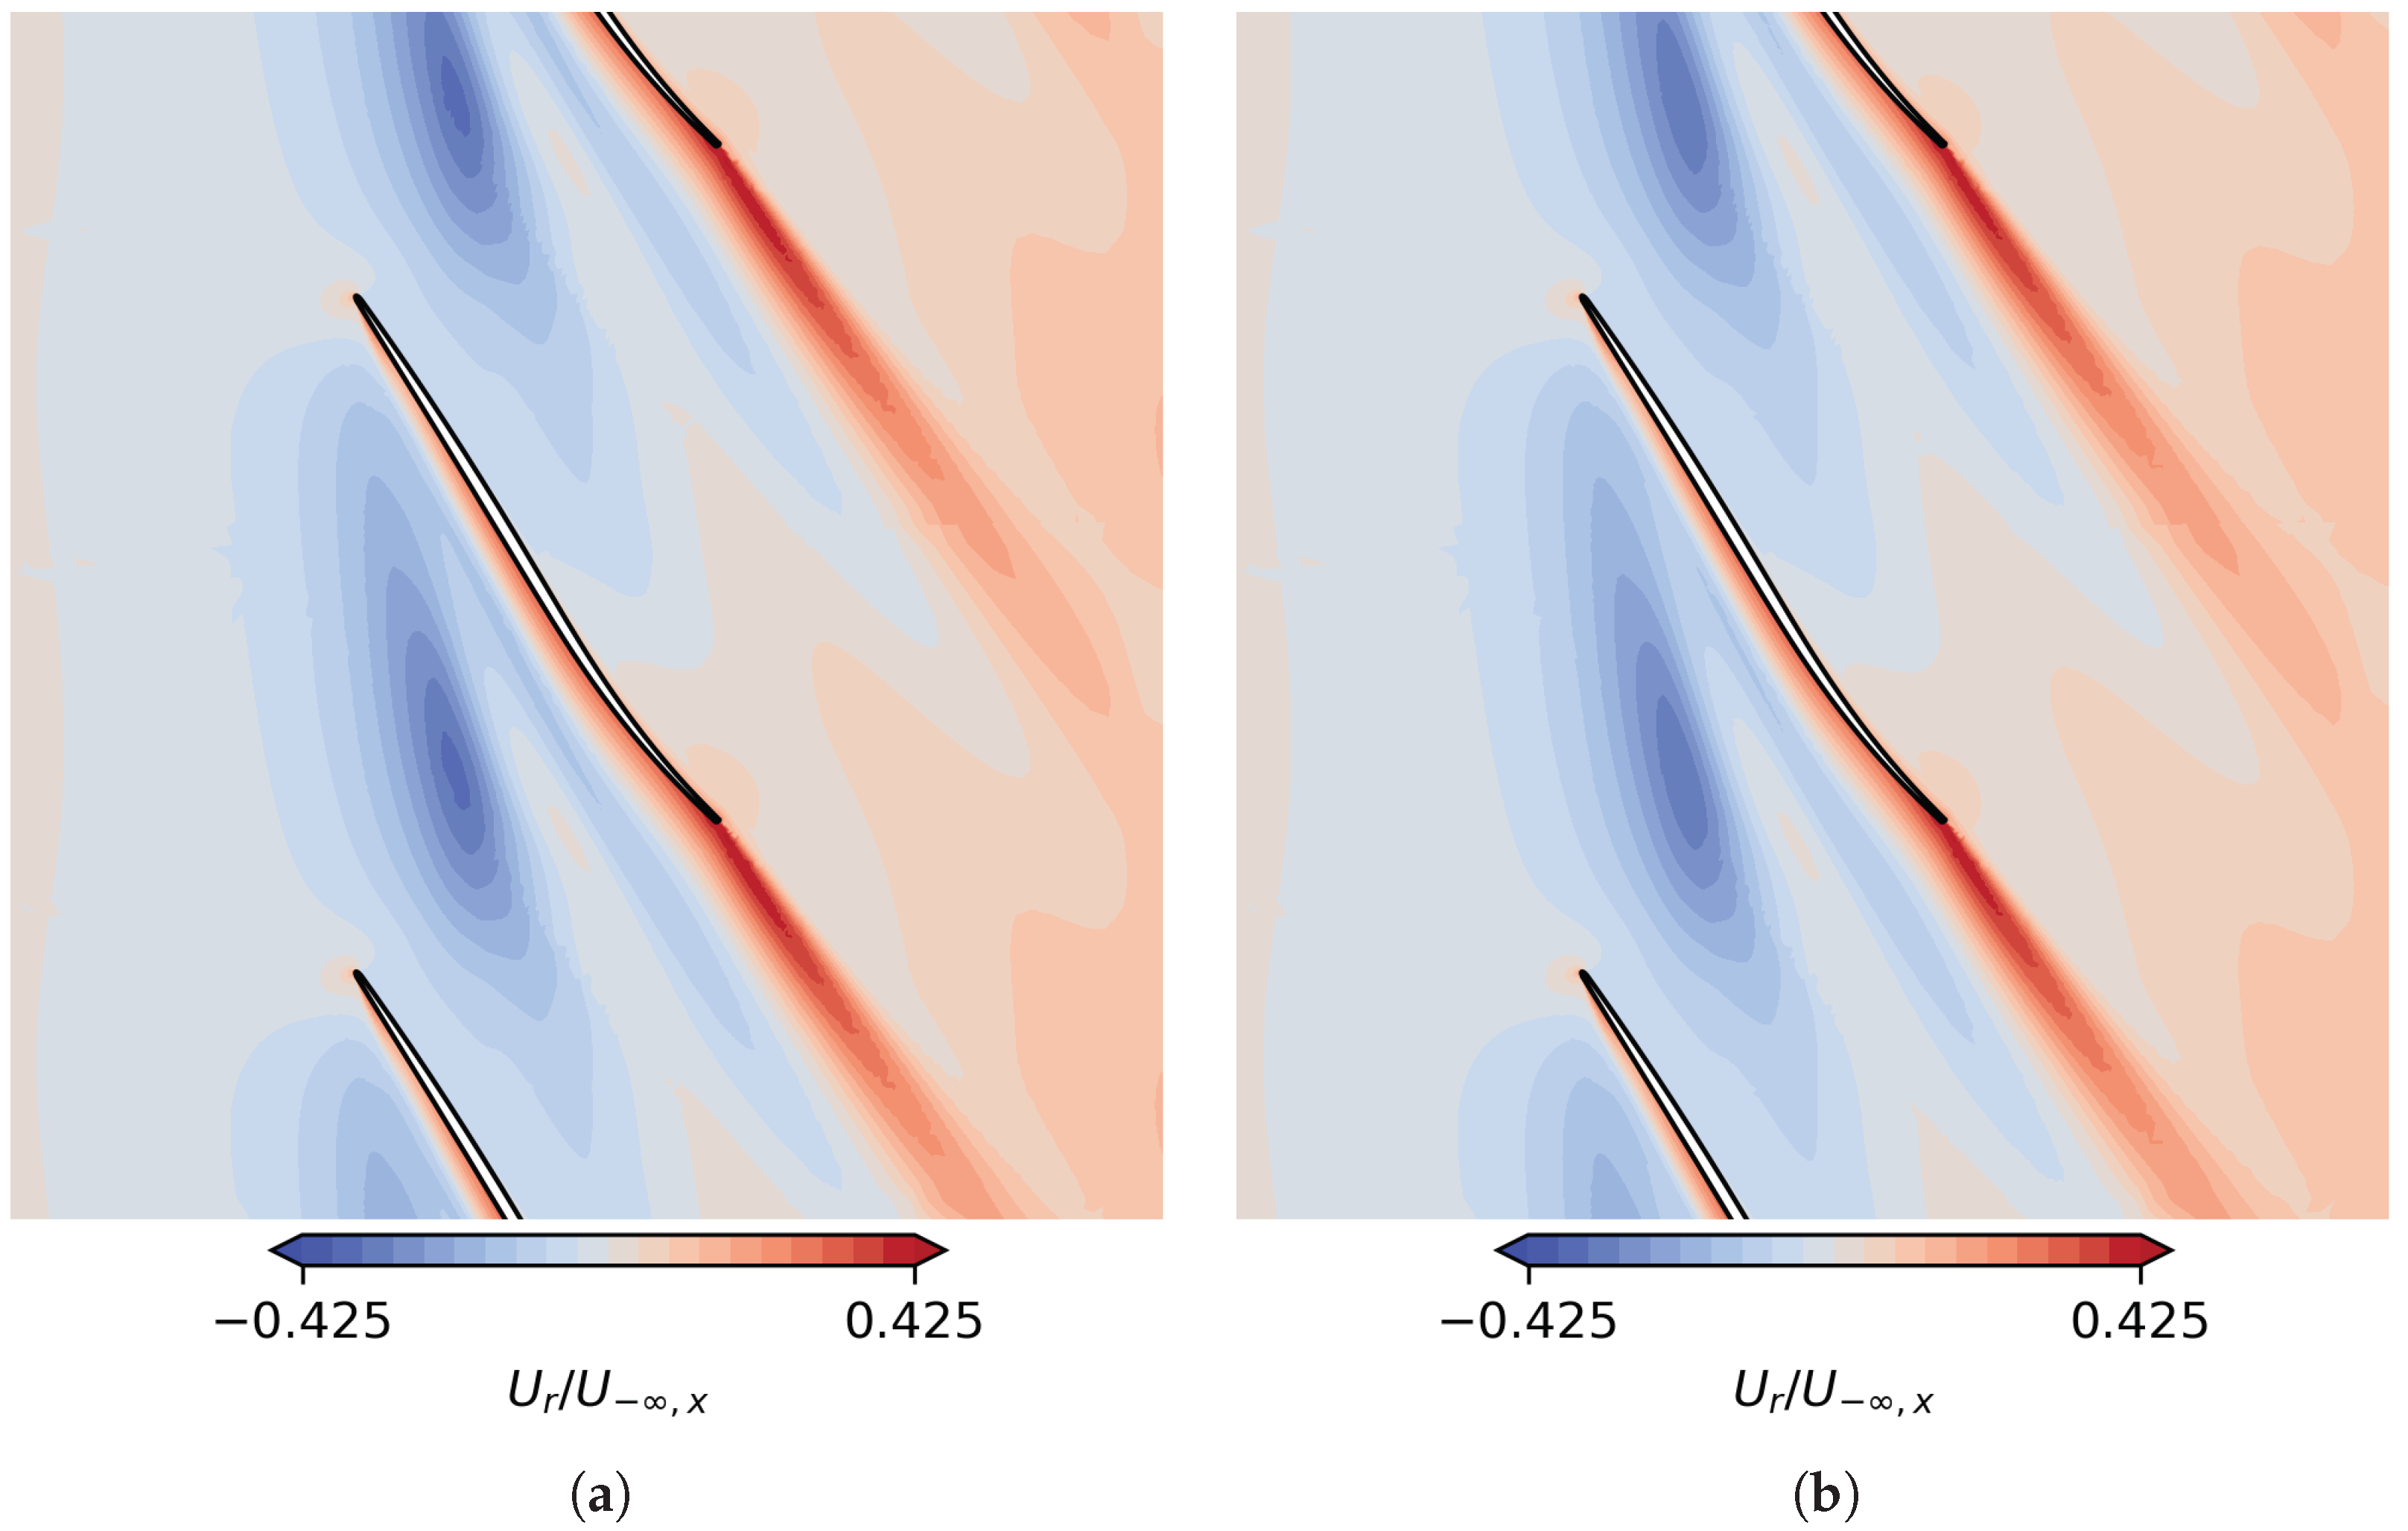
Figure 3 shows the radial velocity at
channel height, normalized by the upstream axial velocity, for the two formulations. As can be seen, the radial velocity contours are nearly identical. The choice of the formulation, at least for this mesh, thus has a minor impact on the tip leakage flow. Moreover, we infer from
Figure 2 that it does not have an effect on the overall performance at the operating point under investigation as well.
2.1. Flutter Analysis
In this paper, the aerodynamic response for the second eigenmode and all nodal diameters except
is studied. Apart from the exceptional nodal diameter 1, the mode shapes were found to be nearly independent of the nodal diameter in a previous study [
6]. The mode shape corresponding to
is used here for all other nodal diameters. The eigenfrequencies, in turn, depend on the nodal diameter and are identical to the ones in [
6]. The displacement amplitude of the mode shape is shown in
Figure 4. A maximal displacement of
is taken here as the standard amplitude. When discussing nonlinear effects, we will vary this amplitude by a factor of
and 10.
As is common practice for turbomachinery flutter analysis, we employ the so-called energy method; i.e., our analysis will look at the flow response in terms of two global parameters: the aerodynamic damping ratio
and the aerodynamic stiffness ratio
where
is the modal energy,
is the angular eigenfrequency, and
m is the modal mass of the eigenmode, which is identical to the one used by Pagès et al. [
6].
Wcyc is the complex modal work per cycle added to the structure,
with the modal displacement given by
and the instantaneous modal force
Here, is the vibrating blade surface, and is the mode shape. So the damping is positive if the real part of Wcyc (active part) is negative and the fluid extracts energy from the vibration.
2.2. Numerical Method
All CFD simulations are performed with the flow solver TRACE, which is DLR’s inhouse solver for turbomachinery and was developed for about three decades in close cooperation with MTU Aero Engines. In this work, the spatial discretization is based on a cell-centered finite volume scheme, using Roe’s flux [
11] in combination with second-order MUSCL extrapolation [
12] and a van-Albada-type limiter [
13].
The unsteady simulation method employed here is the harmonic balance (HB) method [
14], which has been extended and validated for flutter analysis [
15,
16]. Several studies have shown that in many cases, instead of adopting the so-called frozen turbulence approach, one should rather apply the harmonic balance method to turbulence equations as well [
17,
18].
The harmonic balance method for
K higher harmonics is to approximate the time-periodic flow response by a truncated Fourier series,
Using this convention for the definition of the complex harmonics, the harmonic balance equation for the
k-th harmonic is
where
q is the vector of conservative states in each cell, and
V is the vector of time-dependent cell volumes [
15]. The harmonics in Equation (
6) are computed using discrete Fourier transforms again, which amounts to looping over
Nsp sampling points. Here, to reduce the aliasing error, the number of sampling points is always set to
sampling points. Since the residual
R is a nonlinear function of the flow state, the equations for the harmonics are coupled. For the pseudotime marching approach that is used to solve the HB equations, we refer the reader to [
14].
At the inlet and outlet boundaries, all harmonics, including the mean flow, are treated with 2D non-reflecting boundary conditions. At the rotor–stator interface, these non-reflecting boundary conditions are also applied to all circumferential modes that do not match a corresponding mode in the neighboring domain.
Below, results from HB setups are presented, which resemble time-linearized approaches in that the mean flow is frozen and
are discussed. In this case, Equation (
6) is solved only for the first harmonic. It should be noted though that the resulting equation is still non-linear. Such a setup will be denoted by H1 as opposed to H0..
K, which denotes a setup where all
K higher harmonics and the mean flow are solved for. The configurations that were run for this study are summarized in
Table 1.
For the HB simulations in this work, the CFL number was set to 10. When the relative variation in both the damping and the stiffness ratios was less than
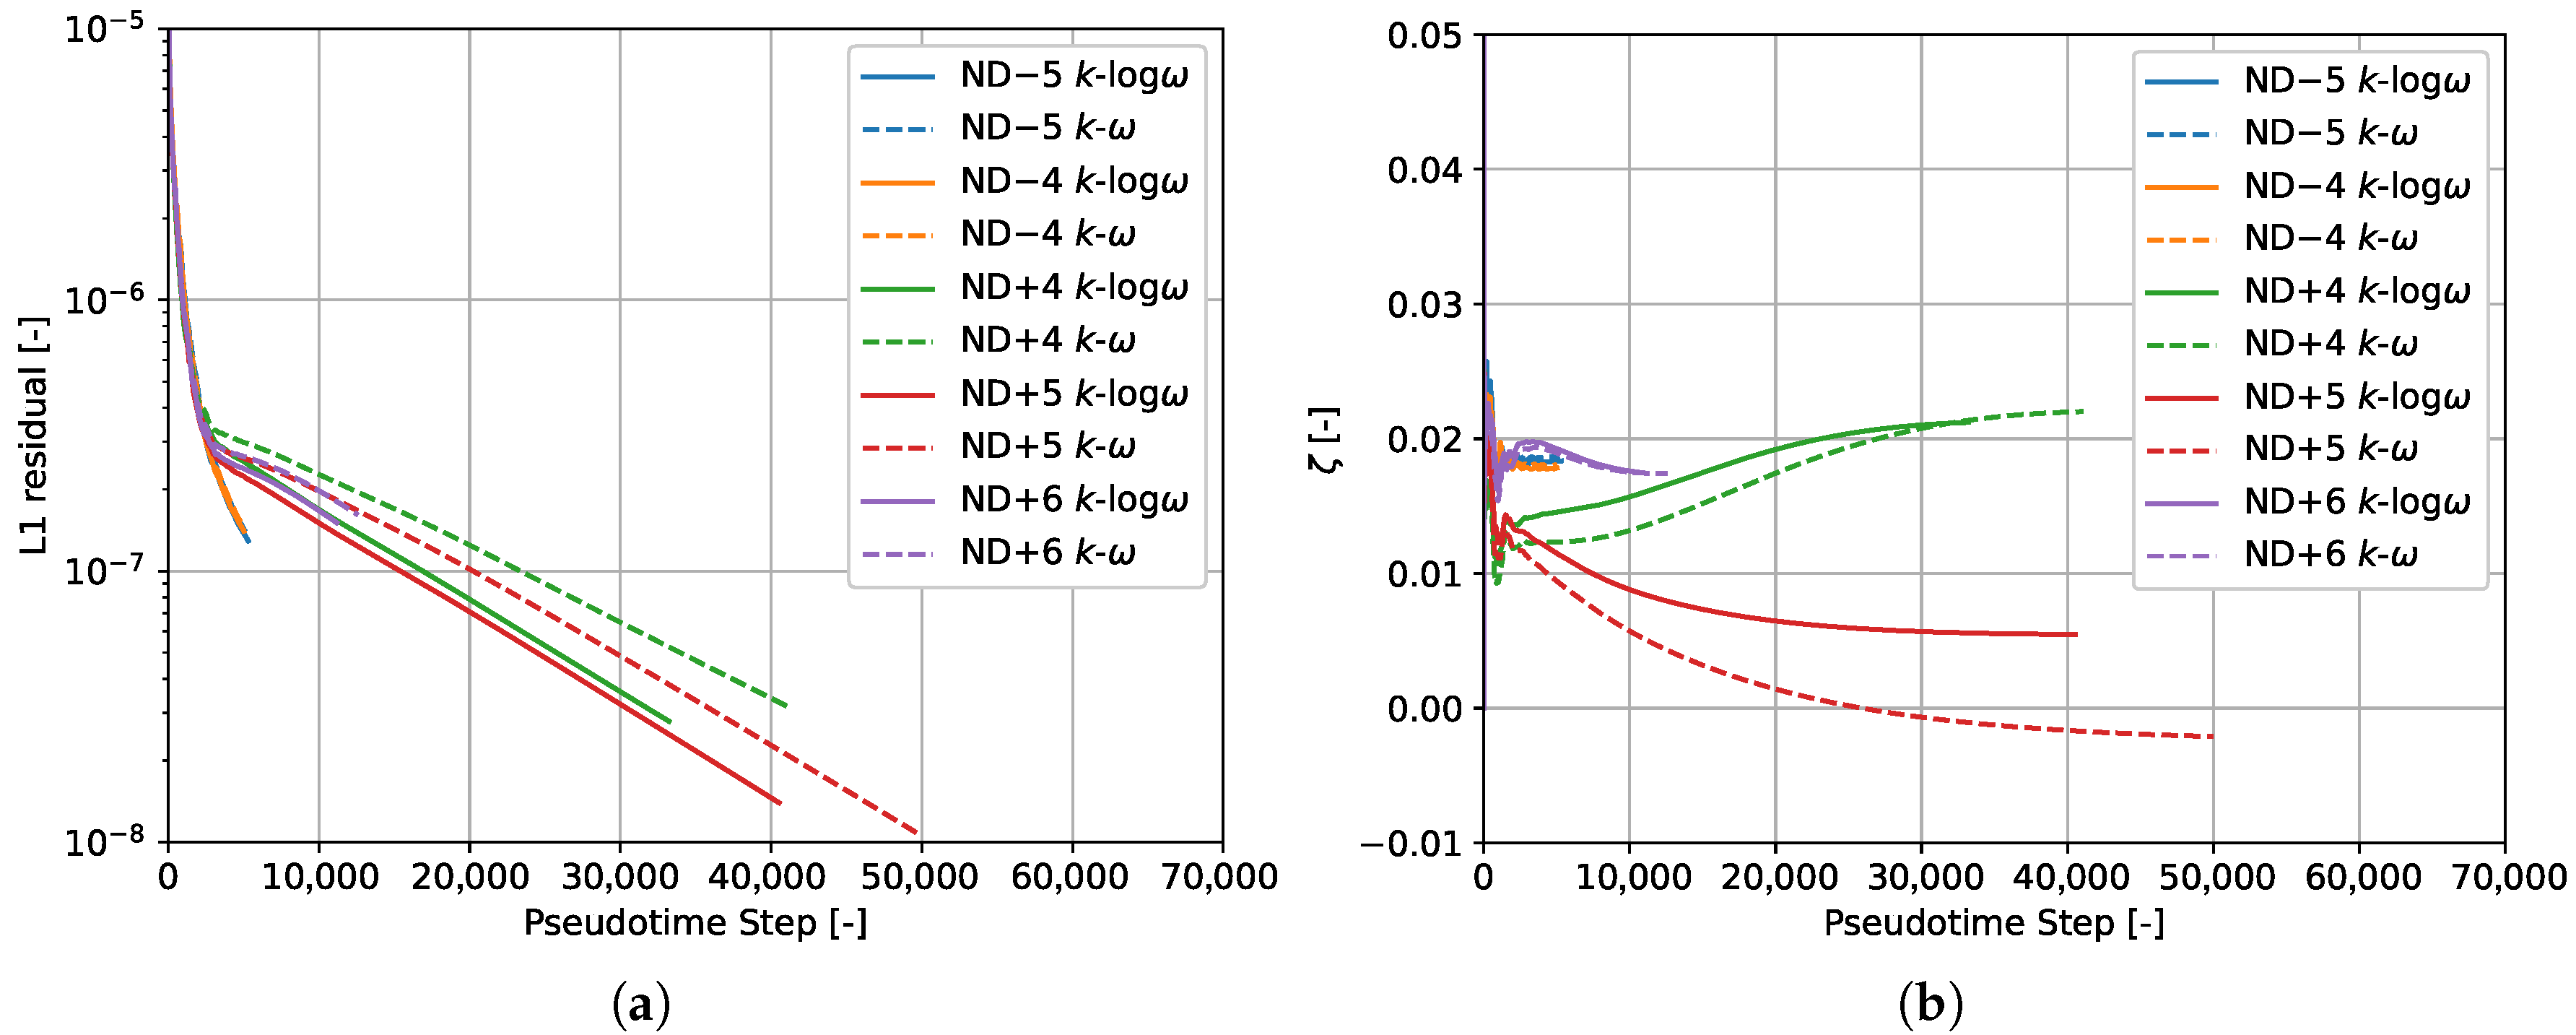
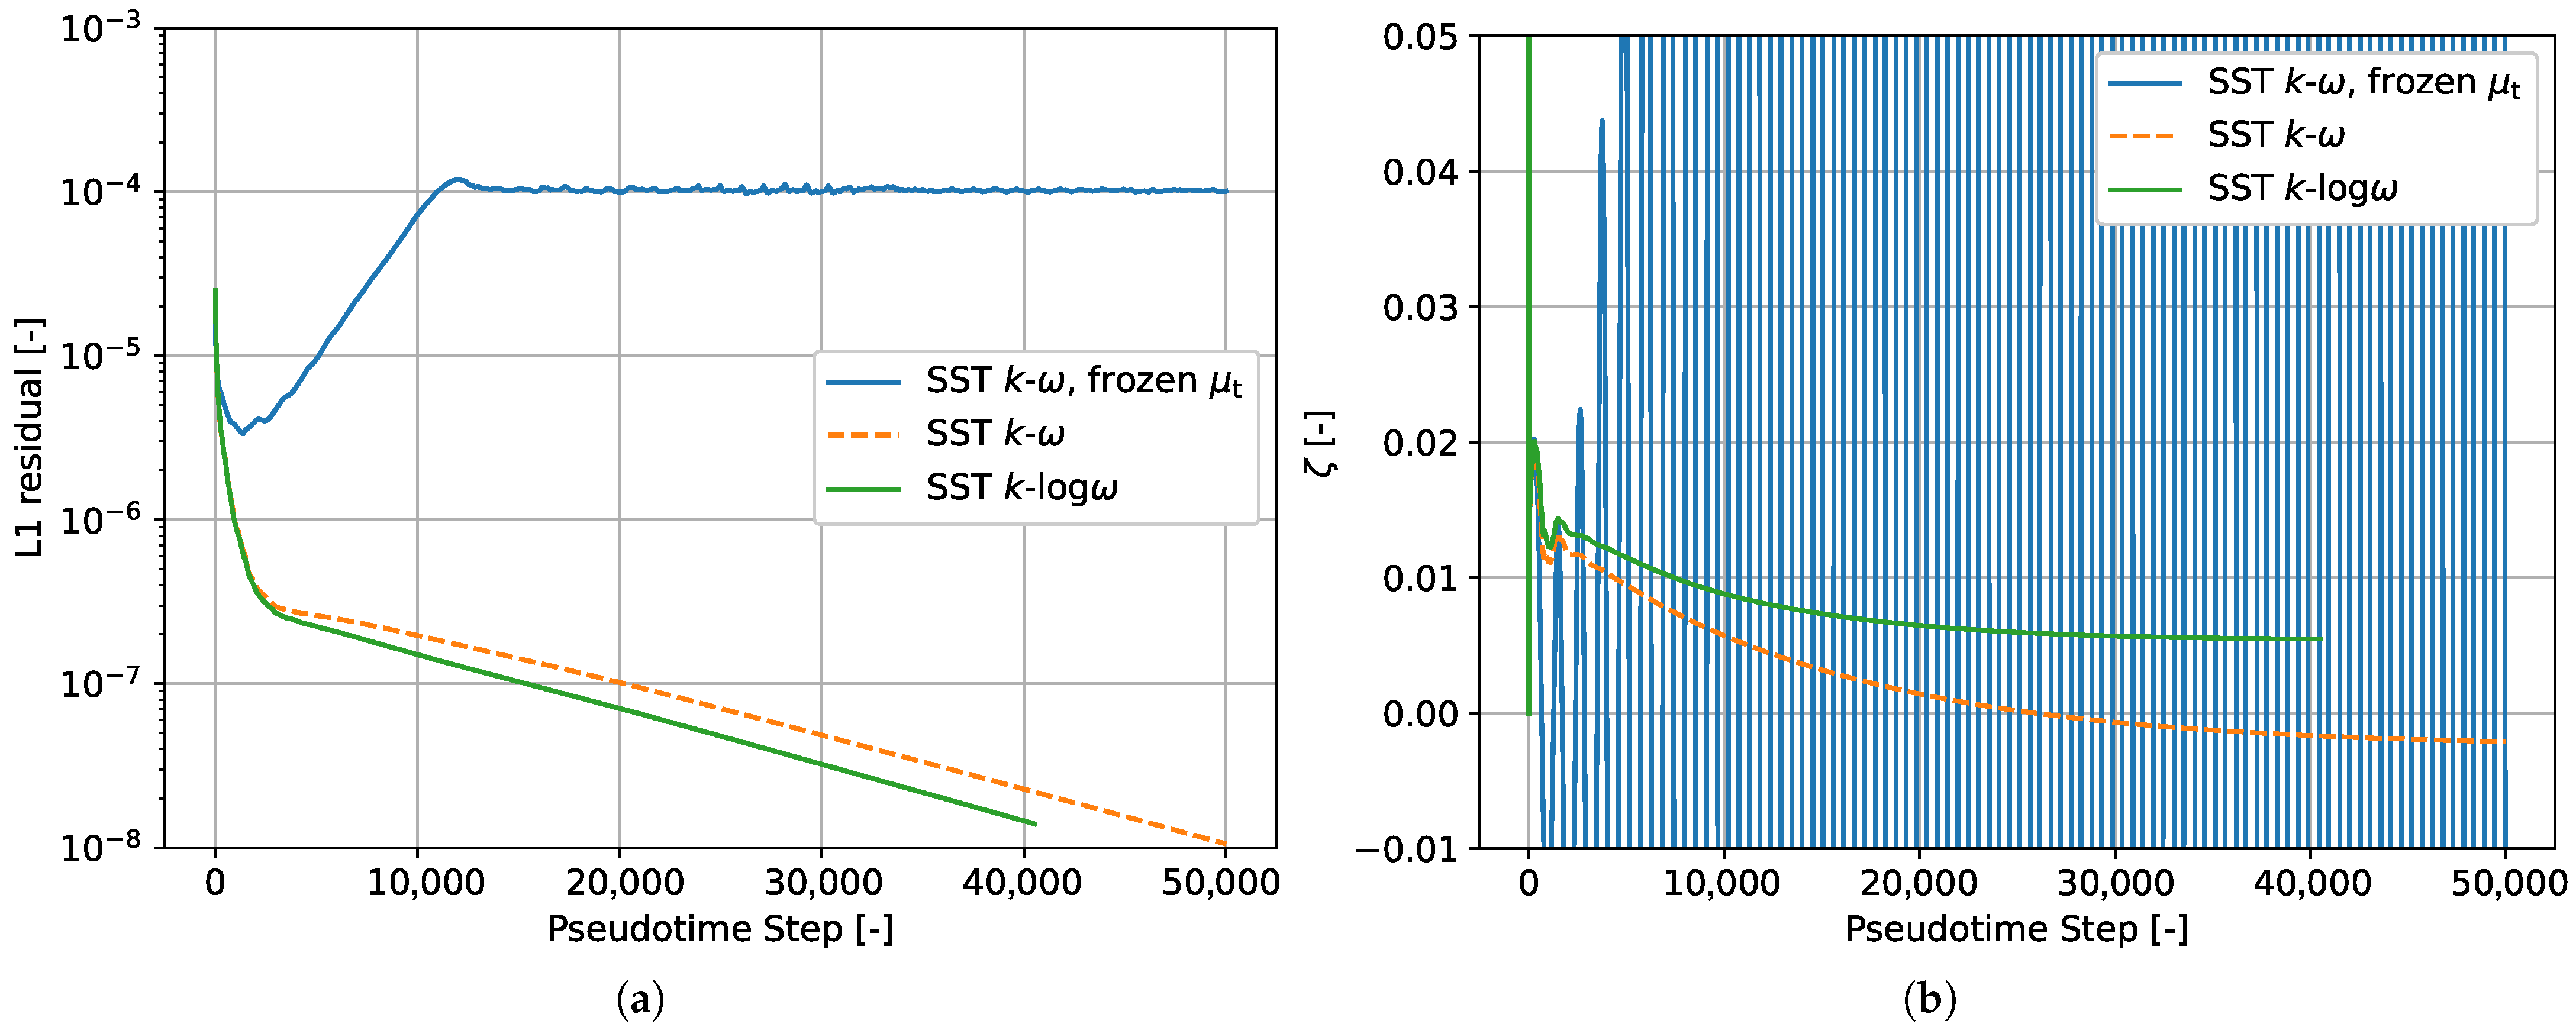
over 2500 pseudotime steps, the simulation was terminated. The convergence of the H1 setups for the nodal diameters 4, 5, and 6 is shown in
Figure 5 and compared to that for the negative nodal diameters
and
. For the positive nodal diameters, the convergence is much slower. The aerodynamic damping for
, for instance, exhibited a slow drift over a long period rather than a damped oscillation, as was observed for negative nodal diameters.
3. Turbulence Model
As has been shown in recent studies [
18], the use of a so-called
-formulation can be particularly beneficial for flutter analyses in terms of both robustness and mesh sensitivity, in particular when used with harmonic balance methods. This is mainly due to the fact that temporal variations are resolved with a finite number of Fourier harmonics. High gradients in signals can lead to Gibbs-like phenomena. These high oscillations, in turn, can cause the turbulent dissipation rate to take unphysically small or even negative values, leading to numerical instabilities.
Regarding the convergence speed,
Figure 5 shows that the simulations with the
-formulation were somewhat faster than the standard implementation of the SST model. In contrast, simulations with the frozen turbulence assumption were unsuccessful in terms of the residual reduction and did not give physically meaningful results; see
Figure 6.
We conclude that the turbulence model quantities should, for this operating point, always be modeled as unsteady. Note that TRACE also has a time-linearized method [
19], which, however, is based on the frozen-eddy viscosity hypothesis and is therefore of limited use for this operating point.
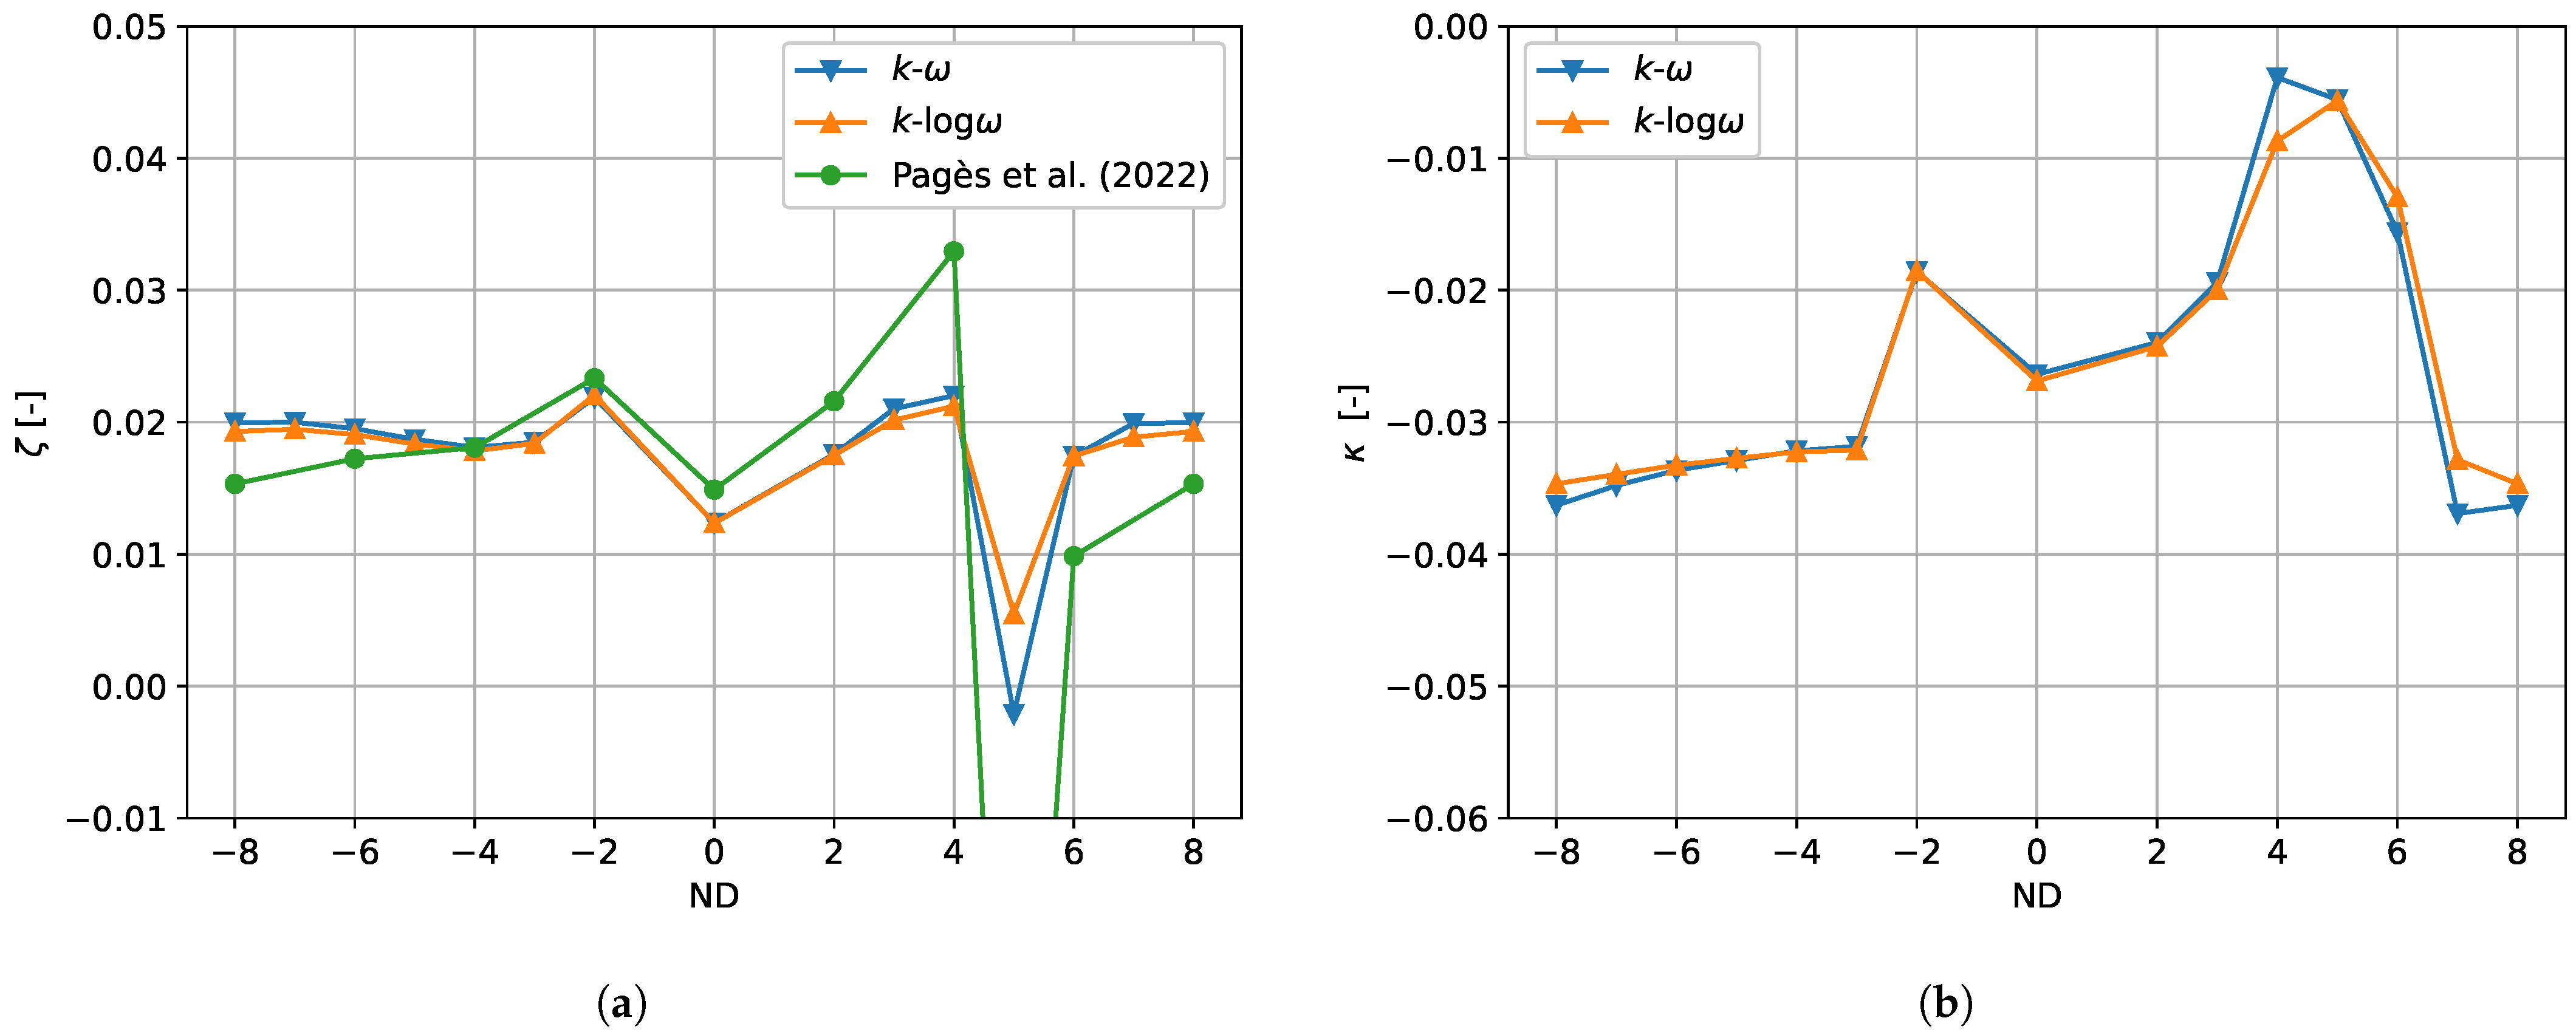
In the following, the two formulations for a setup with just one harmonic (and frozen mean) are compared.
Figure 7 shows the resulting values of the aerodynamic damping and stiffness. It can be seen that, while the
-reformulation has little impact on the flow response for a large range of nodal diameters, the values in the vicinity of
are more sensitive. The value for
even changes the sign.
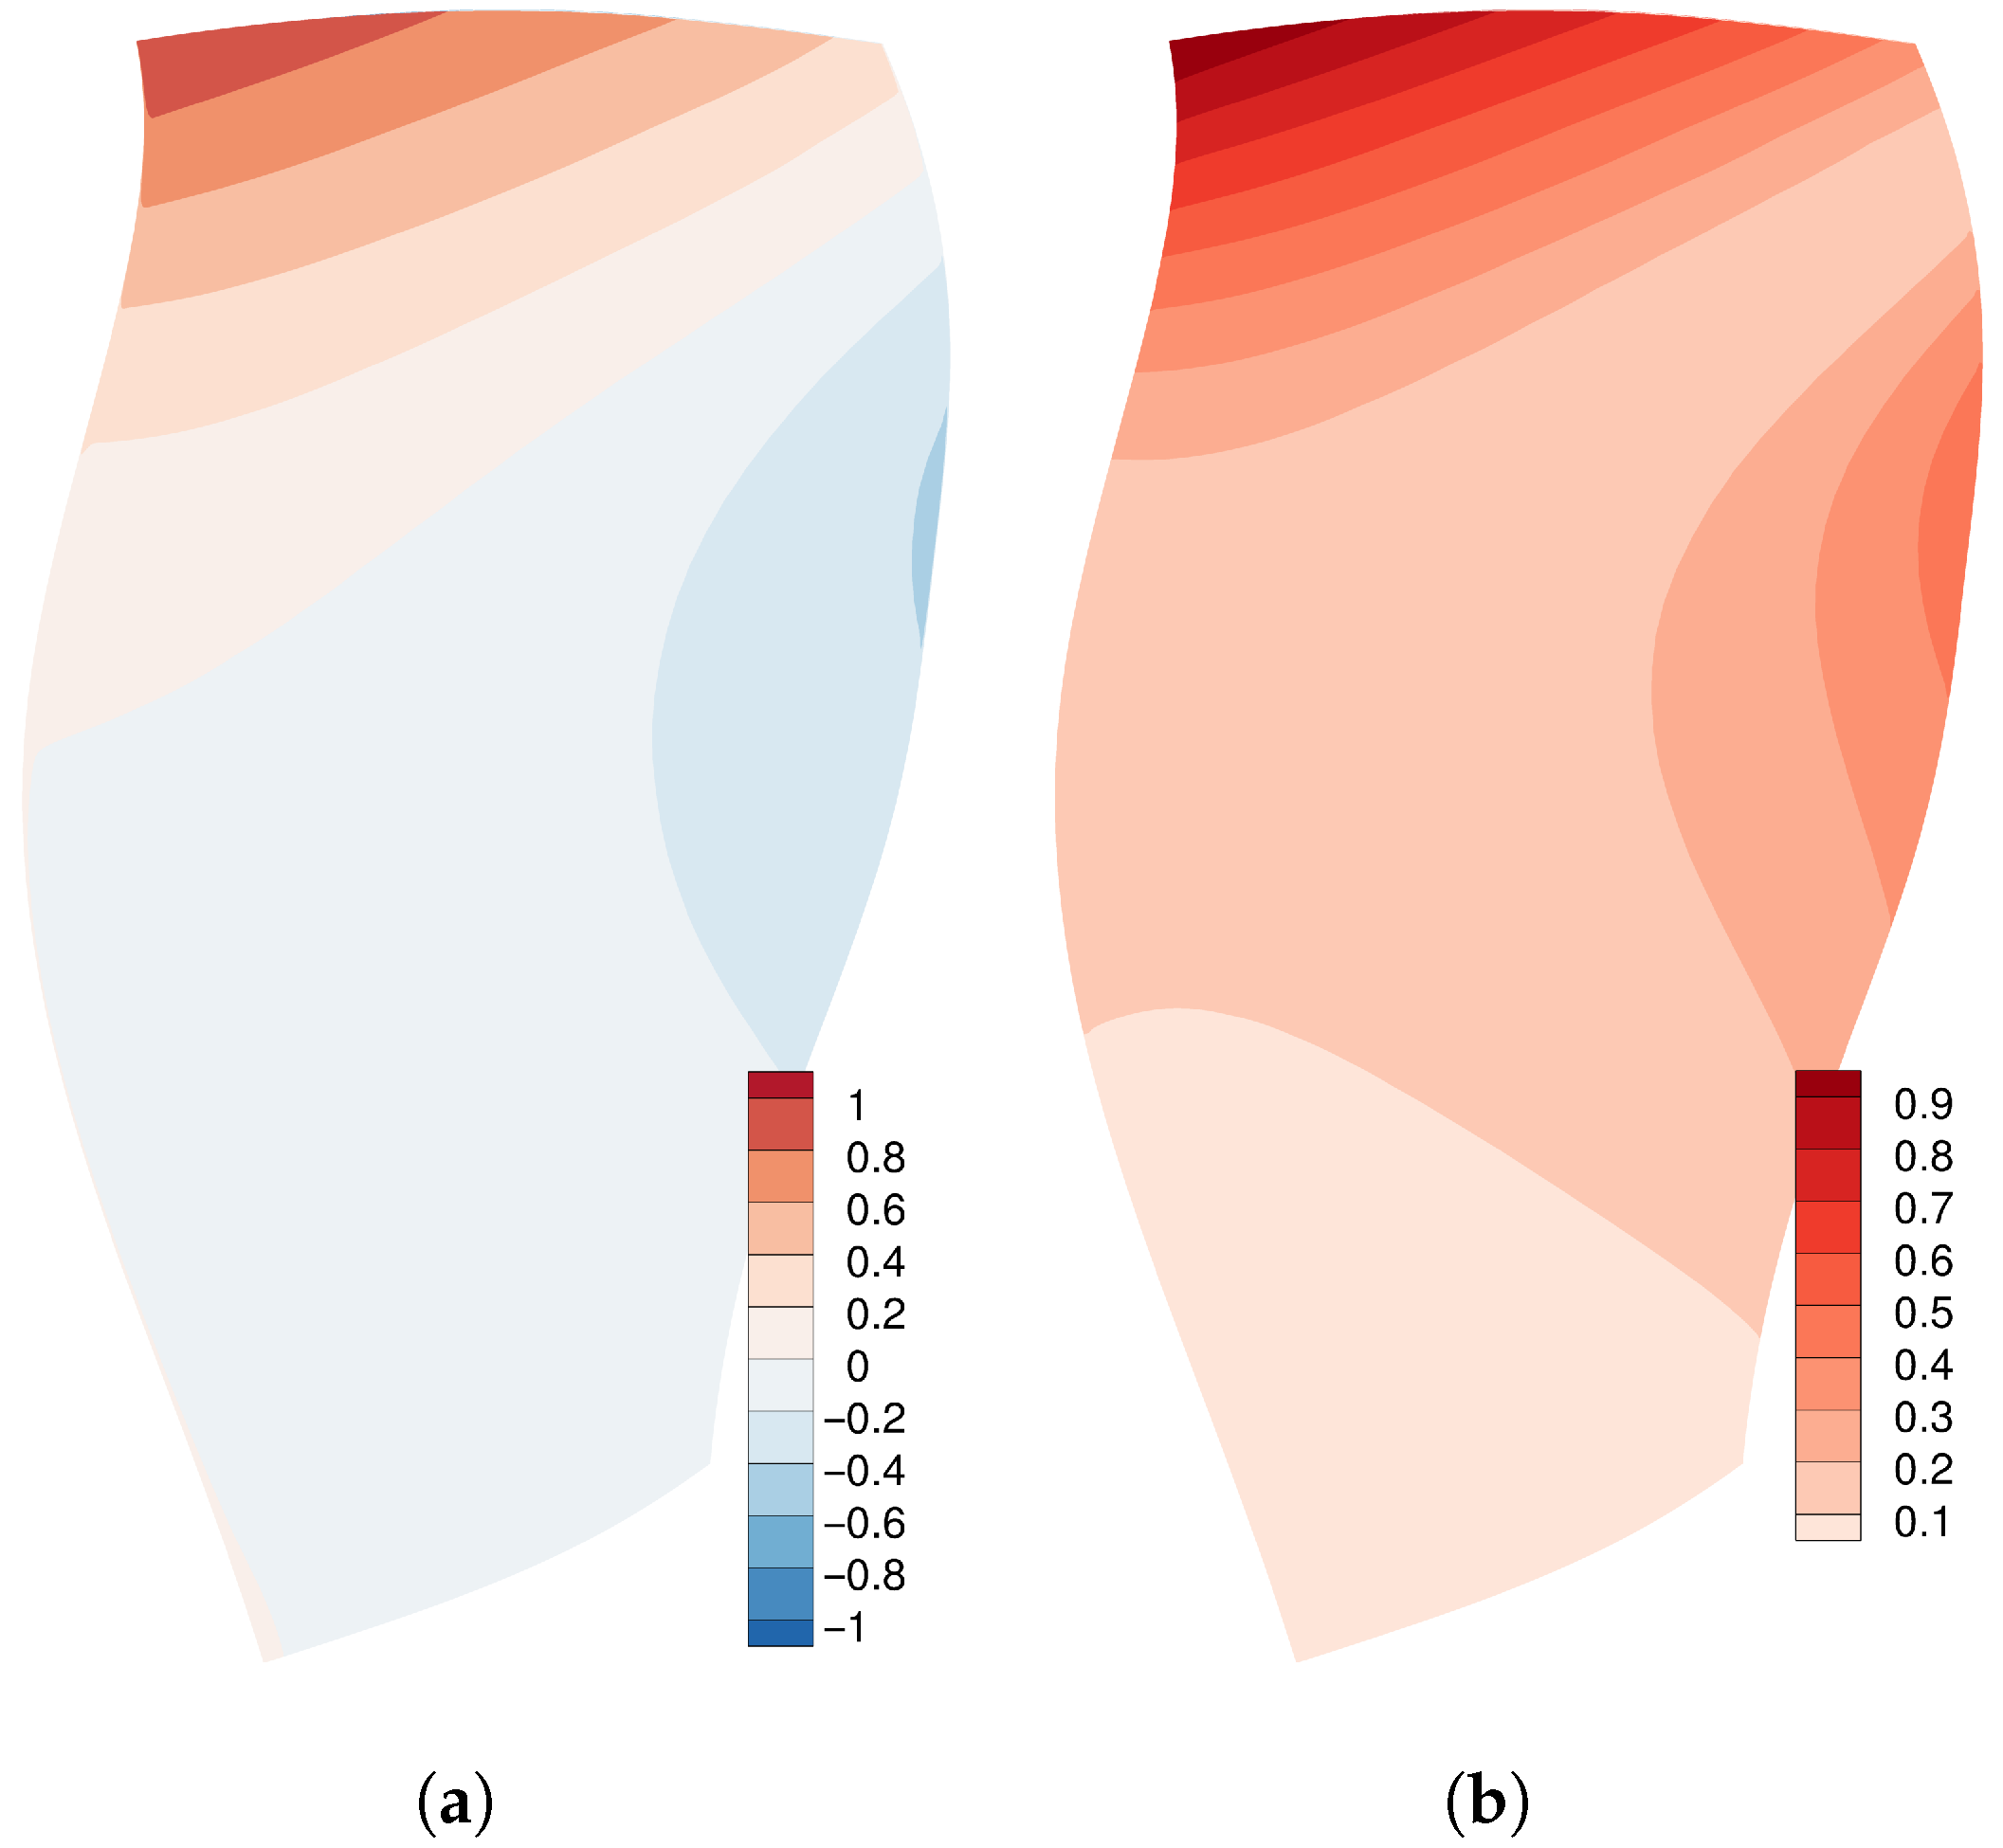
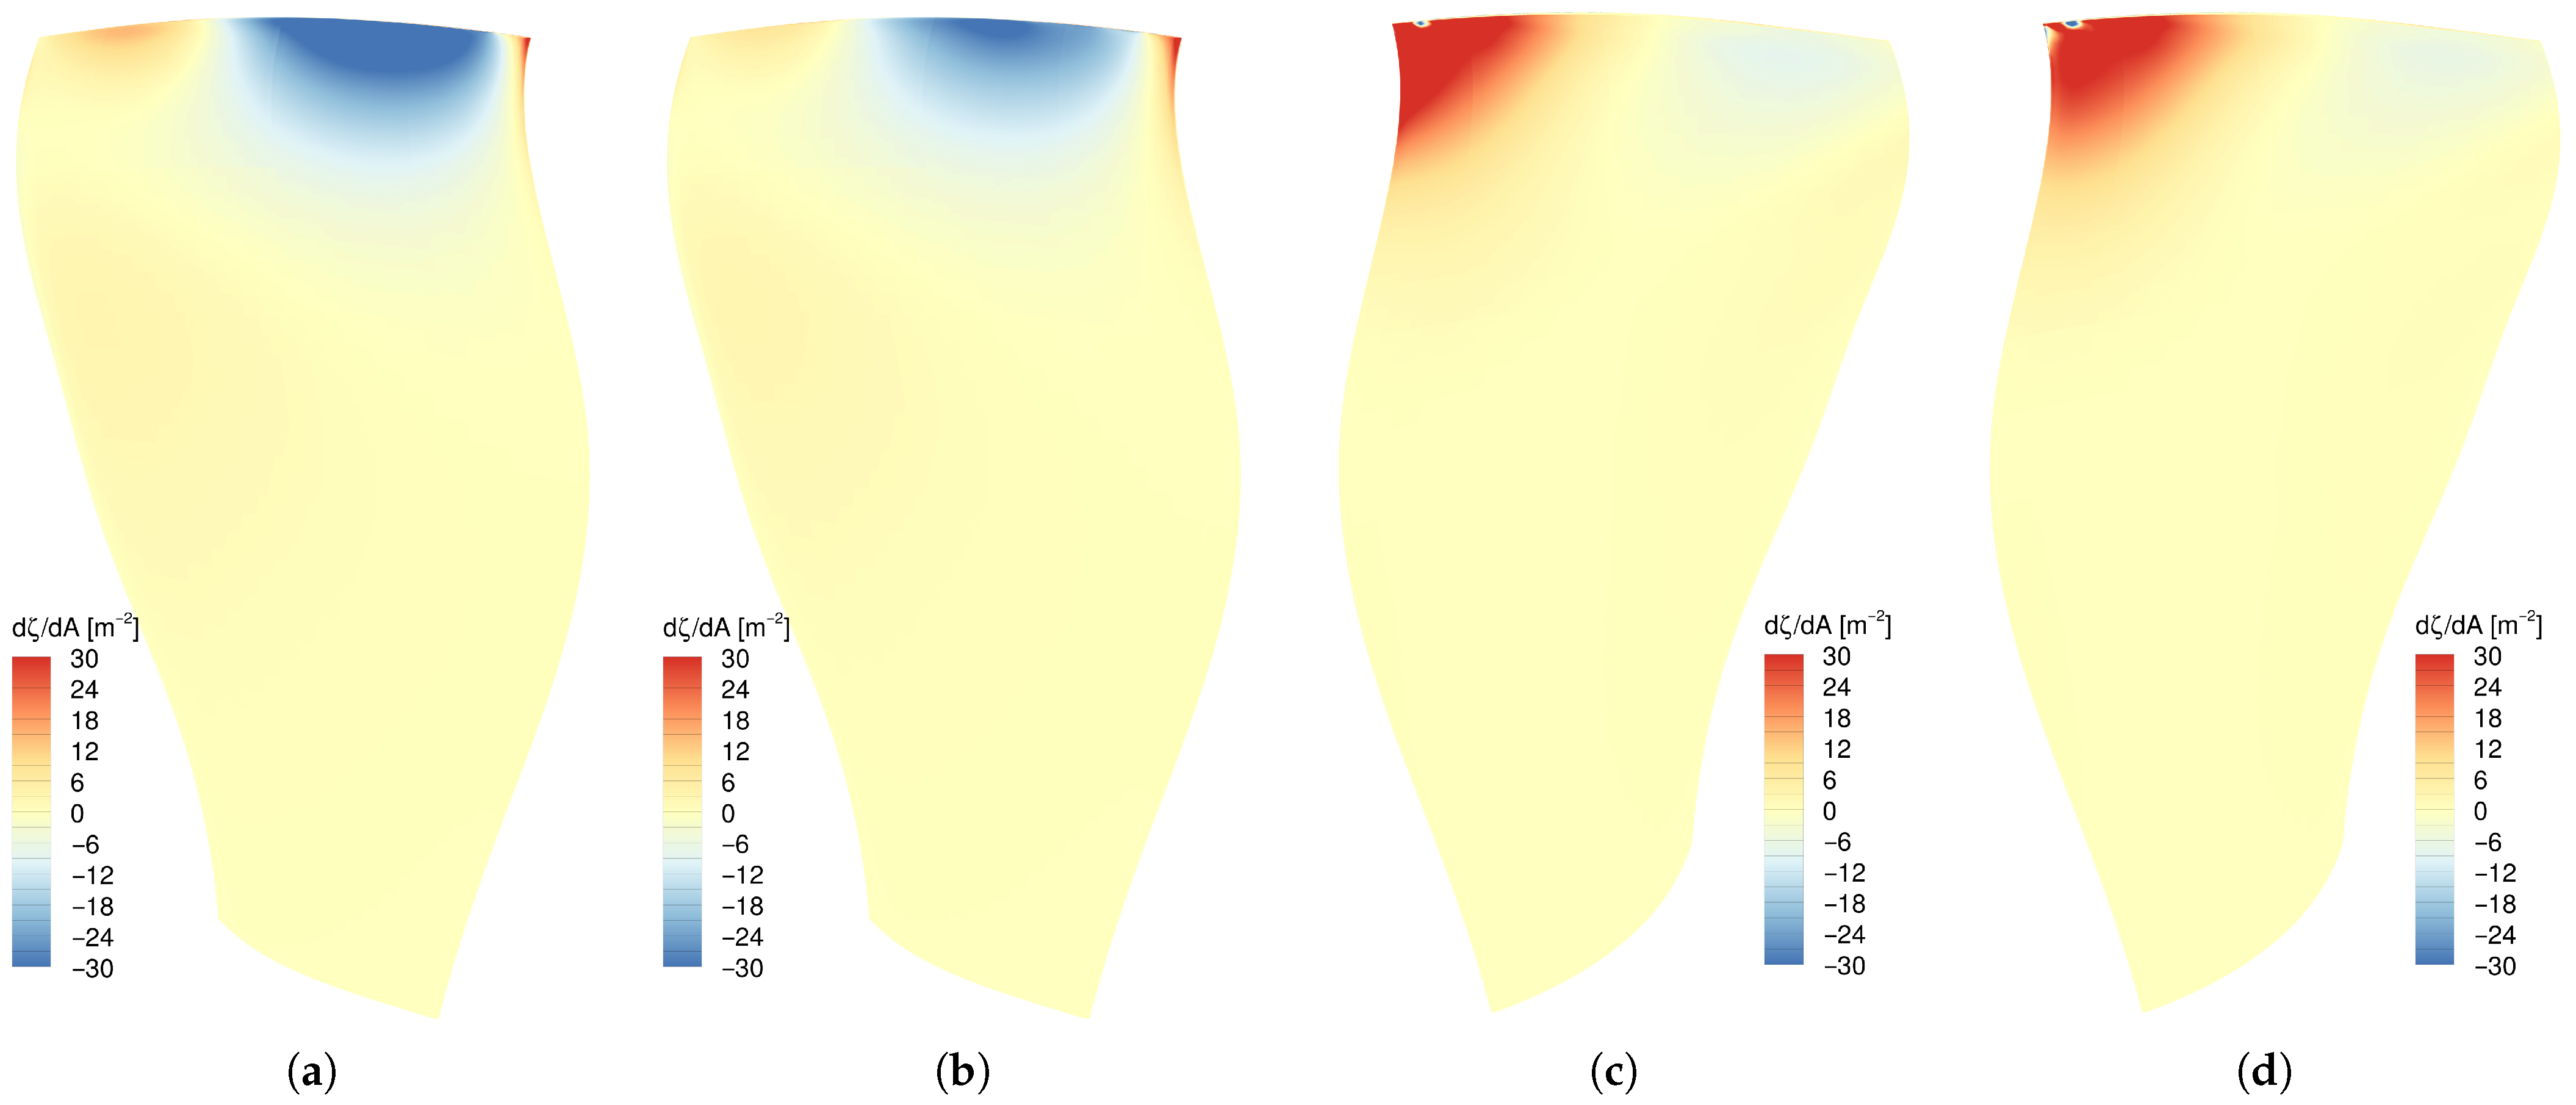
Figure 8 compares the damping ratio per area for
at pressure and suction sides. One can see that the choice of the turbulence model formulation affects both the positive damping zone near the leading edge and the negative damping zone on the upper part of the pressure side.
Figure 7 also compares TRACE results to those obtained by Pagès et al. [
6]. As a first conclusion, we observe that the results here, no matter which formulation of the SST model is used, predict a spike in the aerodynamic curve at
, although not as pronounced as in [
6]. That the other values match so well, however, is remarkable, given that the steady flow in [
6] is obtained with a different solver (elsA) and the unsteady flow response was predicted with a time-linearized solver (Turb’Lin [
20,
21]), which is based on Kok’s
k-
turbulence model [
22]) rather than Menter’s SST model.
For the vibration amplitude used in this section ( ), both the original and the -formulation are robust. When the amplitude is increased by a factor of 10, only simulations with the -formulation are stable.
4. Boundary Conditions
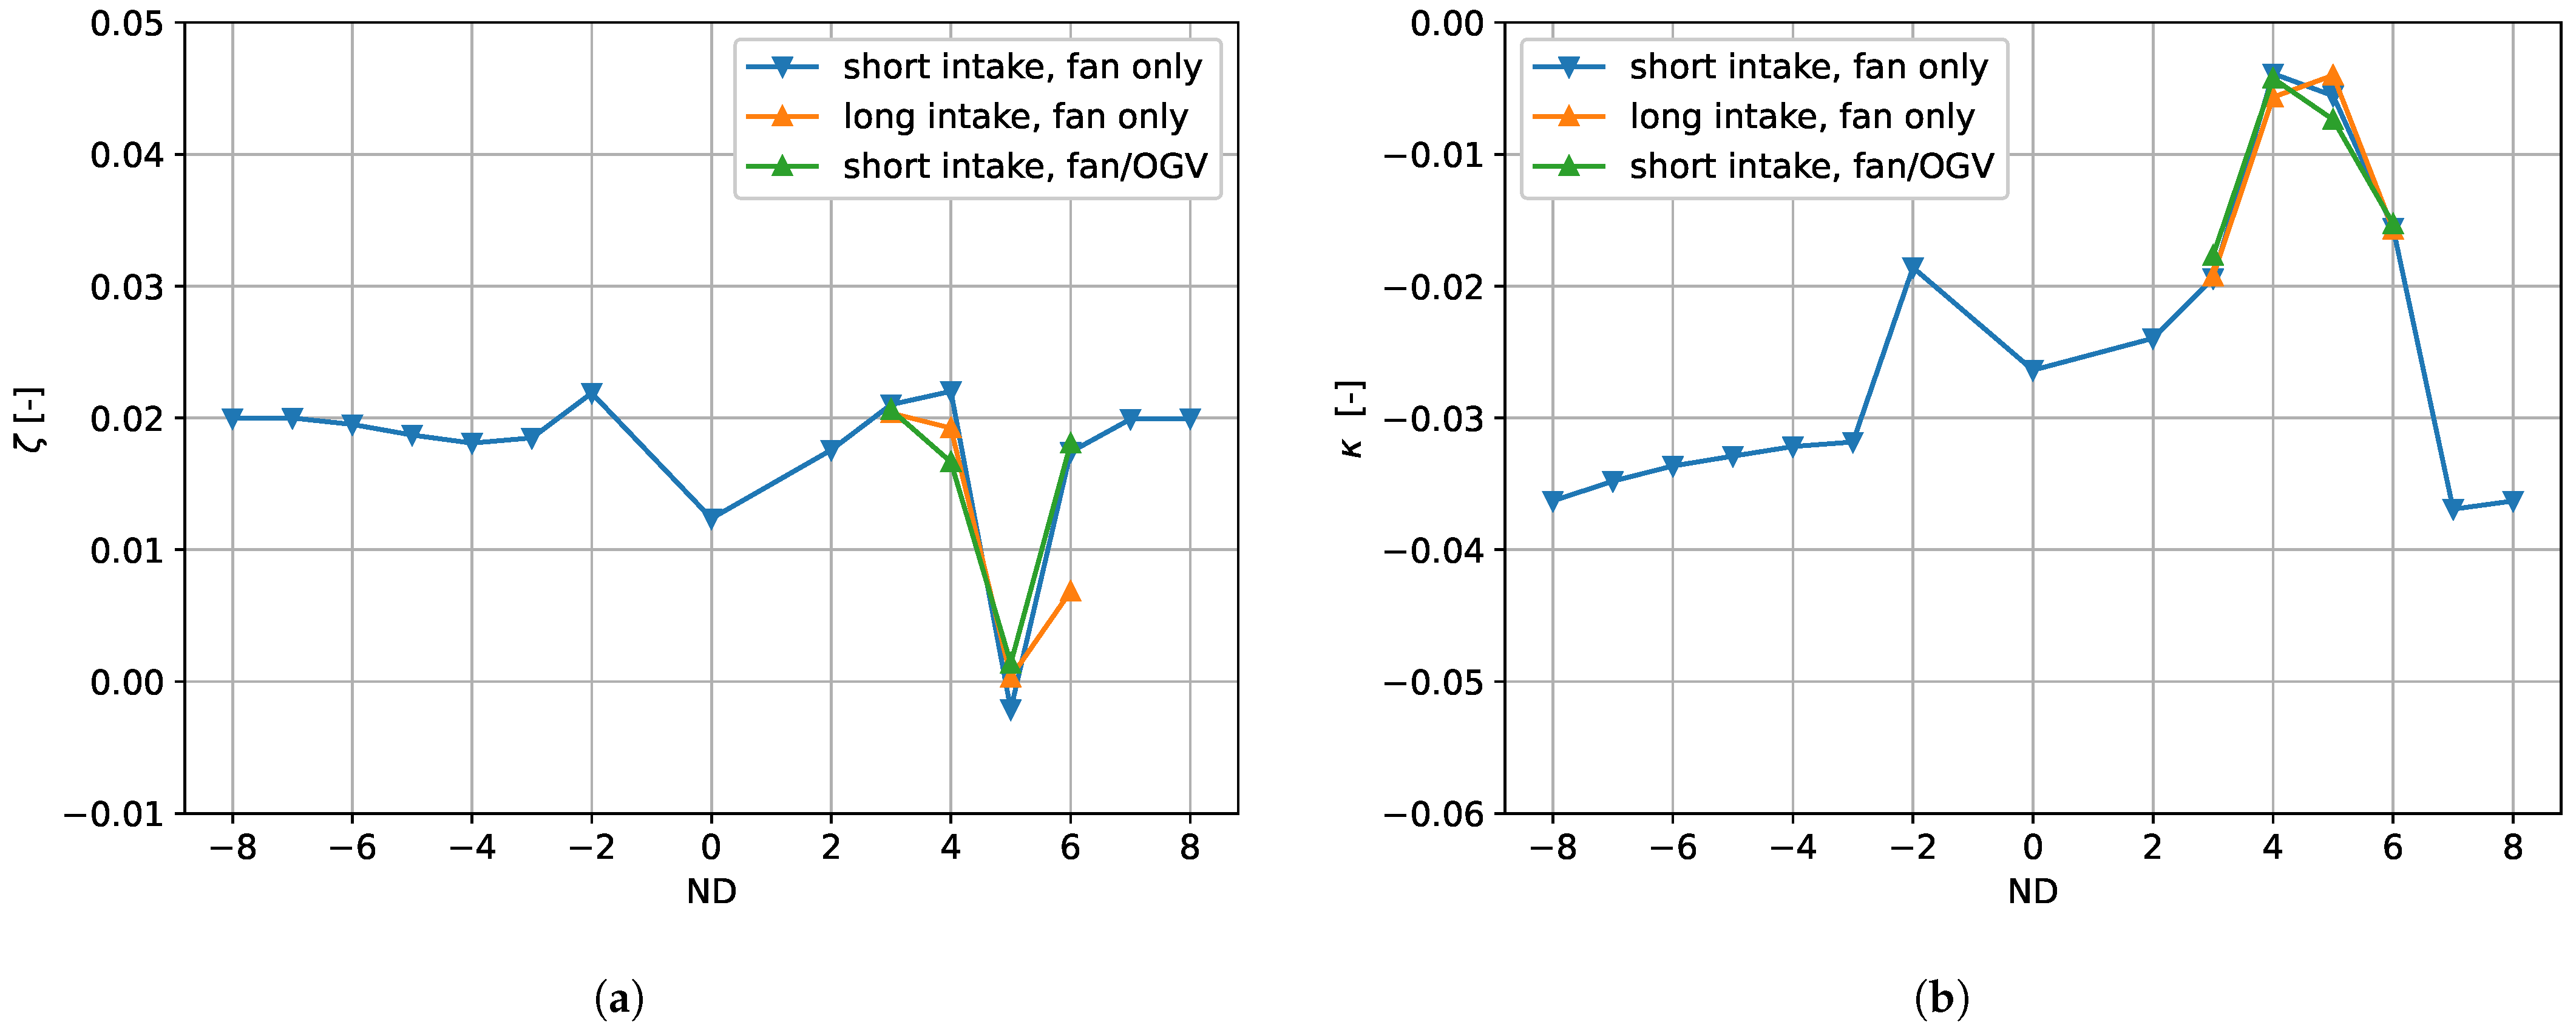
Until now, the analysis used only one harmonic in the rotor domain and non-reflecting boundary conditions. Since these are perfectly non-reflecting only if the flow is inviscid and has no radial component and no radial pressure gradients, numerical reflections are to some extent unavoidable for a real 3D case. To analyze the impact of the boundary conditions, we run, for the nodal diameters 3 to 6, further HB setups. First, the computational domain is extruded at the inlet (cf.
Figure 1). This way we obtain an additional stationary domain, where we prescribe the background flow fields with values extracted from the original inlet. This way we enforce identical flow fields in the rotor domain, thereby circumventing the difficulty of finding equivalent boundary values for the turbulence quantities at a further upstream position. It is now possible in the HB solver to switch on additional modes in this entry section to propagate the disturbances from the rotor domain. This way, we compare the original result, with presumably some numerical reflections at the inlet, to a result with numerical reflections further upstream. A comparison of the damping and stiffness values is shown in
Figure 9.
Moreover, we perform a similar comparison to estimate the impact of reflections with the fan outlet; a harmonic corresponding to the eigenfrequency in the rotor system and the mode order given by the nodal diameter of the blade vibration is simulated in the stator domain. Note, however, that this configuration will not only shift the location of numerical reflections but also simulate the interaction with the OGV. The results have been added to the plot in
Figure 9. Both damping and stiffness vary significantly when the computational domain in which the unsteadiness is resolved is enlarged. In particular, the influence of the upstream boundary condition has a significant impact at the nodal diameter of 6, which is close to the cut-on/cut-off boundary for the inflow; cf. [
6]. Similarly, the influence of the OGV domain can be seen, although less pronounced, for the nodal diameter of 4, which was found by Pagès et al. [
6] to be very near the cut-on/cut-off boundary for the outflow.
Regarding the spike at nodal diameter 5, however, reflections at the boundaries and interactions with the OGV seem insufficient to explain the sudden drop in the damping. Recall from Equations (
1) and (
2) that damping and stiffness together represent complex aerodynamic work. Since the stiffness is not very sensitive either, we can therefore exclude the possibility that it is solely due to the phase of the reflected mode that the modal force, due to the reflection, has little impact on damping for the nodal diameter of 5.
The results above indicate that the aerodynamic damping computed in this work will have significant uncertainty near the cut-on/cut-off boundaries due to the inlet and outlet boundary conditions. Apart from these points, their impact seems limited. Note that, apart from numerical reflections, interactions with the intake may also alter the flutter characteristics [
23,
24]. This phenomenon, however, is not studied here; the ideal flow solution would be one on a domain with infinitely long entries and exits.
5. Near-Resonance Frequency
As was suspected by Pagès et al. [
6], the spikes in the damping curve could indicate a resonance with a convective disturbance that travels with a particular relative circumferential speed
.
For a blade vibration with angular frequency
and nodal diameter
Nd to be in resonance with such a disturbance, the condition
with some integer
l has to be satisfied. This convective disturbance must have the angular frequency
and the circumferential mode order equal to
.
As previous studies have shown [
25], small disturbances can separate from the leading edge and travel, in the rotating frame of reference, with a specific speed in the range of
and
times the fan rotational speed. For the given eigenfrequency and a resonance near
, the only value for
l to give circumferential speeds in this range is
.
To determine possible convective resonance frequencies, the eigenfrequency for the nodal diameters 3 to 6 has been varied, ranging from
to
with steps of
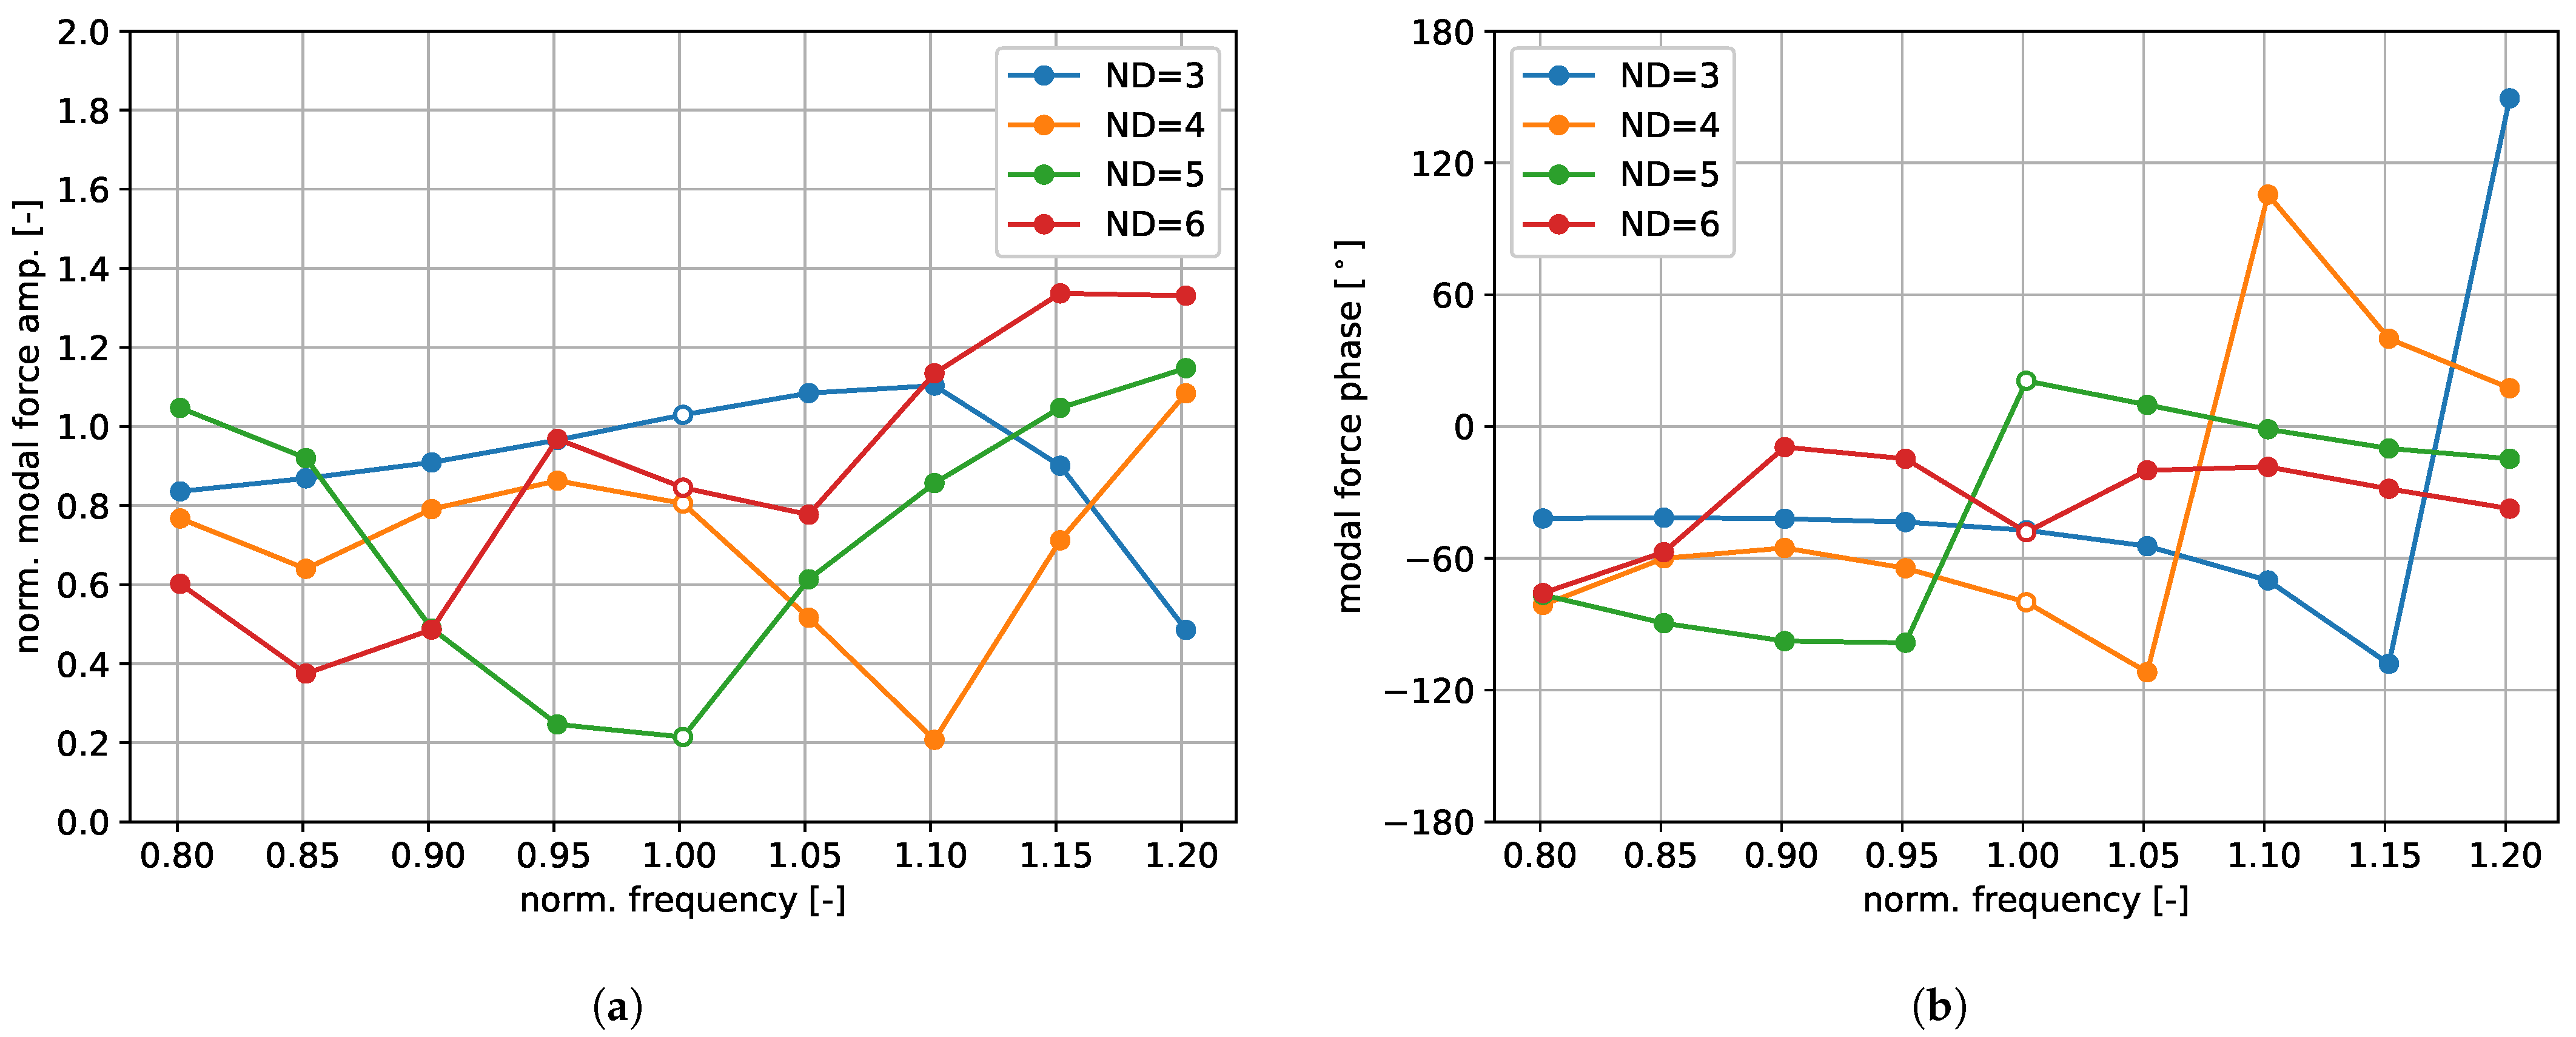
. The resulting aerodynamic modal force over frequency, the latter normalized with the original one, is shown in
Figure 10. Here, the modal force is shown in terms of its amplitude and phase, as these are more appropriate to study the frequency response of an externally excited system near resonance. For instance, a forced mass–spring–damper system exhibits a sudden phase change near the resonance frequency. Note that a phase in the range between
and
indicates negative aerodynamic damping. Especially for the nodal diameters 3, 4, and 5, one obtains a sudden change in the phase. The phase of the flow response here, at least in terms of the aerodynamic force, is thus reminiscent of that of a forced mass–spring–damper system near resonance.
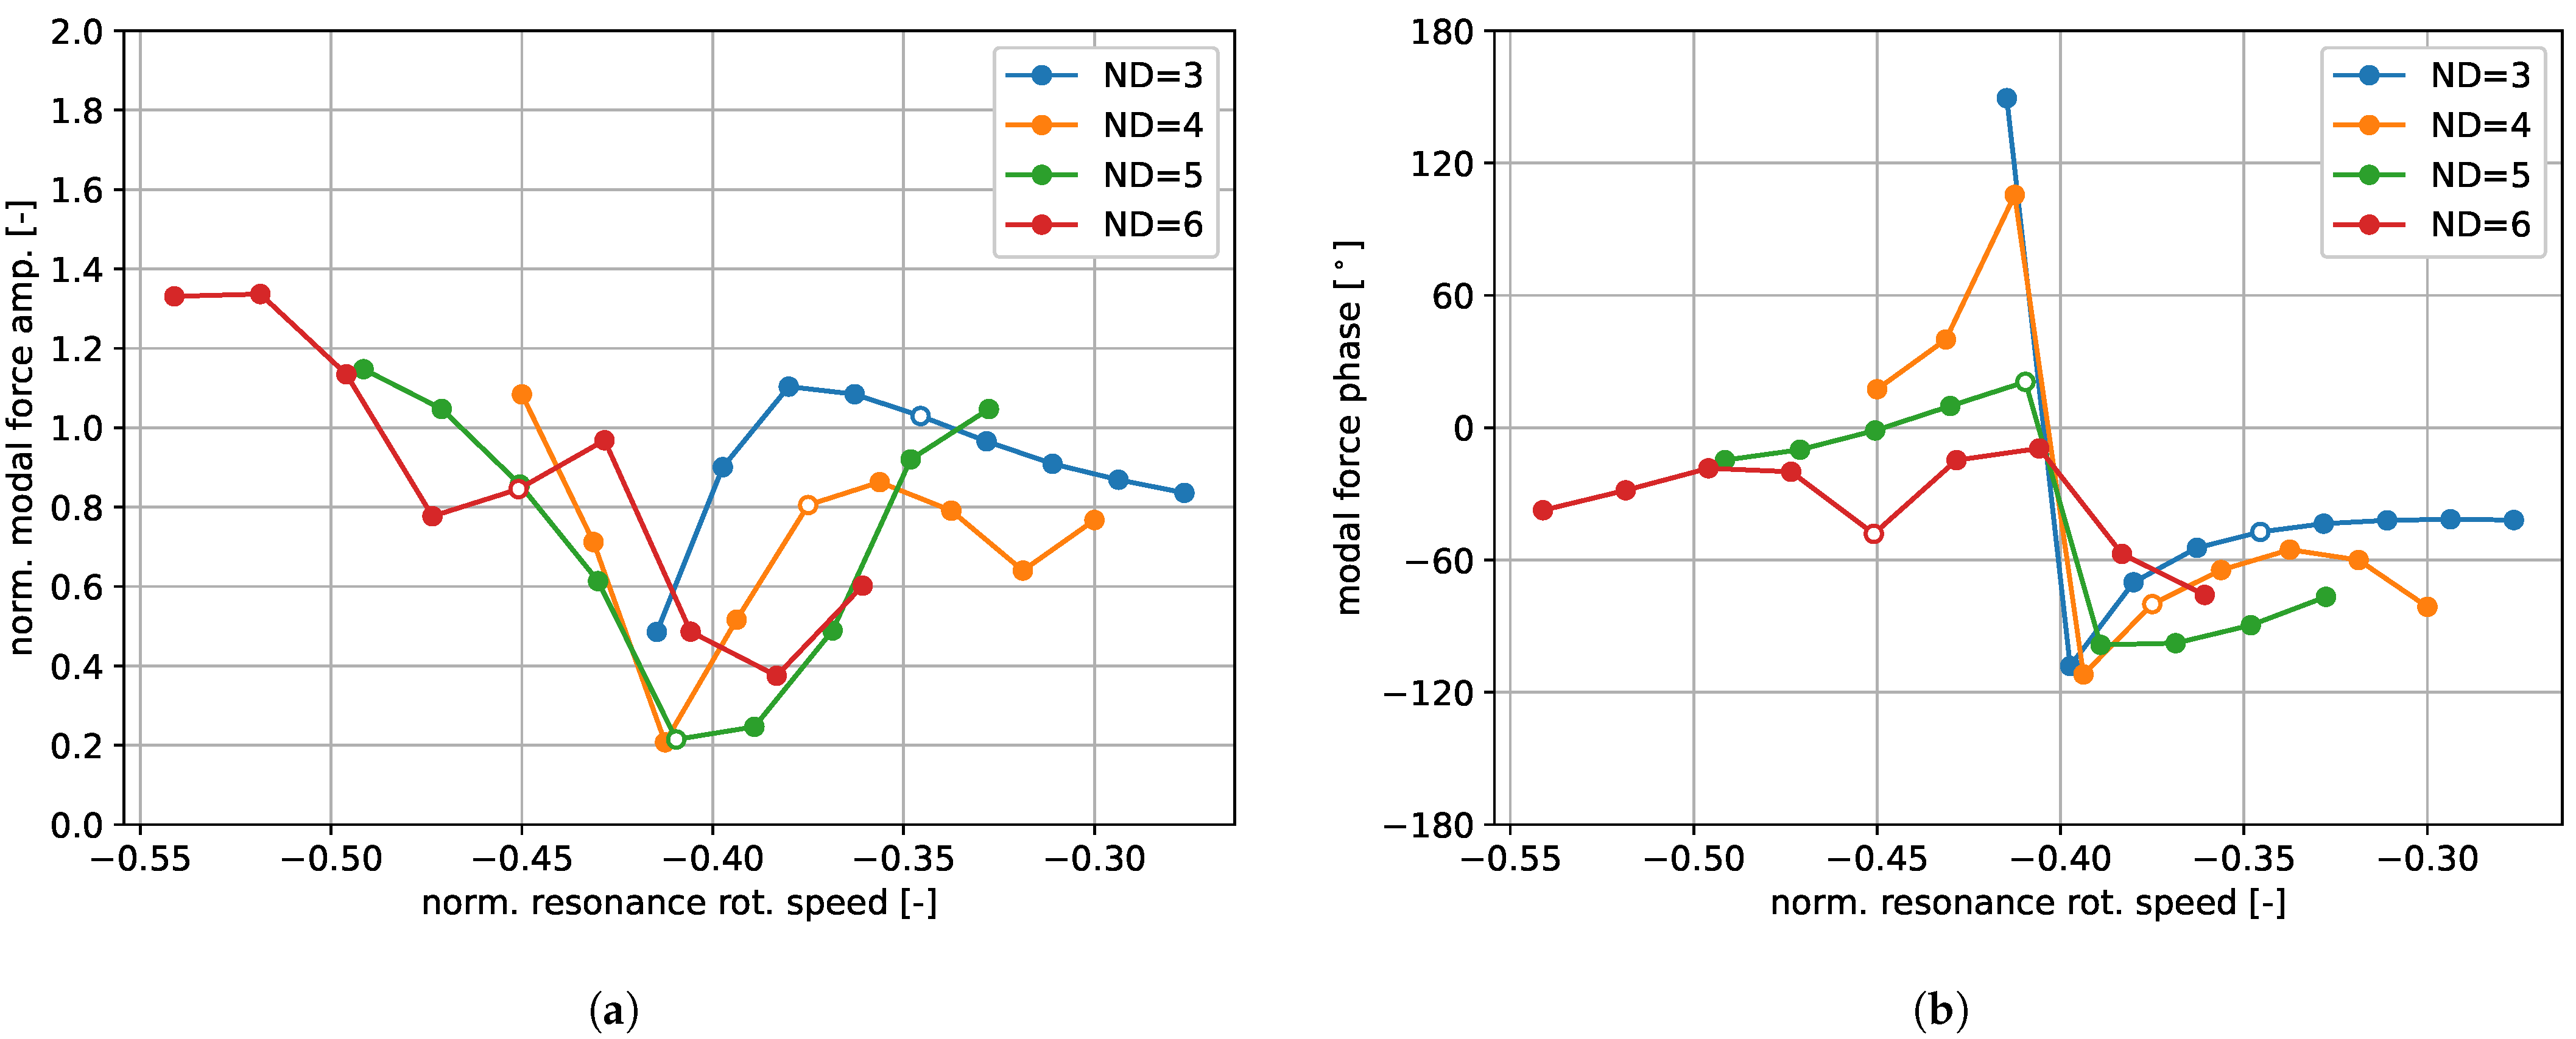
To understand the location of the sudden phase changes, one can relate the frequency to a corresponding circumferential speed via Equation (
7) with
. The same results as in
Figure 10, but over this potential resonance rotational speed, are shown in
Figure 11. With the given numerical setup, resonance can be seen to occur at a relative rotation speed of
. Note also that the nodal diameters 3 and 4 with an appropriate increase in the eigenfrequency (10% and 20%, respectively) change from stable to unstable.
6. Nonlinear Flow Response
Until now, the flutter analysis has been based on the assumption that the flow response to the blade vibration is linear. Pages et al. [
6] point out that the unsteady solution that is obtained with their time-linearized solver for
yields implausibly high pressure amplitudes even for a relatively small vibration amplitude. It can therefore be suspected that, if those flow responses were valid for infinitesimal amplitudes, then, for the displacements considered here, nonlinear effects would have to set it. We therefore address the question about the applicability of the linearization hypothesis in this section. Note that harmonic balance is particularly suited to study nonlinearity as it is, in the limit of infinitely many harmonics, capable of reproducing stable periodic solutions for the nonlinear system [
26]. As mentioned above, the
-formulation of the SST model is used for this purpose.
It has been observed that when nonlinear effects set in, these have a considerable impact on the time-averaged fan outflow. Simulations with the isolated fan and a given pressure profile at its outlet showed significant shifts in the operating point. Therefore, the following results were obtained on a computational domain that included the stator domain with a nozzle. The flow in the stator domain is resolved with the 0th harmonic only, its major role being that of a mass flow controller. Hence, no effects of a possible vane reflection or nonlinear mechanisms in the OGV domain are taken into account here.
We focus here on three questions about the aerodynamic damping and stiffness ratios:
- Q1
What is the dependence on the vibration amplitude?
- Q2
At what amplitudes do higher harmonics play a role?
- Q3
What is the impact on the mean flow?
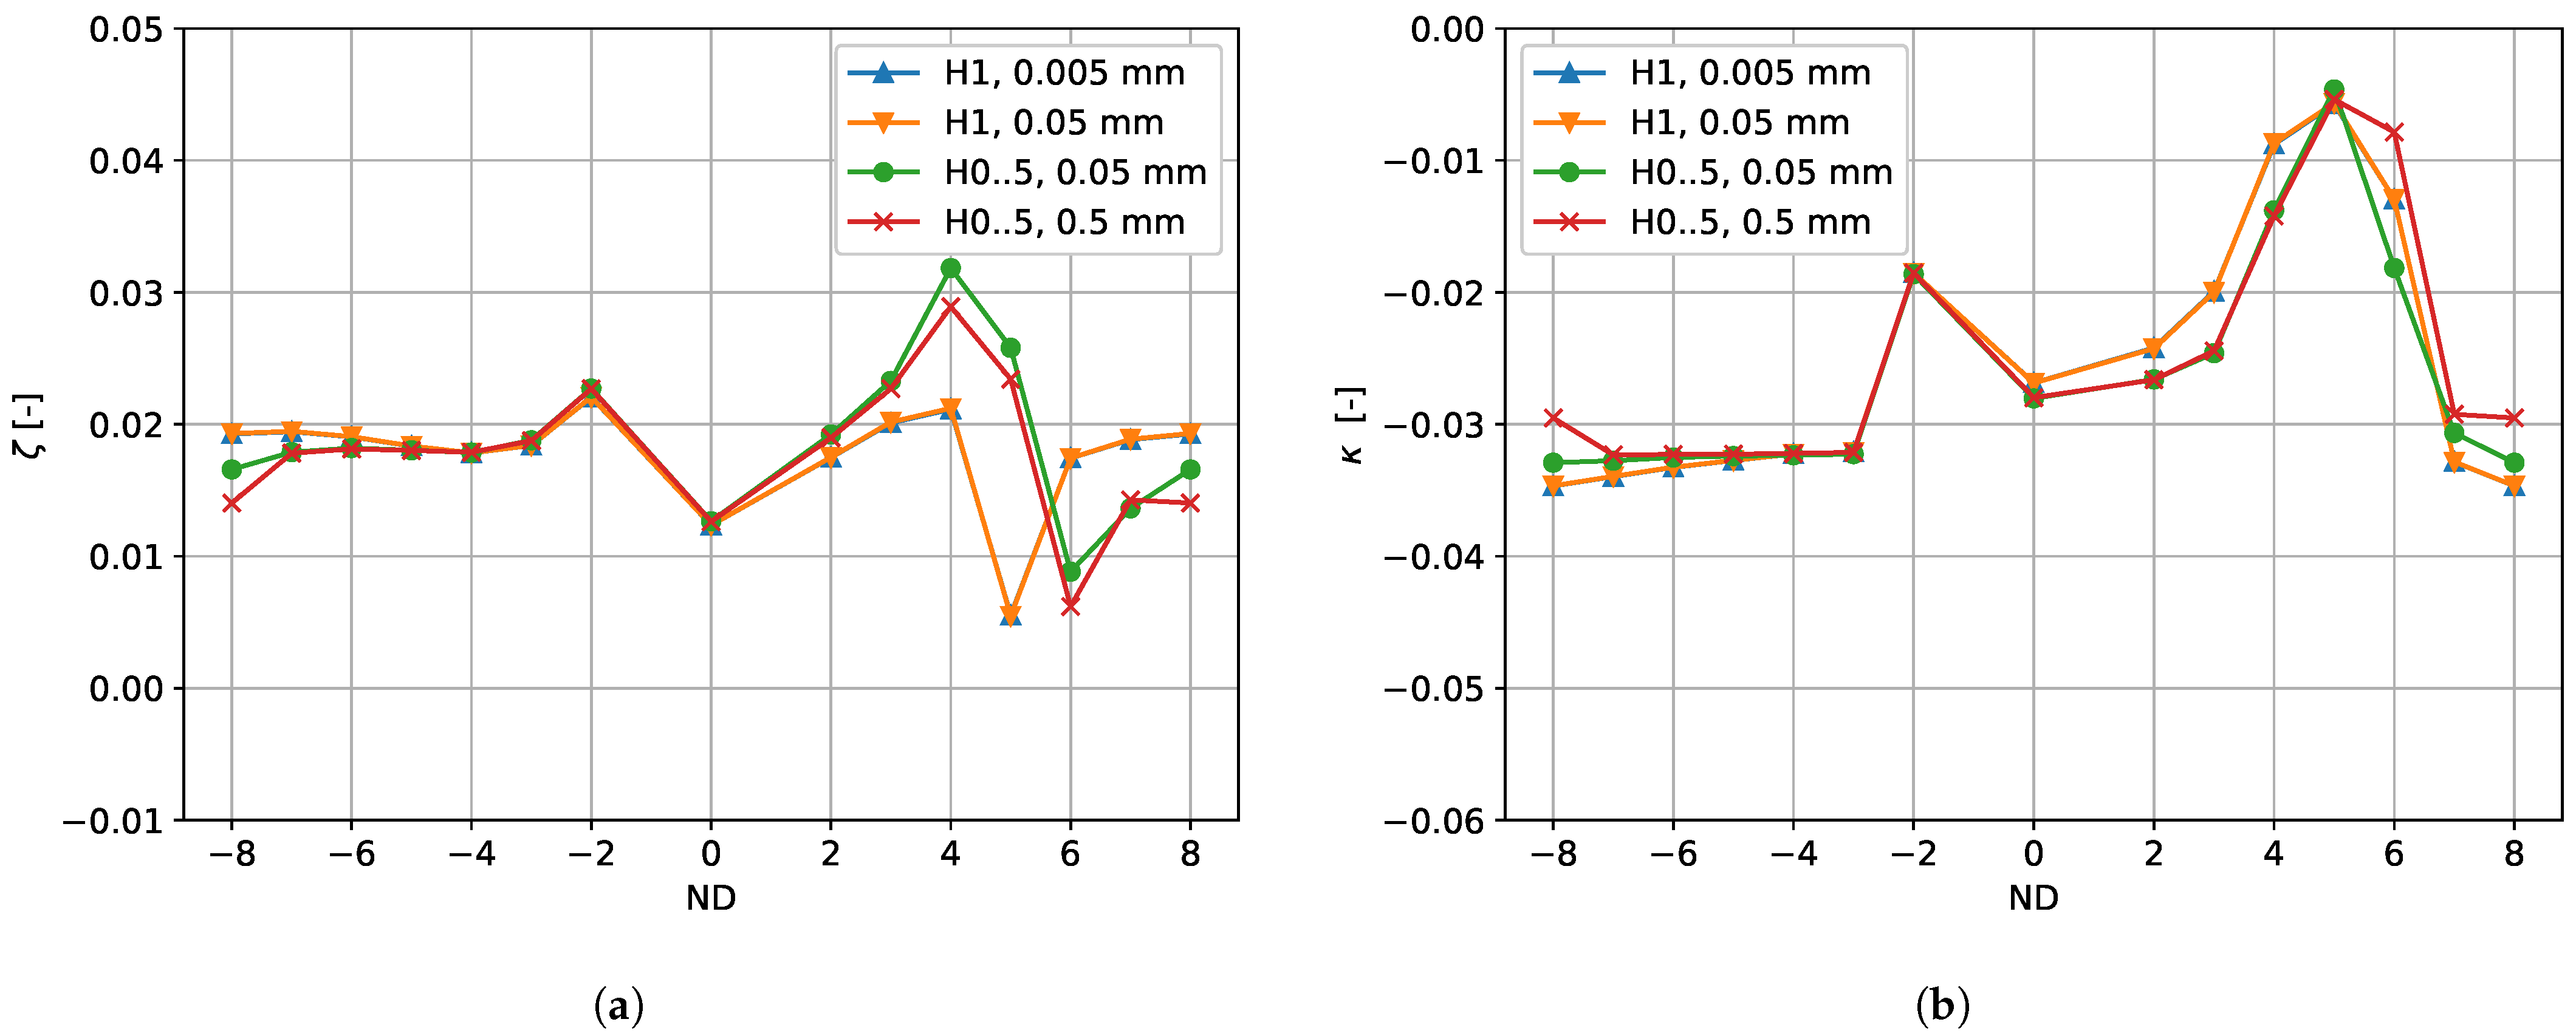
Due to the setup chosen in the previous sections (“HB1”), all effects related to questions Q2 and Q3 were suppressed by the approach. Note, however, that regarding Q1, there will possibly be a nonlinear amplitude dependence in the HB1-simulations, as the flow residuals are not linearized. A flutter analysis with a reduced amplitude and just the first harmonic (H1), however, shows almost no change in damping and stiffness. The results for an amplitude of
are shown in
Figure 12. There is practically no dependence on the amplitude, which demonstrates that the results in the previous sections were obtained for amplitudes still in the linear regime.
The flutter analysis has also been repeated with an HB setup that solves for the mean flow and five higher harmonics (HB0..5). Here, we ran the original displacement amplitude and one that was increased by a factor of 10. The results have been added to
Figure 12. For the nodal diameter of 3, 4, and 5, the aerodynamic damping is significantly higher for the HB0..5 setups, while there is little difference for the negative nodal diameters. Most strikingly, the spike at
seems to have shifted to the right, and the minimum damping is now located at
.
To understand the nonlinear mechanisms behind the shift for nodal diameters close to 5, two further HB setups without blade vibration but with the interblade phase angle and frequency corresponding to the flutter analysis for
were run: one with five (HB0..5) and one with ten higher harmonics (HB0..10). Both simulations were initialized with the result for the vibration amplitude of
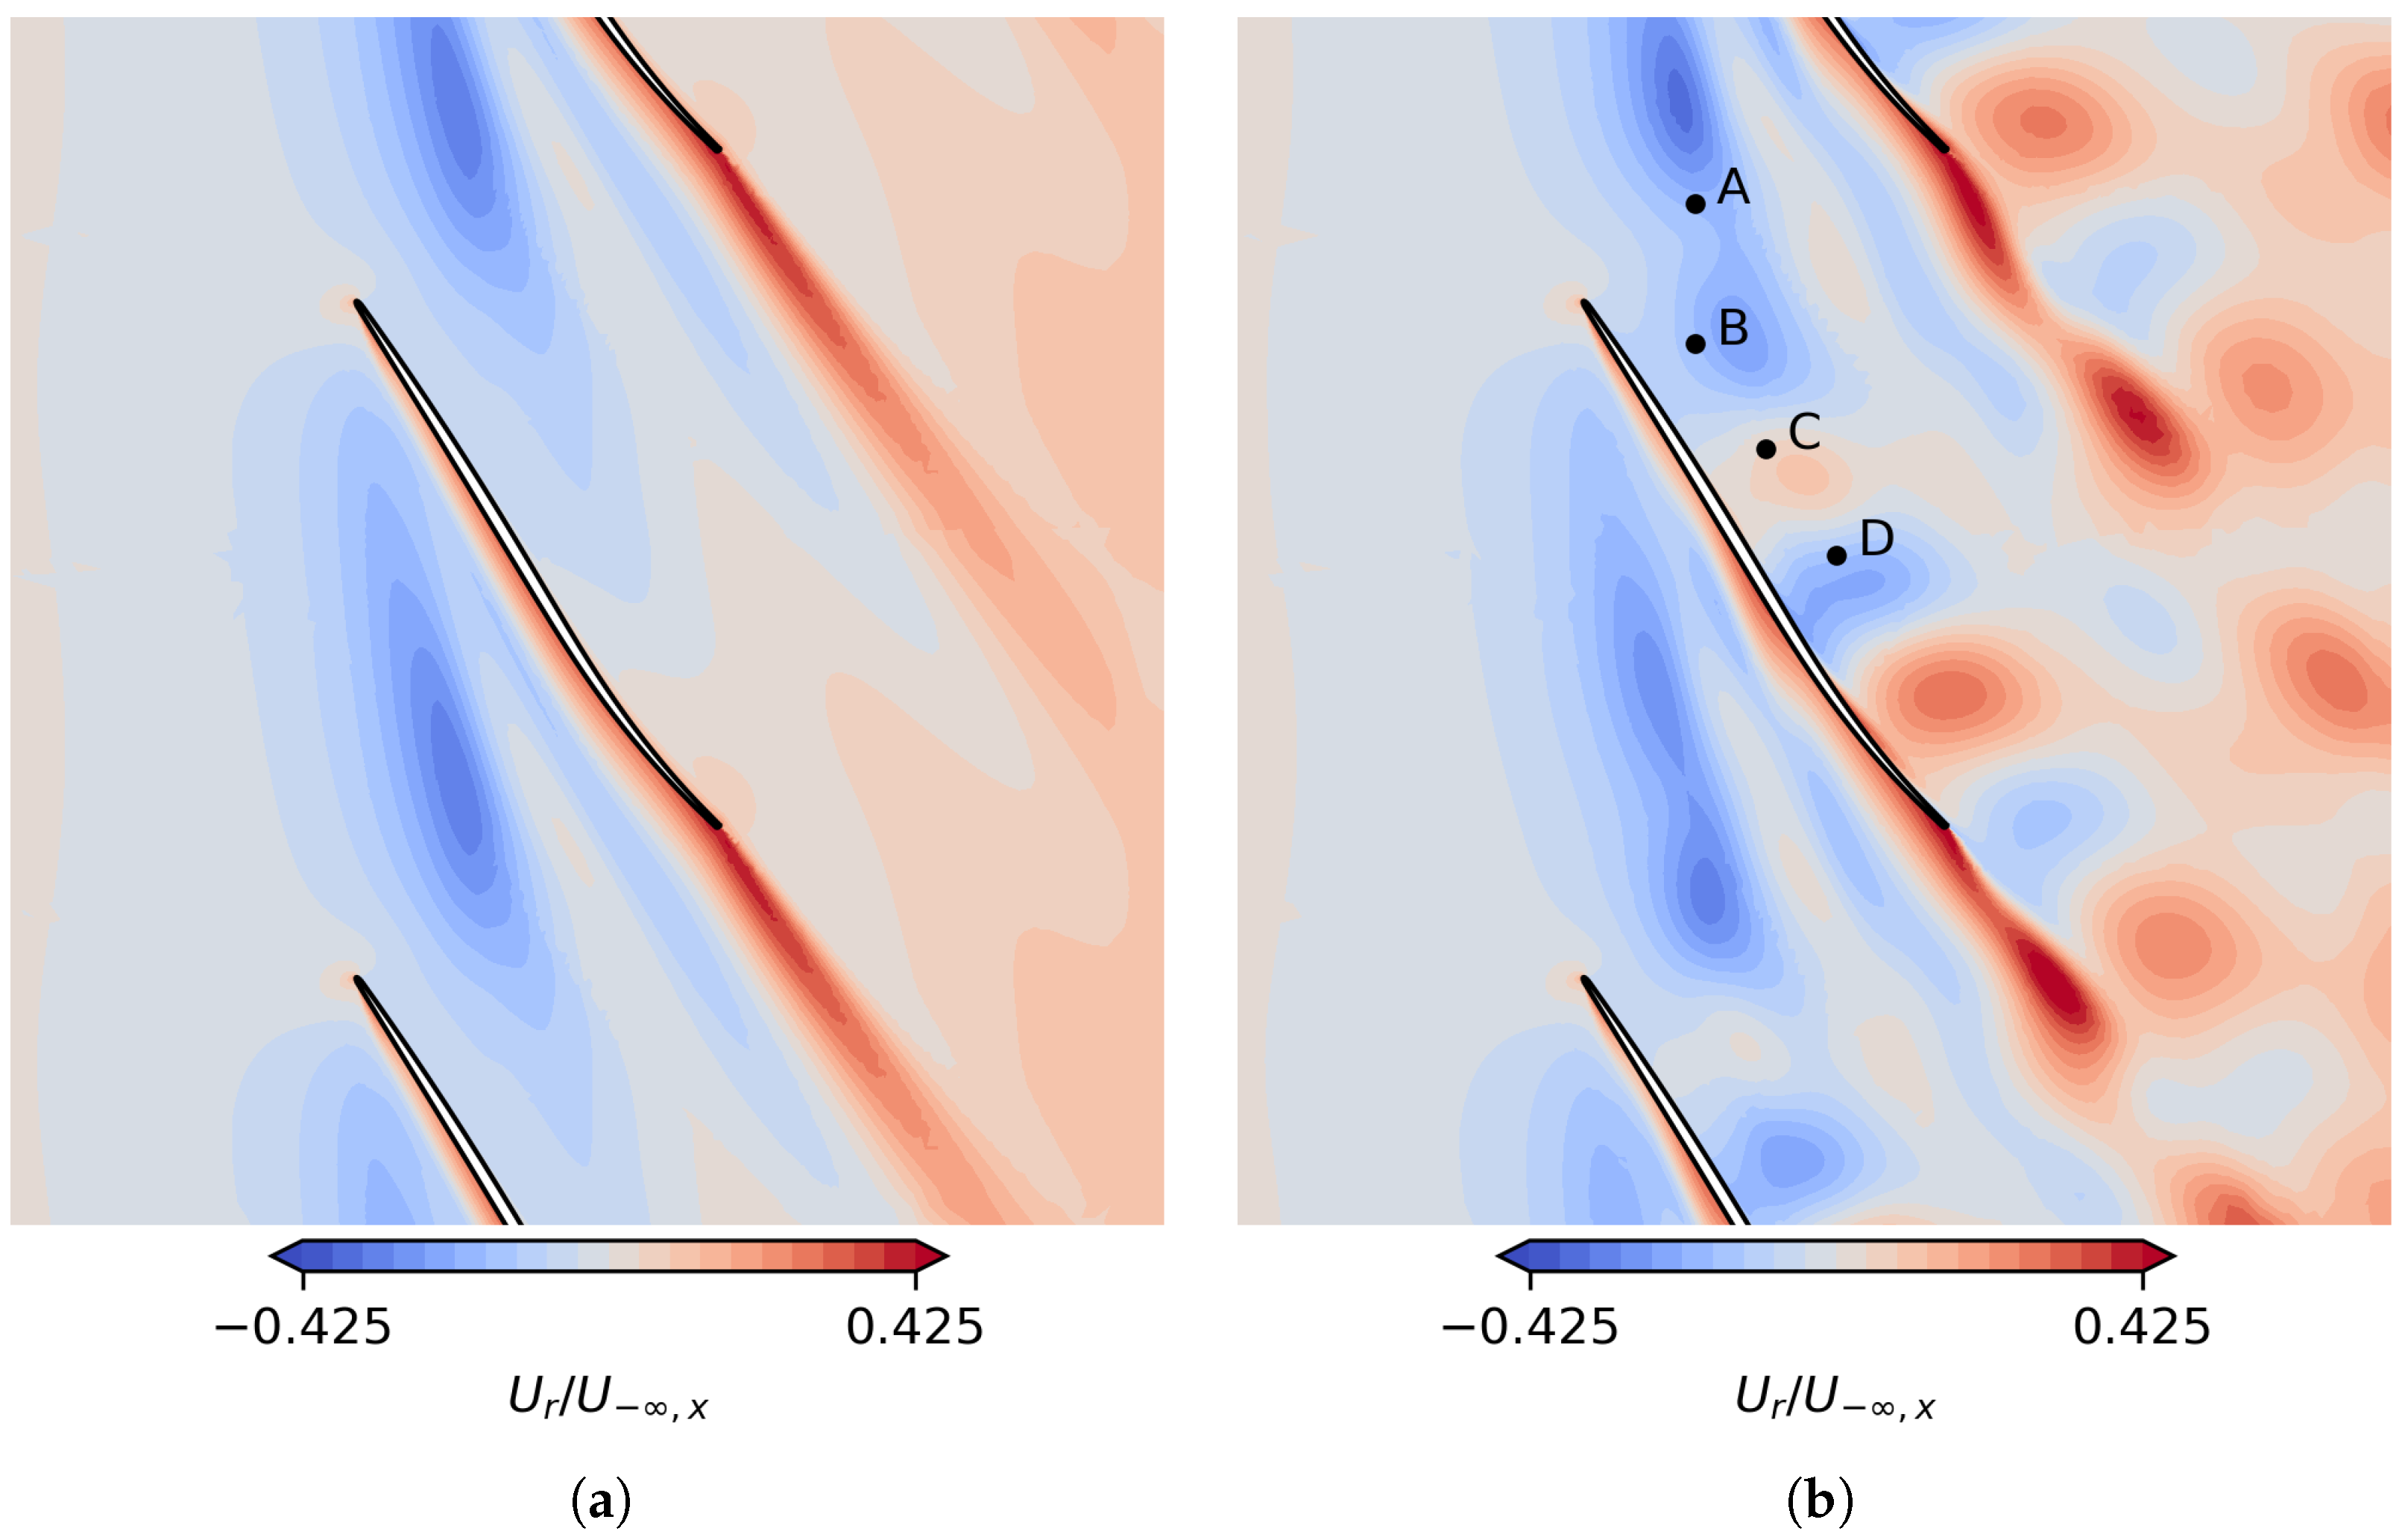
. It turns out that, rather than return to a steady flow, the harmonic balance solver then seems to approach a limit cycle. The plot in
Figure 13 compares the steady solution with a snapshot that was reconstructed from the HB0..5 solution. Note that for self-induced flow instabilities, harmonic balance solvers tend to approach a limit cycle as has been observed by several authors; see, e.g., the work of Spiker et al. [
27].
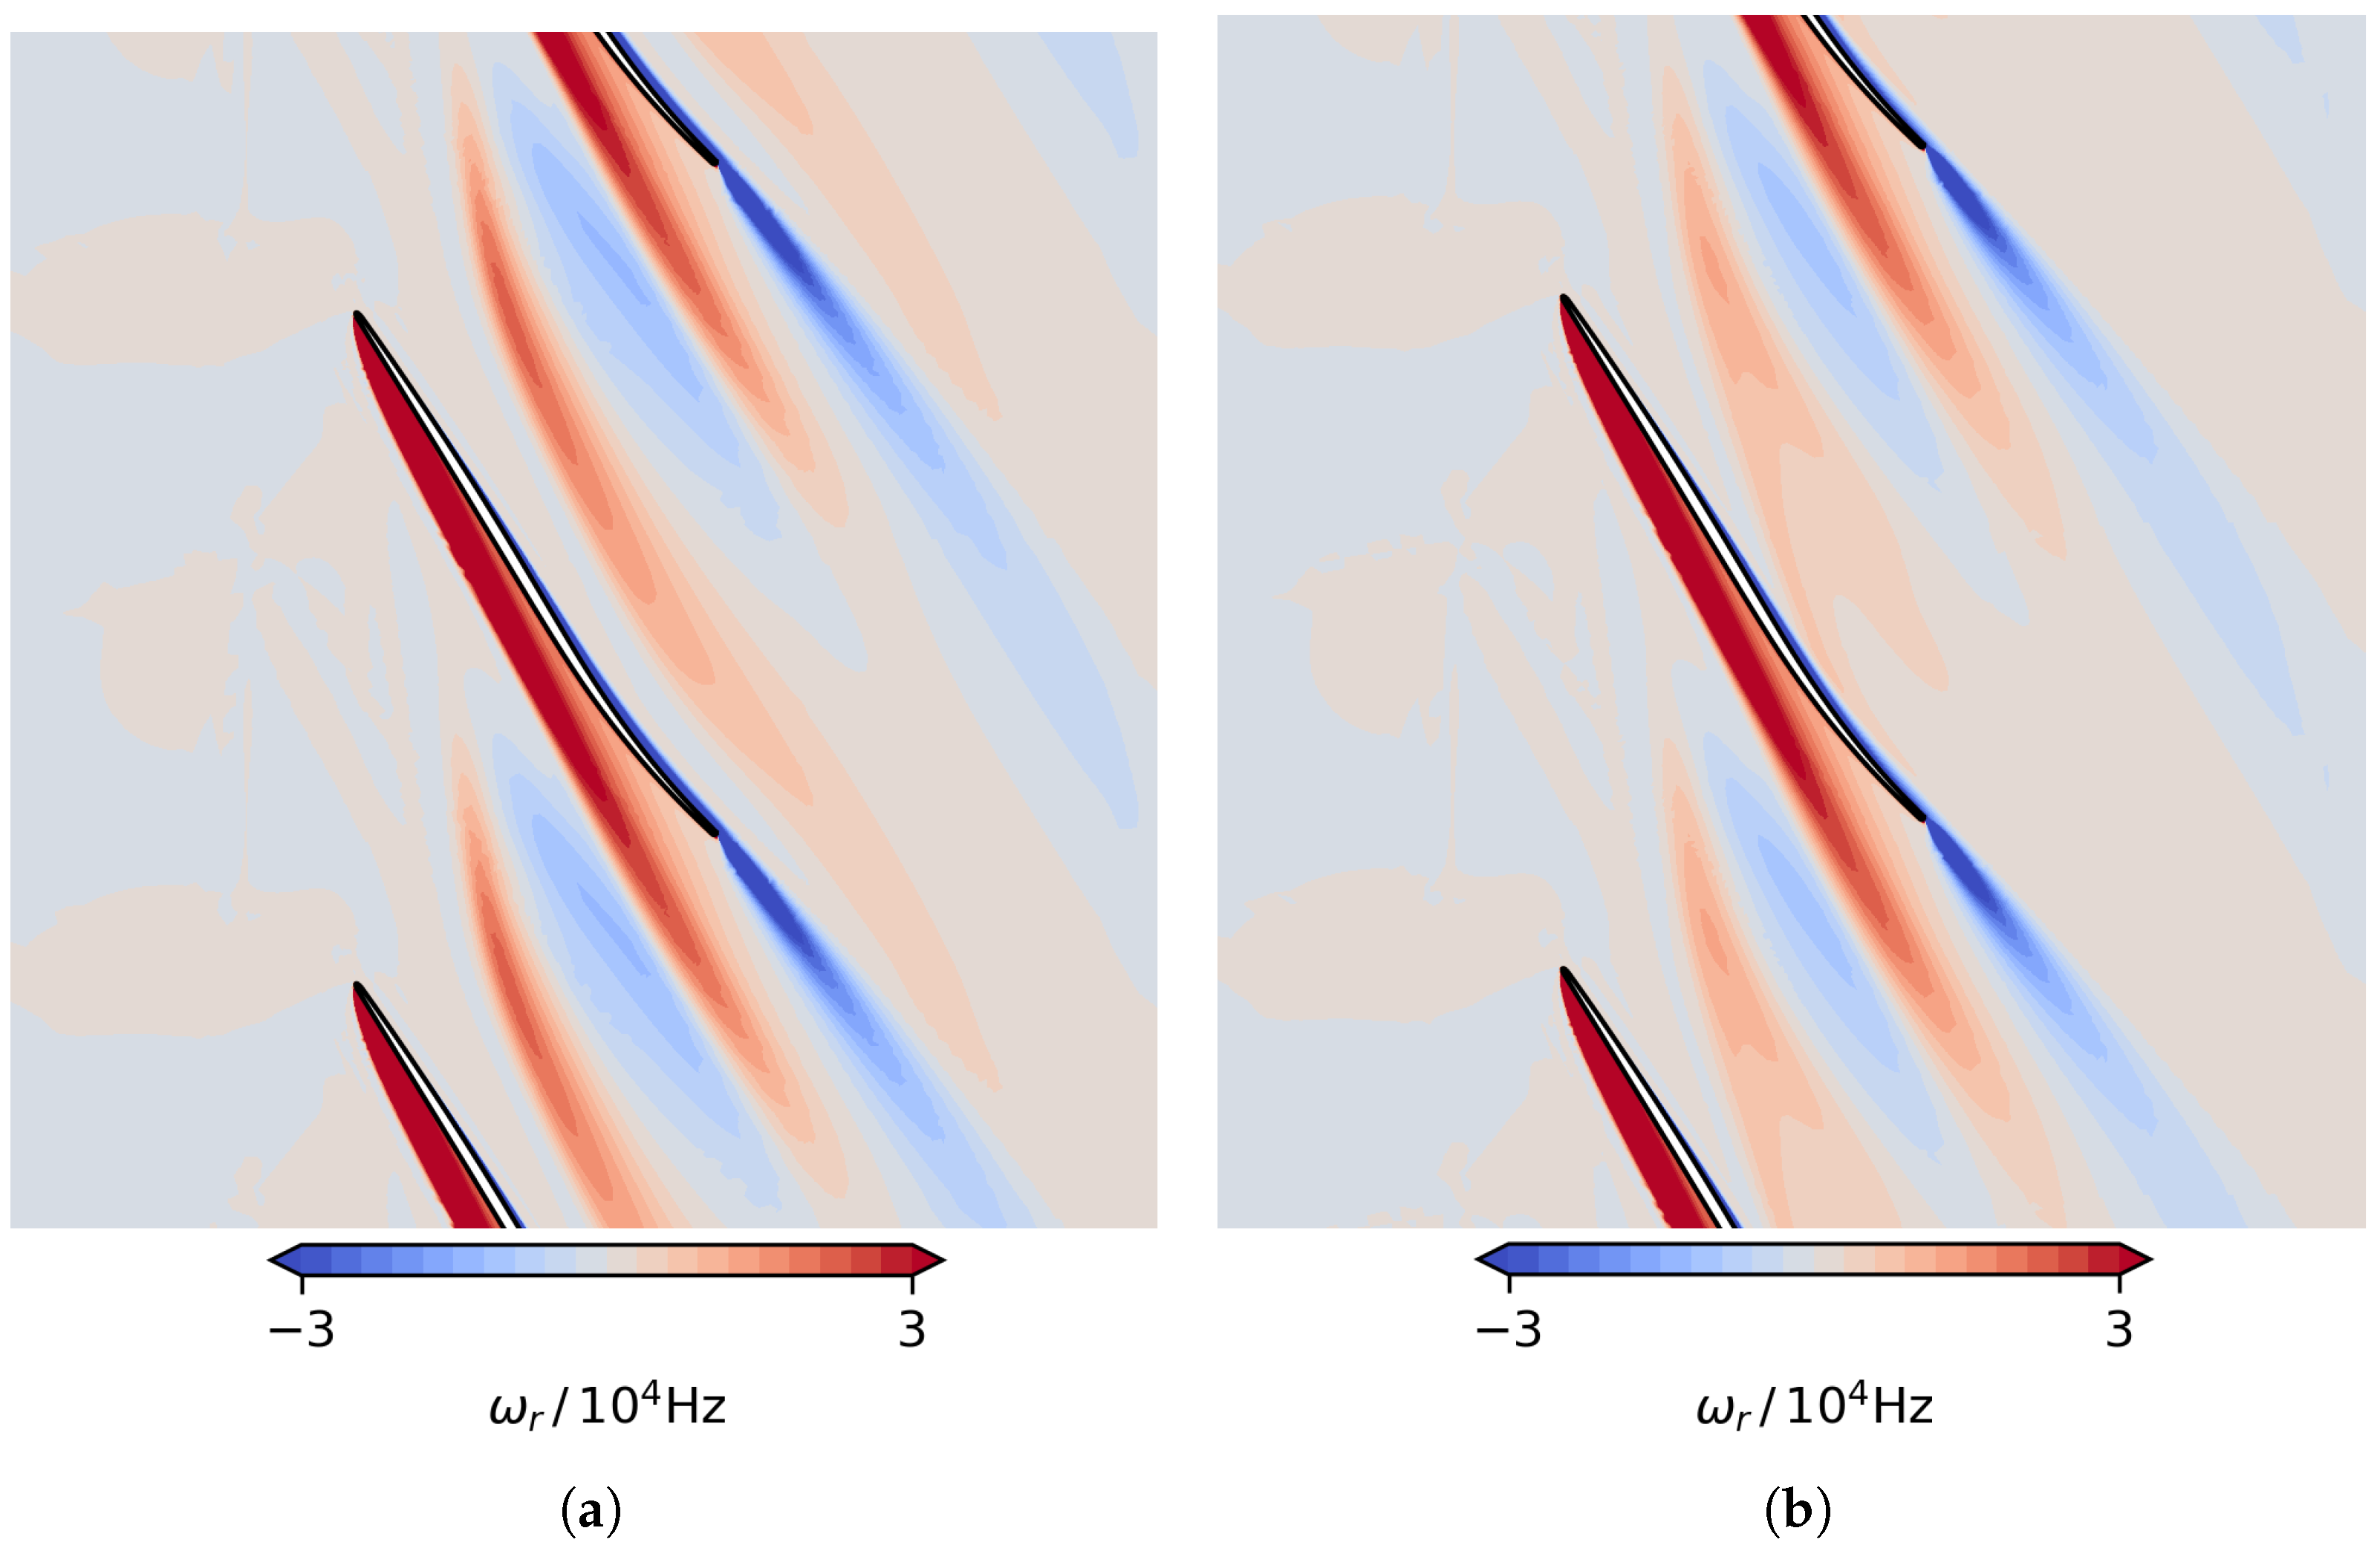
Figure 14 shows the impact of the unsteadiness on the mean flow in terms of the radial vorticity. The plot compares the steady solution to the time-averaged result of the HB0..5 simulation and shows that the self-induced flow instability has a strong influence on the mean flow.
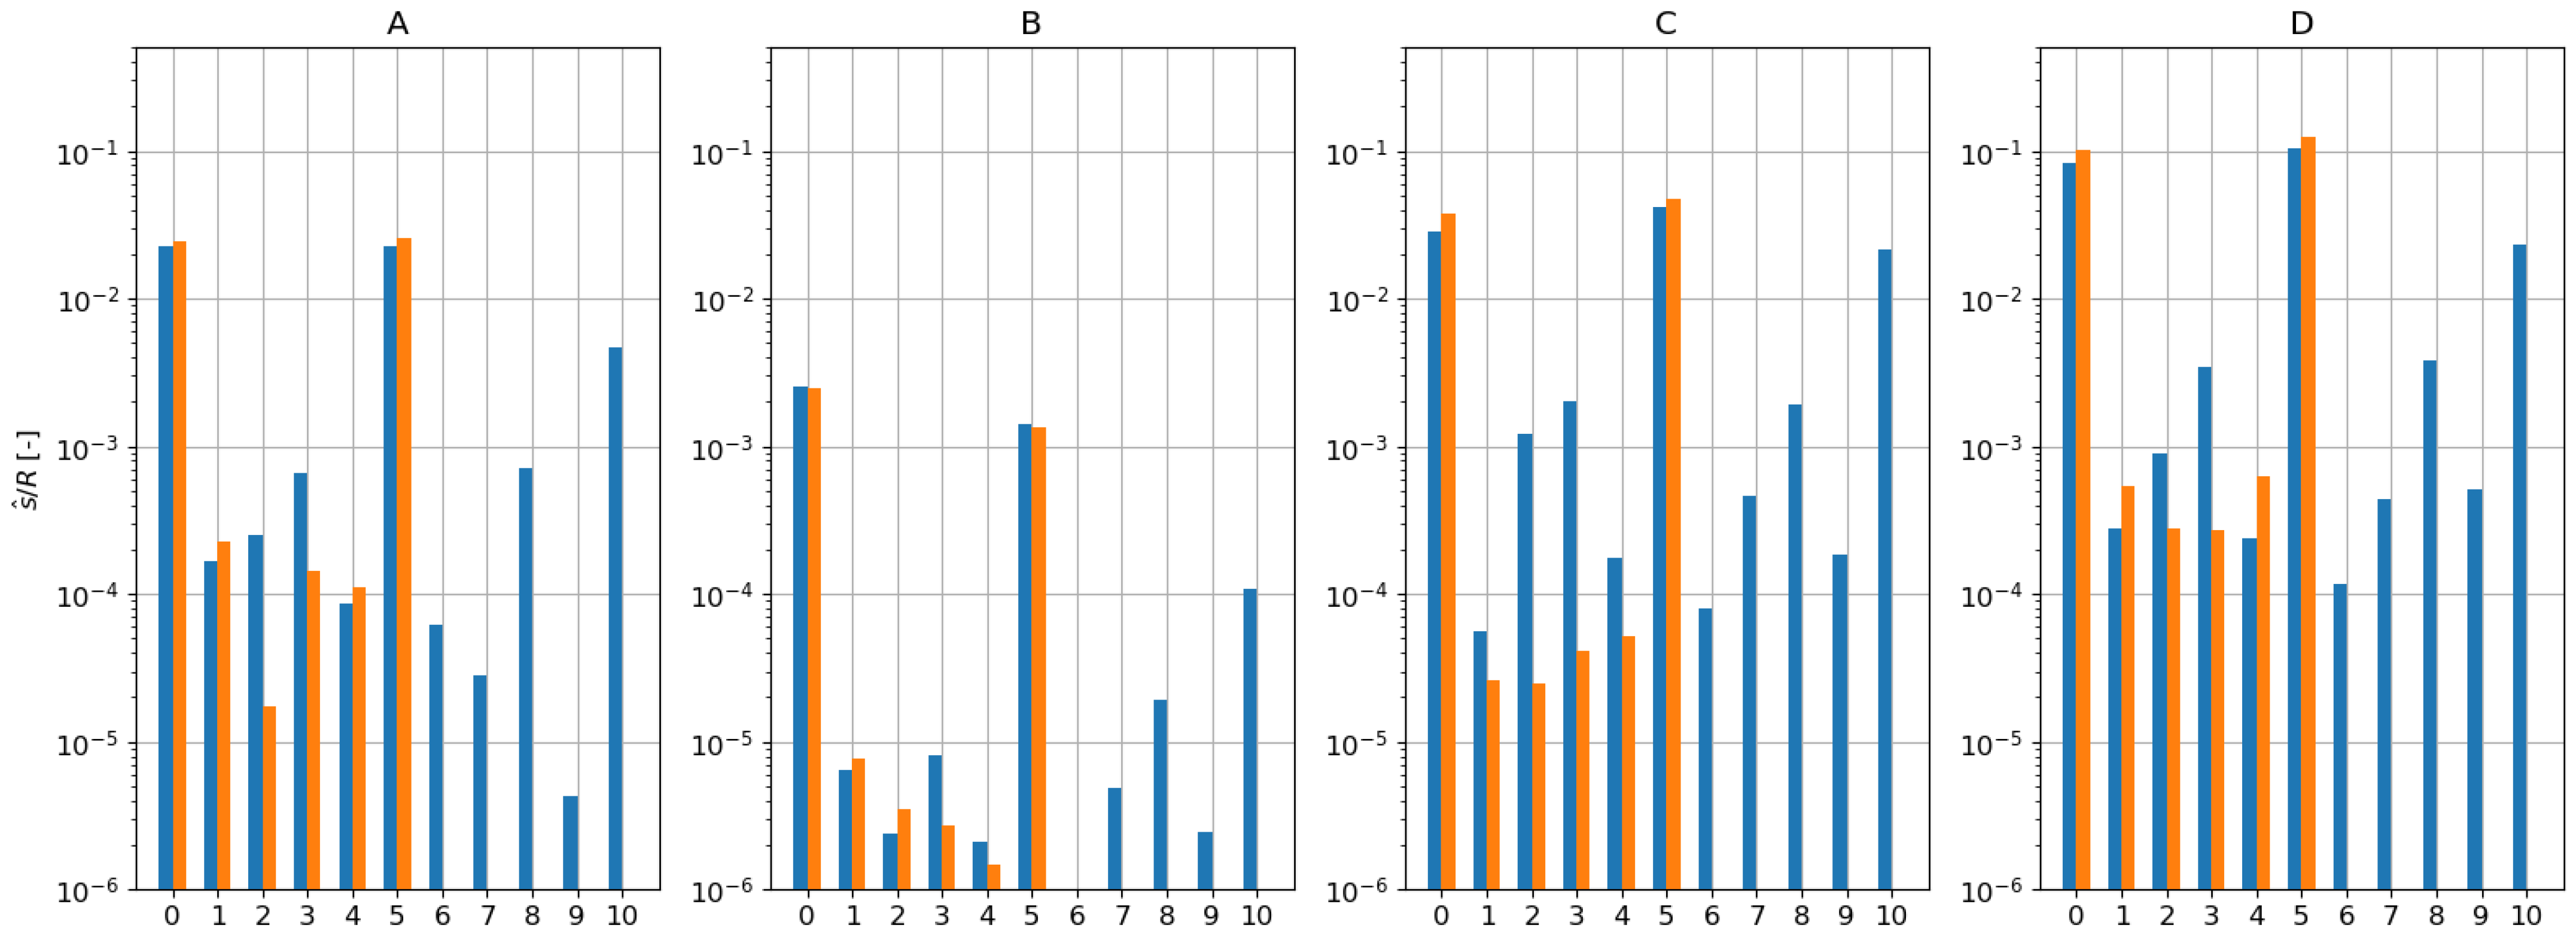
The spectrum of the entropy at the four numerical probes indicated in
Figure 13 is shown for the HB0..5 and the HB0..10 simulations in
Figure 15. Although no harmonic convergence is seen, both simulations have a clear concentration of the harmonic content in the fifth harmonic (and the 10th). Note that the
k-th higher harmonic has
k times the first interblade phase angle. Therefore, the phase relation between neighboring passages by definition corresponds to the same time lag between passages and thus to identical circumferential speeds. It should be pointed out, however, that the frequency is held fixed even though for a self-sustained flow instability it is part of the unsteady flow problem. These convective disturbances should therefore be investigated in future studies using either time-domain simulations or harmonic balance methods with a frequency estimation and adaptation.
Furthermore, for the HB0..5 setups the influence of the amplitude is relatively small; see
Figure 12.
Figure 16 compares the damping ratio per area for
at pressure and suction sides for the original and the higher-vibration amplitudes. The figures show that there is practically no sensitivity to the amplitude. The flow response to the blade vibration, both globally and locally, is thus nearly linear in the amplitude. Note also the differences between these results and the ones for the H1 setups (
Figure 8). A possible explanation for this behavior could be that, although the flow response to the blade vibration itself is a linear problem, the underlying background flow is already unsteady. This raises the question as to whether the discrepancy between the H1 and HB0..5 setups can be explained in large part because of the fact that the mean flow changes due to nonlinear effects. The plot in
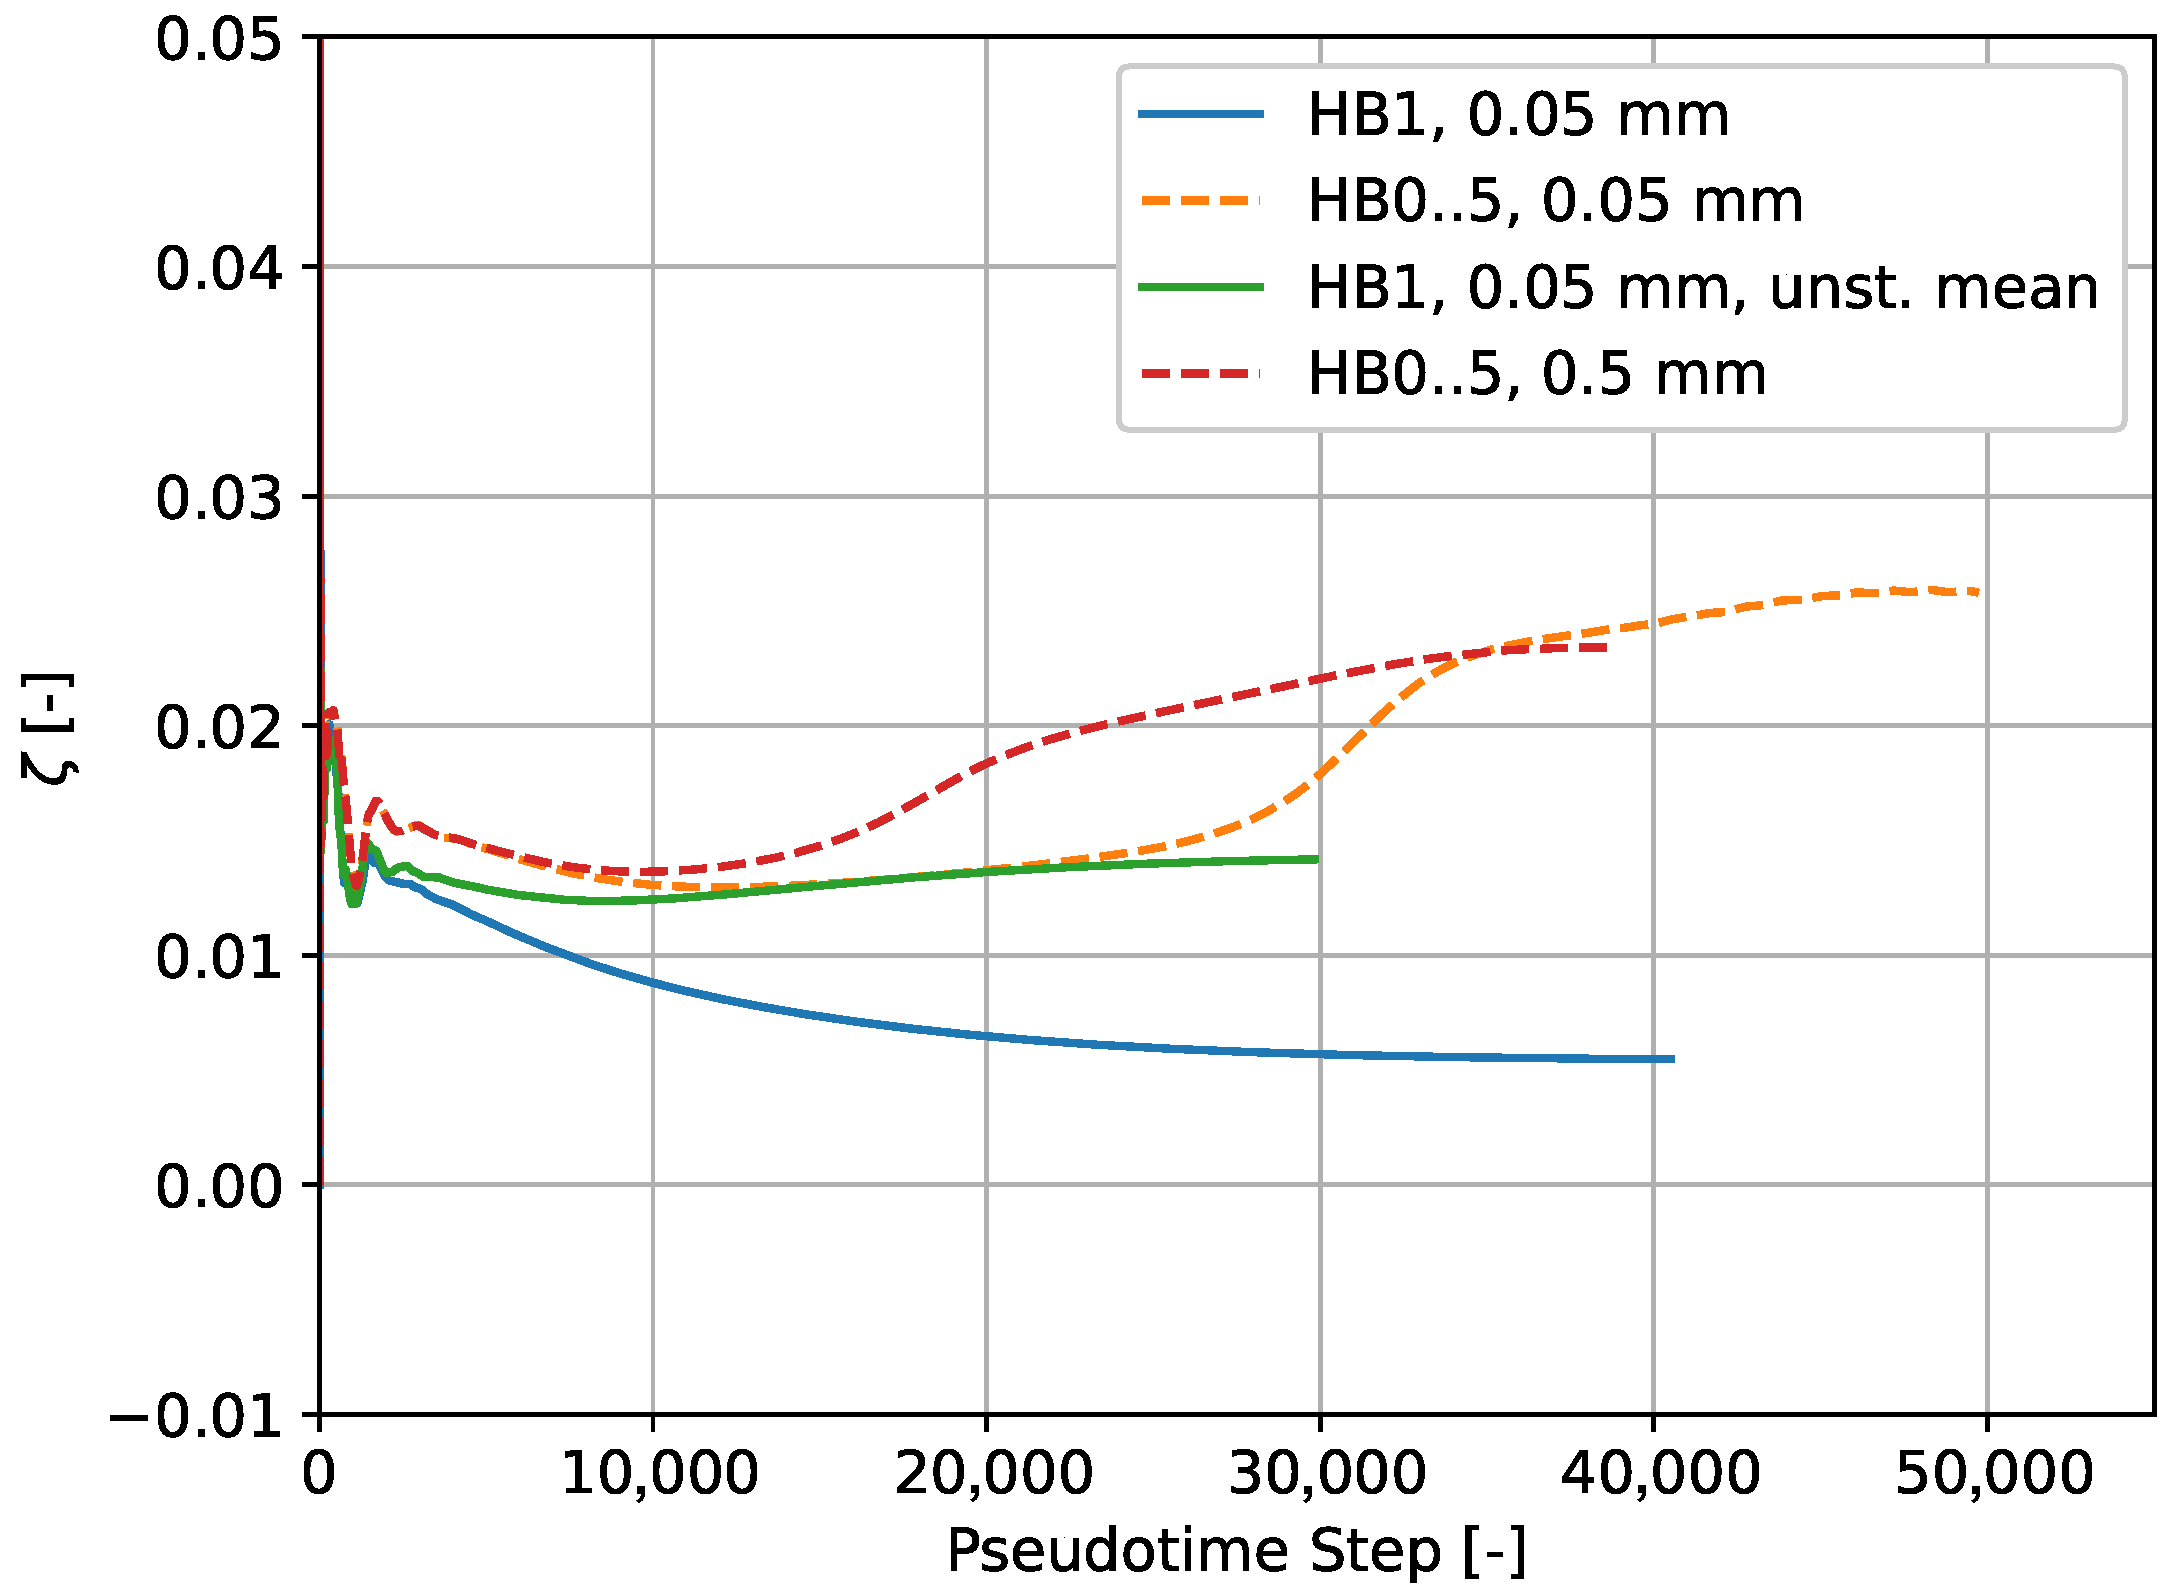
Figure 17 compares the convergence of the aerodynamic damping ratio for various setups and nodal diameter 5. Here, “unst. mean” (solid green line) denotes an H1 setup where the frozen mean flow is taken as the time average of the HB0..5 result with the standard amplitude (orange dashed line). On the one hand, the results do show that the unsteady mean flow has a significant impact on the damping, in that a flutter analysis with this background flow predicts a damping ration well above
. This effect, on the other hand, is insufficient to explain the full discrepancy between the “fully unsteady” flutter simulations and the original HB1 setup.
The plot in
Figure 12 shows that the resonance nodal diameter has been shifted to the right by taking into account the unsteady background flow. A shift from
to 6, in turn, would mean a shift in the convective resonance mode order from
to
, hence increasing the relative circumferential convection speed by about 9%. Note that this would correspond to a relative rotation speed of about
, which is exactly the value that Fiquet et al. [
7] observed for a time-domain URANS simulation with fixed blades. Very similar values for the relative rotation speed and a nodal diameter of 10 have been observed by Brandstetter et al. [
28], although at a mass flow of
. Tharreau et al. [
29] recently found values near
at a mass flow of about
by means of time-domain CFD and reported high sensitivity with respect to the tip gap height.
7. Conclusions
A flutter analysis of the UHBR Open Fan Testcase ECL5 CATANA was successfully conducted with the harmonic balance method, and it focused on the second eigenmode at part speed where previous computational studies at Ecole Centrale de Lyon showed negative damping for the nodal diameter 5. The simulation strategy employed here corresponds to the standard approach, in that the unsteady flow due to harmonic blade vibration with a prescribed frequency and interblade phase angle was computed, with the main difference with the study at Ecole Centrale being that the frequency domain method here is nonlinear. At the operating point under consideration, the turbulence model quantities had to be modeled as unsteady. A test with frozen turbulence resulted in unsatisfactory convergence and unphysical flow solutions. The harmonic balance method turned out to be robust even for higher amplitudes when combined with the -formulation of Menter’s SST model.
Convergence varied significantly over the range of nodal diameters. For the nodal diameter 5, the aerodynamic damping slowly drifted over a long period of iterations before convergence criteria were fulfilled. Apart from the HB method, the setup here differed from the above-mentioned study in that 2D non-reflecting boundary conditions were used. It was observed that the damping values, in particular at nodal diameters near the cut-on/cut-off boundary, had high uncertainty due to possible numerical reflections.
The first part of our study employed a harmonic balance setup with a prescribed mean flow, where only the first harmonic was predicted by the HB method. This approach resembled time-linearized methods. The agreement of the aerodynamic damping values predicted here with those reported in the previous study is quite high. The value for the nodal diameter of 5 was predicted to be much smaller than the other nodal diameters, resulting in a V-shaped spike in the damping curve. This is in line with the results from ECL, although the spike here was less pronounced. The depth of the spike was also found to be highly sensitive. Replacing the -equation with an equivalent -formulation, for instance, caused a sign change in the damping. It can be concluded that when the harmonic configuration is as close as possible to the time-linearized setup, then the damping values, as well as the location of the spike (although not its depth), are in line with the results of the previous study.
A frequency sensitivity study revealed sudden phase changes in the complex aerodynamic modal force at certain frequencies, depending on the nodal diameter. These could be related to a resonance with a convective disturbance, the circumferential speed of which, in the relative frame of reference, is close to times the fan’s rotational speed.
To understand the role of nonlinear mechanisms, the flutter analysis was repeated with a fully unsteady harmonic setup, solving for the mean flow and five higher harmonics. This setup gave significantly different damping values for nodal diameters close to 5. The aerodynamic damping at
increased considerably and was well above
. This is in line both with the experiments where high amplitudes for
were not observed and with computational studies by Fiquet et al. [
7], which predicted a damping ratio of about
. Adding harmonics to the harmonic balance setups can therefore help to explain the discrepancy and apparent contradiction between the published linear and nonlinear results.
The change in the damping between “linear” and nonlinear approaches has been found to be, at least to some extent, due to the fact that the unsteady flow is erroneously linearized at the steady solution. When running the test case with sufficient harmonics, the HB solver, as the time-domain solvers in [
7], resolves the unsteadiness that is present even if the blades are held fixed. In contrast, the numerical dissipation of the pseudotime scheme used to compute the steady flow, in combination with periodic boundaries, seems to prevent the onset of this convective disturbance. We conclude that to obtain physically meaningful damping values, it is indispensable to resolve the convective disturbances related to NSVs and their impact on the mean flow. Moreover, time-domain simulations with fixed blades and numerical setups consistent with the ones used here are planned in order to shed more light on the nature of these flow instabilities.

