Abstract
There are various mechanisms through which water droplets can be present in compressor flows, e.g., rain ingestion in aeroengines or overspray fogging used in heavy-duty gas turbines to boost power output. For the latter, droplet evaporation within the compressor leads to a cooling of the flow as well as to a shift in the fluid properties, which is beneficial to the overall process. However, due to their inertia, the majority of droplets are deposited in the first stages of a multistage compressor. While this phenomenon is generally considered in CFD computations of droplet-laden flows, the subsequent re-entrainment of collected water, the formation of new droplets, and the impact on the overall evaporation are mostly neglected because of the additional computational effort required, especially with regard to the modeling of films formed by the deposited water. The work presented here shows an approach that allows for the integration of the process of droplet deposition and re-entrainment based on relatively simple correlations and experimental observations from the literature. Thus, the two-phase flow in multistage compressors can be modelled and analyzed very efficiently. In this paper, the models and assumptions used are described first, then the results of a study performed based on a generic multistage compressor are presented, whereby the various models are integrated step by step to allow an assessment of their impact on the droplet evaporation throughout the compressor and overall performance. It can be shown that evaporation becomes largely independent of droplet size when deposition on both rotor and stator and subsequent re-entrainment of collected water is considered. In addition, open issues with regard to the future improvement of models and correlations of two-phase flow phenomena are highlighted based on the results of the current investigation.
1. Introduction
An effective and simple method to increase the power output of gas turbines is to spray a fine water mist into the compressor intake to cool the incoming airflow. In the course of this process, the inlet flow saturates, thus shifting evaporation towards the rear stages of the compressor, which further boosts the process. Among the various 1D programs used to evaluate the impact of wet compression on compressor behavior and performance, only a few account for non-equilibrium momentum transfer [1,2]. White and Meacock [1] note that droplets larger than 5 µm in diameter experience a slip velocity when the gas flow is redirected within the blades, introducing additional two-phase flow dynamics. Droplets generated from current spray technology may reach sizes of 30 µm or above. As the evaporative time scale of 30 µm-droplets is relatively large, they may, in principle, travel eight or more stages deep into the compressor [3]. Due to the velocity slip, such droplets largely impact the blades, reducing the water mass available within the flow. The resulting films, their path through the machine, and a possible re-entrainment of droplets into the gas path might then lead to a very different evaporation and intercooling behavior. However, CFD studies often either do not model any of the inherently three-dimensional mechanisms described above, model only isolated phenomena, or consider only single-stage or even single-row setups. Therefore, the true impact of evaporating flows on compressor performance remains unclear.
This shortcoming was therefore addressed in [4] by the authors. The study aimed to provide a benchmark case for comparing different multiphase CFD models, specifically focusing on droplet behavior, deposition, and the effect of wet conditions on aerodynamic performance.
The main findings from the first paper were that:
- The majority of droplets, typical for high fogging in terms of diameter, hit the blades in the first stages (at least 25% and up to 98% of the injected water mass for droplet diameters between 5 and 30 µm).
- Droplet–wall interaction modeling is essential because deposition effectively decreases the droplet water mass available for evaporation.
- Partial deposition (splashing) was shown to be particularly relevant for intermediate and large droplets, as the resulting secondary droplets strongly enhance evaporation and were identified to be the main source of phase change for those cases.
The paper at hand is an updated and extended version of a conference paper [5] and advances the previous approach by extending it with simple approaches to account for liquid film behavior and disintegration as illustrated in Figure 1. Liquid films in compressors can form on three key surfaces: the rotor, stator, and casing. These films can potentially reduce aerodynamic efficiency by increasing drag and flow resistance on the blades. Additionally, their presence can modify the heat transfer characteristics of the blades. Lastly and most importantly, these films transport deposited liquid towards the blade edges, thus determining the re-entrainment of the liquid back into the gas flow. White and Meacock also highlight a limitation of their 1D approach, noting that in reality, vapor generated from casing film evaporation would remain confined within the boundary layers near the casing, rather than mixing completely across the blade height, as assumed in their model. This underscores the need for more detailed three-dimensional simulations to accurately capture the complex flow behavior and phase change dynamics within the compressor.
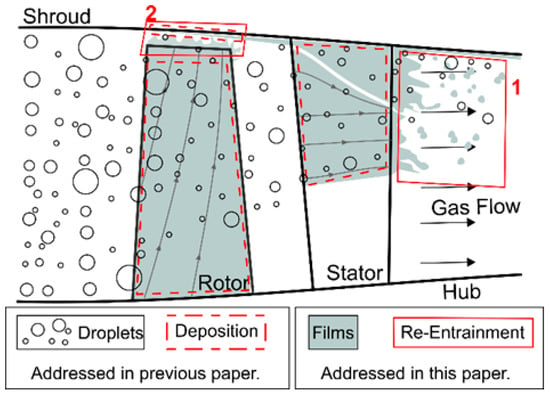
Figure 1.
Schematic representation of the water structures occurring in a compressor stage and the associated phenomena of drop impact, liquid films, and liquid disintegration as suggested by [6].
2. Multiphase Flow Modeling
The multiphase problem is modeled using an Eulerian framework for the gas phase and a Lagrangian approach for the droplet flow, allowing for the exchange of heat, momentum, and mass between the two phases. For further details about the CFD settings and boundary conditions, the interested reader is referred to [4].
2.1. Gas Phase
The working fluid, humid air, is modeled as an ideal mixture (denoted by index g) of two perfect gases: dry air (index a) and water vapor (index v). It is presumed that thermodynamic properties at a certain location are solely dependent on the local mass fractions as follows:
This holds for the mixture state variable ; e.g., heat capacity at constant pressure , heat capacity ratio , or gas constant . The mass flow fraction is as follows:
This is the ratio of water vapor and dry air.
According to Dalton’s law, the total pressure of the mixture is as follows:
This is the sum of the component partial pressures, and .
2.2. Droplet Phase
For simplicity, droplets are assumed to be spherical with a uniform temperature throughout their volume. They are grouped into parcels (denoted by index P), each representing the mass of several hundred individual droplets. All droplets within a parcel are assumed to have identical diameters and thermodynamic properties. The trajectory of each parcel through the gas field is calculated using a forward-stepping method that satisfies the force balance between parcel momentum and drag force, modeled by the Schiller and Naumann correlation [7]. In the rotor, additional forces, such as Coriolis and centrifugal forces, arising from the rotational domain, are also considered.
Parcels are either introduced at the compressor inlet with predefined diameter, temperature, and a velocity matching that of the gas, or they originate from splashing and re-entrainment events with respective properties. Each parcel is tracked until one of the following conditions is met:
- The parcel exits the computational domain through the compressor outlet,
- The parcel impacts the surface,
- The droplet diameter decreases below 1 × 10⁻⁹ m or
- The tracking time exceeds 20 s.
2.2.1. Heat Transfer
The amount of convective heat transferred is driven by the temperature difference, , between the gas and the droplet, while the thermal situation at the drop surface is accounted for by the Nusselt number. An empirical formulation by Ranz and Marshall [8] was used in this study, which has proven to produce adequate results [9] for spherical droplets. Heat transfer resulting from the phase change is coupled directly to mass transfer via a constant latent heat of equal to the difference in the enthalpies of saturated vapor and water at .
2.2.2. Mass Transfer
The mass transfer is computed using the liquid evaporation model outlined in the CFX Solver Theory Guide [10]. A droplet parcel is considered to evaporate when its saturation pressure, , is lower than the mixture pressure, ). Mass transfer occurs via diffusion, with the process influenced by the droplet surface conditions and the surrounding vapor layer. These effects are captured through the Sherwood number, with a correlation also proposed by Ranz and Marshall [11]. These heat and mass transfer models are integrated into the version of the CFX software which has been used for this work (V21.1). The saturation pressure, , primarily depends on the parcel temperature, , and is determined using the semi-empirical Antoine equation:
where and are substance-specific coefficients. For water, Rodgers and Hill [12] have determined the coefficients to be and , applicable within the temperature range of . The error of this correlation, when compared to measured values, is or less.
2.3. Droplet–Wall Interaction
The model specifically developed for compressor applications by Gomaa [13] is employed in this work. Similar to most other models, it incorporates the non-dimensional impact Weber number as follows:
It also incorporates the impact Reynolds number:
The characteristic impingement parameter, , is also considered [14].
As discussed in [4] and demonstrated by Cossali et al. [15], liquid water films, characterized by their physical thickness, , have no significant effect on the splashing process if the dimensionless film height in the impact zone is below or equal to unity, as follows:
Based on light interferometry measurements performed by Neupert et al. [16] in a compressor cascade, this condition is violated only when very small droplets impact near the leading edge. However, these droplets do not possess enough energy upon impact to cause splashing and are more likely to deposit. Therefore, it is sufficient to treat every impact as a dry splash, with the threshold set to its minimal value of according to [13], which also simplifies the modeling process.
When a droplet impacts the wall, as depicted in Figure 2, the model calculates a modified Weber number as follows:
This is based on the impact parameters to determine the resulting regime. According to the method of Gomaa [13], the droplet fully deposits on the wall if and the entire parcel mass is removed from the droplet phase and stored in a memory location corresponding to the blade row where the impact occurred. For , depending on the impact strength, a fraction of the impacting liquid mass is ejected back as two classes of secondary droplets, with the following diameters:
where is the droplet diameter upon impact [13]. Table 1 shows examples of relative ejected mass as a function of . For high-impact events with , all secondary droplets are classified as . The direction and velocity of the secondary droplets are not explicitly modeled; instead, it is assumed that these small droplets quickly adjust to the gas flow velocity and direction.
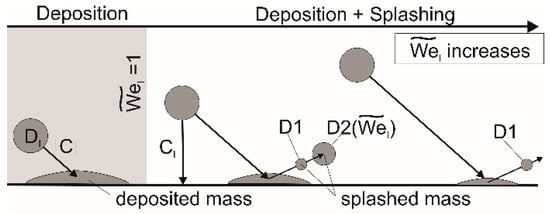
Figure 2.
Schematic representation of the droplet–wall interaction, its regime, and important parameters for the impact on a dry wall.

Table 1.
Overview of ejected droplet mass after impact.
2.4. Films
Droplets primarily impact the blading on the leading edge and pressure side. While the surface structure of a water film definitely alters the blade surface, comparable to a change in surface roughness, this effect appears to have no significant overall impact on aerodynamic losses. Harbeck et al. [17] conducted probe measurements in a linear compressor cascade, comparing total pressure along a traverse behind the blade passage with and without water injection. No differences were observed, and the loss coefficient remained unchanged in both cases. This result aligns with the findings of Roumeliotis and Mathioudakis [18] in a compressor stage and Day et al. [6] in a multistage compressor. In these studies, probe measurements were taken for a range of relative water loads. For high fogging operation, i.e., water loads below of the dry air mass flow, no differences were found in flow deflection or total pressure loss coefficients compared to dry flow field measurements. As a result, aerodynamic losses are not considered in the modeling for this work. Instead, the focus is placed on the transport of liquid mass.
Numerical investigations of stator profiles, based on flat plate experiments [13,16,19], show that shear forces carry the liquid completely to the blade trailing edge. Similarly, results obtained for rotor film modeling studies [20,21,22] illustrate that water deposited on rotating blades is thrown almost fully radially towards the casing by centrifugal forces. Based on these observations, computationally intensive thin film modeling for each blade row to describe liquid movement on the blade surfaces is bypassed in the present work by simply transferring the deposited water mass to either the stator trailing edge or the casing above the rotor.
The liquid is then reintroduced into the flow in the form of droplets formed by the disintegration of ligaments at a different location within the computational domain through injectors. Thus, the present work does not account for any transfer of momentum or heat between the film surface and the gas mixture, nor the mass transfer through evaporation or boiling of the film. However, these effects are of minor importance compared to droplet evaporation, as will be elaborated in the next section.
2.4.1. Casing Films
Quantitative measurements of film thickness on the casing are not available. Moreover, the film behavior on the casing is highly complex due to gas velocity gradients, potential droplet impacts, and the change in temperature and pressure along the compressor stages. Accurate prediction requires spatial and temporal modeling approaches, especially for a correct description of mass and heat transfer to assess the casing film contribution to vapor formation and cooling through simulation.
In [23], photographs and videos of the rotor gap area of a compressor were taken through a transparent casing. When water droplets are introduced into the flow, a casing film over the rotor gap is clearly visible, moving almost entirely in the circumferential direction. As water loading increases, the film structure becomes irregular, spreading more on the casing and forming waves on its surface.
Matz et al. [2] estimate that of compressor cooling occurs through droplet evaporation, emphasizing its dominant role compared to casing film. While the film surface is orders of magnitude smaller compared to the total surface area of all droplets, the residence time of the casing film in the compressor is significantly longer than the flight time of the droplets. Hill [24] argues that this relationship is crucial for high-fogging and that droplet evaporation plays a secondary role compared to film evaporation.
Zhluktov [25] and White and Meacock [26] modeled casing film in 1D compressor simulations, assuming liquid deposited on stators flows to the hub and casing, while liquid on rotors is fully allocated to the casing. Heat transfer depends on the surface-to-gas temperature gradient and boundary layer thickness, with different Reynolds number correlations for the casing and blades. Zhluktov’s model attributes of the total vapor formation to the film when assuming an adiabatic casing wall. White and Meacock compared cases with and without film heat and mass transfer modeling. They found that when the wall temperature matches the vapor saturation temperature, film cooling has little effect on the compressor exit temperature or vapor development, with results comparable to those without film evaporation modeling. However, if the film temperature exceeds the vapor saturation temperature, the vapor mass flow increases, reducing the compressor exit temperature significantly. Hence, the casing film’s long residence time is not enough to cause a cooling effect; it also needs to have a corresponding temperature. Consequently, any accurate assessment of film evaporation requires knowledge of the casing wall temperature distribution.
Due to the lack of knowledge on the behaviour of casing films as well as the uncertainty regarding its impact on overall evaporation, it will not be considered in the present work.
2.4.2. Film Re-Entrainment
For the consideration of water re-entrainment at the stator trailing edge, studies based on flat plates [13,27,28,29] or airfoils [30,31,32,33,34,35,36,37] are particularly suitable, as experimental campaigns in turbomachines are significantly more complex and therefore less common [38]. In all studies, researchers observe a breakup process consisting of up to three phases, regardless of whether the liquid is present as a film or a rivulet. The liquid at the trailing edge grows into the surrounding gas flow in several finger-like water structures (ligaments) and is increasingly exposed to aerodynamic forces due to the velocity difference between the liquid and the gas. In the primary zone, these forces exceed the viscous forces within the ligament, causing it to break up into individual droplets (Figure 3). For blunt trailing edges, the liquid accumulates in the wake, forming larger primary droplets, which also undergo breakup in a secondary zone.
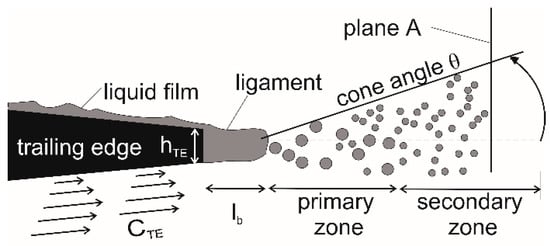
Figure 3.
Mechanism of liquid re-entrainment on a thick trailing edge according to Inamura et al. This figure is adapted from [35].
Calculations of the deformation Weber number [35], as well as high-speed imaging of this secondary breakup [28,30,31,33], demonstrate that this involves a bag breakup mechanism, where the ligament is inflated and torn apart by the gas flow. Melekidis [29] and Schlottke and Weigand [28] experimentally determined the spatial dispersion of the droplet spray downstream of the trailing edge. In both experimental setups, a single rivulet was placed on a simplified guide vane profile [29] or a plate [28], and its breakup process was captured in both top and side views using high-speed photography. From the envelope of the area covered by the droplets, Melekidis derived a cone angle to describe their spatial distribution.
In Figure 3, the cone angle is denoted by and represents the lateral spread of the spray in the context of axial compressors. The spray cone becomes larger on average at higher gas velocities because the oscillation of the ligaments during bag breakup increases. In [28], the droplet volumetric flow rate was evaluated at a plane downstream of the trailing edge. The distance from the trailing edge was chosen such that the secondary droplet breakup had fully developed. The results show that the spread of the droplet spray perpendicular to the trailing edge increases significantly with increasing gas velocity, consistent with the observations in [29]. Thus, on a fully wetted stator blade, disintegration can occur for the entire trailing edge, and the disintegrations overlap, resulting in a basically uniform distribution of secondary droplets along the full blade span.
The trailing edge disintegration model must describe the characteristics of the spray following ligament breakup and possibly secondary droplet breakup. Ansys CFX provides “Particle Injection Regions” (see Chapter 8.8 of the Ansys Modeling Guide [39]), hereafter referred to as “injectors”, to achieve this. These injectors can be freely positioned within the computational domain and introduce a defined spray into the gas flow; they will be elaborated in Section 4.2. To calculate the final droplet diameters downstream of the trailing edge, a correlation from Esquivias et al. [31] is used as follows:
where is the trailing edge thickness. This correlation provides the Sauter mean diameter () of the spray generated for both sharp and blunt trailing edges. This aligns well with experimental results for velocities at the trailing edge () between and , which is well within the range encountered in axial compressors. The trailing edge Weber number based on the trailing edge thickness, which is the key parameter, is as follows:
Additionally, a correlation for the ligament length, also based on the trailing edge Weber number, was proposed as follows:
The ligament detachment frequency is neglected, as only steady-state simulations were performed.
In the CFD simulations, the procedure is such that the liquid mass flow absorbed by the wall–droplet interaction model is calculated for each blade, casing, and hub using multiple junction box routines at the beginning and end of each iteration step. A user-defined function links the deposited mass flow on a surface to the mass flow of a specified injector. As schematically illustrated in Figure 4, an injector is placed in the flow field behind the stationary blade, and the deposited mass on the blade is linked to the injector at the following time step.
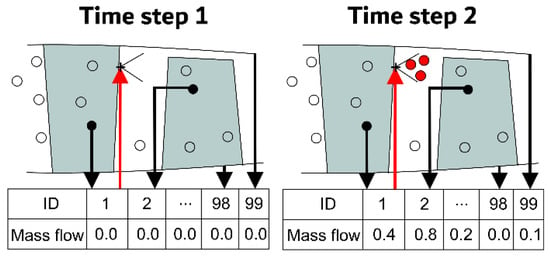
Figure 4.
The program sequence based on two consecutive iterations of the droplet phase. Black arrows represent deposited droplet mass flows, red arrows represent liquid mass flows assigned to injector to account for re-entrainment.
3. Benchmark Compressor
The compressor geometry utilized for the numerical experiments is the LSM Benchmark Compressor published in [4], which features ten stages and an Inlet Guide Vane (IGV). Data on blade curves, grid files, and case boundary conditions for the LSM Benchmark Compressor are available upon request. The aim is to establish a comprehensive database of results obtained with various multiphase models and methodologies, all using the same geometry. Key parameters from a simulation at the main operating point (OP) of the compressor—using saturated air with a vapor content of —are summarized in Table 2.

Table 2.
Compressor performance at design point OP without inlet fogging.
This operating point is also marked on the compressor performance map shown in Figure 5. The simulation results indicate that the compressor achieves an overall total pressure ratio with an inlet mass flow rate of .
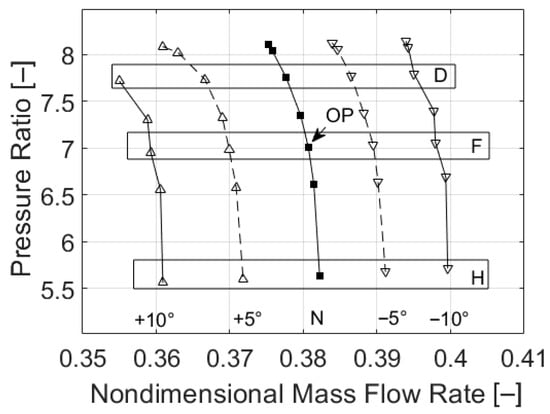
Figure 5.
Compressor Map without inlet fogging (from [4]).
When calculating the specific compression work, , it is important to consider not only the contribution from the air but also from the water vapor and liquid droplets to accurately assess the high-fogging process. White and Meacock [20] suggest the following approach:
where the first term is the total enthalpy change of the moist air, the second term is the sensible heat change of the liquid fraction, and the third term is the latent heat contribution from evaporation. Note that this is a purely thermodynamic approach. Any mechanical loss due to droplet impact or due to centrifuging of water is not considered here.
The polytropic efficiency, , is generally defined as the ratio of reversible enthalpy change, , to the overall specific enthalpy change, , of the flow.
Through Equation (15), the specific entropy change, ds, can be determined. This is approximated by the following between stations 1 and 2:
where are the specific entropies of the air, vapor, and liquid phases. Further details on these terms can be found in the Appendix A. The last term, , describes the change in entropy due to the mixing of the phases. To calculate this fraction, Baehr and Kabelac [40] suggest the following approach:
Note that does not depend on pressure or temperature but increases with the vapor fraction . and are the specific gas constants of air and water vapor.
Next, in Equation (15), the specific enthalpy change is equated to the specific compressor work, , from Equation (14). Together with Equation (16), this leads to the following expression for polytropic efficiency:
This formulation is valid for mixtures of arbitrary composition, including air, vapor, and droplets. The polytropic efficiency for the main operating point OP without inlet fogging, calculated from Equation (18), is , as listed in Table 2.
4. Modeling Approach
4.1. Assumptions and Simplifications
To reduce the number of free parameters and computational effort, a number of assumptions and simplifications have been made. The working fluid is assumed to be an ideal and homogeneous mixture of air and water vapor, both of which have been modelled as perfect gases. Vapor diffusivity has been assumed to be independent of pressure and temperature. For liquid water, all properties, including latent heat and surface tension, were set to be constant. The impact of these assumptions on the accuracy of the results is discussed at the end of this paper.
4.2. Cases Studied
In order to assess the impact of the various two-phase flow phenomena discussed in the previous sections, several cases with increasing levels of complexity have been simulated:
4.2.1. Case 1: Dry Flow
The converged solution of the gas flow field without inlet fogging, i.e., without droplet injection at operating point OP, was obtained.
4.2.2. Case 2: Full Deposition
A combined Eulerian/Lagrangian simulation was performed, for which the flow field computed in the dry case was used as the initial solution. Monomodal sprays in the form of 50,000 droplet parcels, with diameters of or , were released at the compressor inlet and tracked through the flow field, representing the fine, intermediate, and large mass-carrying portions of the spray, respectively.
All parcels at the inlet are initialized without slip relative to the gas flow and with a temperature corresponding to the gas total temperature at the compressor inlet. The total mass of all packages corresponds to a water loading of of the air flow without fogging (Case 1, see Table 2). Droplets hitting any surface were assumed to be deposited completely and hence removed from the flow, while the impact information was written to an output list for later evaluation. Source terms between the phases were calculated every fifth gas phase iteration and were applied using a relaxation factor up until the next coupling of the phases and until 400 gas phase iterations were reached.
4.2.3. Case 3: Partial Deposition
Case 2 was repeated with the splashing model of Gomaa [13]. Thus, if a droplet hits a surface, the splashing model determines the deposited mass, and secondary droplet parcels are tracked in the next iteration. The deposited water mass is removed from the flow.
4.2.4. Case 4: Partial Disintegration
Five injectors were positioned behind the IGV and the stator of each stage to re-entrain the water mass deposited on the latter with a monomodal spray of given diameter DTE, using the disintegration model presented in the next section. Figure 6 shows an illustration of that approach for the IGV and corresponding droplet trajectories originating from the injectors until they enter the rotor passage.
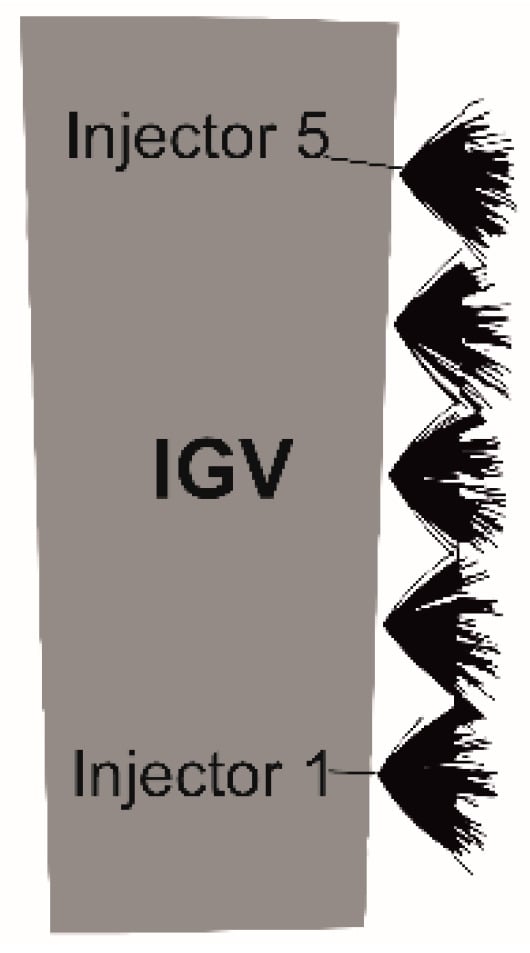
Figure 6.
Calculated parcel trajectories originating from the injectors behind the IGV.
The simulation of the disintegration process within the rotor gap is omitted. Instead, the spray angle of the injectors in each stage was chosen such that uniform coverage of the blade height with droplet parcels was achieved at the downstream mixing plane with all five injectors activated. The droplet velocity was set to the average axial gas velocity at the downstream mixing plane.
For Case 4, any water mass deposited on the rotor is still thought to be centrifuged out towards the casing and subsequently removed from the control volume.
With regard to the droplets introduced at the compressor inlet, in addition to the monodisperse sprays with diameters of or µm, a polydisperse spray was also analyzed during this stage. Figure 7 (top) presents the number distribution of a polydisperse spray used to augment stationary gas turbine compressors, as described in [41]. It was created by approximating the spray mass distribution (Figure 7, bottom) using the Rosin–Rammler function:
with parameters and . This approach allows the discrete number distribution to be represented as a continuous function to the flow solver, as indicated by the black line in Figure 7. Consequently, a variety of droplet classes are injected that closely resemble the illustrated spray.
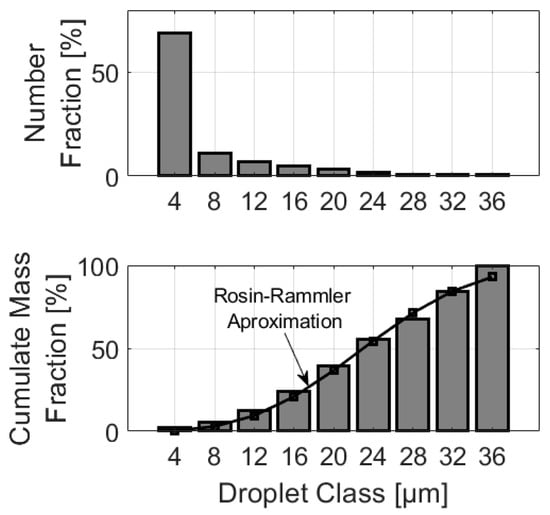
Figure 7.
Number distribution (top) and cumulative mass (bottom) of a droplet spray according to [41] and the corresponding Rosin–Rammler approximation.
4.2.5. Case 5. Full Disintegration
In this case the water deposited on the rotors is finally accounted for and it is fed back to the flow by an additional sixth injector placed behind the adjacent downstream stator (except the IGV) on the outermost normalized radius used for the injectors (corresponding to position 5 in Figure 6), because this strategy assumes that the casing water mass is completely drawn off by the next stator and disintegrated at the outer span of its trailing edge, as observed by Day et al. in [6].
To assess simulation quality, pressure ratio, temperature ratio, and inlet mass airflow were monitored for every simulation, with final variations below Simulating Case 0 on a 16.4-million-cell grid required 14 GB of memory and 40 h of computation. Including droplet trajectory calculations (Cases 2 and 3) doubled the computation time, while accounting for disintegration (Cases 4 and 5) increased both time and memory needs three- to fourfold.
4.3. Properties of the Injector
This section explains the adaptation of the injector model approach used to model re-entrainment of deposited water.
4.3.1. Representative Diameter
The Sauter mean diameter DTE of the secondary spray after re-entrainment is determined using Equation (11) by inserting the mass flow averaged mixture density and axial velocity in the absolute system at the mixing planes behind each stator. In order to assess the size range of the droplets formed by disintegration for a wide operating range of the compressor as shown in Figure 5 the results of simulations of operating points D, F, and H (see map in Figure 5) for inlet guide vane (IGV) positions −10°, +10°, and N were used.
The mean values and the corresponding standard deviations are plotted across the corresponding stages in Figure 8. It can be observed that is the largest, approximately , at the IGV. The diameter steadily decreases downstream and reaches a value of approximately behind the last stator. Although the operating points used for the calculation cover the entire operating range of the compressor shown in Figure 5, the standard deviation for the droplet diameters formed due to disintegration at each stator is only between and . Therefore, in a first approximation, it is sufficient to use the average values obtained for each stage for the Sauter mean diameter of the droplets reintroduced into the flow by the injector. The relative uncertainty is greatest in the rear section, where the resulting diameters are small. A comparison with the experiments of Doerr et al. [38] shows that the diameters calculated from Equation (11) are valid in the context of axial compressors. In the publication, droplets in the range of to behind the second rotor of a 4.5-stage test compressor were measured using phase Doppler anemometry, with their origin explicitly attributed to the disintegration at the stator trailing edge.
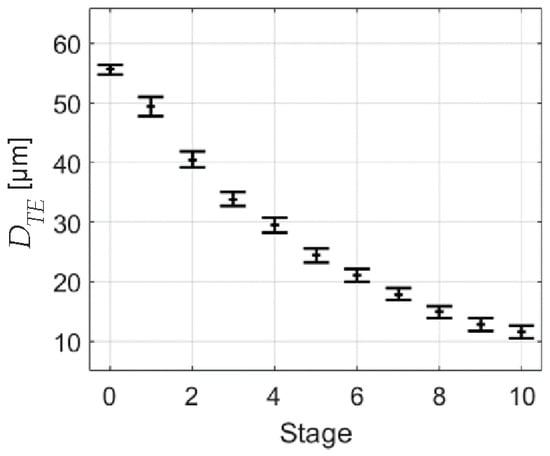
Figure 8.
Secondary drop diameters DTE formed by disintegration downstream of each compressor stage according to Equation (11).
4.3.2. Ligament Length
To ensure proper positioning of the injectors, the ligament length, , at each stator was estimated using Equation (13). If this length is larger than the distance to the subsequent rotor, the ligament would collide with the rotor itself, rendering the disintegration model invalid. Again, several operating points were considered to assess the range of ligament lengths across the whole performance map. The results are plotted in Figure 9. The trend shows a decreasing pattern, with the ligaments being estimated to be extremely short, approximately at the IGV and around at Stator 10. Between stages 2 and 5, no physically reasonable result was obtained because the validity range of the correlation (i.e., ) was exceeded. Due to the overall downward trend, it is not expected that the ligaments for these stages are significantly longer than in the adjacent stages.
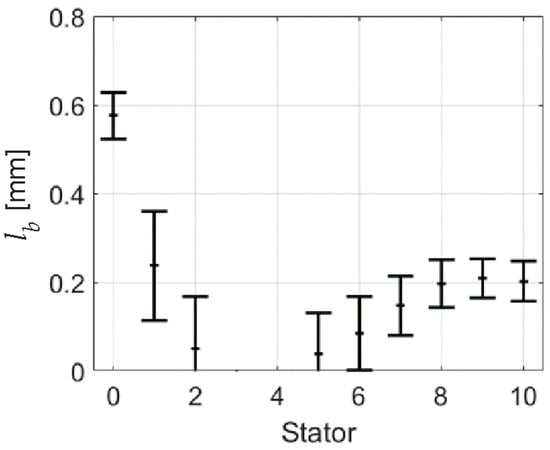
Figure 9.
Mean and standard deviation of ligament length downstream of each stator row according to Equation (13).
In comparison, the axial gaps between the cascades in each stage are significantly larger than the ligaments. Based on these results, the injectors were placed at a distance of of the stator axial chord length in the direction of the stagger angle.
4.3.3. Droplet Temperature
This passage discusses the assumptions and limitations of modeling droplet temperature in an axial compressor simulation. In reality, the temperature of the disintegrated water droplets corresponds to the temperature of the thin water film present on the trailing edge of the stator blades. However, the approach used in the present work does not calculate this directly because simulating the heat transfer between the water film, the gas flow, and the blade surface would require a complex film model. Instead, the model assumes that the droplet temperature is equal to the average droplet temperature at the mixing plane in front of each stator and that the heat transfer from and to the film is neglected. It is further assumed that the droplet temperature remains constant from the mixing plane to the point where they impact the stator. This approach simplifies the simulation but may underestimate the actual droplet temperature because droplets could absorb additional heat between the mixing plane and the stator. As discussed before, the heat transfer from the water film might also affect the overall cooling of the gas.
4.3.4. Injector Position
In the current work, it is assumed that liquid re-entrainment at the trailing edge occurs at a similar blade span as the droplet impact along the blade. This has to be considered for the “Partial Disintegration” model (Case 4). In order to account for the change in the range of droplet impact depending on droplet size, an average radius of droplet impact was calculated for all droplet sizes by weighing the individual impact radii with the impacting droplet volume at each stator. The left-hand side of Figure 10 shows the droplet volume-weighted radius at the mixing planes in front of the stators for each droplet size considered. An averaged radius of 0.5 means that the droplets impact along the full span of the blade; larger averaged radii indicate that deposition is shifted towards the casing, thus the hub part of the blade is not impacted by droplets. From Figure 10, it is evident that the center of mass shifts for droplets of different sizes.
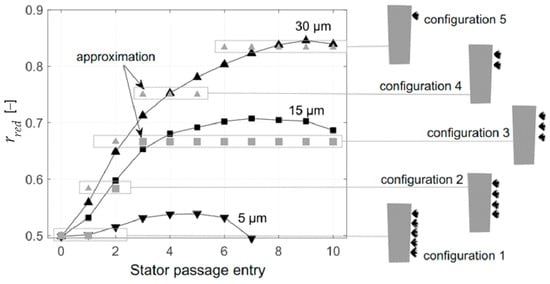
Figure 10.
Droplet volume-weighted average dimensionless radius at the entrance of each stator passage (solid line, black) and corresponding average radius of re-entrainment (gray symbols). The illustrations on the right show the corresponding injector configuration.
While for small droplets (), the center of mass largely remains at the mid-radius (), larger droplets are centrifuged outwards, shifting the center of mass towards the upper third (e.g., to for ) or even further towards the casing after passing only a few stages. To account for this effect in the disintegration modeling, five virtual injector positions downstream of each stator are implemented, spaced evenly across the span. Based on this approach, five configurations are introduced.
Configuration 1 covers deposition and subsequent re-entrainment along the whole blade span, while in the following configurations, injector locations are “switched off”, beginning with the hub location, until only the injector close to the casing is left in configuration 5. The resulting average radii of re-entrainment for this approximation are depicted in Figure 10 using gray symbols for intermediate and large droplets (square: ; triangle: ). It can be seen that the average radius of re-entrainment matches that of droplet deposition with good accuracy. For small droplets, only configuration 1 is used.
For the full disintegration case (Case 5), which considers the re-entrainment of droplets that deposit on the rotor blades and are then centrifuged towards the casing, an additional injector is placed at span (position 5 in Figure 6).
5. Results
5.1. Overall Impact of Re-Entrainment Modeling
The following section analyzes how the different cases considered affect the simulation results of the flow with inlet fogging. Figure 11 shows the vapor fraction increase from compressor inlet to outlet, , relative to the injected droplet liquid mass, . This ratio can be regarded as a measure of evaporation efficiency as it states which percentage of the injected water mass evaporates.
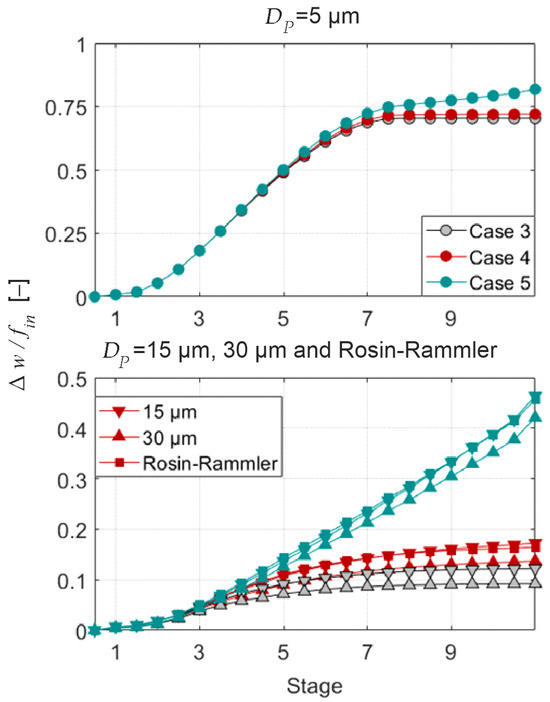
Figure 11.
Change in vapor fraction relative to injected water mass for different model cases. Operating point: OP as marked in Figure 5, water load: .
The upper plot shows that for a spray of the smallest droplet size, , evaporation efficiency is similar for all cases, i.e., re-entrainment and disintegration of deposited water is of minor importance for this droplet size. Starting from stage 7, the value of remains constant for both the splashing and partial disintegration cases. For the full disintegration case, this value slightly increases.
For sprays of medium and large droplets or those featuring the Rosin–Rammler distribution, the full disintegration model (Case 5), re-injecting any deposited water back into the flow, significantly increases the evaporation efficiency from stage 4 onwards, and the vapor fraction increases linearly. Yet, the overall amount of evaporated water for these droplet classes with is smaller than for fine droplets with . For the partial disintegration case (Case 4), the effect is less pronounced compared to the simulation, which only accounts for splashing (Case 3). Overall, the impact of the droplet size is minimal at the same modeling depth except for the smallest diameters, demonstrating that evaporation efficiency is actually more or less independent of droplet size but rather depends strongly on re-entrainment and disintegration for typical spray droplets and polydisperse sprays. Thus, the modeling approach plays a crucial role in the assessment of compressor inlet fogging.
Figure 12 depicts the ratio of droplet water mass fraction, , to the injected water mass, , to assess how much liquid in the form of droplets is present at a certain compressor stage.
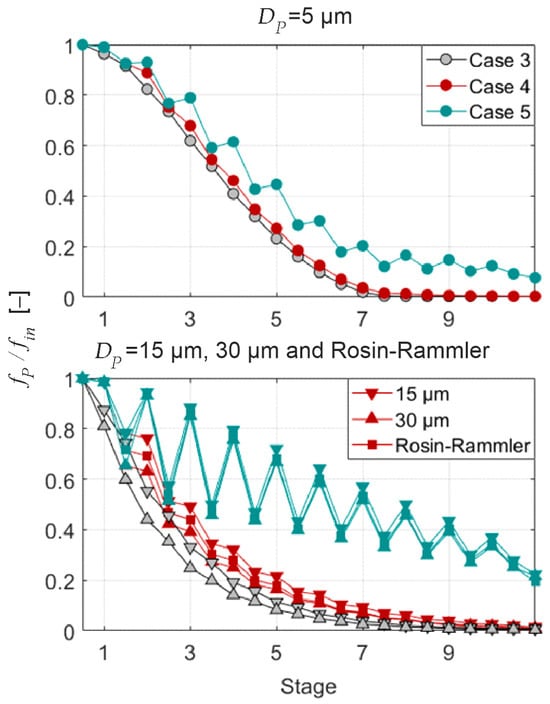
Figure 12.
Change in droplet mass relative to injected water mass for different model depths. Operating point: OP as marked in Figure 5, water load: .
When this parameter approaches zero, there are no droplets left in the gas flow, either due to evaporation or due to deposition. This absence of droplets is visible for the fine droplets in the splashing and partial disintegration case from stage 7 onwards. This is the reason why the vapor content (visible in the upper part of Figure 11) remains constant.
When examining the full disintegration case, there is a droplet population of about of the injected mass flow that reaches the compressor outlet. Because these droplets originate from re-entrainment, which actually yields droplets with a larger diameter than (see Figure 8), this has only a minor effect on evaporation efficiency as they are less agile to evaporate.
For the remaining droplet classes, it becomes evident once again that droplet size has little influence on the overall course of evaporation, yet the modeling approach significantly impacts the droplet mass fraction. While the droplet mass fraction increases only slightly for the partial disintegration model (Case 4), the behavior changes fundamentally for the full disintegration approach. Sawtooth-like patterns can be observed, with the minima marking the planes behind the rotors at which deposited droplets are centrifuged to the casing. The peaks correspond to the planes behind the stators, where the water mass deposited in the entire preceding stage is reintroduced into the gas flow. For Case 5, the fraction of water mass exiting the compressor is approximately , while about evaporates. The remainder is still removed from the flow. This is due to the fact that some of the relatively large droplets generated by the injectors near the casing are immediately redeposited on the casing, especially in the rear stages.
Depositions can be assessed based on Figure 13. Again, modeling partial disintegration at the stator only (Case 4) yields only small changes compared to the case without re-entrainment (Case 3) because the majority of the relatively large droplets formed due to disintegration at the trailing edge are deposited on the following rotor blades and centrifuged towards the casing. The full disintegration model (Case 5), however, has an enormous impact on the amount of deposited water already in the front stages. Nevertheless, part of the liquid is always deposited on the casing, leading to a deposited mass fraction of at the compressor outlet, depending on the size of the droplets injected at the inlet.
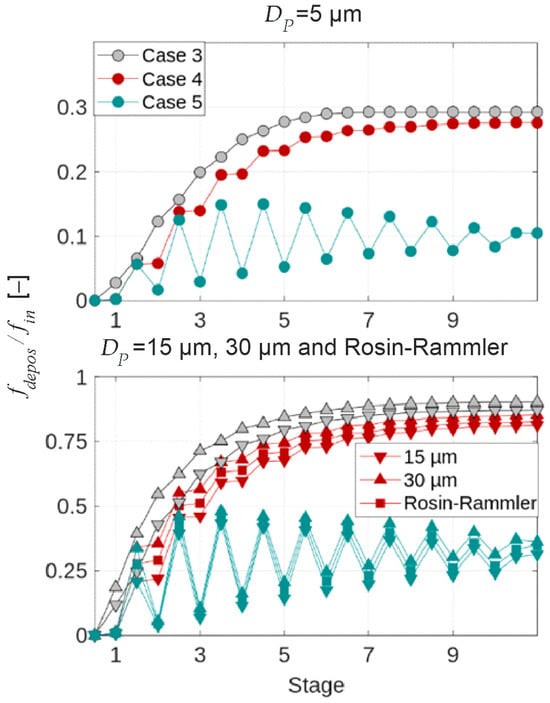
Figure 13.
Change in deposited liquid mass to injected water mass for different model depths. Operating point: OP as marked in Figure 5, water load: .
Next, the key parameters specific to compressor work (Equation (14)) and polytropic efficiency (Equation (18)) are utilized for further comparison. These quantities are plotted in Figure 14 as a percentage deviation from the values given for the case without fogging (Case 1) in Table 2. The size of the data point symbols is proportional to the diameter of the droplet class being analyzed. Simulations with the Rosin–Rammler spray are represented by squares. The colored bars illustrate the simulation case used.
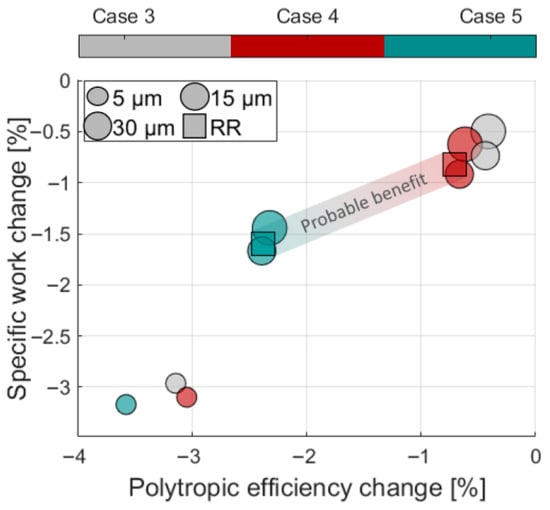
Figure 14.
Changes in specific work and polytropic efficiency for different modeling depths and droplet classes. Operating point: OP (see Figure 5), water load: .
Compression work reduces the most, by about , when small droplets are injected. This also leads to a significant decrease in polytropic efficiency by at least . A reduction in compression work and a simultaneous decrease in efficiency is not intuitive, but it has to be kept in mind that this is the polytropic efficiency obtained for the mixture. Figure 15 illustrates the contributions of each phase to the total specific entropy change, as calculated using Equation (16), for the smallest droplet size class. Evaporative cooling reduces the specific entropy of the air compared to the dry flow case (). However, the processes of compression, heating, and vapor generation significantly increase the specific entropy of the vapor, resulting in a comparable overall entropy change. Additionally, the entropy change due to mixing (Equation (17)) further increases the total entropy, ultimately leading to lower mixture polytropic efficiencies.
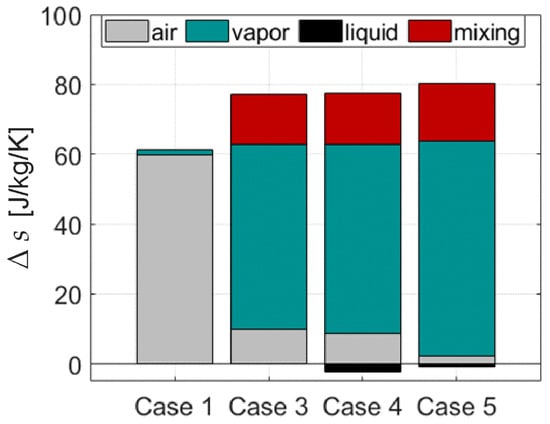
Figure 15.
Specific entropy changes by phase for different model depths and droplet classes . Operating point: OP (see Figure 5), water load: .
When injecting larger droplets or a typical spray, data points cluster depending on modeling depth and lead to a similar decrease in specific work and efficiency. The full disintegration approach (Case 5) causes the largest deviations, while the difference between the splashing and partial disintegration approaches (Case 3 and Case 4) is marginal. The highest reduction in compression work is obtained for the smallest droplets; however, these constitute only a very small fraction of a typical spray.
The most realistic assessment of the potential benefits of high fogging for the LSM Benchmark compressor is obtained based on the two simulations using the Rosin–Rammler droplet distribution. The first simulation, based on a partial disintegration model (Case 4), assumes disintegration at stators only, while the second, full disintegration model (Case 5) accounts for the re-entrainment of all but one-third of the injected water mass.
5.2. Spatial Distribution of Flow Quantities
The radial distributions of vapor fraction (Figure 16), temperature (Figure 17), and mass flow density (Figure 18) are analyzed as a function of model depth. The figures show the radial profiles behind the rotors of stages 1, 5, and 9 for all model depths and for the droplet size, , as these droplets are most likely to traverse towards the casing during their journey through the compressor. The plotted values are normalized to the results of the dry flow case (Case 1) with .
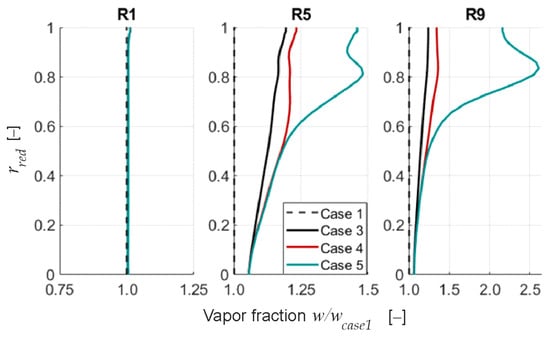
Figure 16.
Radial distribution of vapor fraction for different modeling approaches relative to Case 1. Operating point: OP (see Figure 5), water load: .
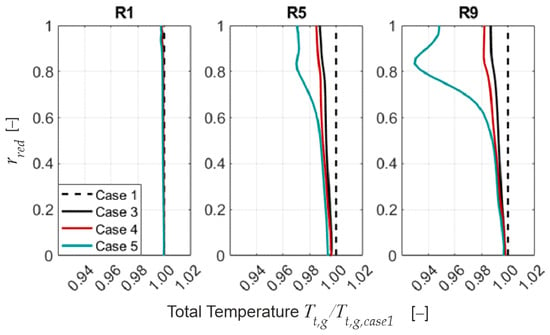
Figure 17.
Radial distribution of total temperature for different modeling approaches relative to Case 1. Operating point: OP (see Figure 5), water load: .
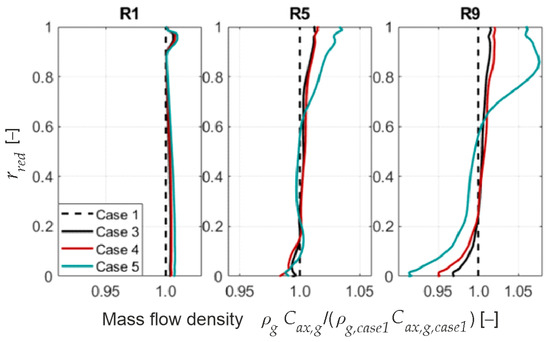
Figure 18.
Radial distribution of mass flow density for different modeling approaches relative to Case 1. Operating point: OP (see Figure 5), water load: .
Behind the first rotor, minor differences can be observed at , where higher vapor content due to increased evaporation and correspondingly lower temperatures, and higher mass flow density are noted, especially for the full disintegration case (Case 5).
In later stages, more vapor is generated as re-entrainment is considered, and the profiles behind rotors R5 and R9 are strongly affected by the extent of re-entrainment modelled. In general, the shift of droplets towards the casing, or rather to the upper third of the annulus, leads to higher evaporation there, causing the mass flow rate to increase in this region. This also affects the flow temperature distribution due to uneven cooling. The strongest impact can be seen for the full disintegration case (Case 5) with the highest mass flow density in the upper annulus () behind rotor R9, while mass flow near the hub () decreases.
Accordingly, the aerodynamic load of the compressor stages is impaired based on the change in the radial mass flow, which also affects operating behavior.
6. Discussion of Modeling Assumptions
Finally, a critical assessment shall be made of the assumptions and simplifications used in the various approaches, as well as their impact on the results.
The approach chosen is absolutely sufficient for comparing various evaporation, droplet, and droplet–wall interaction models. However, the results show that a significant amount of liquid reaches the middle and rear stages of the compressor, where pressure and temperature have increased noticeably compared to the inlet conditions. Therefore, an estimate is made on how the rise in pressure and temperature affects splashing and trailing edge disintegration for these stages. To this end, the lower part of Figure 19 shows the evolution of static pressure and droplet temperature. The upper part shows the evolution of surface tension, latent heat, and diffusivity based on correlations presented within this section and compared to the respective constant value set for the numerical simulations.
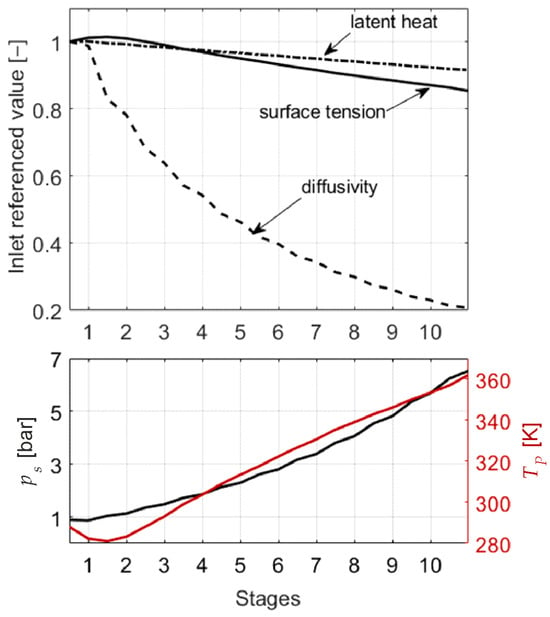
Figure 19.
Dependence of important model quantities of the multiphase modeling (top) on pressure and temperature (bottom) across the stages.
Surface tension, , directly influences the calculation of the impact Weber number (Equation (8)) and the trailing edge Weber number (Equation (12)). According to the following Eötvös equation, the surface tension of a liquid is linearly dependent on the liquid temperature, :
This equation applies to all pure liquids and allows for the prediction of surface tension if the molar mass, , the density, , and the critical temperature, , of the liquids are known. The universal Eötvös constant is . For water droplets considered here, the surface tension is calculated as follows, with , and as a function of the droplet temperature . Droplet temperature and the surface tension relative to the compressor inlet are shown in Figure 19 along the stages. As the droplet temperature rises above , the surface tension at the compressor exit decreases to of its initial value. This would intensify splashing in the rear section, where the droplet temperature is higher. The ligament length at the stator trailing edges would be shorter, and the resulting secondary droplets would be finer. Compared to the simulations conducted here, this would likely improve the cooling effect due to the increase in the droplet surface area.
Figure 19 further shows the latent heat L computed from the pressure data of the reference case without droplets, using the steam tables of XSteam [42]. Referring to the assumed constant value of , it becomes evident that less energy is required to evaporate the droplets in compressor stages further downstream of the inlet. This means that the same amount of water can induce a greater cooling effect in the front section of the compressor than in the rear. Therefore, without accounting for pressure-dependent phase change enthalpy, the cooling effect is overestimated in the cases discussed here.
Finally, the dependence of diffusivity on pressure and temperature will be analysed. Diffusivity has a direct impact on mass transfer and, consequently, on the vapor content in the mixture. Fuller et al. [43] provide an empirical correlation that determines the diffusivity of substance in substance based on the pressure and temperature as follows:
The parameters and are referred to as diffusion volumes. These values are determined using a nonlinear least squares method for common substance pairs. For the water vapor–air pair, the parameters are and . As droplet temperature increases, the water vapor generated at the droplet surface can diffuse more quickly into the surrounding gas mixture, enhancing mass transfer. However, the diffusion coefficient decreases as ambient pressure rises, because the vapor particles must move against this increased pressure. The effect of pressure is much more pronounced than that of temperature, leading to reduced evaporation in the middle and rear sections of the compressor.
Finally, the impact of large droplets on the rotor blades of a compressor will eventually lead to significant material erosion and hence to a drastic change in aerodynamic efficiency. This aspect has been omitted in the current work as it does not give insight to the actual influence of inlet fogging on the compression itself, however, it must be considered to evaluate the benefits and drawbacks of inlet fogging as a whole.
7. Conclusions
This paper has introduced a tool based on Ansys CFX for simulating high-fogging in compressors based on a generic, open-source geometry, which is intended to serve as a benchmark for different models.
By assuming an adiabatic film flow and using a semi-empirical approach to model the water mass deposited on blades, suitable model parameters for trailing edge disintegration were derived. Extensive simulations, both with and without droplets, provided a comprehensive dataset for model validation. It is recommended that droplets larger than be modelled with a splashing and trailing edge disintegration approach, as the fine secondary droplets generated during impact are crucial to capture the cooling effect. The trailing edge disintegration model effectively links the stators and rotors, and intense droplet impact near the blade tips enhances evaporation, leading to a significant decrease in gas temperature and an increase in water vapor content along the compressor, especially near the casing. As a result, specific compression work reduces while the mixture polytropic efficiency of the process decreases. Based on the results presented, the benefit of droplet cooling alone lies within 1 and for the LSM benchmark compressor examined.
However, as outlined during the discussion of the results, elaborate modeling of the substance properties may lead to a different evaporation behavior, especially in the later stages. Moreover, droplet impact erosion and its impact on efficiency have not been considered here.
Lastly, it would be feasible to integrate a model for heat and mass transfer due to evaporation or boiling of the film on the casing and blades into the proposed concept with manageable effort for further research. The flexibility in defining droplet injectors for re-entry modeling also enables detailed investigation of alternative injection methods, such as interstage fogging.
Author Contributions
Conceptualization, S.G. and M.S.; methodology, software, validation, and formal analysis, S.G.; writing—original draft preparation, S.G.; writing—review and editing, M.S.; supervision, M.S. All authors have read and agreed to the published version of the manuscript.
Funding
This research received no external funding.
Data Availability Statement
Geometry data and CFD meshes for the LSM benchmark compressor are available upon request. Please contact Markus Schatz.
Conflicts of Interest
The authors declare no conflicts of interest.
Nomenclature
| Quantities | |||
| absolute velocity (m/s) | temperature (K) | ||
| mass flow rate (kg/s) | latent heat (J/kg) | ||
| pressure (Pa) | R | specific gas constant (J/kg/K) | |
| density (kg/m3) | D | droplet diameter (m) | |
| surface tension (N/m) | D | diffusivity (m2/s) | |
| h | thickness (m) | dynamic viscosity (Pa × s) | |
| specific compression work (J/kg) | ligament length (m) | ||
| r | radius (m) | n | rev per minute (1/min) |
| M | molar mass (g/mol) | critical temperature (K) | |
| s | specific entropy (J/kg/K) | Eötvös constant ( | |
| Numbers | |||
| relative film thickness | Reynolds number | ||
| splashing threshold | deviation | ||
| Weber number | polytropic efficiency | ||
| w | vapor mass per dry air mass | f | liquid mass per dry air mass |
| total pressure ratio | total temperature ratio | ||
| Rosin–Rammler function | |||
| Sub-/Superscripts | |||
| ideal mixture | liquid phase | ||
| pure air | parcel | ||
| pure vapor | Sauter mean | ||
| t | total | TE | trailing edge |
| sat | saturation | I | impact |
| ~ | modified | in | inlet |
| out | outlet | red | normalized |
| ax | axial direction | depos | deposited mass |
| tr | triple point value | s | static |
Appendix A
Specific entropies for the phases are calculated using:
For this purpose, a reference state with the temperature, , and the pressure, , must be set in which the entropy of air and water vapor should be zero. For the liquid phase, the evaporation entropy for this state is also considered. The reference state used is the triple point of water, which has and .
References
- White, A.J.; Meacock, A.J. An evaluation of the effects of water injection on compressor performance. J. Eng. Gas Turb. Power 2004, 126, 145–158. [Google Scholar]
- Matz, C.; Cataldi, G.; Kappis, W.; Mundinger, G.; Bischoff, S.; Helland, E.; Ripken, M. Prediction of Evaporative Effects Within the Blading of an Industrial Axial Compressor. J. Turbomach. 2010, 132, 041013. [Google Scholar] [CrossRef]
- Khan, J.R.; Wang, T. Implementation of a non-equilibrium heat transfer model in stage-stacking scheme to investigate overspray fog cooling in compressors. Int. J. Therm. Sci. 2013, 68, 63–78. [Google Scholar] [CrossRef]
- Geist, S.; Schatz, M. A generic multistage compressor design for multiphase code and model benchmark. In Proceedings of the 15th European Turbomachinery Conference, paper no. ETC2023-132. Budapest, Hungary, 24–28 April 2023. [Google Scholar]
- Geist, S.; Schatz, M. Droplet-laden flows in multi-stage compressors—An overview of the impact of modeling depth on calculated compressor performance. In Proceedings of the 16th European Turbomachinery Conference, paper no. ETC2025-169. Hannover, Germany, 24–28 March 2025. [Google Scholar]
- Day, I.; Williams, J.; Freeman, C. Rain Ingestion in Axial Flow Compressors at Part Speed. J. Turbomach. 2008, 130, 011024. [Google Scholar] [CrossRef]
- Naumann, Z.; Schiller, L. A drag coefficient correlation. Z. Ver. Deutsch. Ing. 1935, 77, 323. [Google Scholar]
- Ranz, W.; Marshall, W. Evaporation from droplets—Part 1. Chem. Eng. Prog. 1952, 48, 141–146. [Google Scholar]
- Seck, A.; Geist, S.; Harbeck, J.; Weigand, B.; Joos, F. Evaporation modeling of water droplets in a transonic compressor cascade under fogging conditions. Int. J. Turbomach. Propuls. Power 2020, 5, 5. [Google Scholar] [CrossRef]
- Ansys Inc. Ansys CFX Solver Theory Guide; R2021 R1; Ansys Inc.: Canonsburg, PA, USA, 2021. [Google Scholar]
- Ranz, W.; Marshall, W. Evaporation from droplets—Part 2. Chem. Eng. Prog. 1952, 48, 173–180. [Google Scholar]
- Rodgers, R.; Hill, G. Equations for vapour pressure versus temperature: Derivation and use of the Antoine equation on a hand-held programmable calculator. Br. J. Anaesth. 1978, 50, 415–424. [Google Scholar] [CrossRef] [PubMed]
- Gomaa, H. Modeling of Liquid Dynamics in Spray Laden Compressor Flows. Doctoral Thesis, University of Stuttgart, Stuttgart, Germany, 2014. [Google Scholar]
- Mundo, C.; Sommerfeld, M.; Tropea, C. On the modeling of liquid sprays impinging on surfaces. At. Sprays 1998, 8, 625–652. [Google Scholar] [CrossRef]
- Cossali, G.E.; Marengo, M.; Santini, M. Splashing characteristics of multiple and single drop impacts onto a thin liquid film. In Proceedings of the International Conference on Multiphase Flows, Leipzig, Germany, 9–13 July 2007. [Google Scholar]
- Neupert, N.; Harbeck, J.; Joos, F. An experimentally derived model to predict the water film in a compressor cascade with droplet laden flow. J. Eng. Gas Turbines Power 2019, 141, 092601. [Google Scholar] [CrossRef]
- Harbeck, J.; Geist, S.; Schatz, M. An Approach to Measure Total-Head in Wakes and Near End Walls at High Fogging Conditions. In Proceedings of the ASME Turbo Expo, Virtual Conference and Exhibition, 7–11 June 2021. [Google Scholar]
- Roumeliotis, I.; Mathioudakis, K. Water Injection Effects on Compressor Stage Operation. J. Eng. Gas Turbines Power 2006, 129, 778–784. [Google Scholar] [CrossRef]
- Dohmen, H.J.; Benra, F.-K.; Schepers, C.; Schuster, S. Analysis of the Size of Secondary Droplets due to Film Separation at the Blade Trailing Edge. In Proceedings of the ASME Fluids Engineering Division Summer Meeting, Chicago, IL, USA, 3–7 August 2014. [Google Scholar]
- Williams, J.; Young, J.B. Movement of Deposited Water on Turbomachinery Rotor Blade Surfaces. J. Turbomach. 2006, 129, 394–403. [Google Scholar] [CrossRef]
- Nikolaidis, T.; Pilidis, P.; Teixeira, J.A.; Pachidis, V. Water Film Formation on an Axial Flow Compressor Rotor Blade. In Proceedings of the ASME Turbo Expo, Berlin, Germany, 9–13 June 2008; pp. 79–87. [Google Scholar]
- Nikolaidis, T.; Pilidis, P. The Effect of Water Ingestion on an Axial Flow Compressor Performance. Proc. Inst. Mech. Eng. Part G J. Aerosp. Eng. 2014, 228, 411–423. [Google Scholar] [CrossRef]
- Liu, L.; Zhang, H.; Li, J.; Yu, C.; Lin, F.; Nie, C. Measurements and Visualization of Process from Steady State to Stall in an Axial Compressor with Water Ingestion. In Proceedings of the ASME Turbo Expo, San Antonio, TX, USA, 3–7 June 2013. [Google Scholar]
- Hill, P.G. Aerodynamic and thermodynamic effects of coolant injection on axial compressors. Aeronaut. Q. 1963, 15, 331–348. [Google Scholar] [CrossRef]
- Zhluktov, S.; Bram, S.; de Ruyck, J. Injection of Water Droplets in an Axial Compressor. In Proceedings of the 5th World Conference on Experimental Heat Transfer, Fluid Mechanics and Thermodynamics, Thessaloniki, Greece, 24–28 September 2001; pp. 1415–1420. [Google Scholar]
- White, A.J.; Meacock, A.J. Wet compression analysis including velocity slip effects. J. Eng. Gas Turbines Power 2011, 133, 081701. [Google Scholar] [CrossRef]
- Sattelmayer, T.; Wittig, S. Internal Flow Effects in Prefilming Airblast Atomizers: Mechanisms of Atomization and Droplet Spectra. J. Eng. Gas Turbines Power 1986, 108, 465–472. [Google Scholar] [CrossRef]
- Schlottke, A.; Weigand, B. Two-Phase Flow Phenomena in Gas Turbine Compressors with a Focus on Experimental Investigation of Trailing Edge Disintegration. Aerospace 2021, 8, 91. [Google Scholar] [CrossRef]
- Melekidis, S. Untersuchung der Tropfenentstehung an Schaufelhinterkanten. Master’s Thesis, University of Stuttgart, Stuttgart, Germany, 2017. [Google Scholar]
- Chaussonnet, G.; Gepperth, S.; Holz, S.; Koch, R.; Bauer, H.-J. Influence of the Ambient Pressure on the Liquid Accumulation and on the Primary Spray in Prefilming Airblast Atomization. Int. J. Multiph. Flow 2020, 125, 103229. [Google Scholar] [CrossRef]
- Esquivias, B.; Hickey, B.; McDonell, V. Investigation of Water Films Shed from an Airfoil in a High-Speed Flow. In Proceedings of the ASME Turbo Expo, Rotterdam, The Netherlands, 13–17 June 2022. GT2022-80350. [Google Scholar]
- Gepperth, S.; Guildenbecher, D.; Koch, R.; Bauer, H.-J. Pre-filming Primary Atomization: Experiments and Modeling. In Proceedings of the 23rd European Conference on Liquid Atomization and Spray Systems (ILASS-Europe), Brno, Cech Republik, 6–8 September 2010. [Google Scholar]
- Gepperth, S.; Müller, A.; Koch, R.; Bauer, H. Ligament and Droplet Characteristics in Prefilming Airblast Atomization. In Proceedings of the ICLASS, 12th Triennial International Annual Conference on Liquid Atomization and Spray Systems, Heidelberg, Germany, 2 September 2012. [Google Scholar]
- Gepperth, S.; Koch, R.; Bauer, H.-J. Analysis and Comparison of Primary Droplet Characteristics in the Near Field of a Prefilming Airblast Atomizer. In Proceedings of the ASME Turbo Expo, San Antonio, TX, USA, 7–11 June 2013. [Google Scholar]
- Inamura, T.; Katagata, N.; Nishikawa, H.; Okabe, T.; Fumoto, K. Effects of Prefilmer Edge Thickness on Spray Characteristics in Prefilming Airblast Atomization. Int. J. Multiph. Flow 2019, 121, 103117. [Google Scholar] [CrossRef]
- Javed, B.; Watanabe, T.; Himeno, T.; Uzawa, S. Effect of Trailing Edge Size on the Droplets Size Distribution Downstream of the Blade. J. Therm. Sci. Technol. 2017, 12, JTST0031. [Google Scholar] [CrossRef][Green Version]
- Javed, B.; Watanabe, T.; Himeno, T.; Uzawa, S. Experimental Investigation of Droplets Characteristics after the Trailing Edge at Different Angle of Attack. Int. J. Gas Turbine Propuls. Power Syst. 2017, 9, 32–42. [Google Scholar] [CrossRef]
- Doerr, T.; Schuster, S.; Brillert, D. PDA Laser Measurements of Droplet Laden Flows in a Four-Stage Axial Compressor. J. Turbomach. 2022, 145, V10AT29A007. [Google Scholar] [CrossRef]
- Ansys Inc. Ansys CFX Solver Modeling Guide; R2021 R1; Ansys Inc.: Canonsburg, PA, USA, 2021. [Google Scholar]
- Baehr, H.D.; Kabelac, S. Gas-Dampf-Gemische. Feuchte Luft. In Thermodynamik: Grundlagen und Technische Anwendungen; Springer: Berlin/Heidelberg, Germany, 2012. [Google Scholar]
- Meher-Homji, C.B.; Mee, T.R. Gas Turbine Power Augmentation by Fogging of Inlet Air. In Proceedings of the 28th Turbomachinery Symposium, Houston, TX, USA, 9 September 1999. [Google Scholar]
- Holmgren, M. X Steam, Thermodynamic Properties of Water and Steam. MATLAB Central File Exchange. Available online: https://www.mathworks.com/matlabcentral/fileexchange/9817-x-steamthermodynamic-properties-of-water-and-steam (accessed on 21 July 2024).
- Fuller, G.N.; Schettler, P.D.; Giddings, J.C. New Method for Prediction of Binary Gas-phase Diffusion Coefficients. Ind. Eng. Chem. 1966, 58, 18–27. [Google Scholar] [CrossRef]
Disclaimer/Publisher’s Note: The statements, opinions and data contained in all publications are solely those of the individual author(s) and contributor(s) and not of MDPI and/or the editor(s). MDPI and/or the editor(s) disclaim responsibility for any injury to people or property resulting from any ideas, methods, instructions or products referred to in the content. |
© 2025 by the authors. Published by MDPI on behalf of the EUROTURBO. Licensee MDPI, Basel, Switzerland. This article is an open access article distributed under the terms and conditions of the Creative Commons Attribution (CC BY-NC-ND) license (https://creativecommons.org/licenses/by-nc-nd/4.0/).