Abstract
This work presents an experimental study of the effect of blade count on the flow field and the radiated noise in a low-speed axial fan with a rotating shroud. A two-component Laser Doppler Velocimetry (LDV) system and Particle Image Velocimetry (PIV) instrumentation have been employed to investigate the flow in the gap region and in front of the rotor blades. Additionally, the fan has been installed in a hemi-anechoic chamber and far-field acoustic measurements have been taken with a microphone mounted on-axis upstream of the rotor to show changes in the spectral features of the radiated noise. The tested rotor is a variable-geometry one that has allowed for studying rotor configurations with different numbers of blades of the same chord and shape, i.e., of the same geometry but different solidity. Rotor pressure rise and flow rate are average quantities that have a relevant effect on the leakage flow. Keeping them fixed while varying solidity allows us to highlight the local effects of circumferential pressure non-uniformity caused by differing blade loading. The results show that, at low solidity, the flow leaving the gap is mainly directed radially outward and follows a longer path before being ingested by the rotor, thus losing strength due to mixing with the main flow. As solidity increases, the flow becomes less radial and is more rapidly ingested by the rotor. In all cases, the sound pressure level spectrum shows marked subharmonic humps and peaks originating from the interaction between the leakage flow and rotor. The departure of such peaks from the blade passing frequency increases with the solidity, while the associated energy increases up to seven blades and then decreases.
1. Introduction
Axial fans used in automotive cooling systems are often equipped with a rotating shroud, a ring that connects the blade tips. This design not only enhances the volumetric efficiency but also improves the structural integrity of the assembly. However, it generates a leakage flow that contains coherent flow structures whose interaction with the rotor blades results in a significant increase in the radiated noise, e.g., Longhouse [1]. Such a noise typically concentrates in the low- to medium-frequency range with subharmonic narrowband humps that may provide the major contribution to the radiated noise, e.g., Canepa et al. [2,3,4]. Such components are typically superimposed to more common noise sources such as the broadband noise generated at the blade trailing edge and the one due to smaller-scale inlet turbulence, and the tonal components at BPF and harmonics; e.g., see Sharland [5]. The noise generated by the leakage flow impinging on the rotor blades is usually influenced by several design and operating parameters, including the geometry of the gap [6], installation (e.g., ducted or open rotor configurations), the blade count [7], and rotor pressure rise and rotational speed [2,3,8]. Previous studies have first concentrated on the features of the radiated noise and then on aerodynamic sources, i.e., the leakage flow and its impingement on the rotor blades; see Fukano et al. [9,10], Piellard et al. [11], Magne et al. [12], Moreau and Sanjose [13], Zenger et al. [14], and Na et al. [15]. Among others, Zenger et al. [14], Mo and Choi [16], Zhu et al. [17], and Lewis et al. [18] have studied the noise radiated by axial turbomachinery with limited attention to the related aerodynamics.
All the aforementioned studies have clearly highlighted the complexity of flow developing in axial fans and the wide range of parameters that determine their efficiency and noise emissions; see also Moreau and Roger [19]. While conducting a comprehensive study of all aspects is challenging and likely unrealistic, examining the impact of a selected number of key parameters can provide valuable insight. This is the goal of an experimental research project on shrouded fans conducted by the present research group for several years, utilizing acoustic measurements carried out in an anechoic chamber as well as Laser Doppler Velocimetry (LDV) and Particle Image Velocimetry (PIV). In Canepa et al. [20], it was demonstrated that the leakage flow pattern can suddenly change due to fan deformation when the pressure rise and the rotational speed are increased, leading to a significant decrease in radiated noise. Subsequently, the effect of the operating point on both the leakage flow pattern and radiated noise was investigated [3]. In the authors’ works [4,20,21,22], the large-scale unsteady flow structures in the leakage flow were analyzed using modal decomposition and statistical methods. The present study extends the previous ones by studying the effects of rotor solidity on the aerodynamics of the leakage flow and the fan noise. Particularly, the flow patterns of some rotors, each with the same blade and gap geometry but different blade counts, are analyzed. Operating points and rotational speed are chosen in order to obtain the same pressure rise and flow rate for all blade counts, so that the difference in flow pattern only depends on the blade solidity. For the same rotor geometries, the sound pressure level (SPL) spectra are reported to highlight the relation between changes in the rotor solidity and noise radiation. Moreover, in order to provide a more complete overview of the radiated noise when varying the solidity, the acoustic tests have been extended to all blade numbers in the range considered for the aerodynamic measurements. This manuscript is an extended version of the ETC16–227 conference proceeding [23]. The paper organization is as follows: Section 2 outlines the experimental setup and measuring techniques. The time-averaged and phase-locked velocity field within the rotor gap and in front of the rotor are presented in Section 3. Section 4 discusses the effects of solidity on the frequency content of the sound pressure level spectrum. Finally, concluding remarks are provided in Section 5.
2. Experimental Facility and Measuring Techniques
2.1. Investigated Rotor and Experimental Setup for the Aerodynamic Measurements
The aerodynamic measurement campaign was carried out in the DIME Aeroacoustics laboratory with the fan mounted on a test stand designed according to ISO 5801 norms [24]. The tested rotor is an aluminum prototype with variable solidity (), as the number of blades (z) can be changed from 3 to 11. Aerodynamic tests were performed on four rotors with , 4, 6, and 9, yielding a mid-span solidity , 0.192, 0.288, and 0.432, respectively. In general, changing z while the pressure rise across the rotor is kept constant yields a variation in blade loading and thrust as a result of the variation. The four rotors are depicted in Figure 1 together with their characteristic curves. The unmounted prototype is shown in Figure 2. It was obtained by means of a numerically controlled milling machine, yielding a very precise geometry. Unlike rotors commonly employed in real cooling modules, it is relatively stiff in comparison, which thus prevents deformation due to the aerodynamic thrust centrifugal force. The rotor has a tip radius mm, a hub-to-tip diameter ratio of 0.374, and a chord c which varies between 43 mm and 50 mm from hub to tip. The gap between the rotating ring and the stationary casing is 5 mm wide in both the axial and radial directions; see Figure 3. The flow and pressure rise coefficients are defined respectively as and , where = ( being the rotational speed), Q is the volume flow rate, and is the fan pressure rise (outlet static pressure minus inlet total one). The measurement campaign was carried out at different combinations of , , and , so that the same Q and yield for all of the rotors (0.79 m3/s and 75 Pa, respectively). The operating points are summarized in Table 1. The practical interest of this choice is that it allows us to compare different geometries that accomplish the same specifications in terms of Q and . Such a choice also allows us to verify if Q and have a major influence on the leakage flow and related noise, or whether other relevant parameters such as z and have a significant effect.
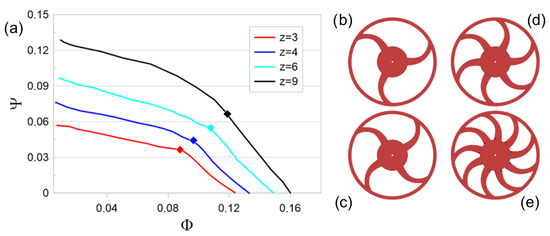
Figure 1.
Rotor geometry and characteristic curves: (a) characteristics curves with diamond symbols indicating the investigated operating points corresponding to Pa and m3/s; (b–e) 3-, 4-, 6-, and 9-blade configurations.
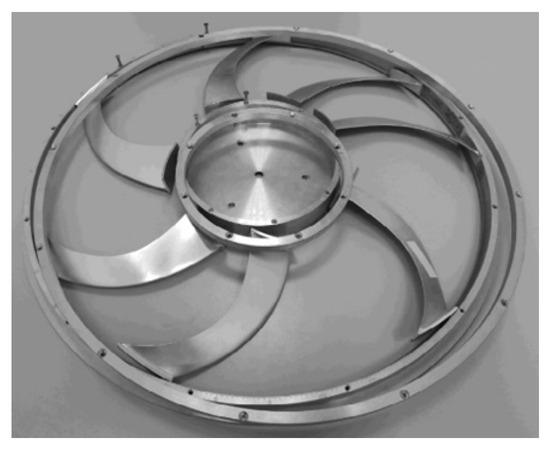
Figure 2.
Unmounted aluminum variable geometry rotor.
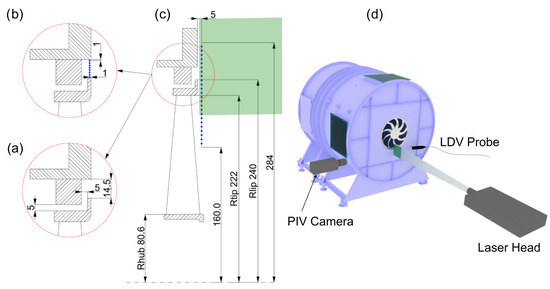
Figure 3.
Experimental facility: (a) rotor gap geometry; (b) in-gap LDV traverse; (c) LDV traverse and PIV measuring plane (green box); and (d) ISO 5801 test-rig and experimental setup (LDV and PIV).

Table 1.
Geometrical and operating parameters of the fans studied by means of PIV and LDV instrumentation.
The non-dimensional characteristic curves reported in Figure 1a show that, at fixed , increases with z, i.e., with . Such a feature may be explained based on the classic theory of blade cascade aerodynamics, which shows that the static pressure rise is proportional to the product of z and blade thrust. As the latter depends on the angle of attack and hence on Q, keeping Q constant implies a constant blade thrust, thus justifying the dependence on z. Such an explanation neglects several factors, such as the possible interaction between neighboring blades. Furthermore, based on such an explanation, if is kept constant, a linear dependence of on z would be expected. However, this is clearly not observed as it would have also resulted in all of the curves converging toward the same when . On the contrary, such a common point seems to be located at negative . This apparent inconsistency may be explained considering that the cascade theory applies to the static pressure rise, while the plotted quantity is based on the total-to-static pressure rise, which is smaller than the static-to-static one since the inlet static pressure is smaller than the inlet total pressure.
2.2. Aerodynamic Measurement Procedures and Data Processing Techniques
A four-beam two-colored LDV system (Dantec Fiber Flow), operating in backward scatter configuration and that allows us to measure two velocity components simultaneously, was employed. The probe volume had a diameter of 0.09 mm and a length of 1.4 mm. The flow was seeded by means of a fog generator whose droplet mean diameter range was 0.5–2 μm. The optical probe was stiffly mounted on a three-axis computer-controlled traversing mechanism. The optical signals were collected by a Burst Spectrum Analyzer (Dantec BSA P70 processor), with accuracy better than 0.1% of the bandwidth. For each measurement point, 200,000 samples were collected with a data rate typically ranging from 1 kHz up to 5 kHz. As a consequence, the mean data collection time was about 80 s, corresponding to about 3200 rotor revolutions at rpm and to about 2000 revolutions at rpm. The measurements were initially performed on a radial traverse located 5 mm upstream of the panel front surface, i.e., less than one axial chord upstream of the blade leading edge (LE), ranging from mm to mm (i.e., from about midspan to the external region) with a step of 5 mm; see Figure 3c. Measurements along a second traverse were also taken in order to characterize the flow in the gap. This traverse is located 1 mm inside the gap in the axial direction from the panel upstream surface. It constitutes 8 measurement points located 1 mm from the ring lip to 1 mm to the stationary external ring, thus resulting in a spacing between points equal to 1.79 mm (Figure 3b). The axial () and radial () velocity components were measured along a vertical traverse, with the LDV probe axis oriented at an 11-degree angle relative to the rotor axis on a horizontal plane. The probe was intentionally tilted to enable it to enter the rotor gap while avoiding interference with the stationary part of the assembly. As a result, was correctly measured; however, the recorded horizontal velocity component also included a contribution from the circumferential one, which was removed by subtracting the phase-locked averaged tangential component () from the phase-locked . was measured along horizontal traverses at the same spacing and distance, with the LDV probe axis forming a 25-degree angle relative to the fan axis in a vertical plane. This configuration, designed to minimize noise from reflected light, ensures that is accurately measured without interference from other components.
In the experiments, an ensemble average technique suitable for LDV data processing was applied. The instantaneous velocity samples were sorted into 180 phase bins per revolution, each representing a particular instant within the rotational period, i.e., a 2-deg window in the relative frame. According to the triple decomposition scheme proposed by Hussain and Reynolds [25], a generic velocity component v at a generic position can be represented as the sum of the time-averaged contribution , the zero-average periodic component , and the random fluctuation :
The periodic velocity component can be obtained by ensemble-averaging the samples:
where is the index of the phase bins into which the rotor revolution is subdivided and is the index of the samples for each window associated with the ith phase. The ensemble-averaged standard deviation (std), which is representative of the unresolved unsteadiness, is given by
The ensemble-averaged turbulence intensity may be computed based on the standard deviation of the three velocity components:
In fact, the quantity is related to the energy of the unresolved unsteadiness, which includes both small-scale turbulence and large-scale non-periodic flow structures. A comprehensive review of the errors in LDV measurements and guidelines to evaluate them are given by Boutier [26] and Strazisar [27]. A specific evaluation of the errors for frequency domain processors is given by Modarress et al. [28]. For the experiment here, the uncertainty in the instantaneous velocity was evaluated to be less than 1%. In order to avoid the statistical bias in time averages due to the non-uniform data sampling intrinsic of LDV measurements, velocity components and related quantities were computed based on the ensemble-averaged ones (Lyn et al. [29]), i.e., the property that has been employed. For the present experiment, the angle bias has been kept lower than 1% of the mean velocity by means of the Bragg cell, which moves the fringe pattern in the probe volume. Statistical uncertainty in ensemble-averaged velocity components and related standard deviation depends on the number of sampled data, turbulence intensity based on the local velocity (and not on ), and confidence level; see [26]. Considering a typical set of 1000 sampled data per each phase bin, a confidence level of 95%, and a maximum turbulence intensity of 50%, uncertainties of ±3% and ±5% are expected for the ensemble-averaged velocities and related std, respectively. In contrast, statistical uncertainties smaller than 1% may be expected for the time-mean velocity components and related std.
The flow field was also investigated in the meridional plane close to the tip gap by means of a 2D-PIV system, namely in a rectangular area located at mm from the ring with extension mm and mm, i.e., = 0.89–1.42 and = 0.005–0.86 (see the green box in Figure 3c). The PIV system constituted a double-cavity Nd:YLF pulsed laser Litron LDY 300 (energy 30 mJ per pulse at 1000 Hz repetition rate, 527 nm wavelength) that generates a light sheet of 1 mm thickness. The scattered light was captured by a high-sensitivity SpeedSense M340 digital camera with a cooled 2560 × 1600 pixels CMOS matrix. Datasets of 1500 instantaneous vector fields per operating condition were obtained, acquiring 250 images pairs per second, i.e., for 6 s, which correspond to 240 rotor revolutions at 2400 rpm and 150 at 1500 rpm. The same fog generator as the one employed for the LDV measurements was used to seed the flow. The velocity fields (i.e., and ) were obtained using a spatial cross-correlation function yielding instantaneous vector fields constituting 83 × 116 points on a square grid of a 1.5 mm step. According to the PIV error analyses of Grant [30] and Prasad et al. [31], the experimental uncertainty for the instantaneous velocity is estimated to be 4%. In order to remove outliers, data were post-processed by means of range scale and peak validation. Then, all instantaneous vector fields were further processed by means of the ensemble average.
2.3. Acoustic Measurement Procedure and Data Processing Technique
The acoustic pressure was measured in the DIME hemi-anechoic chamber by means of a single pre-polarized free-field microphone 4189-A-021 mounted on-axis 1 m upstream of the rotor at a height of 1.15 m from the floor; see Figure 4. Due to the low-frequency limit of the hemi-anechoic chamber, only the parts of the SPL spectrum at Hz can be considered. Since acoustic measurements require significantly less time than aerodynamic ones, all rotors with blade counts ranging from 3 to 9 were tested. This allowed us to obtain a detailed picture of the z effect on the radiated noise. A spectrum analyzer 3560-B was employed to process the data. In principle, the absence of data acquired at other locations constitutes a drawback, since it prevents us from evaluating both directivity and the power level. However, the usefulness of the measurements is not impaired, as the present work is primarily aimed at evaluating the quality of the radiated noise. In fact, the noise sources relevant to low-speed fans do not have important directivity variations opposite to, for example, the ones active in aeronautic propellers. Hence, in terms of qualitative trends of the SPL spectrum, the noise received on-axis is representative of the radiated power, and it is also expected that directivity has a limited dependence on z. In addition to this, previous measurements [32] show that the leakage flow noise is only negligibly affected by the waves reflected from the chamber floor, i.e., the assumption of free-field conditions holds although measurements were taken in a hemi-anechoic chamber. First, the SPL spectra were computed considering data records and frequency resolution Hz with a von Hann window and 50% superposition of the records. Successively, was considered to improve (0.4 Hz) and to provide a more detailed characterization of the peaks/humps in the low- to mid-frequency range of the SPL spectrum. Considering instrumental and computational errors, the uncertainty in the SPL spectrum is not expected to exceed ±1 dB; see [21]. For the present rotor, the test environment and neighboring solid bodies, including test plenum, blades, vanes, mounting devices, etc., always result in reflections, scattering, and diffraction of the acoustic waves, thus causing modifications in the SPL spectrum which do not correspond to variations in the source strength. Among others, test plenum and mounting devices were found to cause important SPL variations below 1 kHz, often superposing to peaks related to both the leakage and tonal noise components. Such spurious effects were strongly reduced by means of the algorithm reported in [33]. Based on SPL spectra related to different , such an algorithm is able to extract a propagation function directly related to the Green function that accounts for the abovementioned effects. This procedure was applied to the spectra of each rotor; then, the propagation functions were averaged and subtracted from the row SPL spectra, yielding trends whose variations are mainly due to the aerodynamic source. More details on these aspects will be provided in Section 4.
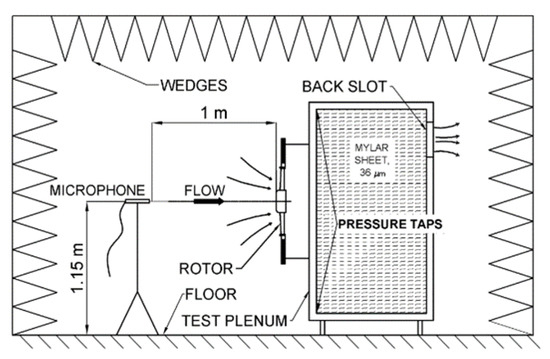
Figure 4.
Experimental arrangement for the acoustic measurements in the hemi-anechoic chamber.
3. Effects of Solidity on the Leakage Flow
3.1. Two-Dimensional Time-Averaged PIV Measurements of the Leakage Flow in the Meridional Plane Upstream of the Rotor
Figure 5 shows time-averaged two-dimensional PIV data for the cases , 4, 6 and 9. The PIV time-mean results are aimed at providing a clear picture of the effect of the blade count variation on the gap flow at fixed Q and . The modification of the time-mean leakage flow pattern is highlighted by the contour plot of superimposed to the vector plot of the velocity field. For , the flow leaving the gap exhibits strong positive values of close to the panel, i.e., for . Nevertheless, a recirculation bubble attached to the rotor ring is also observed, with a portion of the leakage flow being re-ingested by the rotor. The presence of centrifugal and centripetal components in the flow exiting the gap may be attributed to its interaction with the bulk flow entering the rotor. This phenomenon takes place at about and (black round symbol in the plot). Such kind of behavior has not been observed in any of the authors’ previous work on similar fan geometries but with higher . What is shown here may also be the statistical representations of an oscillating leakage flow pattern, moving from an attached to a more radial configuration; see, e.g., [22]. As the number of blades increases (, second plot), decreases in the region , i.e., at higher radii than the gap one. Indeed, the flow leaving the gap forms a larger recirculation bubble compared to the case of , and most of the leakage flow is recirculated to the rotor inlet. When further increasing z, the flow leaving the gap is immediately re-ingested by the rotor. In the cases and 9, a smaller recirculation bubble is observed, which is substantially of the same size for these two configurations. Overall, a significant variation in the leakage flow pattern and its interaction with the main incoming flow is observed when varying . The present work specifically addresses the effect of at fixed Q and , i.e., performance, rather than the one of and , i.e., the operating conditions. Namely, in contrast to what could be expected, the behavior of the flow leaving the gap is not a function of only , which generates the leakage flow, and Q, which is related to the kinetic energy of the inlet flow, which in turn interacts with the leakage flow. In the following sections, it will be shown that the leakage flow pattern modification extensively affects the velocity field and the turbulence intensity level in front of the rotor, as already observed in previous works [3,20,22]. LDV traverses have been performed to provide a detailed characterization of the flow inside the gap and in front of the rotor and the response of all three velocity components to changes.
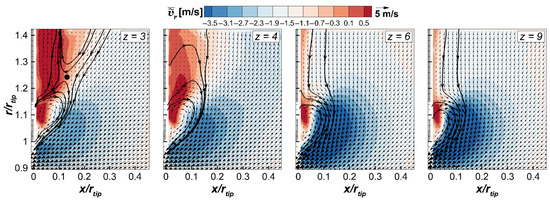
Figure 5.
Vectorial representation of time-mean flow field with superimposed contour plots of .
3.2. LDV Measurements in the Rotor Gap
The time-mean velocity components , , and in the gap region, as well as the time-mean turbulence intensity are reported in Figure 6. The velocity components are scaled with the bulk velocity computed as the ratio between Q and the fan area. Negative values indicate that the leakage flow is leaving the gap moving upstream. The negative peak of is slightly affected by z and, for the case , i.e., at the lowest solidity, its radial distribution is almost flat above . As increases, the leakage flow is confined instead in the central part of the gap where the minima is located for the cases . Then, at large radii ( 1.134), progressively reduces its magnitude as increases. Close to the rotating ring, becomes progressively less negative, hence reducing the gap flow, and in the point closest to the lip is positive (the flow enters the gap from upstream). Such a behavior is peculiar and may be ascribed to some flow separation occurring in the lip area.

Figure 6.
Radial distributions of time-mean velocity components and turbulence intensity level acquired by means of LDV instrumentation in the gap region at . Data are scaled with the bulk velocity based on Q and the fan area.
The profiles indicate that the flow is centrifugal for all the geometries (), with the maxima located at . The largest values are attained in the case of and then progressively reduce as increases. The distributions indicate that, for , the case is characterized by the largest tangential component. Similarly to the radial component, the tangential one also reduces progressively as increases. This aspect is somehow unexpected since, with constant pressure rise, and consequently an average work exchange, the flow should experience the same average tangential component between the different geometries. These differences suggest that the mechanism feeding the leakage flow is related to the flow field near the inner part of the rotating shroud, where the velocity components are strongly related to the blade number and loading conditions [8]. For 1.1, the and 9 cases show similar behaviors with values ranging from 2 to 2.4. In the other two cases ( and 6), increases up to values larger than 3.6. Such an aspect may not be easily explained, even if it has to be underlined that, in the same zone (), the profiles also show similar trends for and 9, and for and 6, respectively. The profiles suggest that the leakage flow is highly turbulent, since the minimum values have the same order of magnitude of the maxima. As a general remark, the profiles may be divided into two regions. For , the large geometries present the largest values. In contrast, for 1.108, the behavior is the opposite.
Figure 7 shows the phase-averaged velocity component distributions in the gap area. In order to improve the readability of the plots, a single 130-deg sector is depicted to enlarge the plots without losing information. The distributions indicate that a certain periodicity is present for all the considered geometries. In the gap zone, a region of localized minimum values of is observed (indicated by the blue contoured area). Its tangential and radial extension, as well as the magnitude, strongly depends on . In the case , the maximum extension is reached with values close to −1.2. Moreover, this zone has a spiral shape and wraps about the axis opposite to the rotation direction, reaching the external gap radius () within nearly three blade tip chords. In the case, such an area of negative has smaller extension and magnitude but has the same shape as in the case. In contrast, in the two remaining cases, the spiral shape modifies in a circular one. Such a characteristic indicates that these minimum spots are confined in the central part of the gap section. Furthermore, even the minimum values reduce as increases. The distributions are in agreement with the ones, indicating that periodicity also weakens for this component as increases. Moreover, this confirms that the leakage flow has a centrifugal behavior at all tangential locations in the gap. Unlike and , is more uniform. In the case, only a maximum is present, with the same location as the ones of the other components’ maxima. For , six large values are located close to the fan ring, while reduces along the radial coordinate. In the case, shows the lowest values compared to the other geometries. In the case , the unresolved unsteadiness has again a periodic behavior with a turbulent spot located close to the rotating ring, and nearly coincident with the one. At larger radii, progressively reduces. As increases, the periodic pattern weakens and disappears for since the distribution is nearly uniform. In summary, the analysis of these results shows that both the mean and the periodic parts of the leakage flow are strongly sensitive to and to the blade loading.
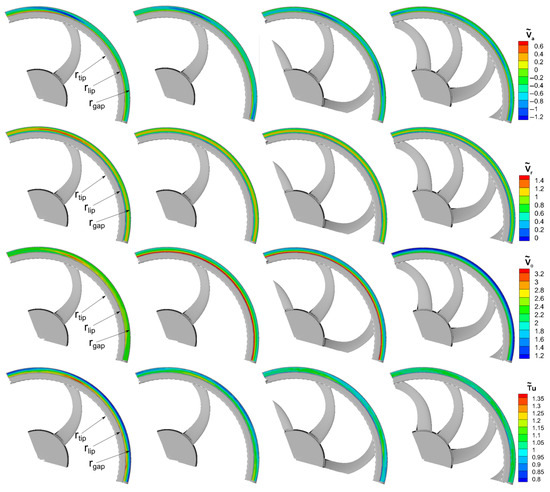
Figure 7.
Phase-averaged distributions of velocity components and turbulence intensity level acquired by means of LDV instrumentation within the gap at .
3.3. LDV Measurements in Front of the Rotor
Figure 8 shows the radial distributions of , , , and in front of the rotor at (see Figure 3c). These data show the effects of on the velocity fields in front of the rotor due to changes in the leakage flow pattern. The axial component is only marginally affected by the variation in the number of blades. Its minimum negative peak moves slightly outwards for the cases and 4 compared to the other ones, consistently with an increased radial migration of the leakage flow for these conditions (see Figure 5). For and 4, positive values of are indeed observed above the blade tip, i.e., 1. For , is slightly positive in the gap region, while for , the flow is always centripetal. For , i.e., below the blade tip, the higher the number of blades, the lower , with for all cases.

Figure 8.
Radial distributions of time-mean velocity components and turbulence intensity level acquired by means of LDV instrumentation at . Data are scaled with the bulk velocity based on Q and the fan area.
The effects of changes in blade count on the flow field upstream of the rotor are primarily seen in the radial distribution of . For and 4, large values of are observed above the gap (). They are associated to the flow leaving the gap and co-rotating with the rotor, which moves at higher radii at reduced . is substantially negligible at these locations for and 9, for which the flow leaving the gap stays attached to the rotor ring. Indeed, larger values of are present near the ring lip for and 9 (). For , the cases and 6 show the largest values of . These two cases exhibit almost the same maximum peak of , similarly to the case , but the different patterns of the leakage flow observed for these configurations (see Figure 5) result in different distributions of the moment of momentum in front of the rotor blades. For , the leakage flow moves mostly radially outwards. Then, it is expected to interact with the main flow, losing moment of momentum before being re-ingested by the rotor. As a result, is lower in the blade region compared to cases and 6. For these latter cases, the leakage flow is mostly attached to the rotor. The case shows higher values of for , while for , the case shows the largest values of the tangential velocity. This is due to the largest recirculation bubble observed for that allows the leakage flow to penetrate at lower radii, thereby increasing the local values of . Compared to cases and , in the case , the larger blade loading results in the greatest influence of the leakage flow in the traverse upstream of the rotor. Hence, larger values of are observed.
The distributions reported in Figure 8 indicate that, overall, the highest turbulence levels correlate with higher blade loading, that is, with the smallest z. All geometries show high turbulence levels in front of the gap region, which is likely associated with the leakage flow structures. Then, cases ,4 show high values for 1, again due to the radial migration of the leakage flow. Contrarily, low levels are observed at these positions for and 9. For 1, the highest values are still observed for the cases and 4, even though for cases and 9, the leakage flow has been shown to be directly re-ingested by the rotor. Therefore, the high turbulence characterizing the gap flow near the ring lip for the cases and 4 (see Figure 6) seem to lead to a higher turbulence level in front of the rotor, despite the longer path followed by the leakage flow in these two cases.
Figure 9 shows the phase-averaged velocity and turbulence level distributions in front of the fan for the same radial traverse reported in Figure 8. The lower , the higher the periodicity of the velocity components as well as of . Particularly, tangential variations in , , , and are observed for cases and 4, for which changes in the leakage flow patterns have been highlighted with respect to and 9. For and 4, the minima and maxima of and are located in front of the gap at angular positions that are different from the blade leading edge ones. This indicates that in the blade channel, the leakage flow may leave the gap pointing upstream and rotating with the rotor ring. Also, negative values are present at these positions. Thus, the coherent structures embedded in the leakage flow might be re-ingested by the rotor before interacting with the subsequent blade. In contrast, attains its maximum values in front of the gap region at angular positions close to the blade pressure side. The larger blade loading likely causes a localized increase, thus indicating that the leakage flow tends to move radially outwards close to the rotor blades rather than between them. As increases, i.e., and 9, the circumferential variation of all the velocity components becomes substantially negligible in front of the gap. This indicates that the reduced loading weakens the blade effect on the leakage flow evolution upstream of the rotor. Finally, the distributions show high levels of fluctuations in front of the gap region for all blade counts. For and 4, high values are observed near the blade tip. These localized high levels of unsteadiness are associated to the perturbation of the blade loading due to impinging turbulence, whose effects become significant for the low configurations. Such features again highlight the key role played by the blade loading in the definition of the spatial distribution of the leakage flow and of its possible interaction with the rotor blades.
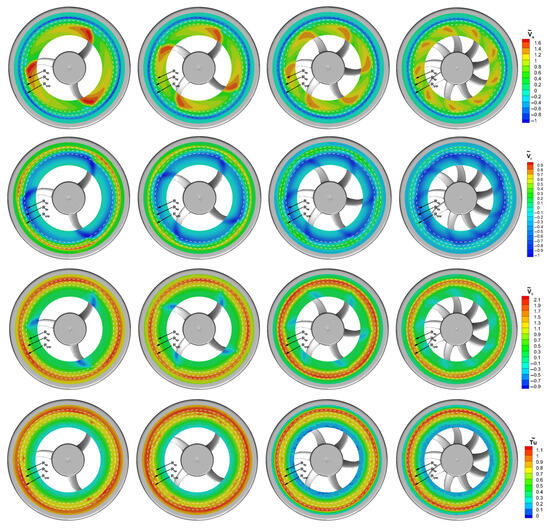
Figure 9.
Phase-averaged distributions of velocity components and turbulence intensity level acquired by means of LDV instrumentation at .
4. Effects of Solidity on the Radiated Noise
Figure 10 reports the SPL spectra related to the four rotors tested aerodynamically. In all of them, the possible distortions due to propagation effects have been minimized, subtracting an average propagation function G computed by means of the method reported in Canepa et al.’s work [33]; see also Section 2.3. Such a propagation function is reported in Figure 11 and shows four dips below 1 kHz and an oscillating trend between 2 kHz and 3.5 kHz. Only the dips affect the part of the spectra relevant to the present study. The oscillations are due to vibrations of the plastic walls of the test plenum, which in turn depend on the tensile stress generated by the pressure inside the plenum. They cannot be completely eliminated by the spectral decomposition algorithm since the modal frequencies of the plastic sheet depend on the rotational speed through the pressure rise. However, they affect a range of the spectrum that is not of interest to the present study and are thus disregarded. In the top plots, the SPL spectra are plotted up to 5 kHz ( Hz, ) with the aim of showing the overall trend. In the bottom plots, the SPL spectra are plotted versus the Strouhal number divided by the blade number, i.e., . Accordingly, the blade passing frequency (BPF) corresponds to in all cases. The spectra are shown up to the third harmonic of the BPF. To provide a more detailed characterization of the SPL spectra in the low- to mid-frequency range, where the leakage noise has a major effect, Hz is adopted. As a result, differences in level between the two sets of spectra of about 4 dB appear.
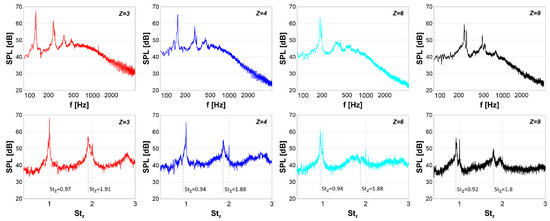
Figure 10.
SPL spectra for the cases , 4, 6, and 9. Top plots: Frequency resolution 1 Hz, . Bottom plots: Frequency resolution 0.4 Hz, .
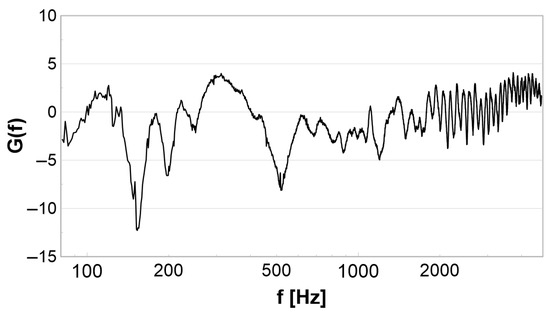
Figure 11.
Acoustic propagation function G.
For all rotors, the top plots show the typical trends of fan SPL spectra. Peaks at some BPF harmonics, representing tonal components mainly due to the ingestion of large-scale turbulent structures, generated inside the anechoic chamber, are present together with broader peaks or narrowband humps at subharmonic frequencies, which are typical of the leakage flow. All of these are superimposed to the typical trend of the broadband part of the spectrum related to small-scale inlet turbulence (at low frequencies) and self-noise due to the blade boundary layer (at high frequencies). Differences in the broadband part may be explained considering the gross inverse proportionality of z and blade loading, leading to a different boundary layer growth. As for the differences in height of the BPF peaks related to different rotors, one should consider that, although they are located at the same , different z values yield peaks at different , which are thus related to different harmonics of . This makes it difficult to find a rational basis for comparing their levels. Furthermore, considering that such components are not an intrinsic characteristic of fan noise but depend instead on the installation, tonal noise peaks are disregarded. As previously mentioned, leakage noise appears as peaks broader than the ones at the BPF harmonics, or even narrowband humps, located at subharmonic frequencies. The frequency shift is related to the residual prerotation of the leakage flow when it impinges on the rotor blades. This depends on the operating point and on the decay of the related angular momentum before being re-ingested. Typically, a shift of about 5% of the corresponding BPF harmonic is common.
To establish a direct link between the features of the flow and of the SPL spectra, a detailed analysis of the unsteady flow would be needed, focusing primarily on the strength and coherence of the large-scale flow structures impacting on the blades. The strength influences the power related to the peaks (height and width), while the coherence affects their shape (height-to-width ratio). Such an in-depth analysis extends beyond the scope and possibilities of the present work, but some key observations are noteworthy and some interesting conclusions may be inferred. First, although subharmonic peaks and humps can be seen across all cases at = 1, 2, 3, only the first two have amplitudes that significantly exceed the background noise generated by smaller-scale flow structures, which this paper focuses on. In cases and , two subharmonic peaks are present, with the second one at almost integer multiples of (1.94 vs. 0.97 for , and 1.8 vs. 0.92 for ). For , identifying a peak close to is hard as it has blended with the one at the BPF, but a strong peak appears at . As increases, i.e., at and 9, the first subharmonic peak increases in level and exceeds the second one, in contrast to cases and 4, where the second peak is higher than the first one. Notice that the frequency shift with respect to the BPF increases with z, and the first peak for the case is the highest one. The absence of monotonicity in these trends prevents from drawing definite conclusions, but differences between cases and 4 on one hand, and and 9 on the other hand may be ascribed to the different leakage flow patterns (see, e.g., Figure 5): in the latter cases, the leakage flow is rapidly re-ingested by the rotor, likely conserving its moment of momentum, while in the former cases, the longer path likely results in a stronger mixing with the main flow and in a smaller moment of momentum in front of the rotor blade. The LDV results reported in Figure 8 show that the highest values of in the blade tip region take place for case , which is consistent with the high subharmonic peak detected for this condition. High values of are also present in the case . Nevertheless, the low of cases and 4 may make the rotor more permeable to the leakage flow, yielding a weaker interaction with the blades and, hence, a weaker leakage noise. These features become clearer when examining the features of the SPL spectra in the low- range for any z ranging from 3 to 9. Again, all of the data were preliminarily processed by means of the procedure described in Section 2.3.
Figure 12 reports a contour plot of the SPL spectra versus z and . It is worth recalling that z is an intrinsically discrete variable and, hence, the plot has to be intended as a sequence of horizontal stripes, each related to one value of z. Furthermore, two other plots are included. The first one reports , the value of the first subharmonic peak (the dotted crest in the contour), and the second one reports , the SPL related to the first peak. was computed by means of the following well-known formula:
where the summation extends to all frequency bands included in the relevant range. Namely, it includes all the points about the subharmonic peak whose contribution to the integral is relevant, i.e., the ones included in a range of a 10 dB height below the peak. Prior to the summation, the contribution of the tonal components at the BPF was removed from the spectra. This is of major importance in cases and 4, since the first subharmonic peak merges with the BPF one; see Figure 10: in the former case, a lower side peak may be detected at , while in the latter, a kind of knee may be detected at on the left-hand side of the peak at BPF. Then, the subharmonic hump is reconstructed, assuming that the peak at the BPF is symmetric. This has allowed us to estimate the tonal-noise-related part of the SPL on the low-frequency part (left-hand side of the peak) based on the high-frequency part (right-hand side). Hence, the corresponding acoustic intensity was computed as and subtracted to the original one, which includes the observed knee. This was performed point by point, yielding the estimated trend of the subharmonic hump. Focusing on the first subharmonic peak/humps makes sense since prominent peaks are well-known sources of annoyance compared to even stronger broadband parts; e.g., see [34]. In the contour plot, besides the crests associated with the tonal components, the ones related to the leakage noise are apparent. The first one has a frequency shift increasing with z, since it moves toward smaller , and the related SPL increases with z up to , where it peaks and starts decreasing. Such trends are represented in the right plot of Figure 12. The second subharmonic crest is broader and less sharp and also bifurcates as z increases. The higher-order subharmonic crests appear as lower-level humps in the low-z areas of the plot, becoming less important as the order increases. Such less definite trends could be related to a loss in coherence in the large-scale flow structures emanating from the gap, whose contribution to the SPL spectrum affects a broader frequency range but more uniformly.
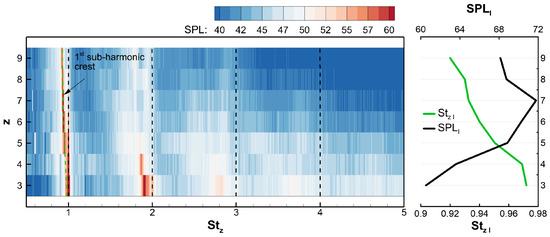
Figure 12.
Left: Contour plot of SPL spectra for z = 3:9 plotted versus . Right: value of the first subharmonic leakage-related peak and its corresponding SPL value.
5. Conclusions
An aeroacoustic experimental study of the effect of solidity on the leakage flow and related noise of a low-speed fan for automotive cooling applications has been presented. The aerodynamic analysis is based on LDV and PIV measurements and the acoustic one is based on single-microphone measurements in a hemi-anechoic chamber.
The effect of solidity has been studied by varying the blade number, and the rotational speed has been tuned to keep both flow rate and static pressure rise constant. Beyond its practical interest, such a choice of the operating points allows us to verify if, for a fixed blade geometry, flow rate and static pressure rise are the major parameters affecting the leakage flow, or if other relevant parameters such as blade cascade solidity also have an import effect. As aerodynamic measurements are very time-consuming, only four cases have been investigated (blade numbers equal to 3, 4, 6, and 9), while the acoustic ones have included rotors with 5, 7, and 8 blades.
PIV measurements carried out in a meridional plane upstream of the rotor have revealed a strong effect of the solidity on the leakage flow pattern. More specifically, at low solidity, the flow leaving the gap is mainly directed radially outward and follows a longer path before being ingested by the rotor, thus losing strength due to mixing with the main flow. As solidity increases, the flow becomes less radial and is more rapidly ingested by the rotor. Eventually, the leakage flow re-enters the rotor while remaining substantially attached to the ring lip. No matter the moment of momentum at the gap exit, the shorter the path, the larger the residual moment of momentum at the rotor inlet. This behavior also reflects the time-mean LDV data acquired in the rotor gap as well as in front of the rotor blades.
Then, the LDV data are phase-averaged, showing circumferential variations of both the velocity field and the turbulence distribution that depend on the blade number. Such circumferential variation decreases with solidity. This is consistent with the assumption that the blade loading required to obtain the same pressure rise is inversely proportional to solidity, implying that a smaller solidity yields larger circumferential pressure variations within neighboring blades. Likely, this results in a leakage flow that not only depends on the average pressure rise across the rotor and on the flow rate but is also influenced by the solidity.
In the acoustic measurement campaign, all the blade numbers from three to nine are considered. The tonal noise components at the BPF and its harmonics are disregarded as they strongly depend on the installation and are not intrinsic to the noise generation. Hence, attention is focused on the subharmonic peaks/humps related to leakage noise. Two aspects of the main subharmonic peak have been considered: its power and the shift in its characteristic frequency from the blade passing frequency. Such a shift has a trend that monotonically increases with solidity, as the peak gradually departs from the blade passing frequency and moves toward smaller values. On the contrary, the power increases with solidity up to seven blades and then starts decreasing. The former trend is consistent with the increase in the tangential velocity component of the leakage flow at the rotor inlet and may thus be related to the shorter leakage flow path characteristic of large solidity. As for the latter trend, finding an explanation in the aerodynamic results does not seem straightforward. Besides the leakage flow strength at the rotor inlet, a more complicated effect of the blade number is likely involved, which may not be identified based on measurements taken at few operating points only. Possibly, the lower the solidity, the higher the permeability of the rotor and the weaker the interaction between blades and leakage flow. In order to further explore this aspect, the joint effect of operating point and solidity has to be studied systematically.
Author Contributions
Conceptualization, E.C.; Data curation, T.A., E.C., M.D. and A.N.; Methodology, M.D.; Writing—original draft, E.C. and M.D.; Writing—review and editing, A.C. All authors have read and agreed to the published version of the manuscript.
Funding
This research received no external funding.
Data Availability Statement
Data is contained within the article.
Conflicts of Interest
The authors declare no conflicts of interest.
Nomenclature
| rotational speed | |
| z | number of blades |
| Strouhal number scaled with z | |
| SPL | sound pressure level |
| pressure rise across the rotor | |
| time-mean velocity component | |
| flow coefficient | |
| turbulence intensity | |
| rotor solidity | |
| Strouhal number | |
| BPF | blade passing frequency |
| Q | volume flow rate |
| fluctuating velocity component | |
| periodic velocity component | |
| loading coefficient | |
| subsets used for FFT | |
| Subscripts | |
| a | axial velocity component |
| tangential velocity component | |
| r | radial velocity component |
References
- Longhouse, R. Control of tip-vortex noise of axial flow fans by rotating shrouds. J. Sound Vib. 1978, 58, 201–214. [Google Scholar] [CrossRef]
- Canepa, E.; Cattanei, A.; Zecchin, F.M.; Milanese, G.; Parodi, D. An experimental investigation on the tip leakage noise in axial-flow fans with rotating shroud. J. Sound Vib. 2016, 375, 115–131. [Google Scholar] [CrossRef]
- Canepa, E.; Cattanei, A.; Mazzocut Zecchin, F. Leakage noise and related flow pattern in a low-speed axial fan with rotating shroud. Int. J. Turbomach. Propuls. Power 2019, 4, 17. [Google Scholar] [CrossRef]
- Canepa, E.; Cattanei, A.; Moradi, M.; Nilberto, A. Experimental Study of the Leakage Flow in an Axial-Flow Fan at Variable Loading. Int. J. Turbomach. Propuls. Power 2021, 6, 40. [Google Scholar] [CrossRef]
- Sharland, I.J. Sources of noise in axial flow fans. J. Sound Vib. 1964, 1, 302–322. [Google Scholar] [CrossRef]
- Ottersten, M.; Yao, H.; Davidson, L. Inlet gap effect on aerodynamics and tonal noise generation of a voluteless centrifugal fan. J. Sound Vib. 2022, 540, 117304. [Google Scholar] [CrossRef]
- Masi, M.; Danieli, P.; Lazzaretto, A. Effect of Solidity and Aspect Ratio on the Aerodynamic Performance of Axial-Flow Fans with 0.2 Hub-to-Tip Ratio. J. Turbomach. 2023, 145, 081008. [Google Scholar] [CrossRef]
- Neshat, M.A.; Canepa, E.; Cattanei, A. CFD study of the leakage flow in low-speed axial-fan with rotating shroud. In Proceedings of the 15 th European Conference on Turbomachinery Fluid Dynamics & Thermodynamics, Budapest, Hungary, 24–28 April 2023. [Google Scholar]
- Fukano, T.; Takamatsu, Y.; Kodama, Y. The effects of tip clearance on the noise of low pressure axial and mixed flow fans. J. Sound Vib. 1986, 105, 291–308. [Google Scholar] [CrossRef]
- Fukano, T.; Jang, C.M. Tip clearance noise of axial flow fans operating at design and off-design condition. J. Sound Vib. 2004, 275, 1027–1050. [Google Scholar] [CrossRef]
- Piellard, M.; Coutty, B.B.; Le Goff, V.; Vidal, V.; Perot, F. Direct aeroacoustics simulation of automotive engine cooling fan system: Effect of upstream geometry on broadband noise. In Proceedings of the 20th AIAA/CEAS Aeroacoustics Conference, Atlanta, GA, USA, 16–20 June 2014; p. 2455. [Google Scholar]
- Magne, S.; Moreau, S.; Berry, A. Subharmonic tonal noise from backflow vortices radiated by a low-speed ring fan in uniform inlet flow. J. Acoust. Soc. Am. 2015, 137, 228–237. [Google Scholar] [CrossRef]
- Moreau, S.; Sanjose, M. Sub-harmonic broadband humps and tip noise in low-speed ring fans. J. Acoust. Soc. Am. 2016, 139, 118–127. [Google Scholar] [CrossRef] [PubMed]
- Zenger, F.J.; Renz, A.; Becher, M.; Becker, S. Experimental investigation of the noise emission of axial fans under distorted inflow conditions. J. Sound Vib. 2016, 383, 124–145. [Google Scholar] [CrossRef]
- Na, G.D.; Kameier, F.; Springer, N.; Mauß, M.; Paschereit, C. URANS simulations and experimental investigations on unsteady aerodynamic effects in the blade tip region of a shrouded fan configuration. In Proceedings of the Turbo Expo: Power for Land, Sea, and Air, Charlotte, NC, USA, 26–30 June 2017; Volume 50770, p. V001T09A003. [Google Scholar]
- Mo, J.O.; Choi, J.H. Numerical investigation of unsteady flow and aerodynamic noise characteristics of an automotive axial cooling fan. Appl. Sci. 2020, 10, 5432. [Google Scholar] [CrossRef]
- Zhu, T.; Lallier-Daniels, D.; Sanjosé, M.; Moreau, S.; Carolus, T. Rotating coherent flow structures as a source for narrowband tip clearance noise from axial fans. J. Sound Vib. 2018, 417, 198–215. [Google Scholar] [CrossRef]
- Lewis, D.; Moreau, S.; Jacob, M.C.; Sanjosé, M. Large Eddy Simulation of the ACAT1 fan stage for broadband noise prediction. J. Sound Vib. 2023, 565, 117888. [Google Scholar] [CrossRef]
- Moreau, S.; Roger, M. Turbomachinery Noise Review. Int. J. Turbomach. Propuls. Power 2024, 9, 11. [Google Scholar] [CrossRef]
- Canepa, E.; Cattanei, A.; Jafelice, F.; Zecchin, F.M.; Parodi, D. Effect of rotor deformation and blade loading on the leakage noise in low-speed axial fans. J. Sound Vib. 2018, 433, 99–123. [Google Scholar] [CrossRef]
- Canepa, E.; Cattanei, A.; Zecchin, F.M.; Parodi, D. Large-scale unsteady flow structures in the leakage flow of a low-speed axial fan with rotating shroud. Exp. Therm. Fluid Sci. 2019, 102, 1–19. [Google Scholar] [CrossRef]
- Dellacasagrande, M.; Canepa, E.; Cattanei, A.; Moradi, M. Characterization of Unsteady Leakage Flow in an Axial Fan. Int. J. Turbomach. Propuls. Power 2023, 8, 34. [Google Scholar] [CrossRef]
- Akhtar, T.; Canepa, E.; Cattanei, A.; Dellacasagrande, M.; Nilberto, A. Effect of Solidity on the Leakage Flow and Related Noise in Axial-Flow Fans with Rotating Shroud Operating at Fixed Performance. In Proceedings of the 16th European Turbomachinery Confeerence, paper n. ETC16-227, Hannover, Germany, 24–28 March 2025; Available online: https://www.euroturbo.eu/publications/conference-proceedings-repository (accessed on 27 June 2025).
- ISO 5801:2017; Industrial Fans—Performance Testing Using Standardized Airways. International Standard Organization (ISO): Geneva, Switzerland, 2017.
- Hussain, A.K.M.F.; Reynolds, W.C. The mechanics of an organized wave in turbulent shear flow. J. Fluid Mech. 1970, 41, 241–258. [Google Scholar] [CrossRef]
- Boutier, A. Accuracy of Laser Velocimetry, Lecture Series 1991–05 January 1991. VKI Laser Velocimetry, Vol. 1. Available online: https://ui.adsabs.harvard.edu/abs/1991VKILV...1T....B (accessed on 27 June 2025).
- Strazisar, A.J.; Powell, J.A. Laser anemometer measurements in a transonic axial flow compressor rotor. J. Eng. Power 1981, 103, 430–437. [Google Scholar] [CrossRef]
- Modarress, D.; Tan, H.; Nakayama, A. Evaluation of signal processing techniques in laser anemometry. In Proceedings of the Fourth International Symposium on Application of Laser Anemometry to Fluid Dynamics, Lisbon, Lisbon, Portugal, 11–14 July 1988. [Google Scholar]
- Lyn, D.A.; Einav, S.; Rodi, W.; Park, J.H. A laser-Doppler velocimetry study of ensemble-averaged characteristics of the turbulent near wake of a square cylinder. J. Fluid Mech. 1995, 304, 285–319. [Google Scholar] [CrossRef]
- Grant, I. Particle image velocimetry: A review. Proc. Inst. Mech. Eng. Part C J. Mech. Eng. Sci. 1997, 211, 55–76. [Google Scholar] [CrossRef]
- Prasad, A.; Adrian, R.; Landreth, C.; Offutt, P. Effect of resolution on the speed and accuracy of particle image velocimetry interrogation. Exp. Fluids 1992, 13, 105–116. [Google Scholar] [CrossRef]
- Canepa, E.; Cattanei, A.; Zecchin, F.M. Effect of the rotor–stator gap variation on the tonal noise generated by axial-flow fans. Appl. Acoust. 2015, 94, 29–38. [Google Scholar] [CrossRef]
- Canepa, E.; Cattanei, A.; Zecchin, F.M. Scaling properties of the aerodynamic noise generated by low-speed fans. J. Sound Vib. 2017, 408, 291–313. [Google Scholar] [CrossRef]
- Lee, J.; Francis, J.M.; Wang, L.M. How tonality and loudness of noise relate to annoyance and task performance. Noise Control. Eng. J. 2017, 65, 71–82. [Google Scholar] [CrossRef]
Disclaimer/Publisher’s Note: The statements, opinions and data contained in all publications are solely those of the individual author(s) and contributor(s) and not of MDPI and/or the editor(s). MDPI and/or the editor(s) disclaim responsibility for any injury to people or property resulting from any ideas, methods, instructions or products referred to in the content. |
© 2025 by the authors. Published by MDPI on behalf of the EUROTURBO. Licensee MDPI, Basel, Switzerland. This article is an open access article distributed under the terms and conditions of the Creative Commons Attribution (CC BY-NC-ND) license (https://creativecommons.org/licenses/by-nc-nd/4.0/).