Article

Goals and Strategies for Open Fan Design †

1
German Aerospace Center (DLR), Institute of Propulsion Techonology, 51147 Cologne, Germany
2
School of Aeronautical and Space Engineering, Universidad Politécnica de Madrid, 28040 Madrid, Spain
3
Safran Aircraft Engines, 77550 Moissy-Cramayel, France
*
Author to whom correspondence should be addressed.
This manuscript is an extended version of the ETC2025-123 meeting paper published in the Proceedings of the 16th European Turbomachinery Conference (ETC16), Hannover, Germany, 24–28 March 2025.
Int. J. Turbomach. Propuls. Power 2025, 10(3), 28; https://doi.org/10.3390/ijtpp10030028
Submission received: 17 April 2025 / Revised: 18 July 2025 / Accepted: 5 August 2025 / Published: 4 September 2025

Abstract

This paper highlights recent activities associated with the design of an uninstalled open fan propulsor for next-generation civil aircraft in the high-subsonic flight regime. The concept comprises a transonic propeller–rotor and a subsequent guide vane, which are both subject to pitch-variability in order to account for the strong variations in flight conditions over the entire mission profile. The engine-scale design aimed for high technological maturity and to comply with a high number of industrially relevant requirements to ensure a competitive design, meeting performance requirements in terms of high efficiency levels at cruise and maximum climb conditions, operability in terms of stability margins, good acoustic characteristics, and structural integrity. During the design iterations, rapid 3D-RANS-based optimisations were only used as a conceptual design tool to derive sensitivities, which were used to support and justify major design choices in addition to established relations from propeller theory and common design practice. These design-driven optimisation efforts were complemented with more sophisticated CFD analysis focusing on rotor tip vortex trajectories and resulting in unsteady blade row interaction to optimise the guide vane clipping, as well as investigations of the entire propulsor under angle-of-attack conditions. The resulting open fan design will be the very basis for wind tunnel experiments of a downscaled version at low and high speed.

1. Introduction

In order to reduce fuel consumption, and consequently aviation emissions, recent efforts have been made to develop and research new engine technologies for next-generation aircraft. The open rotor concept has been present intermittently since the 1970s with the advantage of eliminating the drag of the outer nacelle and its weight compared to high by-pass ratio ducted fans. However, numerous challenges arise with its design, such as keeping the efficiency levels and the noise emissions at high mach numbers, as reported in Degeorge [1] and Mitchell and Mikkelson [2].
The work of this paper is carried out within the frame of the PANDORA project, with the objective of developing a single open fan design that is compliant with the representative specifications. Groeneweg and Bober [3] and Baum et al. [4] highlight the test results of different single-rotation fan models, with a positive outcome on high efficiency and noise generation, in both cruise and take-off points, which is possible with thinner and highly swept rotor blades to deal with compressiblility losses. The use of swirl recovery vanes (SRV) is also mentioned to be a promising feature for single-rotation fans as in contrarotating open rotors (CROR), but with a quieter and mechanically less complex element. Furthermore, new methods to assess the main noise radiation for open rotor configurations are necessary, such as the one presented in Daydé-Thomas et al. [5].
The first part of the paper deals with the conceptual design of the open fan propulsor. The design efforts are based on a number of existing designs reported in the open literature for isolated high-speed propellers with and without swirl recovery, such as the work of Dittmar and Hall [6] and Stokkermans et al. [7], as well as CROR studies [8,9,10]. More recent efforts supporting the open fan concept are reported by Tantot et al. [11].
The theoretical potential of the open fan is first of all driven by an increased propulsive efficiency compared with current ducted propulsors. With no swirl, ideal and non-installed propulsive efficiency levels might be substantially increased when moving from fan pressure ratios of current turbofan engines in the order of 1.35–1.45 to values of 1.03–1.05 [8] due to the reduction in excess kinetic energy (see Figure 1). To take advantage of this during the design process, multiple configurations are optimised to achieve the desired one that complies with the specifications for a medium-sized aircraft, together with CFD simulations to assess its performance characteristics. Additionally, a preliminary acoustics assessment is conducted for the design, varying the value of the stator clipping to avoid rotor–stator blade interaction noises. Finally, the results for non-zero angle-of-attack conditions are presented, where the disturbances caused in the flow field are noticeable.
This paper firstly introduces the methodology and setup for the design of the open fan in Section 2. In this section, details of the CFD simulations, as well as the optimisations, are described in order to guide the desired design strategy. Moreover, the performance metrics of the fan are also defined in Section 2.4. Subsequently, the results, together with the discussion, are presented in Section 3. An initial description of the conceptual design is outlined in Section 3.1, which includes an investigation of the main metrics driving the design, together with sensitivity studies for key design parameters. Consequently, with a satisfactory open fan geometry, Section 3.2 presents the performance and operability of the design, in addition to the flow field analysis for the main operating points. Finally, two key aspects related to unsteady effects are investigated in Section 3.3: the acoustics and the angle-of-attack conditions. This article is a revised and expanded version of a paper with the same title, which was presented at European Turbomachinery Conference in Hanover on March 2025 [12].

2. Design Methods

In this section, the methodology used to assess numerically the design is first described, together with a mesh sensitivity study. Next, the design strategy is presented for the sensitivity studies conducted for different design characteristics.

2.1. Flow Solver

All CFD simulations presented in this paper are conducted using TRACE [13]. TRACE is a flow solver which has been developed by DLR in close cooperation with MTU aeroengines. The domain includes the spinner, together with the hub, rotor, and stator. The far-field boundary is set at a distance equal to 5 times the blade height (see Figure 2). The dimensions for the setup are imposed considering the impact of the placement of the far-field boundaries on the main performance metrics based on measured data for a contrarotating open rotor, which can be found in the work of Schenll et al. [10]. The computational domain, unless otherwise stated, corresponds to a single passage for the rotor and stator, in combination with periodic boundary conditions. For the steady simulations, a mixing plane with non-reflecting boundary conditions was used at the rotor–stator interface. Regarding the spatial discretisation, all of the results below were obtained through a finite volume scheme based on the Roe flux, MUSCL second-order extrapolation, and a van-Albada type limiter.
For the steady-state cases, RANS simulations are employed during optimisation and performance characterisation of the design.

2.2. Mesh Sensitivity

Two different grids are generated with Autogrid to check the mesh sensitivity of the case. Firstly, a coarse mesh with approximately 1 million cells and using Wilcox k ω [14] turbulence model with Spalding [15] wall functions formulation is generated for the optimisation process in order to accelerate the computations. This setup allows for stability and computational efficiency during the optimisation process. Subsequently, a finer-resolution mesh (with 5.4 M cells), with y + 1 and a turbulence model k ω Menter SST [16], is compared with the first mesh to evaluate its sensitivity on the main performance parameters. The two grids present good agreement for the results between them at the design point, which is maximum cruise (MXCR), in terms of thrust levels and flow field characteristics. However, for off-design conditions, such as take-off (TKOF), the coarse mesh fails to predict the correct thrust levels, efficiency, and working range that are present in the finer one. Therefore, the latter is used to provide the performance characterisation to ensure higher fidelity of the optimisation results.

2.3. Design Strategy

During the design process, multiple optimisations are set up to achieve the desired design, considering geometrical, performance, and mechanical requirements. The main objective is to conduct a series of sensitivity studies to comprehend the effect of the main design parameters on the aero-performance. Each optimisation has a small number of variable free parameters to identify how they impacted the overall performance of the open rotor. For all the studies, the two objective functions are to maximise two efficiencies (Equations (4) and (5)) that will be introduced and discussed in Section 2.4. Both efficiencies need to be targeted in order to find a compromise between the two. Pseudo-efficiency is the main focus for single-row isolated blade design, and effective efficiency is the measure taking into account the interaction of the blades and the hub. Furthermore, the pseudoefficiency is regarded for acoustic reasons, one reason being that the blades are the main source of noise generation.
The optimisations are carried out with DLR developed code AutoOpti [17] which is focused on turbomachinery applications. This is an automatic optimiser for multi-objective optimisations using an evolutionary algorithm with meta-model (MM) exploitation trained with the CFD results from the members created within the optimisation to accelerate the process. At first, one-point optimisations at the design point are conducted with the coarse mesh for computational efficiency, giving the results of the mesh sensitivity study. In later design iterations, which are not discussed in detail in this paper, dual-point optimisations are conducted taking into account both cruise and take-off points, which require the use of a fine grid to properly account for the highly loaded and aerodynamically challenging cases at low flight speeds. More complex optimisations, also introducing structural aspects and acoustic considerations, as presented in [10], are planned prior to testing.

2.4. Performance Metrics

In the context of this paper, several efficiencies are used to characterise different aspects of the open fan design. Different combinations of these efficiencies are used as objective functions during the design optimisation. Therefore, all of these parameters will be defined in this section, with their respective meanings discussed.

2.4.1. Transfer Efficiency η trans

The transfer efficiency is a measure of the translation of shaft power into jet kinetic power:
η trans = jet power shaft power .
As a turbomachinery quantity, it is directly linked to both the isentropic and polytropic efficiency, with the former reflecting the quality of a thermodynamic transformation and the latter reflecting the aerodynamic quality of the turbomachinery that performs the thermodynamic transformation. A direct relation between isentropic efficiency and transfer efficiency is provided in [18]. This relation was used during the design optimisations to characterise the blade row performance.

2.4.2. Propulsive Efficiency η prop

An equation incorporating the static pressure terms into the well-known propulsive efficiency equation, according to Drela [19], is defined as follows:
η prop = thrust power jet power = u u 9 u + p 9 p ϱ 9 u u 9 u 9 2 u 2 2 + p 9 p ϱ 9 .
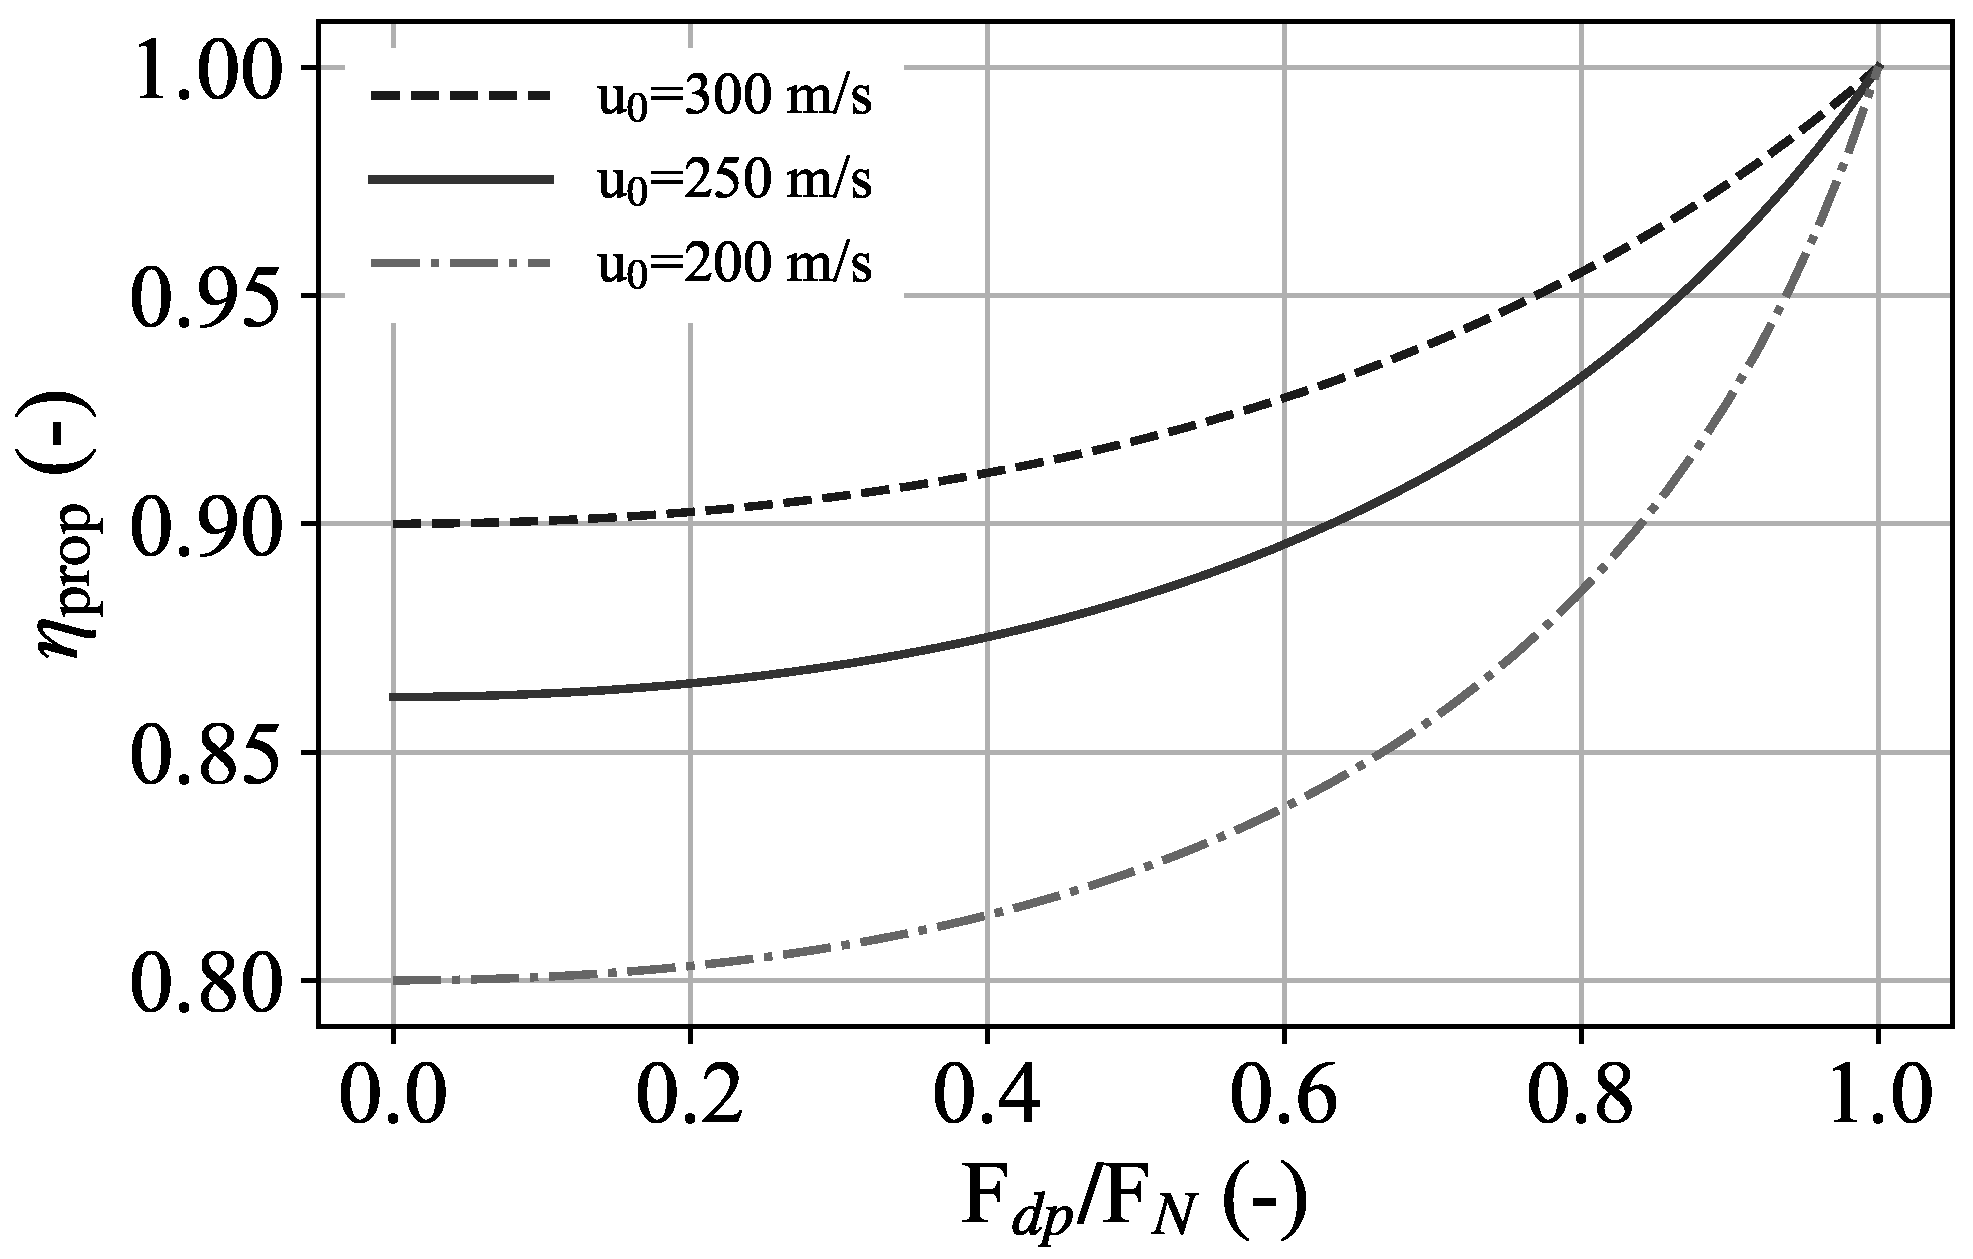
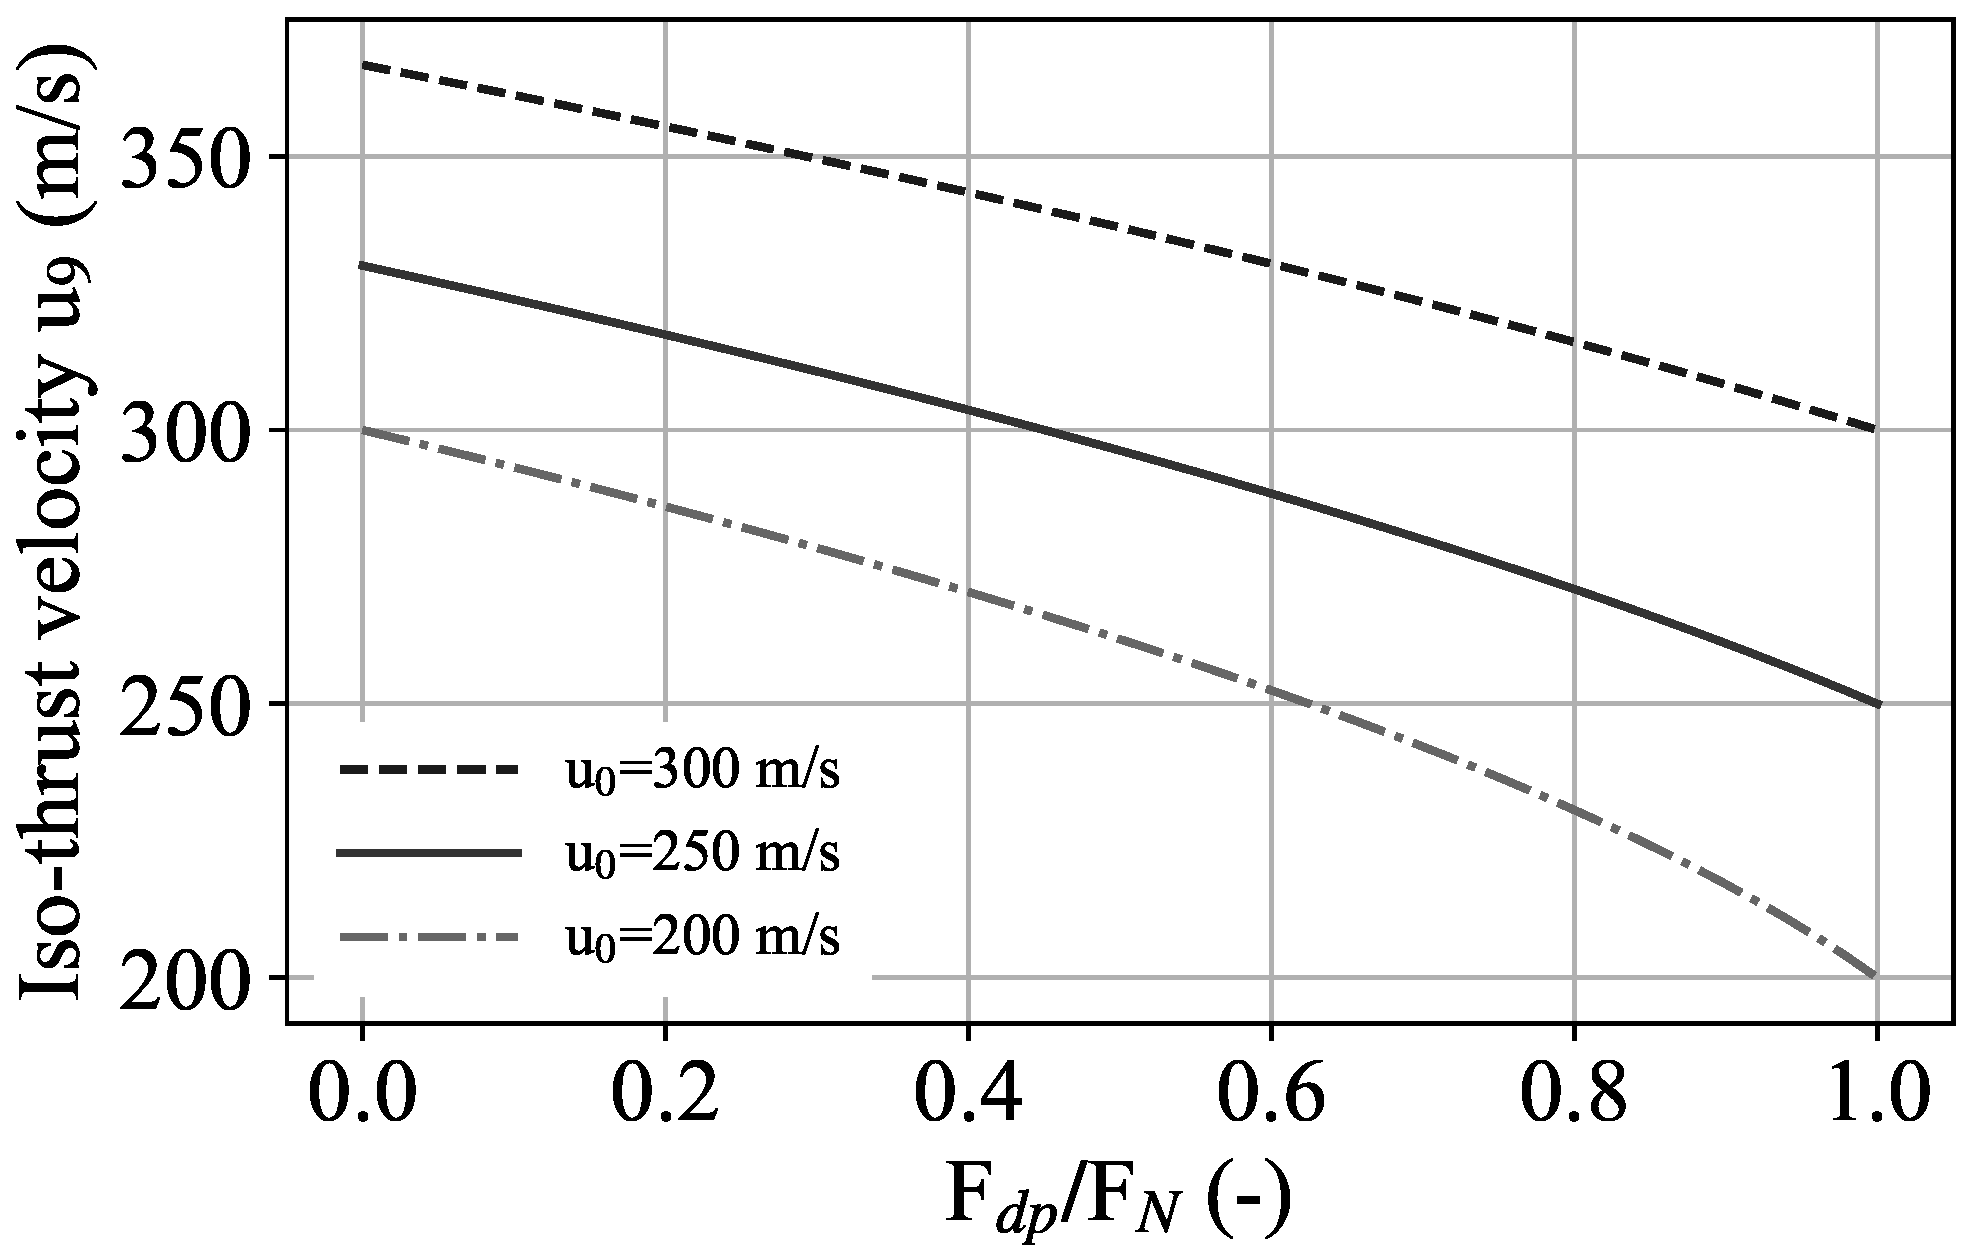
When evaluating this equation, the jet velocity u 9 , which is assumed to be axial, is taken either at the rotor or OGV exit and close to the blade row exit. In high-subsonic regimes, the strong potential fields induced by the hub line curvature can be taken advantage of in both the rotor and OGV to artificially increase the given propulsive efficiency. This effect is quantified in Figure 3, which shows the increase in propulsive efficiency when the blade row experiences a static pressure rise at iso-thrust. The respective reduction in jet velocity u 9 is shown in Figure 4 for different levels of inlet or flight velocity u , resulting in reduced jet kinetic energy deposit rate levels. Note that the reduction in the latter is larger compared to the former due to the quadratic behaviour of the exit velocity u 9 (see Equation (2)). Since the control volume is not closed and the forces on the nacelle need to be included in the overall thrust or power balance, focusing on this pseudo-efficiency can be misleading and may drive the design in an unwanted direction. Useful metrics to better quantify the propulsive power generated by the open fan and its aerodynamic quality are studied and discussed in the next section, which are based on blade-on and blades-off simulations to account for the interaction between nacelle and propeller blades, as described in [11].

2.4.3. Ideal Propulsive Efficiency η prop , id

When viscous effects are neglected and the shaft power is converted entirely into the kinetic power of the jet, the transfer efficiency becomes unity ( η trans = 1 ) and the overall efficiency η ov is equal to the propulsive or Froude efficiency η prop . Note that the jet kinetic energy may contain swirl or not, and can be computed based on a given control volume in the propulsor jet.
For a single propeller, an ideal propeller efficiency, depending only on the power coefficient c p and the advance ratio J, can be calculated analytically under certain assumptions and for a given blade count and hub-to-tip ratio, as described in [20,21]. Since this efficiency is technically also the propulsive efficiency relating the axial force to the jet kinetic energy, the terms “ideal propeller efficiency” and “ideal propulsive efficiency” will be synonymously used in this paper. Note that both quantities are denoted by the symbol η prop , id and that the word ideal mainly results from neglecting viscous forces.

2.4.4. Overall Efficiency η ov

According to [18], the overall efficiency can be written as
η ov = thrust power shaft power = η trans η prop .
Note that while both η trans and η prop depend on the location of a given control volume, its product is constant for a given design, and is typically computed by directly integrating forces and moments over solid surfaces. Typical control volume locations to compute the propulsive and transfer efficiency based on circumferentially averaged flow quantities, as used in this paper, are about 0.1 chords away from the rotor and OGV leading (LE) and trailing (TE) edge, respectively.

2.4.5. Pseudo and Effective Efficiency

In a propeller and open fan context, the overall efficiency given by Equation (3) can be expressed by the common non-dimensional parameters in the following form:
η ov = J c t c p = F ax u P .
If only blade forces are considered in Equation (4), the efficiency is considered as pseudoor apparent. For F ax = F ax , rotor the name η ov , rotor , pseudo will be used, and when including both rotor and ogv axial forces F ax = F ax , rotor + F ax , ogv , the overall efficiency η ov is referred to as η ov , pseudo , and becomes
η ov , pseudo = F ax , rotor + F ax , ogv u P .
In order to simplify the nomenclature in this paper, if not specified otherwise, the overall open fan efficiency η ov is always the pseudo-efficiency η ov , pseudo , including the rotor and OGV force contributions. When also including the hub forces, the corresponding efficiency will be referred to as overall effective efficiency η ov , effective .
It should be stressed that in the end, the major focus should be on overall effective efficiency. However, breaking down the efficiency separates the conceptual design, the quality of which is reflected by propulsive efficiency and determined by top level design parameters such as diameter and tip-speed, from the design quality of the blade rows, which is reflected by the transfer efficiency. The latter is impacted by detailed and profile-section-based, multi-point optimisations, typically once the conceptual design parameters are fixed. For more details on the efficiency breakdown, see also [18].

3. Results and Discussion

3.1. Conceptual Design

The potential of the open fan mainly comes from the increase in propulsive efficiency when lowering the FPR (see Figure 1). In Figure 5, the ideal propulsive efficiencies are shown over the rotor power coefficient c p as solid lines, based on the theory provided by [20,21]. When excess kinetic energy associated with swirl is fully recovered, the theoretically achievable efficiencies can then be seen as the solid lines. The dashed line with the same colour yields its respective propulsive efficiency at a given FPR (and hence c p ) and axial outflow of the propulsion system. Note that the effectiveness of the guide vane Δ η OGV can be quantified by the difference between solid and dashed lines at given c p .

3.1.1. Design Rationale

The most important tendency driving almost all open fan design efforts is that when maximising rotor overall efficiency, small values of power coefficient c p are favourable (e.g., by high rotational tip speeds, as reported in [6]). However, this reduces the chances of recovering swirl with an additional guide vane, since the difference between the ideal propeller efficiency and the propulsive efficiency of the open fan with zero outlet swirl becomes smaller (see Figure 5). This must be carefully balanced with viscous loss generation in both blade rows, which further limits the effectiveness of the guide vane towards lower levels of flow turning; the blade row loss generation is typically accounted for in the component or transfer efficiency, which further reduces the propulsive efficiency.
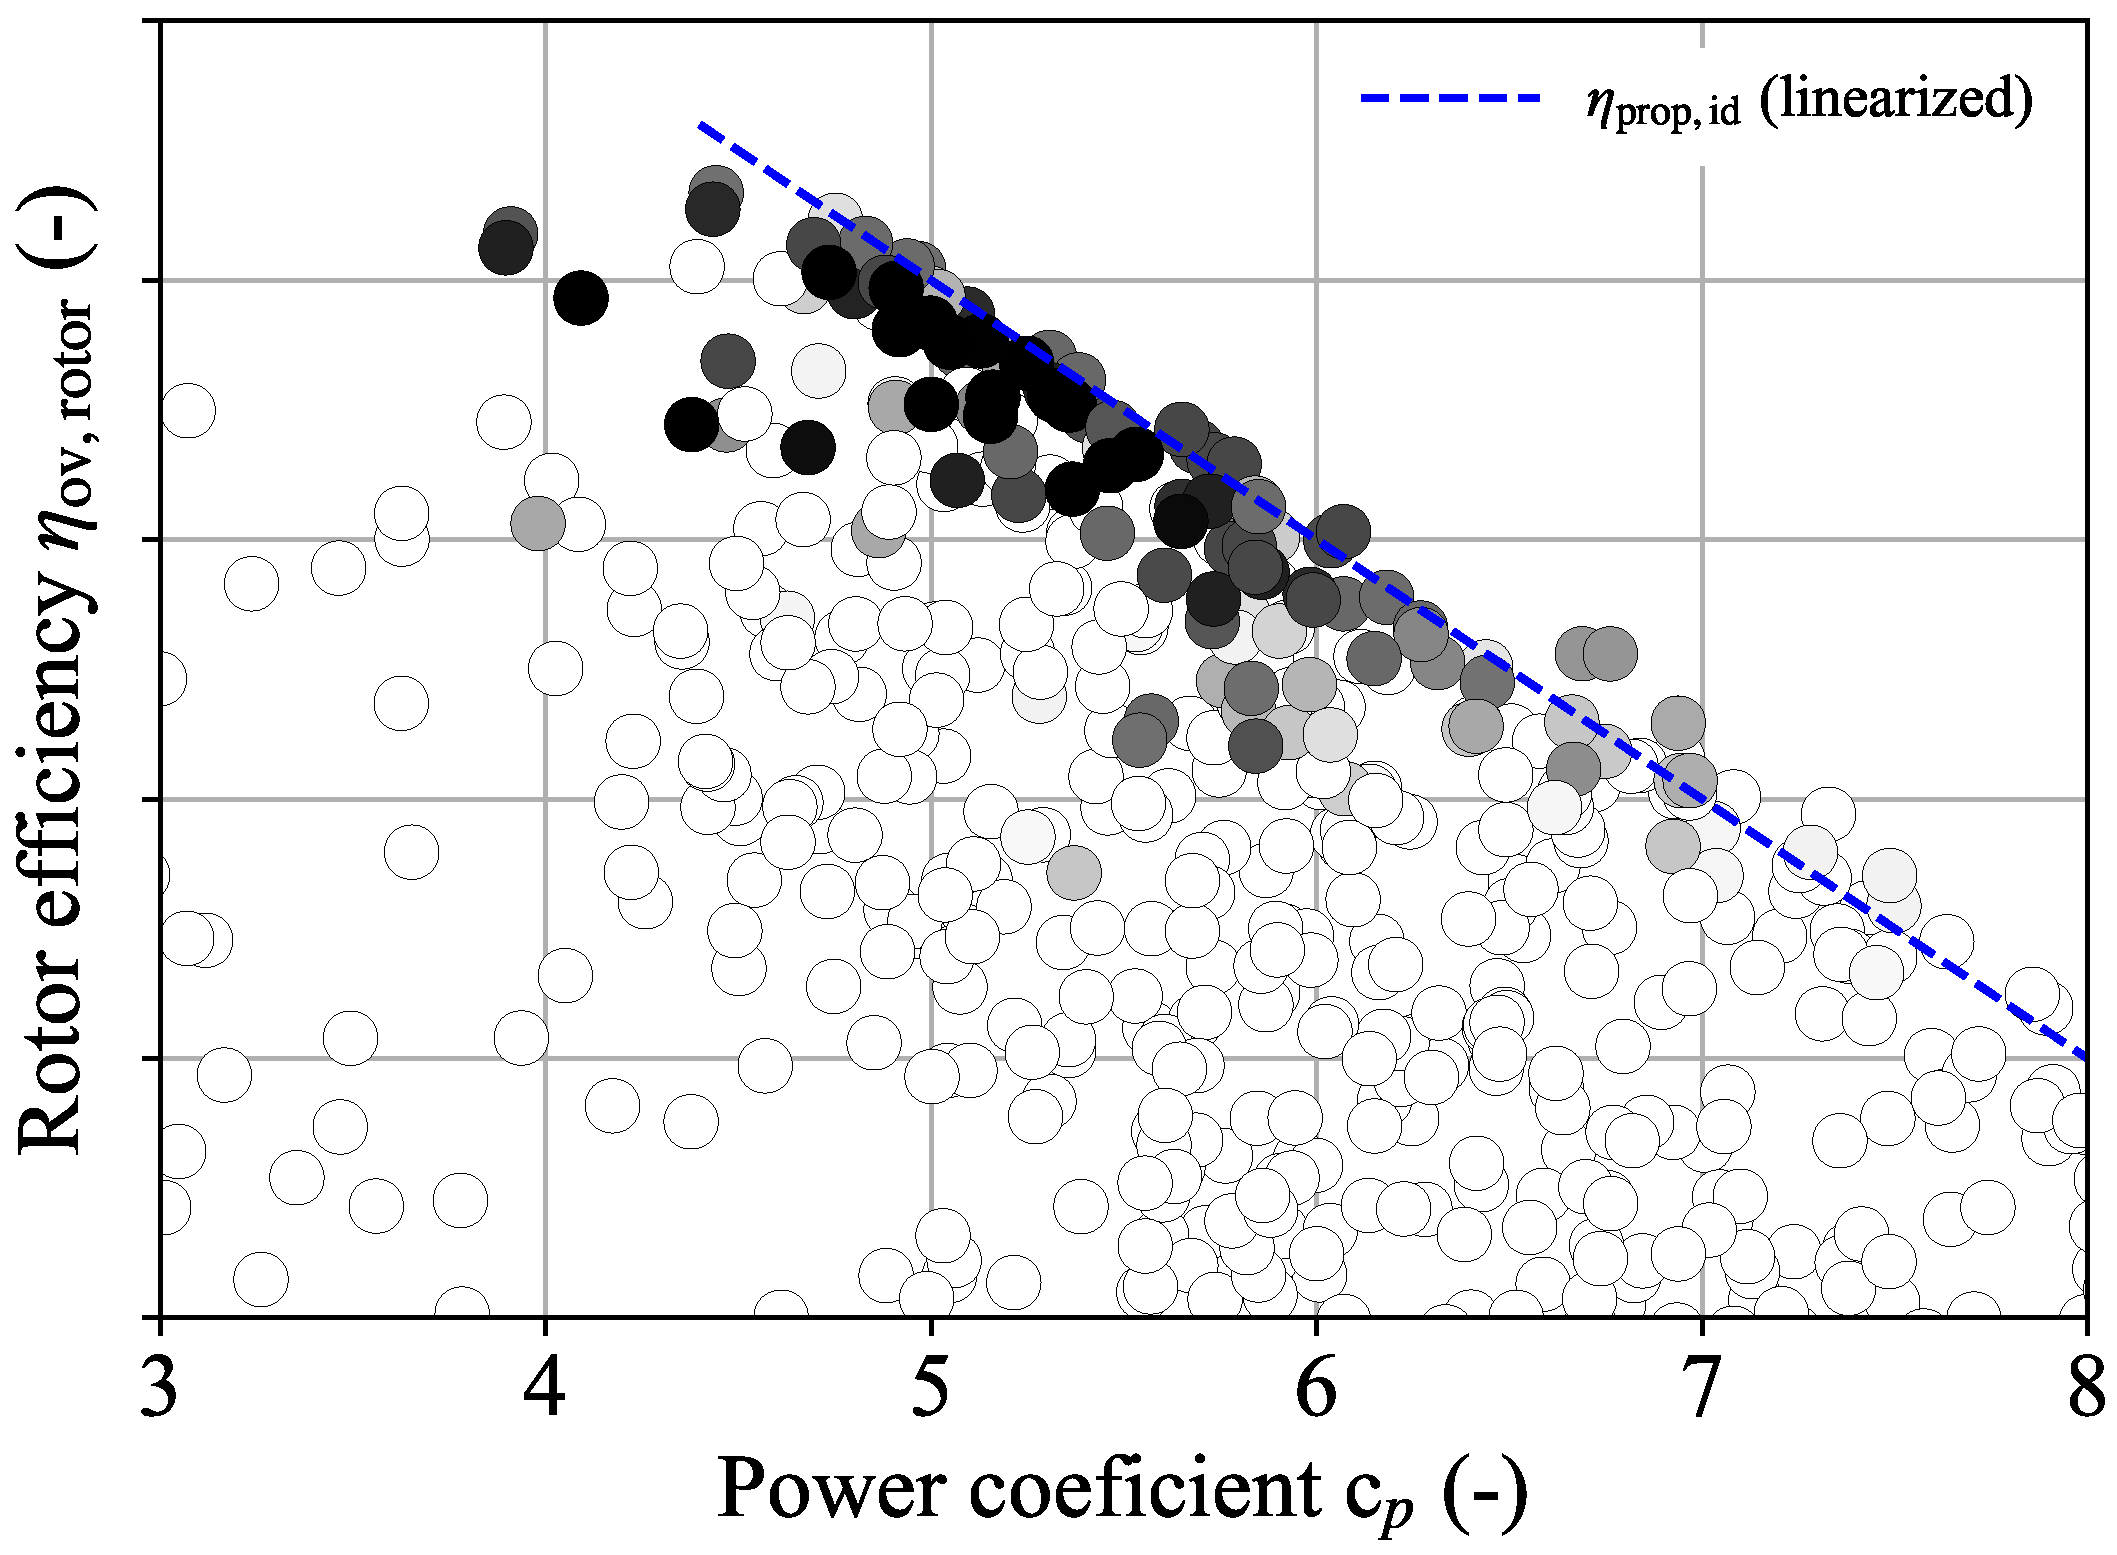
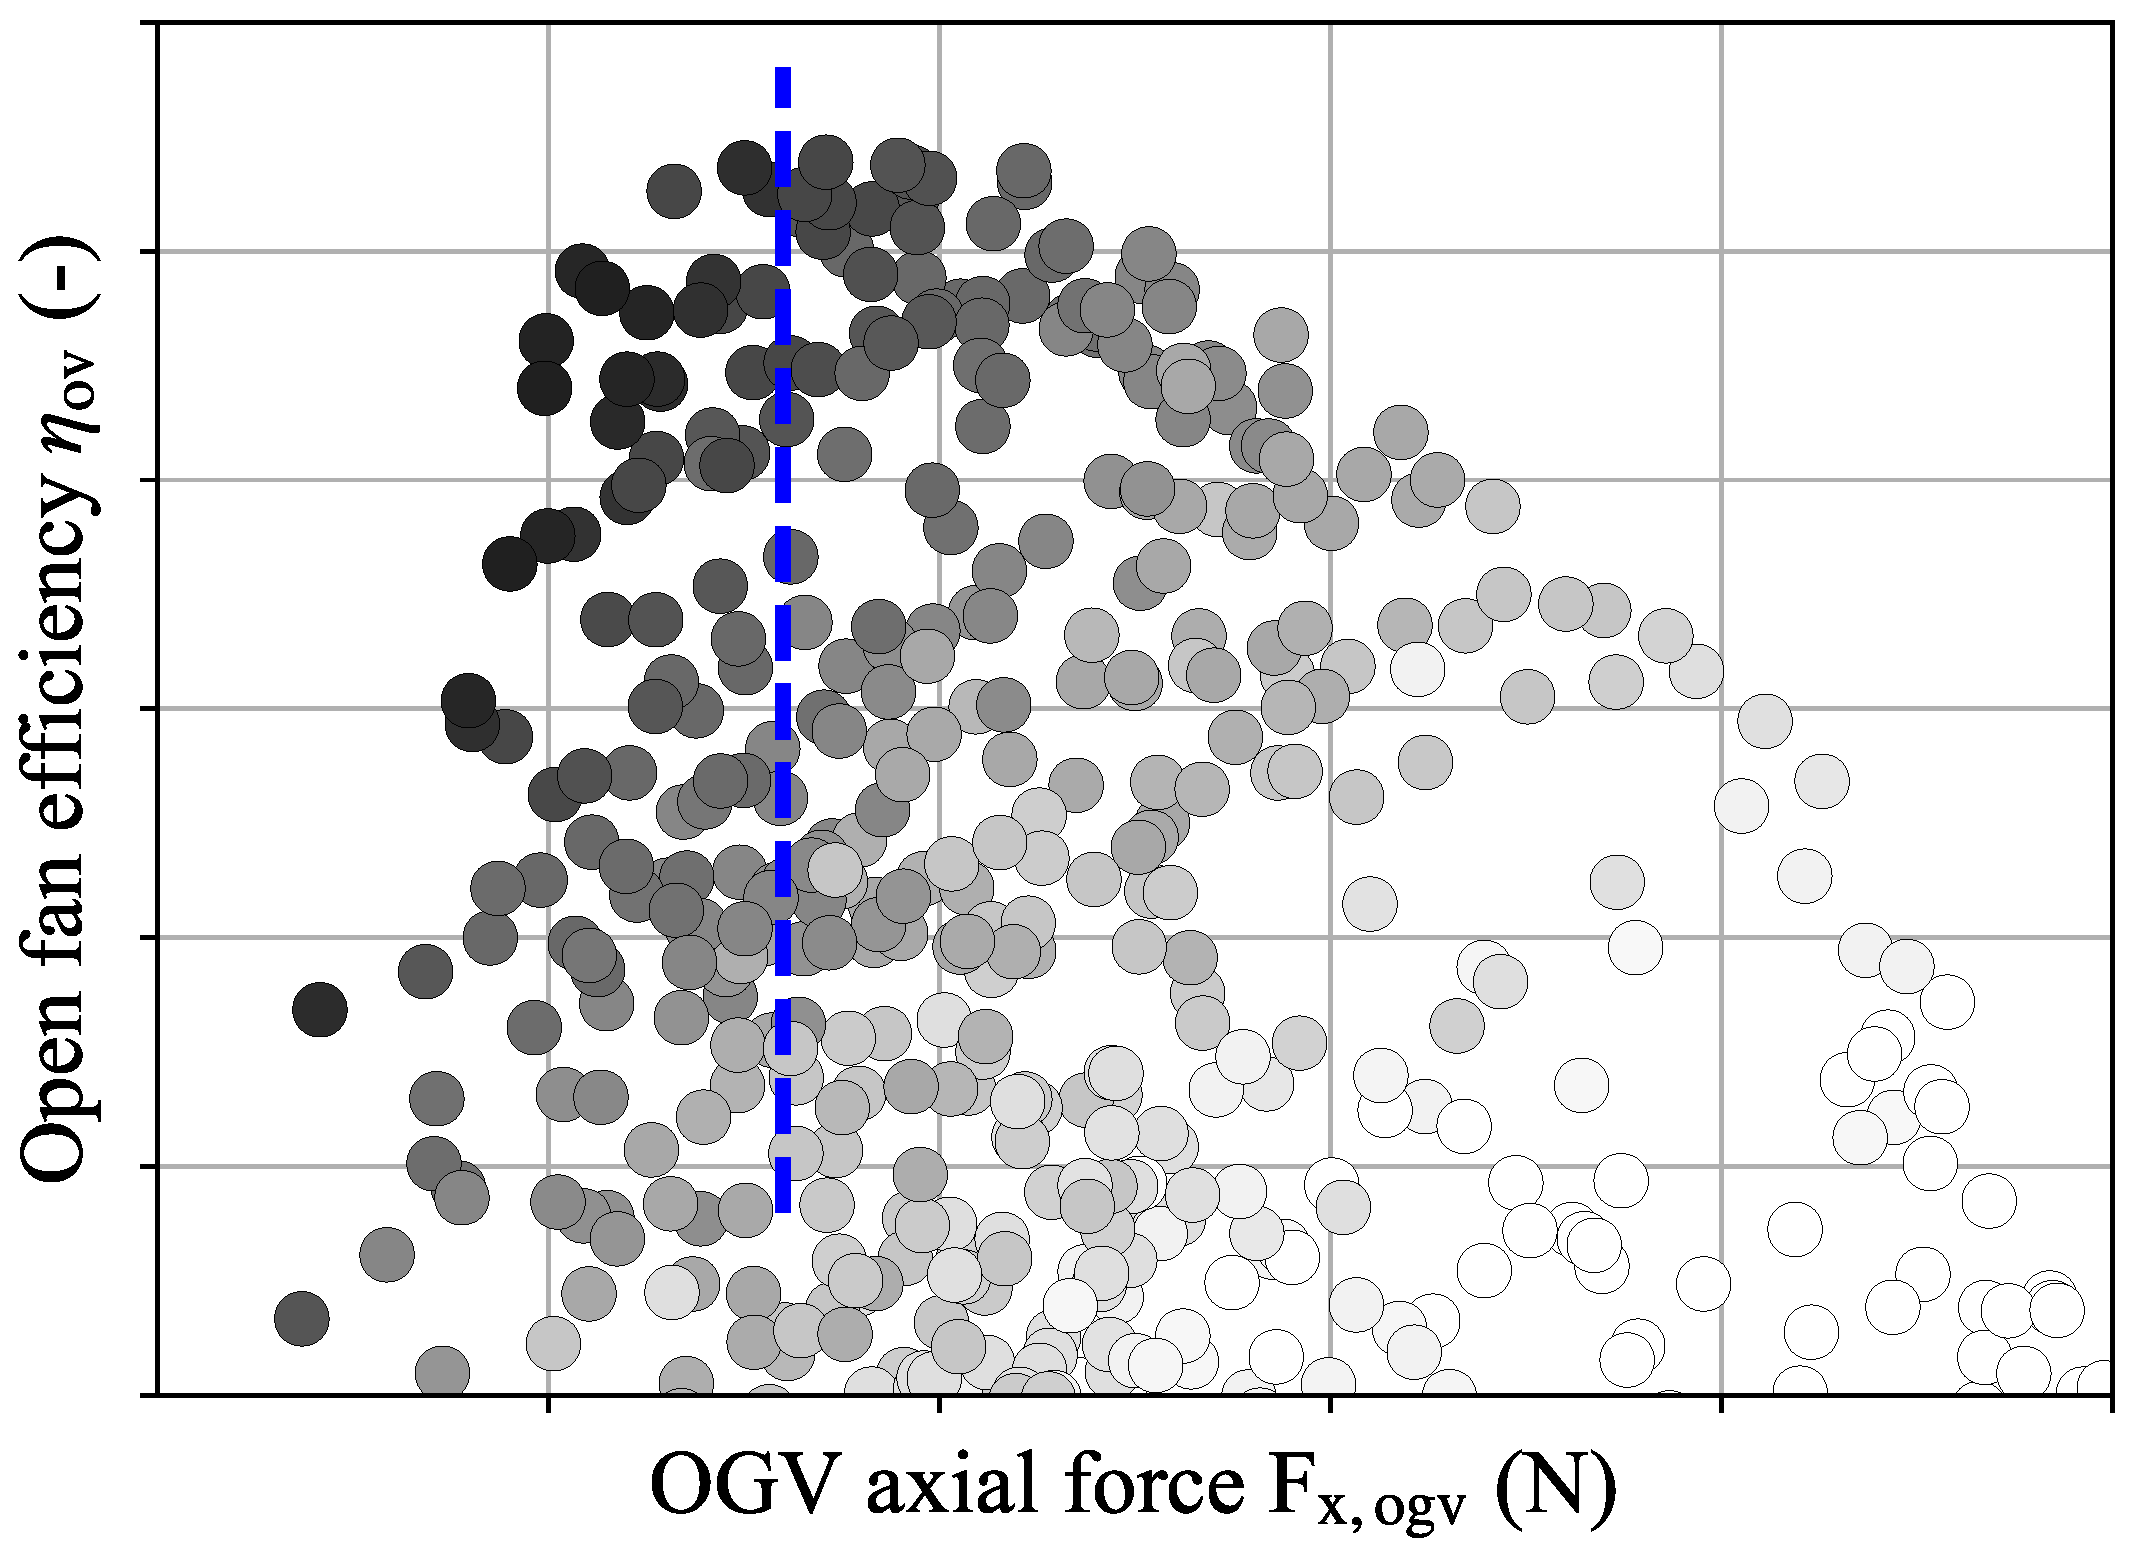
As previously mentioned, in the given c p range, almost a linear trend of the overall efficiency over power coefficient is confirmed by RANS-based optimisation studies over a wide range of power coefficients, as shown in Figure 6. Note that these optimisation studies already included all major geometric and operational specifications of the open fan under consideration. These basic optimisation studies at a fixed blade tip speed are repeated for different rotational speeds, yielding different open fan efficiency optima and force contributions from the swirl recovery vane (see Figure 7). The good agreement between the trends of the high-fidelity optimisation and theory, as shown in Figure 7, suggests that, due to the non-viscous nature of the ideal efficiency and its identical physical interpretation as propulsive efficiency, viscous losses, and hence component efficiency, are kept at similar levels over the entire optimisation range. This was achieved with the generalised optimisation approach, reflecting an optimised design with maximum and almost constant transfer efficiency for each individual along the Pareto front and over the entire c p range.
Prior to starting any RANS-based optimisation efforts, a baseline design is derived using a streamline curvature method [22], based on the aforementioned conceptual considerations. Although it was originally developed in the context of fan and compressor design for strongly diffusing flows, taking advantage of the pre-optimised data base for transonic profiles is proven to be more accurate and efficient than using the classical blade element methods typically applied in a propeller context.

3.1.2. Sensitivity Studies

In order to consider how design parameters affect the performance of the open fan, the following main parameters are studied: geometrical features of the blades and their profiles such as chord, sweep, and lean, and their respective impact on performance. Additionally, the hub line shape and various performance characteristics, like the efficiency and stability margin under both on-design and off-design conditions, are also investigated, and the main results and conclusions from these are highlighted below.
Blades-On/Blades-Off Simulations and Force Contribution Breakdown
The hub line is observed to have a significant impact on the overall efficiency. Therefore, to assess its influence, the two efficiencies at MXCR are compared: one including the hub forces (effective efficiency) and the other with only the blades (pseudo-efficiency). With this aim, the optimiser is set to maximise both efficiencies while varying certain control points in the hub line to determine its shape. In addition, different blades-off simulations are carried out to assess the hub forces generated as well as the impact that the blades have on the hub line.
To showcase its effect, Figure 8 presents the contribution of each part of the open rotor to the total thrust, where negative values indicate the generation of drag, for two different designs obtained from the optimisations. The two designs chosen present a difference in effective efficiency, with Design A having a higher value than B, but both having the same pseudo efficiency and hub line shape. These designs are chosen to illustrate the relationship between the two efficiencies.
Both the rotor and stator hub part contributions are noticeably large (more than 200%) compared to the total thrust (see Figure 8a). It is worth mentioning that the contribution of the back ambient pressure is added to the OGV hub part due to the nature of the control volume, which differs from the one in Figure 2 since both designs present a constant radius, different than 0, at the end of nacelle. However, when focusing on the overall contribution of the hub, these two components almost counterbalance each other, leaving around 10% of generated drag, as depicted in Figure 8b. This plot also shows that the rotor is the main thrust generator, with merely an approximate 10% attributable to the OGV, which is of a similar magnitude than the overall hub contribution and can counterbalance the hub drag.
Another significant outcome of this study is that the interaction between the blades and the hub modifies the flow field around it, resulting in the lower resistance of the hub compared to the blades-off simulation. For this reason, at higher effective efficiency, the difference is more pronounced, with a 2.5% decrease in the drag for Design A as opposed to 1% in the other design. Therefore, considering only the blades is not enough to evaluate the performance, and the need to include the hub forces in the efficiency is justified.
However, this comparison is not made at iso-thrust for the two designs, and the relationship between both efficiencies, as well as the impact of each component on the total thrust, is not straightforward. More detailed studies are needed to take advantage of this effect during the design process.
Stability–Efficiency Trade-Off
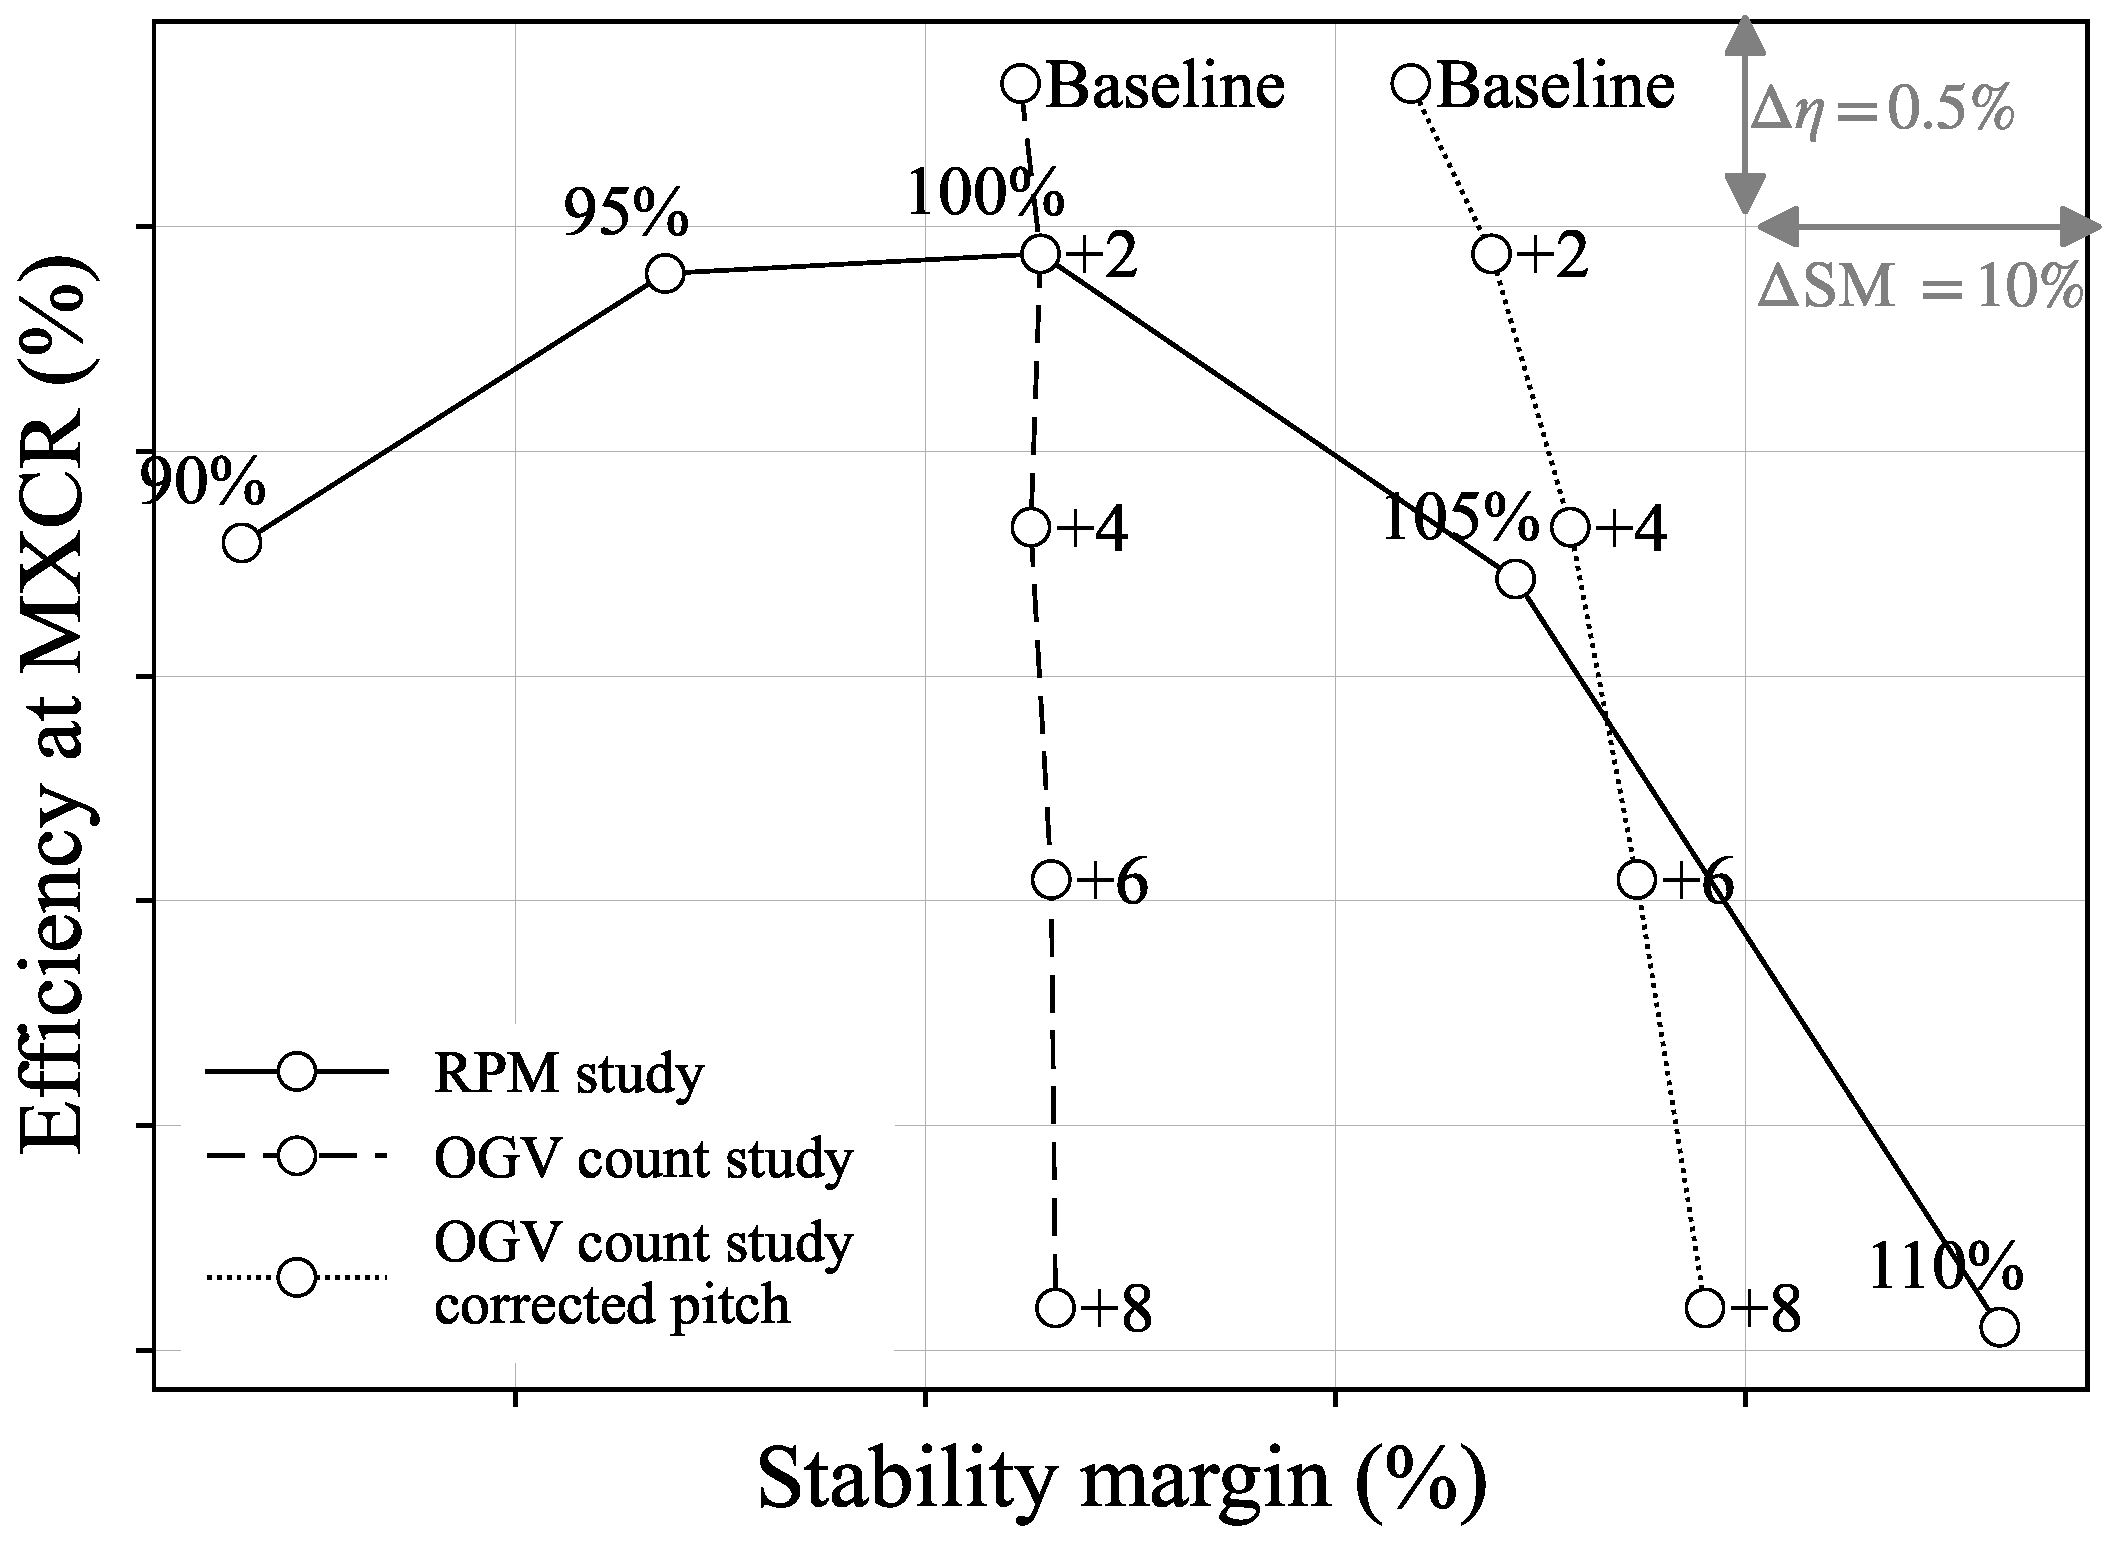
Another important and performance-related aspect deals with the trade-off between cruise efficiency at iso-thrust and stability at low speed take-off conditions, as shown in Figure 9; while increasing RPM (related to rotor blade tip speed) typically leads to enhanced operational stability due to lower turning requirements for iso-thrust and reduced positive incidence, it compromises cruise efficiency due to the lower rotor component efficiencies because of increased shock losses. The latter is counterbalanced by an increase in the propulsive efficiency of the rotor due to the reduced c p (see Figure 6); hence, the sensitivity is not quite as pronounced as for higher FPR turbofan applications. In Figure 9, the stability margin is quantified by closing the blade pitch until a thrust plateau is reached; the relative difference between this thrust and the corresponding specification results in the given margin. Note that only the rotor is re-pitched, since the additional impact on the thrust generation of re-pitching the OGV along the characteristics is found to be relatively small, provided that the initial pitch does not present detachment of the flow.
Moreover, Figure 9 also presents the impact of the guided vane blade count (dashed line) only on the cruise efficiency due to the detachment of the flow observed at take-off condition, which needs to be addressed by adjusting its pitch angle. When this is adapted, it results in a similar plot shift due to the increment of stator thrust contribution, and in a slightly less steep plot (dotted line). Consequently, the number of blades in the stator can increase the stability margin, but with a higher impact on the performance.
Comparing the two studies, it is clear that in order to gain stability margin, the increase in RPM is the better option to preserve the performance at the design point, since for an increment of 10% in the stability margin, the loss in the efficiency is less than 1% for the range of interest, while for a similar increase, the OGV count has to be doubled and shows a decrease in performance of more than 2%.
In addition to the sensitivity study, a dual-point optimisation is also carried out to further explore and understand the trade-off between MXCR and TKOF efficiency, the latter of which is expected to have a direct impact on open fan stability. Since the take-off operating point is naturally highly loaded and closer to the blade stall, low Reynolds simulations with SST turbulence modelling are imperative to accurately assess the take-off performance. The results shown in Figure 10 quantify the expected trend that improving take-off efficiency penalises cruise efficiency. The respective dependency is shown by the sketched Pareto front, indicated as black dashed lines. This trend is mostly driven by simple incidence considerations: reducing the positive incidence at take-off leads to negative and non-ideal incidence at cruise conditions. This reduces the component efficiency expressed by Δ η rotor , is , MXCR , driving the aforementioned trend.
Additionally, special attention was paid to the migration of the flow at TKOF conditions, which is directly linked to the rotor–stator interaction and acoustics. This phenomenon is visible in Figure 11, where the migration is present from around 50% of the span at the LE of the rotor blade, as marked by the low pressure and the streamlines. The necessity to control this is derived from the potential generation of vortices that will merge with the tip vortex and enlarge it, leading to a higher acoustics impact due to rotor–stator interactions. In Figure 11, the potential is visible in the plane located downstream of the rotor, marking the high-turbulent kinetic energy areas resulting from this flow migration. The normalised pressure is obtained with a the reference pressure of the operating point.
Lean, Sweep, and Chord Variation
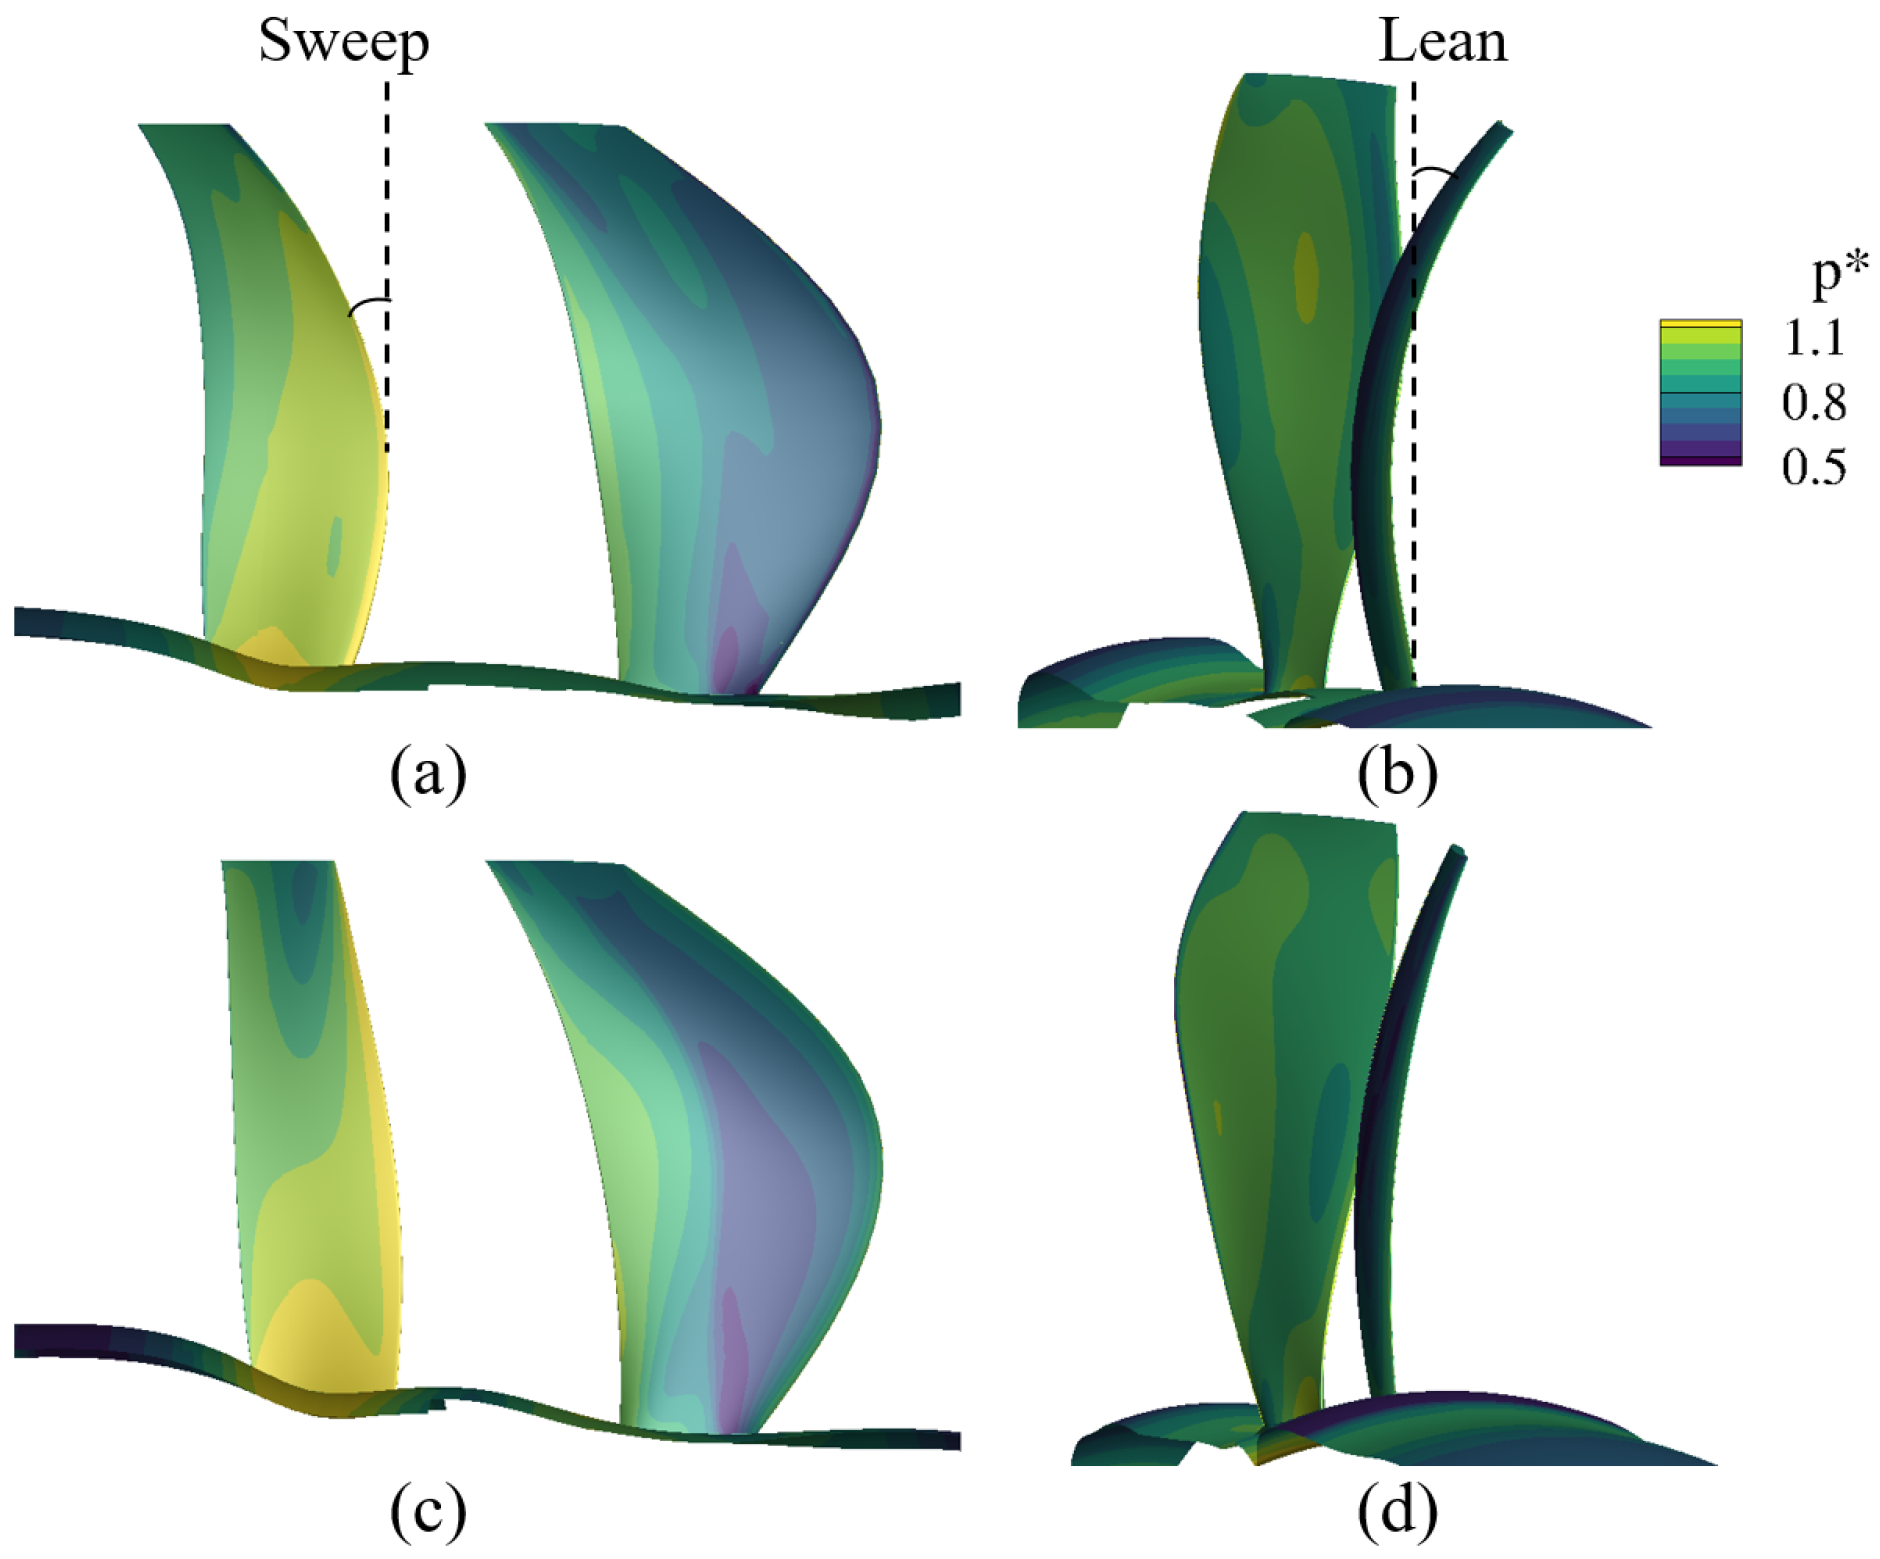
The introduction of axial sweep and tangential lean is also studied during the optimisation process, more specifically in the OGV design. For the rotor, axial sweep has been reported to be beneficial for performance and acoustic purposes in numerous cases [2,3], but needs to be balanced with the LE vortex generation due to flow migration, as previously mentioned. In contrast, when it is introduced in the OGV, even though it helps reduce the acoustic impact due to rotor–stator interaction, it introduces a higher distance for some parts of the stator blade from the rotor, resulting in a decrease in the overall performance of the fan. In Figure 12, the comparison of two designs is made by their pressure fields on the blades. The first design presents sweep and lean in the stator blade (Figure 12a,b) and a pressure decrease on the LE of the blade is visible, which is beneficial for the acoustics side of the design. Additionally, the rotor-stator interaction is also affected, as depicted in the pressure levels of the rotor TE on both the PS and SS of the blade.
For an approximate axial sweep of 30 , the loss accounted in the overall efficiency is around 0.3%. Nevertheless, this is recovered by adding tangential lean and modifying the chord of the profiles along the span. The lean angle is a driver for the optimiser, having a strong tendency to change into a bow/C shape in the OGV.

3.2. Performance Characterisation and Operability

Combining the different design sensitivities results in a first, fully viable and highperforming, open fan design, with the main focus being on aerodynamic performance and the robustness of the design. Therefore, in this section, the flow field and performance characteristics of this design are described for the main operating points.

3.2.1. Performance Characteristics

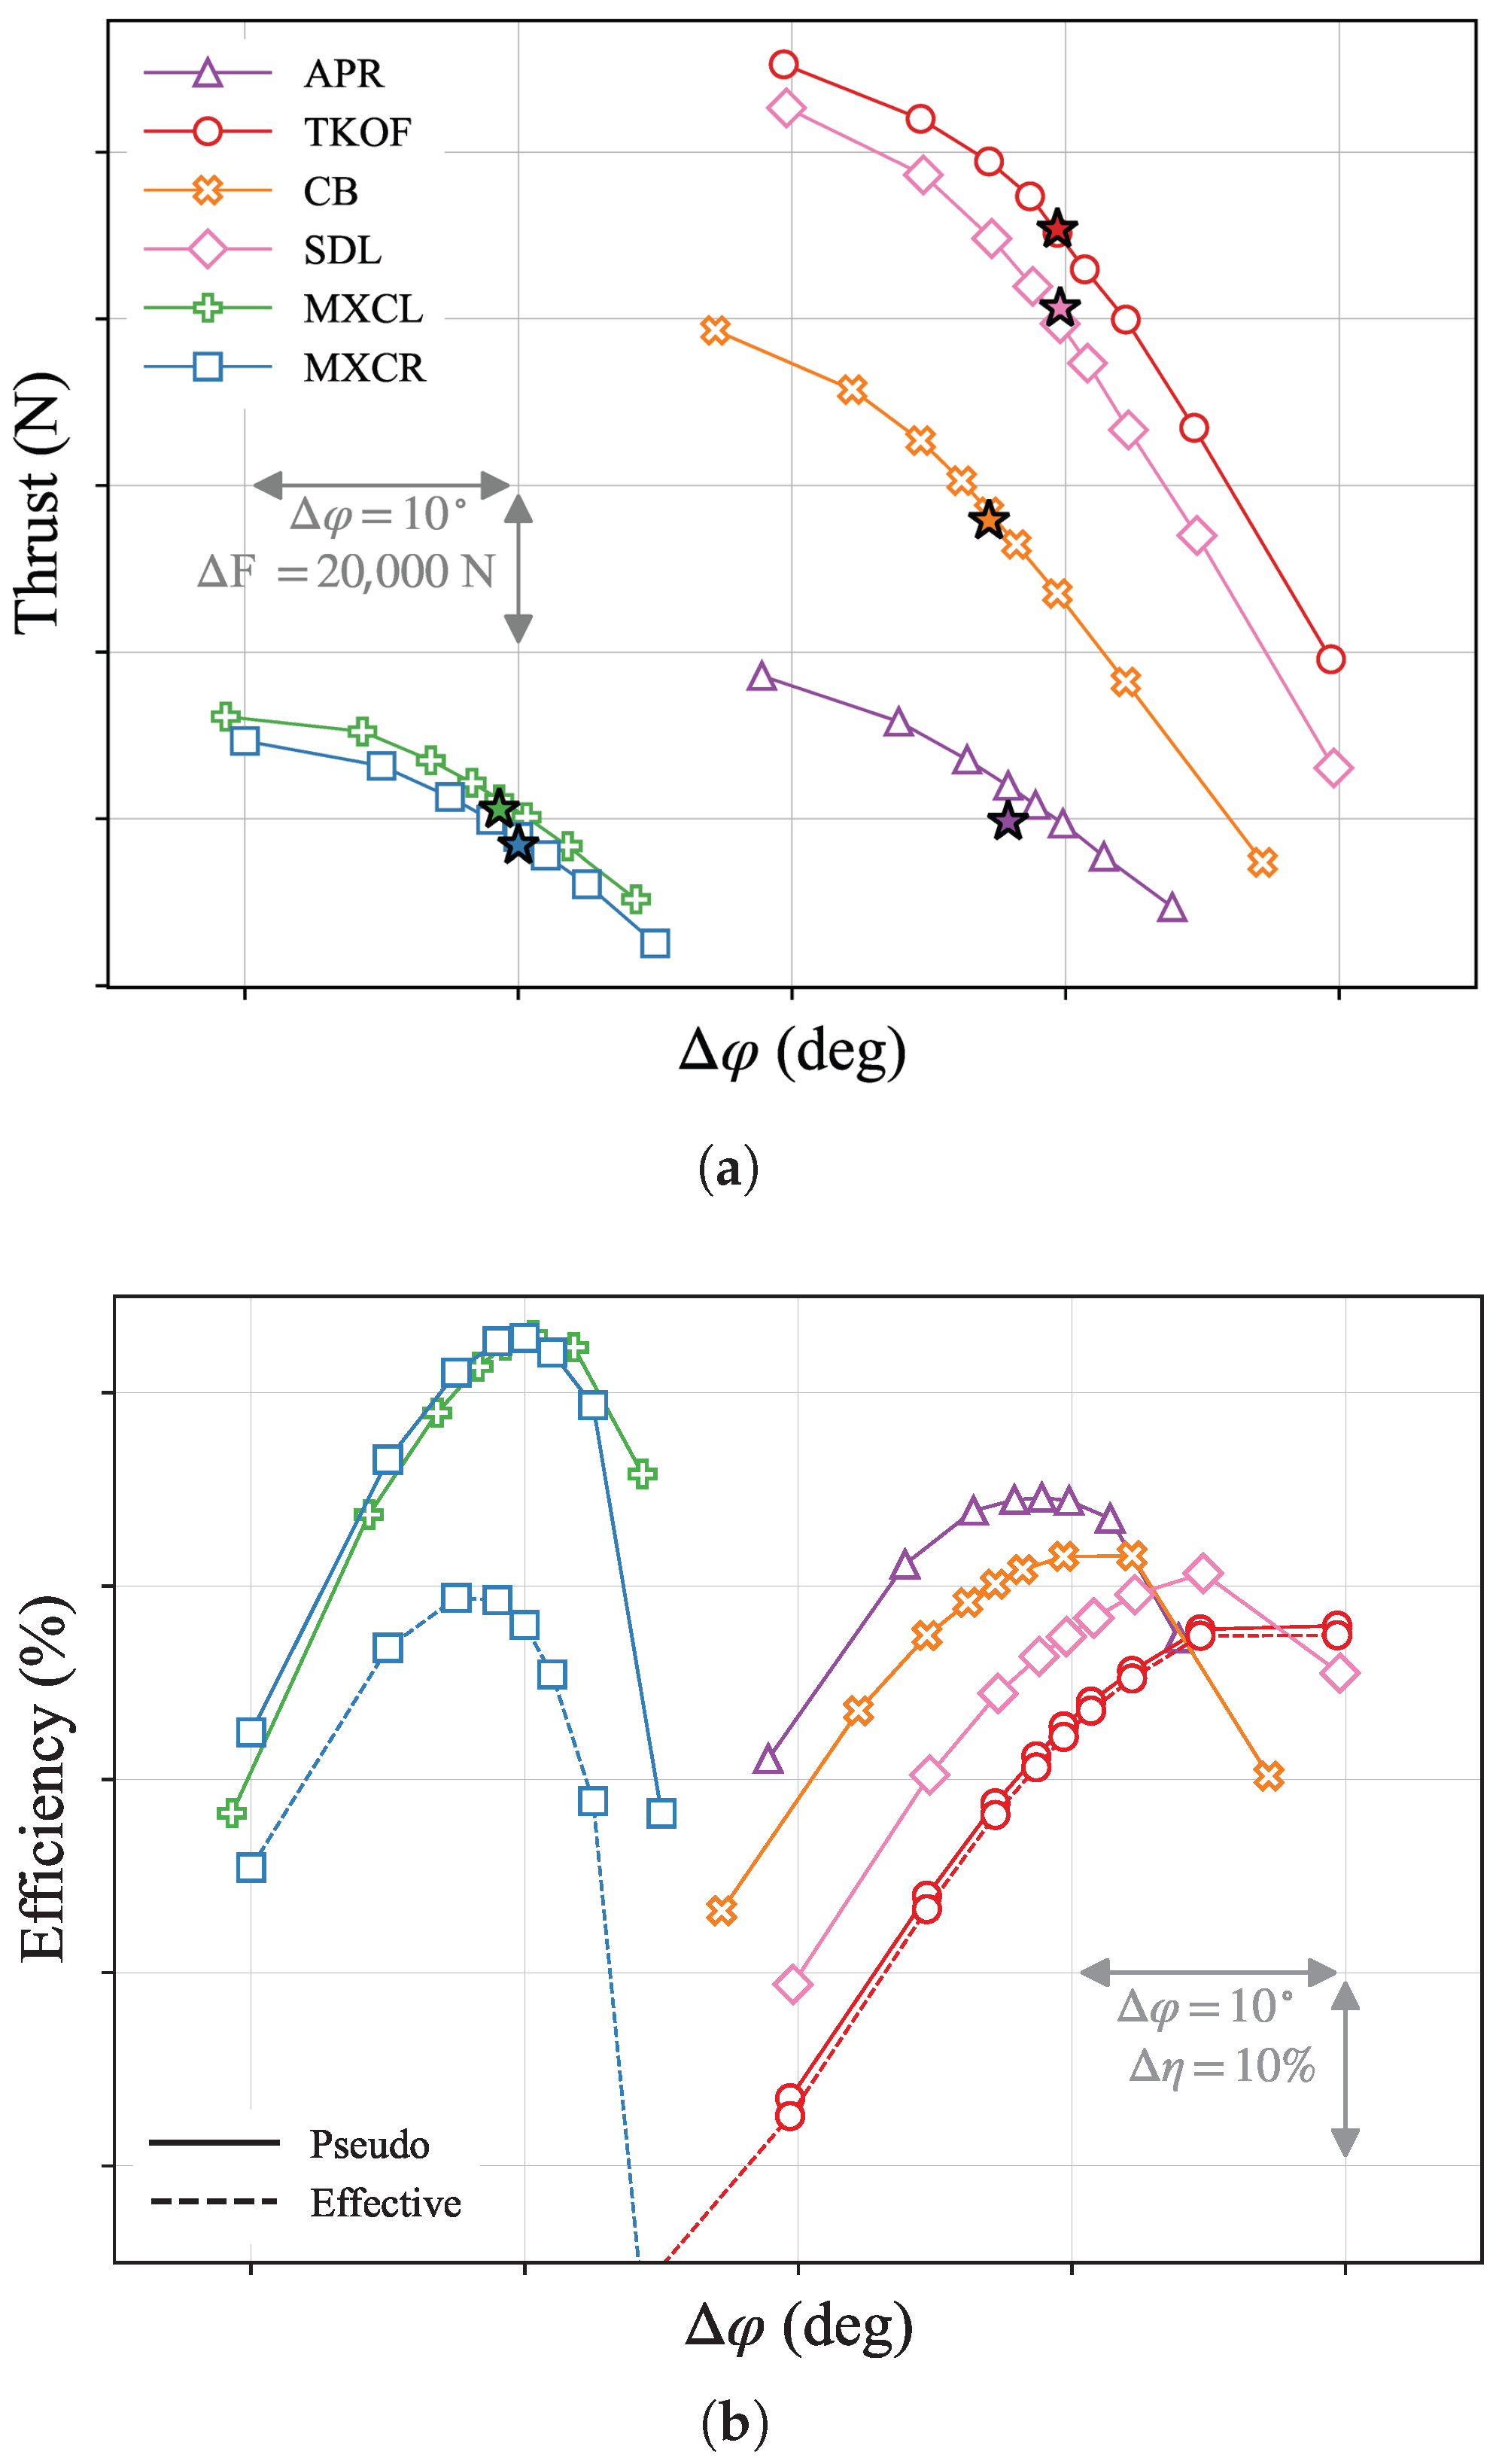
Performance characteristics and their respective rotor pitch settings are shown in Figure 13, with the thrust requirements of the different mission points also highlighted in the plots with stars. This plot is obtained by varying the pitch angle of the rotor while maintaining the advance ratio along the speed line for each operating point. In Figure 13a, it is visible that all thrust requirements are met by adjusting the rotor pitch. In addition, a stability margin over 20% without the need of increasing the RPM is verified. This is a consequence of the correction of the stator pitch angle to avoid unwanted flow separation, as displayed in Figure 9. The rest of the operating points presented in the plot were also checked, and the corrected pitch setting of the OGV was set to avoid detachment of the flow.
Additionally, Figure 13b presents the overall pseudo-efficiency for different rotor pitch settings for all operating points, resulting in the peak efficiency at the design point. It is worth noticing that for the two main operating points (MXCR and TKOF), the overall effective efficiency is also plotted (dashed lines), showing a difference of more than 10% when including the hub forces at MXCR. However, this difference is not present at off-design conditions, where both efficiencies are the same. Nonetheless, it is clear that this design was optimised for η ov , pseudo and not for the other one, which is planned to be introduced in the next design iteration to find a better compromise between both of them.

3.2.2. Flow Field

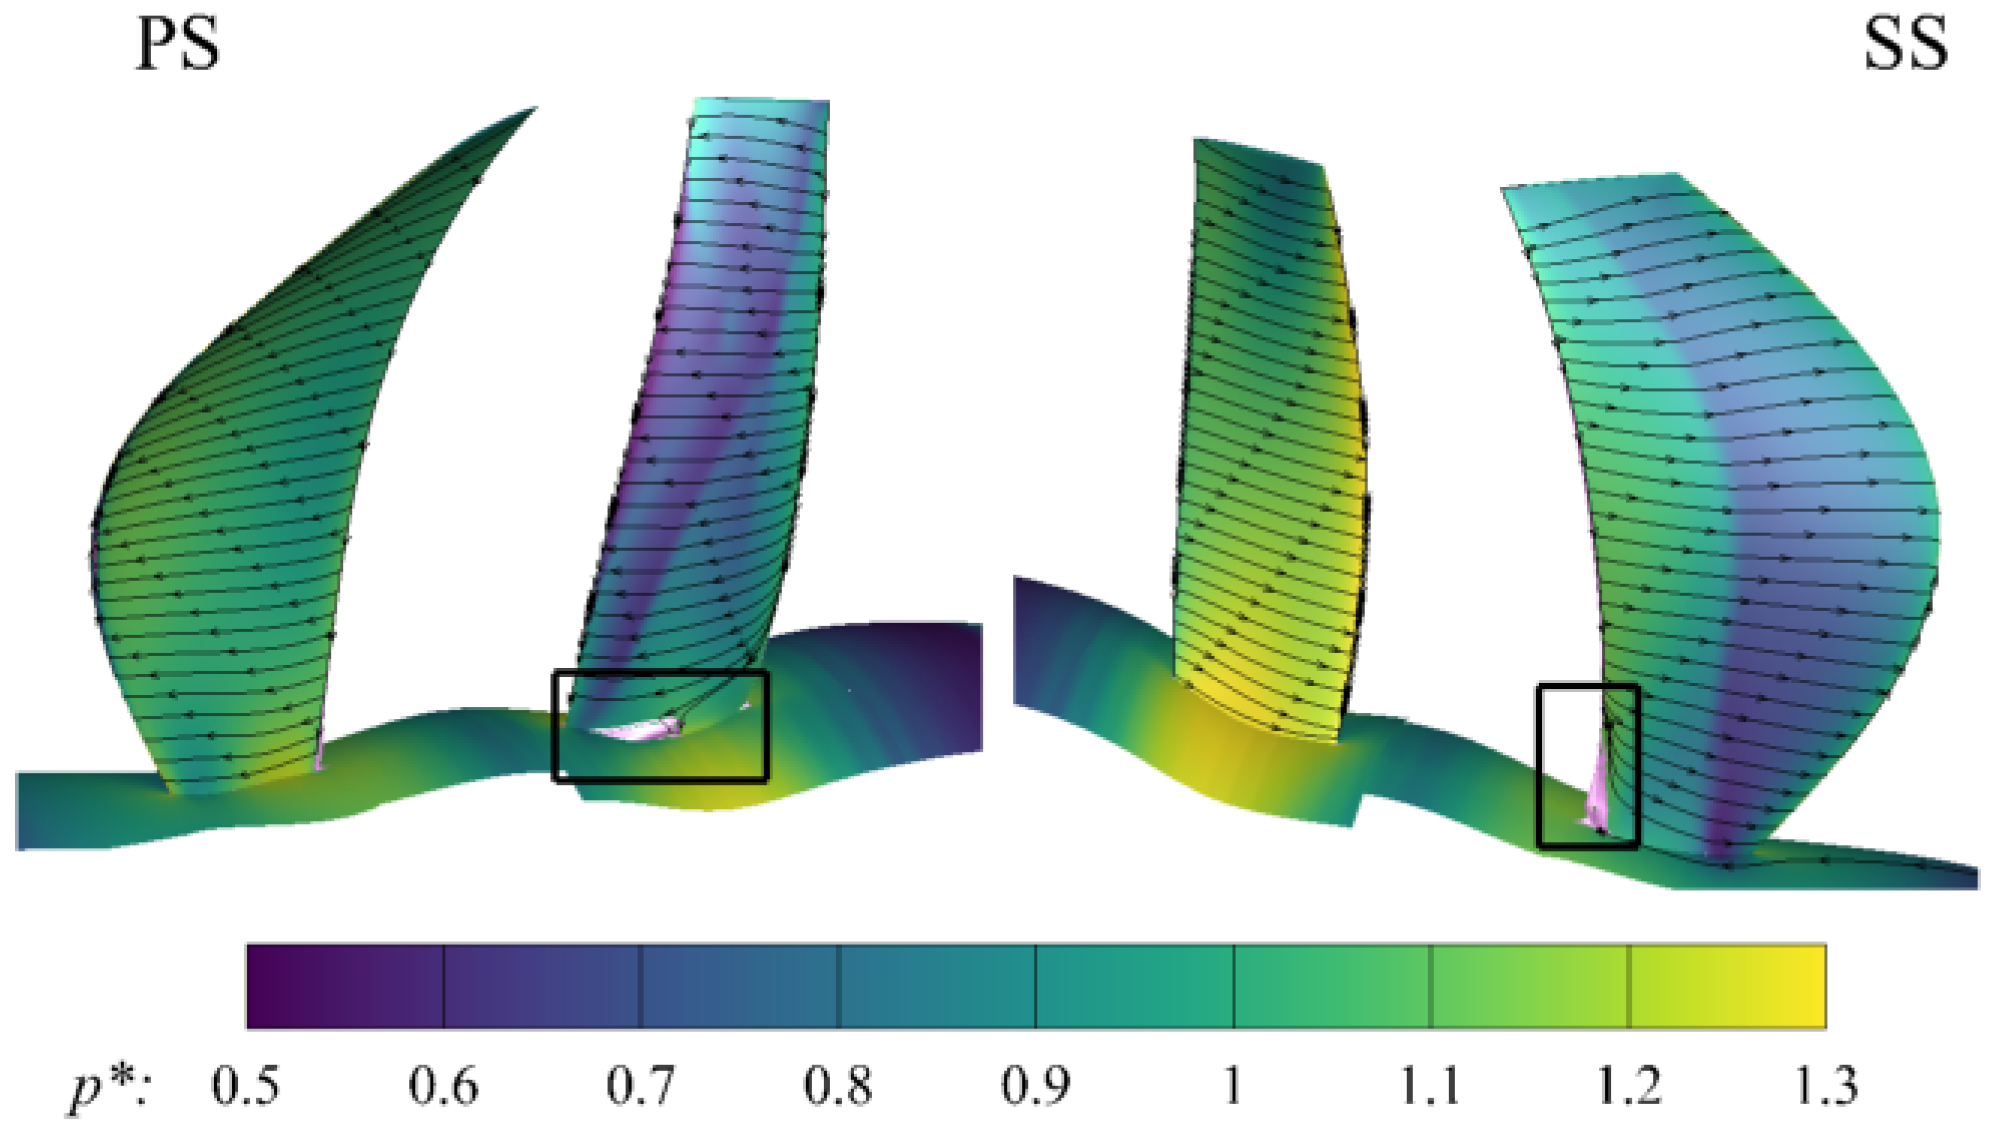
The flow characteristics at the design point, in terms of blade surface streak lines and normalised pressure contours ( p * = p / p r e f ) at design conditions within both the rotor and guide vane, are shown in Figure 14. The design introduces a small flow detachment on the TE of the rotor on the suction side (SS) and on the hub area on the stator blade as depicted in the same figure by the pink iso-surfaces of 0 axial velocity and marked with boxes.
Moreover, the same flow characteristics, but for the TKOF point, are depicted in Figure 15, showing different pitch settings of the guide vane to see the effect it has in the flow field, since it is key to find the suitable pitch setting of the OGV to enhance its performance. On the left-hand side of the figure, the reference pitch setting is presented, which was obtained as a first estimate from conceptual design. With this angle, the flow around the stator is significantly detached as visible with the streamlines and the iso-surface of the zero u-velocity in pink. When varying the pitch angle by 10 from the reference, the difference is clear, leaving only a much smaller zone in the LE.

3.3. Unsteady Effects

In addition to the steady-state (RANS) simulations used for optimisation and characterisation of the performance of the design, unsteady simulations are also conducted to have a better understanding of the time-accurate blade row interactions and their impact on the design. This section presents the results for these simulations computed with the harmonic balance method to study two main effects: the sensitivity of the rotor–stator interaction to the clipping of the stator and the impact of the non-zero angle-of-attack.

3.3.1. Harmonic Balance

Over the last two decades, there has been considerable progress in the development of efficient unsteady simulation methods using harmonic balance. This approach is particularly suitable for fast assessment of non-linear blade row interactions [23]. The HB method used here is formulated in the frequency domain and uses implicit pseudo-timestepping to solve the equation system [24]. It has recently been extended to take into account non-linear interactions of disturbances with multiple fundamental frequencies [25]. As shown by [26], HB is also highly efficient for the simulation of rotationally asymmetric turbomachinery flows.
Note that [27,28] have successfully applied the HB method to the simulation of open rotors.

3.3.2. Acoustic Characterisation and Clipping Effects

In addition to the performance, acoustic characteristics, which are a strong design driver, also need to be addressed in the ongoing open fan design. Extensive clipping studies are conducted to quantify the trade-off between performance degradation (see also the work of [11]) and improved acoustics emissions. Recommendations for clipping the stator to reduce rotor-stator interaction noise are realised based on previous open-rotor studies, such as [10].
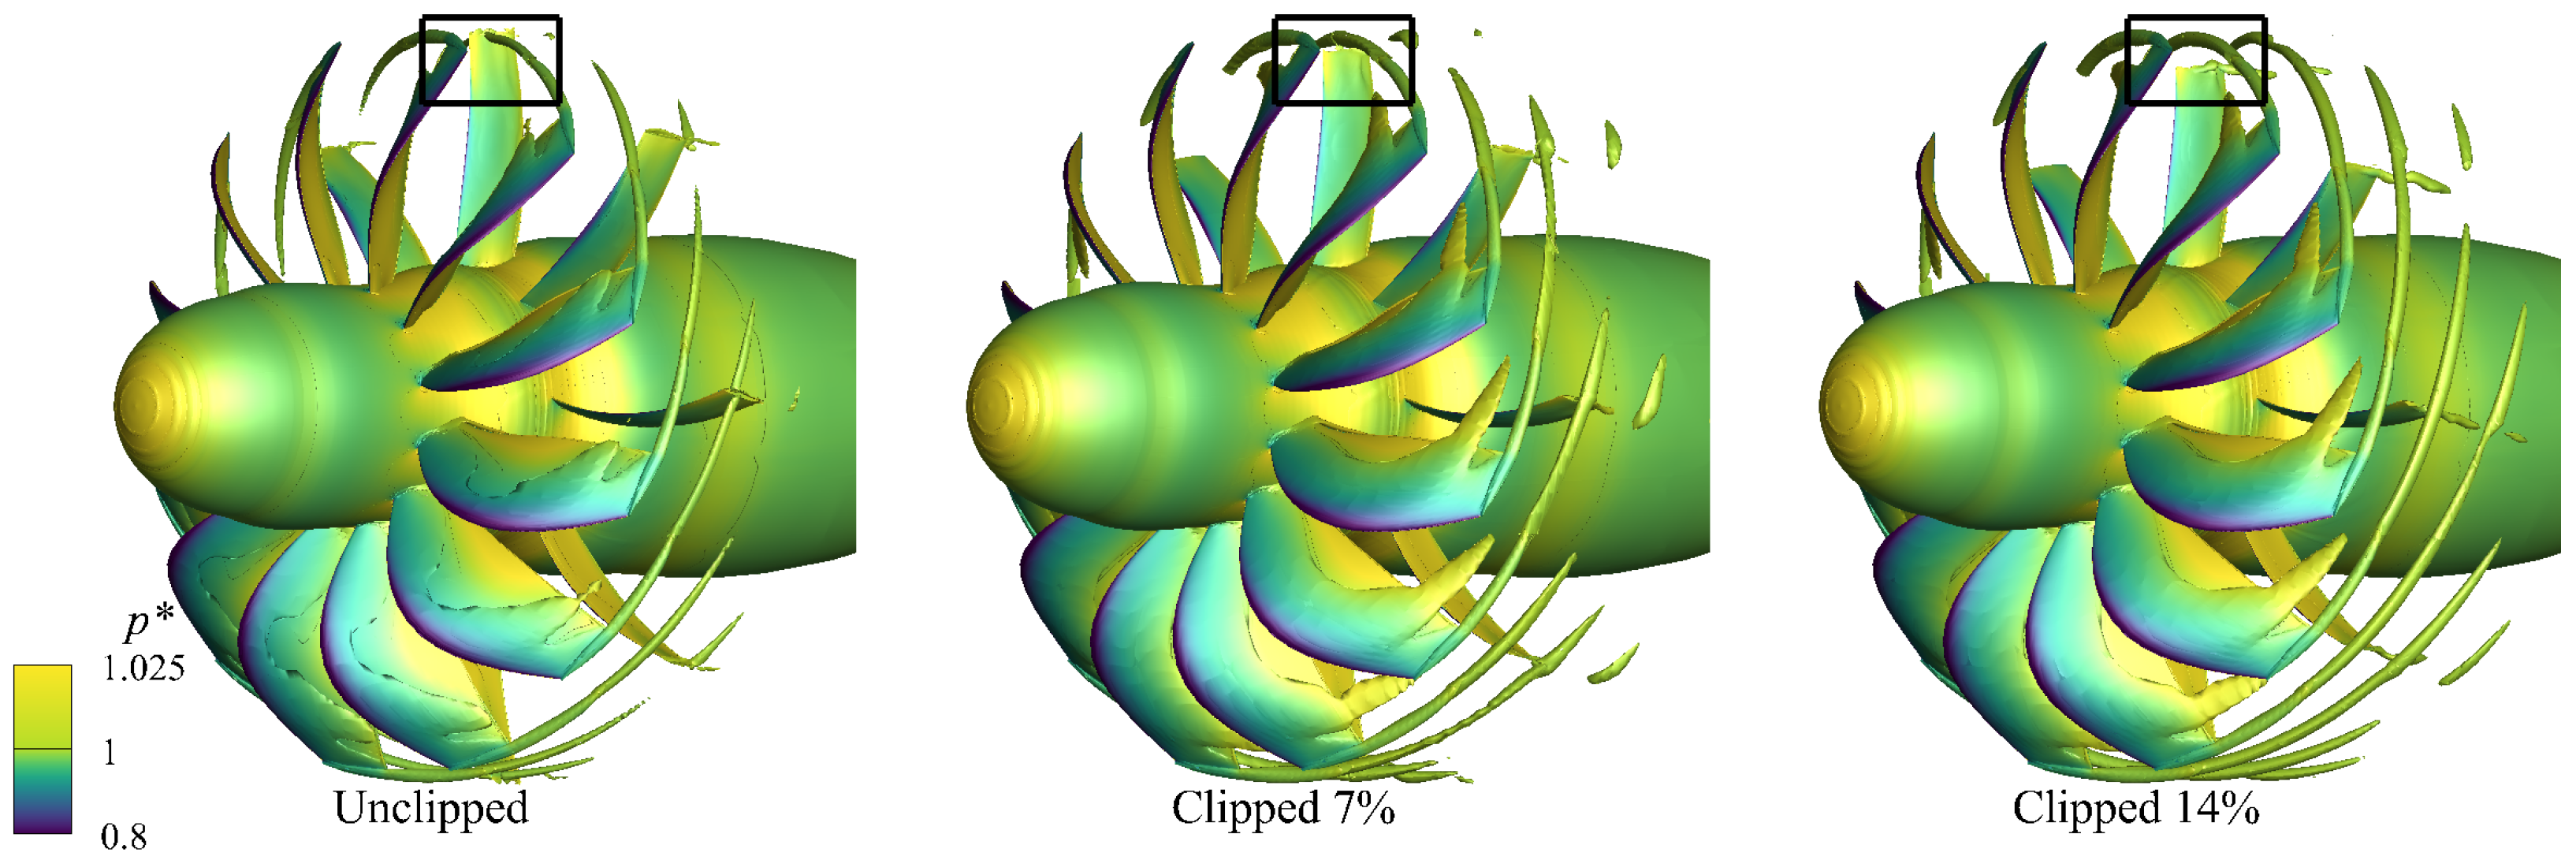
Consequently, different clipping values are simulated to compare its effect on the blades interaction noise and in the far field. In Figure 16, the instantaneous vorticity field is depicted, where the interaction of the rotor tip vortices with the stator is visible for the case without clipping (see marked zone with boxes). As the clipping is increased, the tip vortices do not interact with the blade, in addition to a reduction in the pressure in its tip shown in the contours plotted. For an uninstalled configuration with no angle-of-attack, note that with a 7% clipping, the interaction of the tip vortices from the rotor with the stator blades is already avoided.
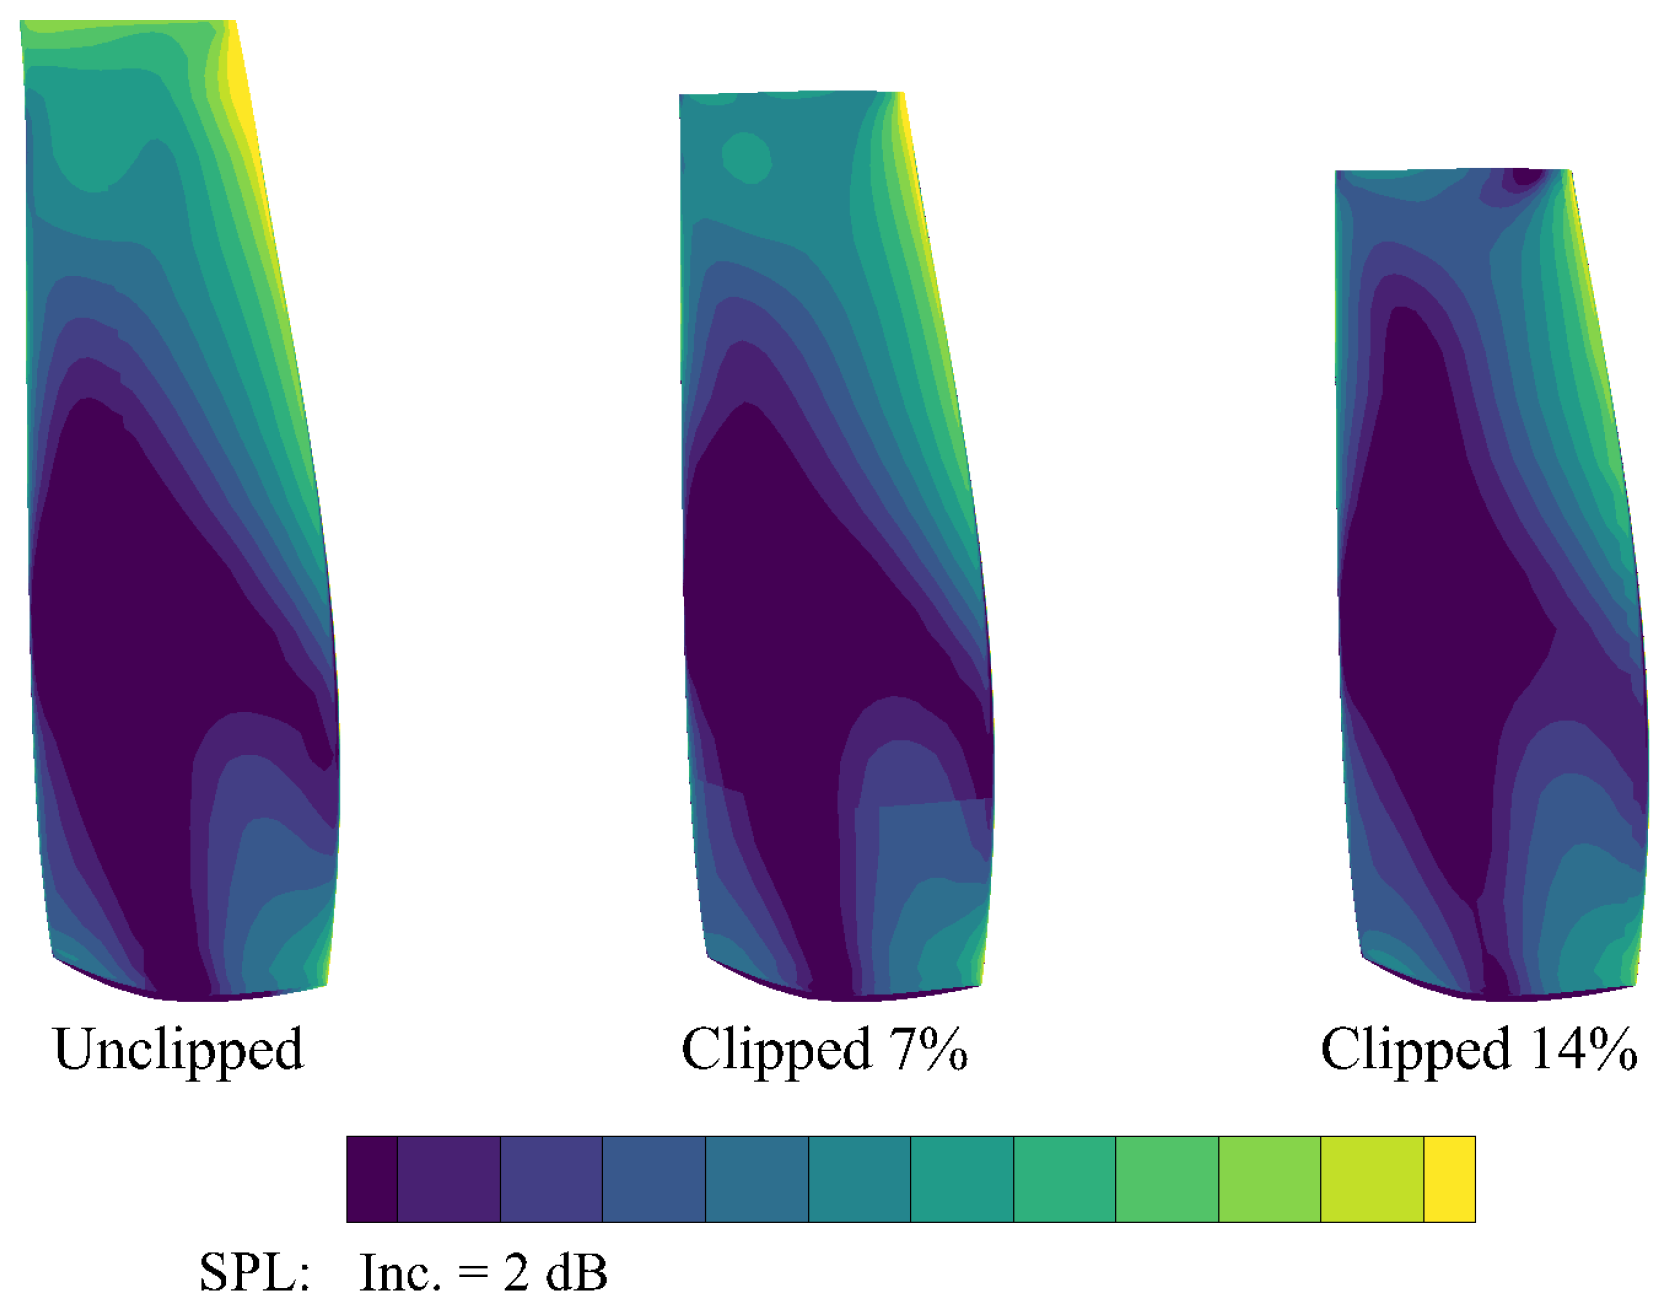
Furthermore, looking at the sound pressure level (SPL) of the first harmonic on the pressure side of the stator, plotted in Figure 17, the impact of clipping is visible at the tip of the blade and the LE at more than 50% of the span, presenting a decrease not only due to the cut, but also as a result of the absence of interaction.
The impact of the clipping on tonal acoustic near field can be seen in the amplitude reduction in the upstream propagating pressure patterns in the rotor system, stemming from unsteady rotor-stator interaction (Figure 18); for a cylindrical analysis plane, as defined in Figure 2. Both parts of the cylinder show the first harmonic in the respective frame of reference. The amplitudes in the rotor zone are thus indicative of the strength of the rotor–stator interaction. A clearly lower impact of the OGV interaction entering in the rotor (zone marked as A) can be seen for the 14% clipping in comparison to the unclipped case. In addition, the other half corresponds to the OGV zone, where the wake of the rotor-stator interaction is visible close to the end of the cylinder plane (zone marked as B). Again, there is a noticeable decrease in the impact of the wake interaction for the higher clipping; nevertheless, for the intermediate clipping value, there is already a visible reduction, due to the lack of contact between the tip vortices of the rotor and the stator blade. In contrast, its influence in the rotor is harder to visualise in the contours for the latter level of OGV clipping.
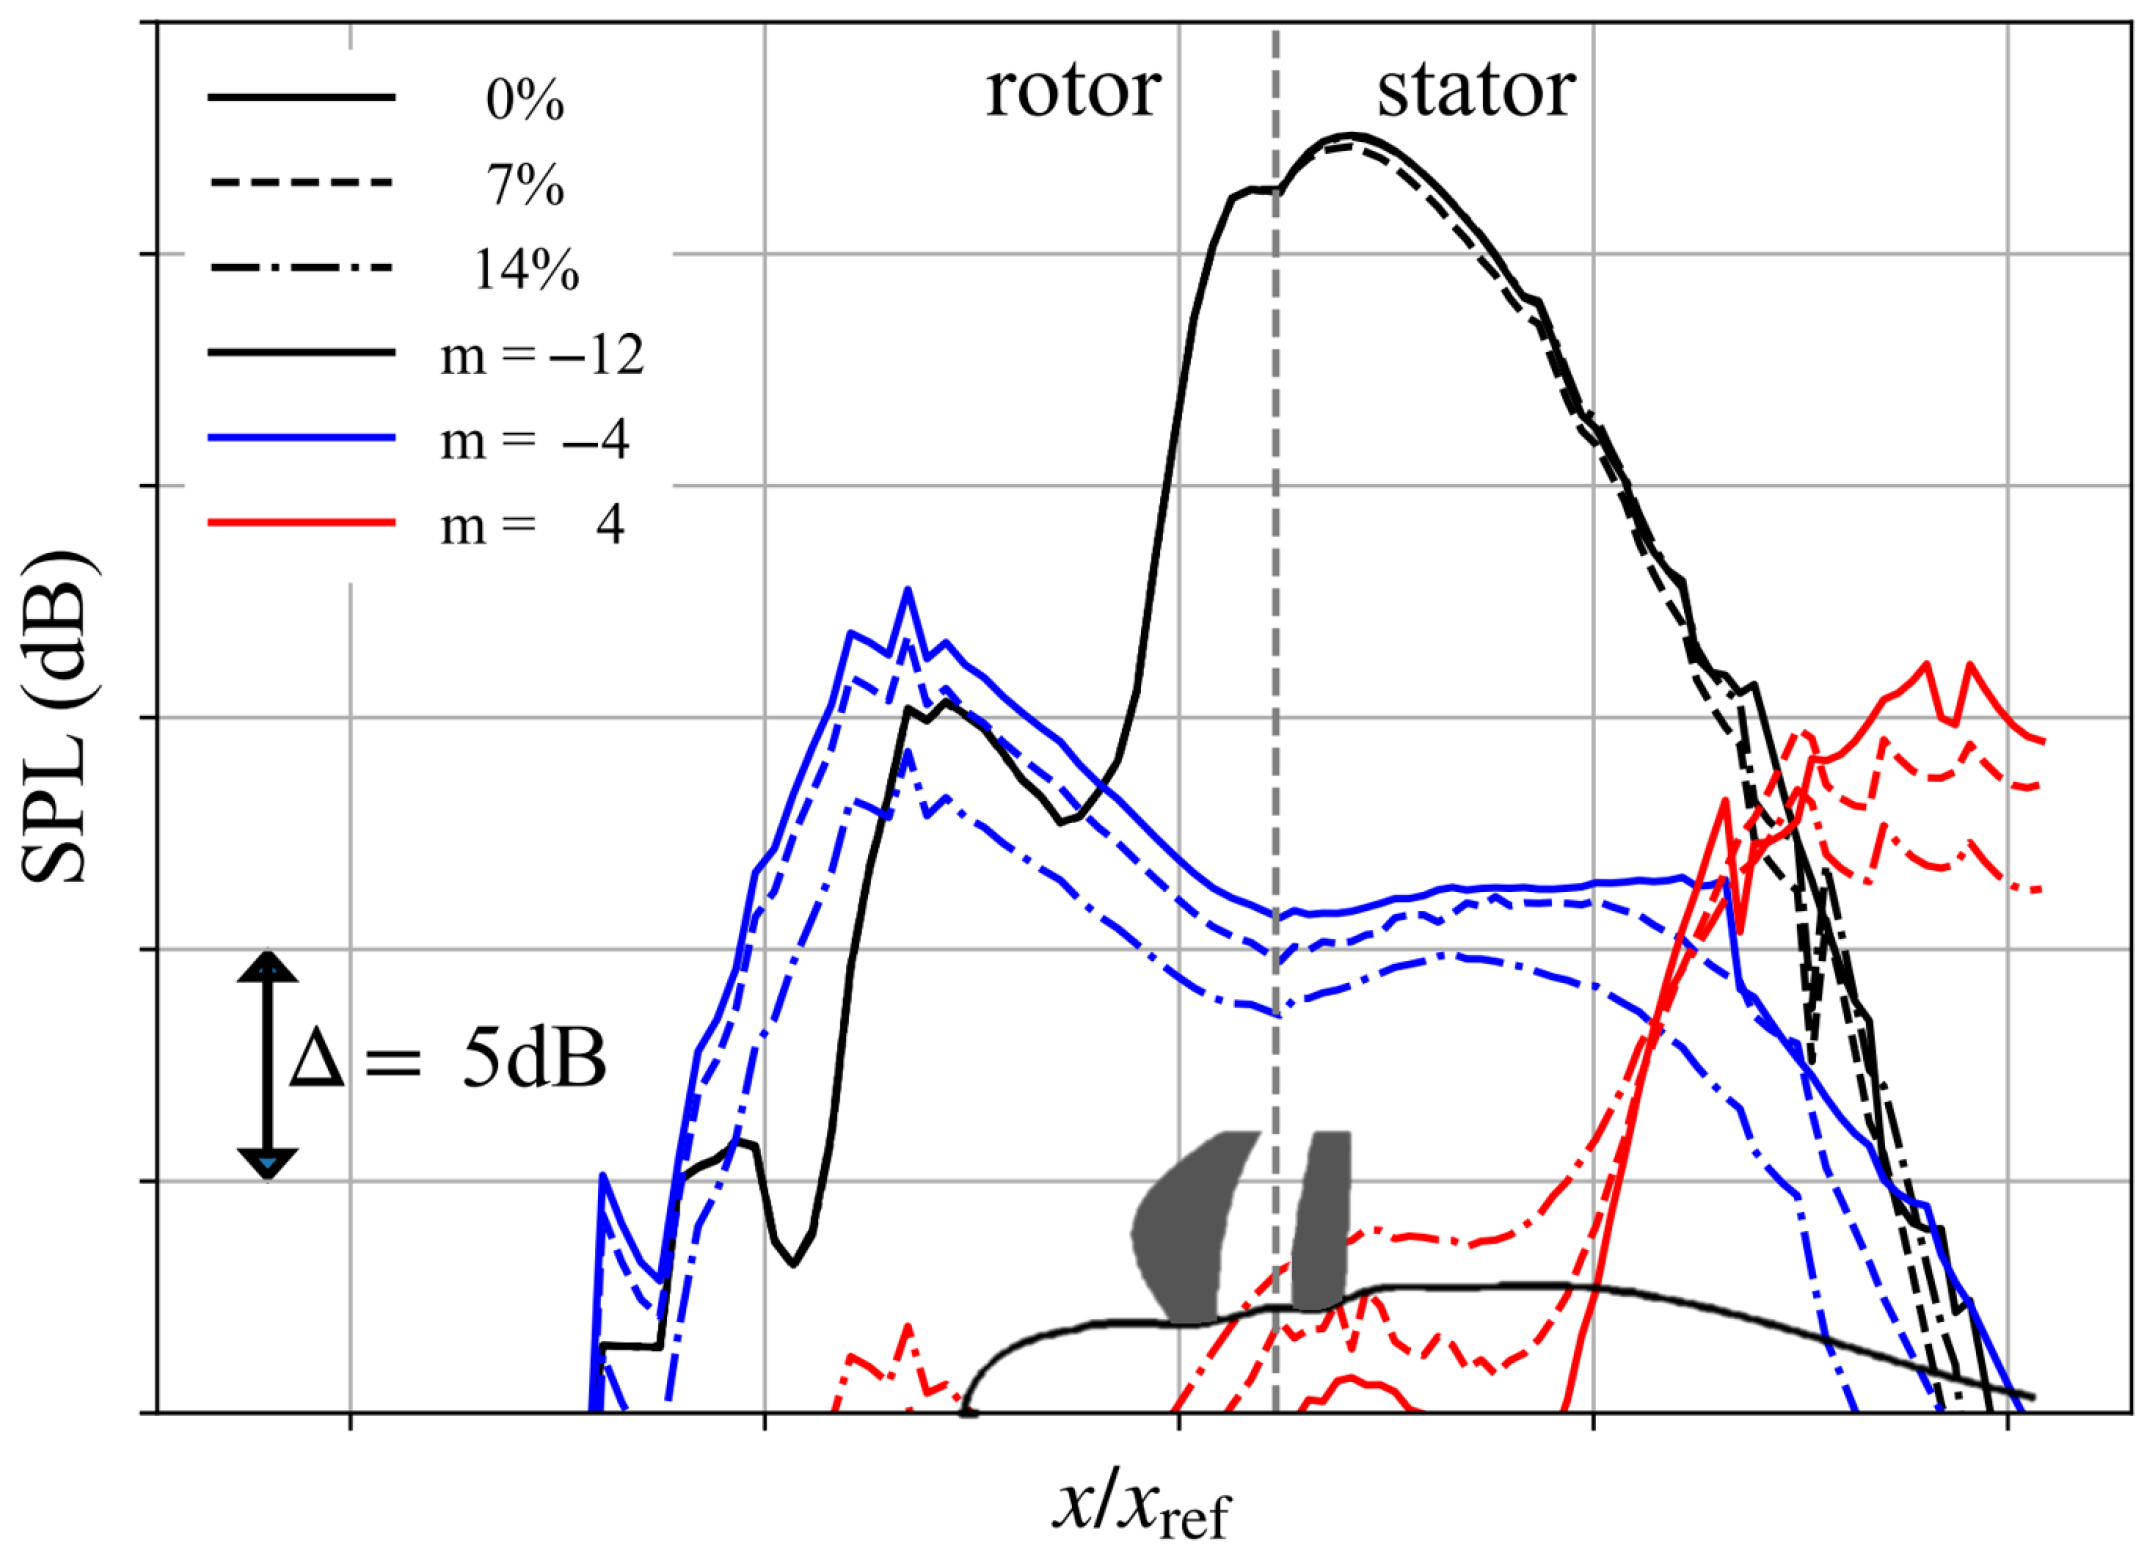
Besides the effects of the clipping in the near-field, it is necessary to analyse the impact on the acoustics in the far field. With this aim, the first-rotor harmonic (in the absolute frame of reference) along the above-mentioned analysis plane is decomposed into circumferential Fourier modes. Thus, Figure 19 exhibits the SPL to compare the three cases studied for the main modes ± 4 and 12 , corresponding to the rotor and stator blade count difference and the rotor blade count, respectively. The choice of these modes is due to them being the ones with higher impact. Note that here, a mode order is negative if it represents a spinning modes whose phase rotates in the same direction as the rotor blades. In particular, the mode order 12 (black lines) corresponds to the potential field of the rotor. As can be expected, it is almost unaffected by the clipping.
Nevertheless, for the interaction mode 4 (blue lines), a decrease in the sound level for the higher clipping case on both the rotor and stator zones of around 5 dB is visible. For the + 4 (red lines), a similar reduction is observed in the outlet of the stator, but not in the rotor domain. The pressure amplitudes for all other mode orders turned out to be of a significantly lower amplitude than the three ones discussed, and are therefore not shown.
Moreover, the effect of the clipping to the overall performance of the rotor is also computed, resulting in a loss of less than 1% in efficiency for a clipping between 7 and 14%. Moreover, the thrust generation in the stator is decreased by 10%, but accounts for less than 1% of the total thrust, as seen in the force contribution of each part (see Figure 8b), maintaining the stability margin.

3.3.3. Angle-of-Attack

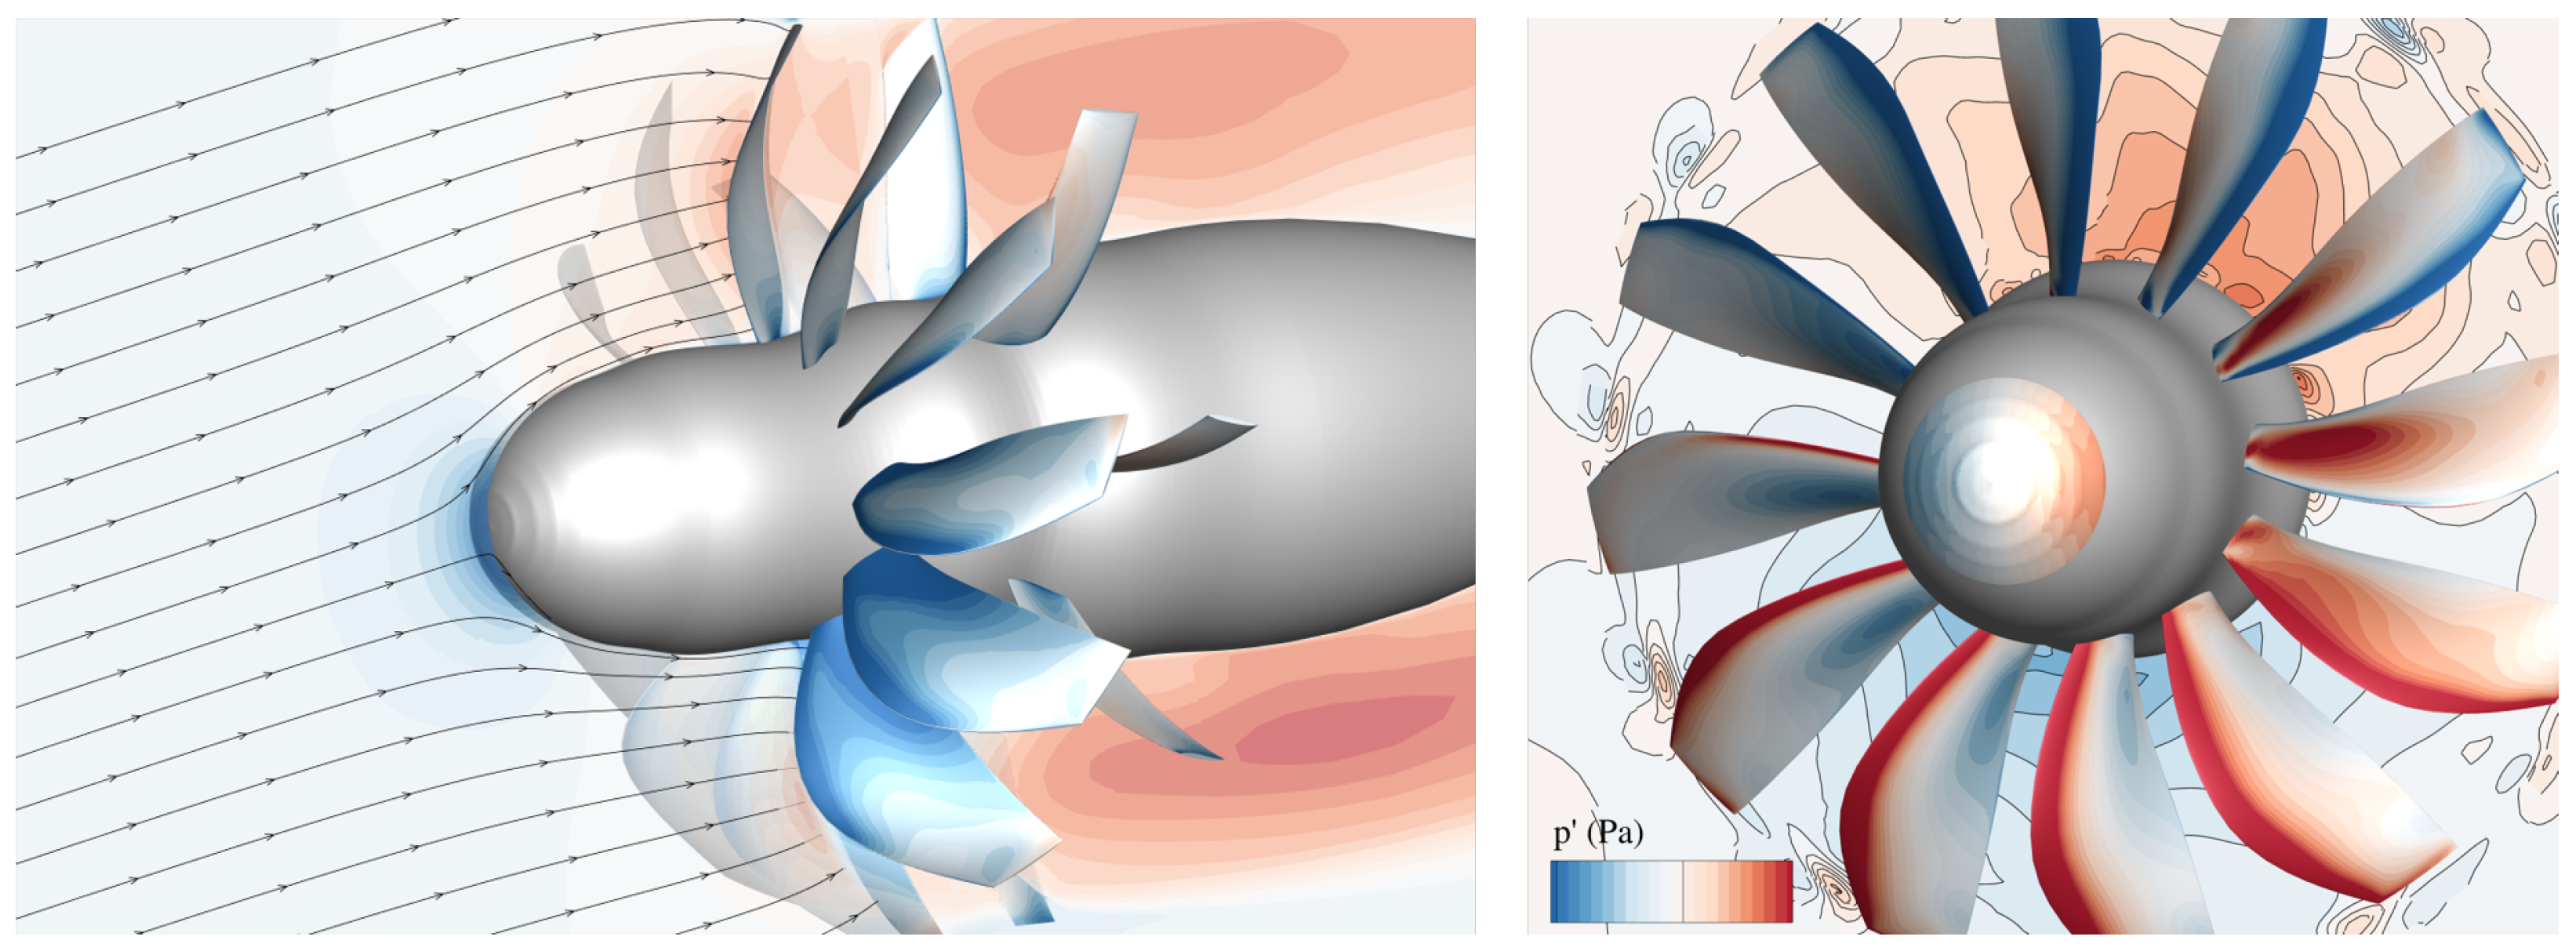
Another unsteady effect studied is when the open fan is under conditions of angleof-attack different to zero. For this purpose, the HB solver is used in combination with non-zero absolute flow angles in the far-field boundary conditions. Note that while this boundary condition is steady in the OGV system, it corresponds to a harmonic variation in the flow direction in the rotor relative system. As the rotor is simulated in the relative system, the far-field boundary condition has to be applied at each sampling point of the HB solver with the corresponding flow angle.
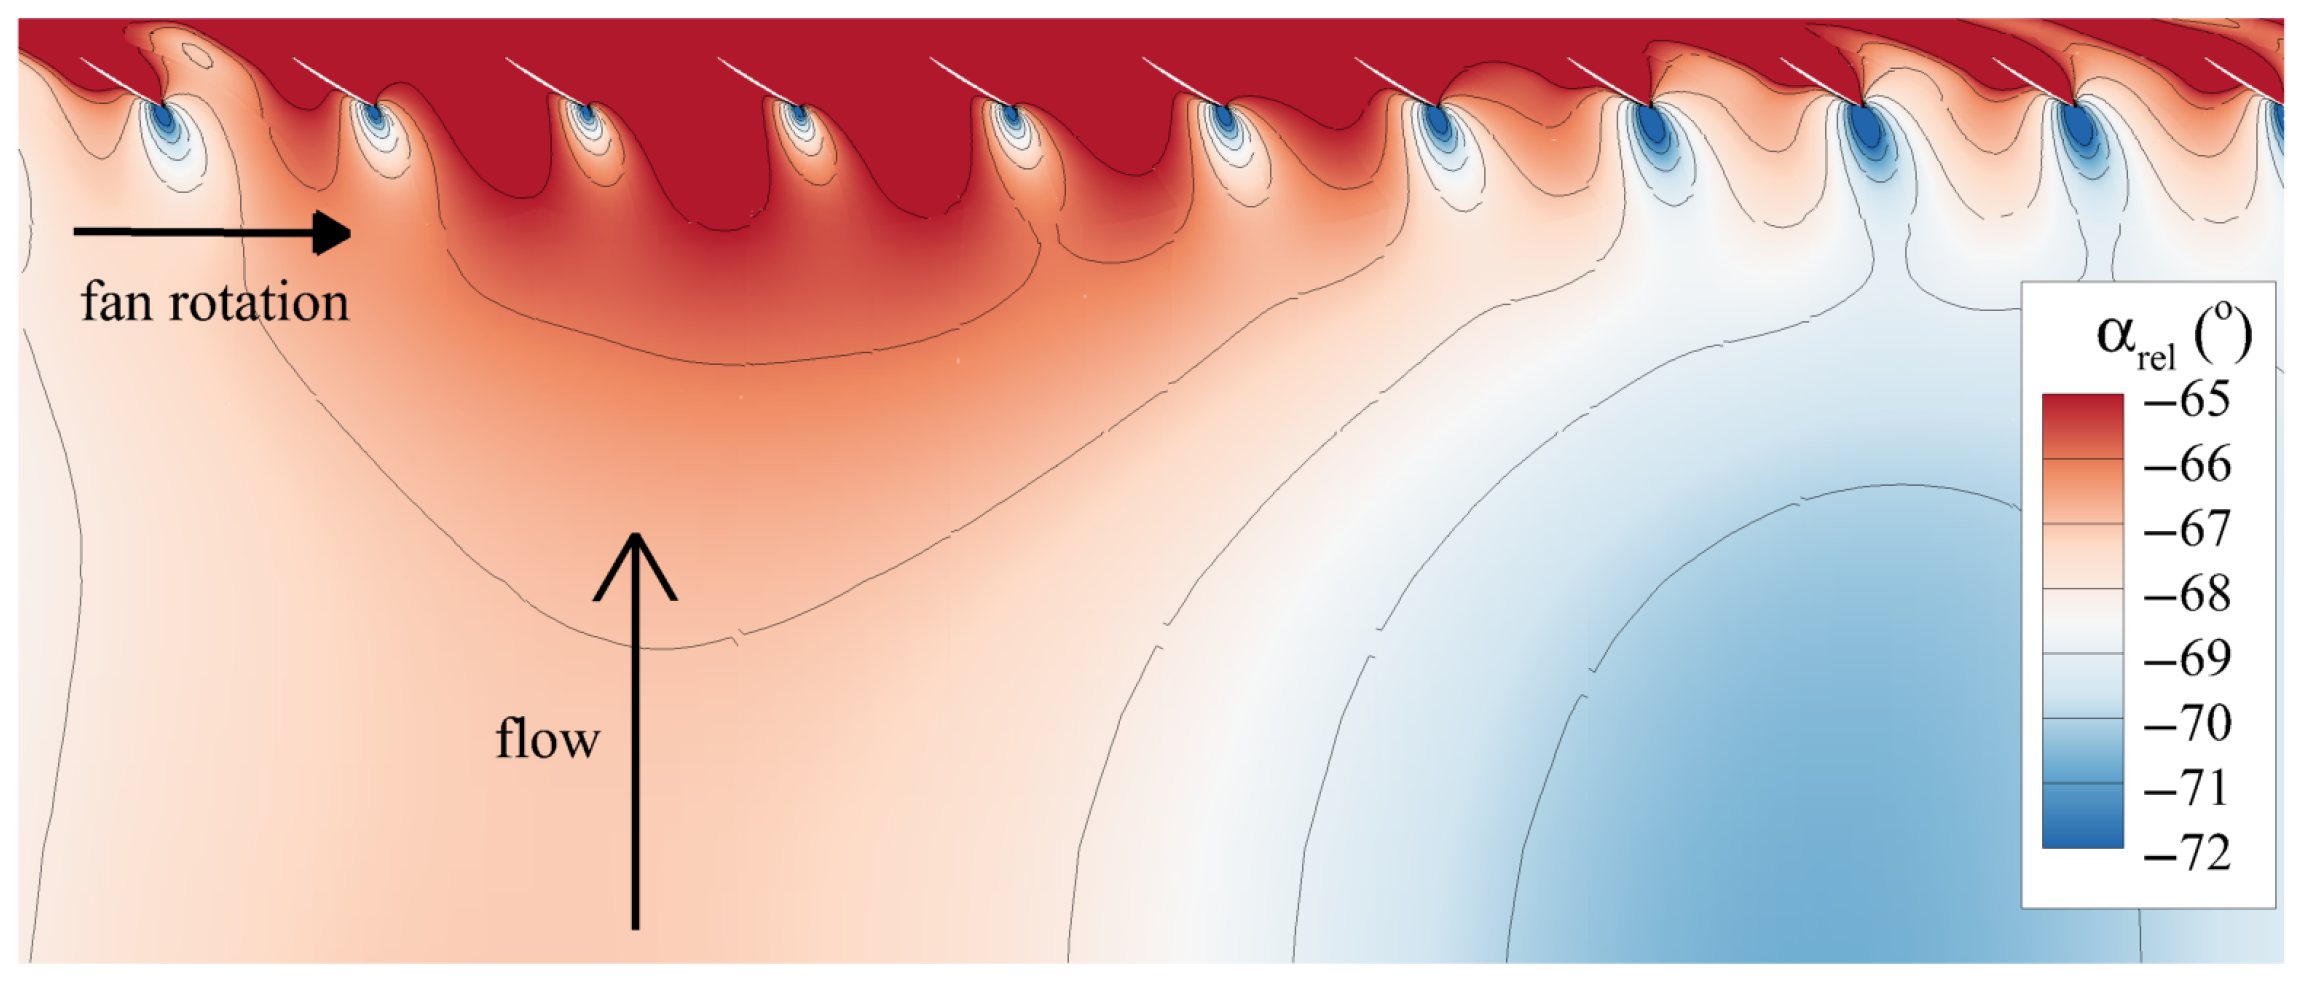
The computational domain is a single rotor passage with the rotor pitch as interblade phase angle and a full annulus of the stator. Only two harmonics are used in the rotor, whereas no unsteadiness is resolved in the stator domain since the dominant effect here is the rotational asymmetry of the mean flow. As shown in Figure 20 for α = 15 , the relative flow angle in the rotating system varies significantly, which can be directed linked to the incidence angle.
In addition, Figure 21 shows the result for a α = 10 , where on the left-hand side, the disparity of the flow field in the velocity and on the right-hand side, the instantaneous pressure distribution at the rotor are visible. The results are used on the one hand to study the acoustic characteristics in the near-field, e.g., to optimise the clipping, and on the other hand to quantify the unsteady harmonic pressure variations, often referred to as 1P-loads, and as such having a major impact on structural considerations, as mentioned in [1]. The efficiency of the HB approach allows for a reliable and quick assessment of both effects in a design and optimisation context.

4. Conclusions

The results presented in this paper show that the open rotor configuration is a challenging design with different features from ducted fans, and not thoroughly studied. Nevertheless, a design mainly driven by aerodynamic performance was achieved for an open fan with the specifications of a civil aircraft with high levels of efficiency. The main conclusions from this design are the following:
  • The propeller efficiency over c p characteristics from original Wald’s theory [20], although being derived with a number of simplifications and for incompressible flows, has been reproduced by a series of RANS-based design optimisations, and hence can be useful in the given high-transonic and compressible flight regime to support the conceptual design of the open fan.
  • The effectiveness of the guide vane grows with increasing rotor power coefficient due to the higher amount of swirl that can be recovered. This can be quantified by the divergence of the swirl-free propulsive efficiency and classical rotor propeller efficiency. However, the latter decreases more rapidly with increasing rotor power coefficient; hence, the overall efficiency of the open fan drops towards higher values of c p . Therefore, low values of rotor c p are favourable, reducing the effectiveness of the vane and limited by the loss levels in the vanes, rendering the guide vane less effective. This requires for a very careful selection of rotor c p and an accurate quantification of guide vane loss levels.
  • The different sensitivity studies allowed the analysis of the impact of different design parameters key to the aerodynamics performance such as hub effects; stability margin; and geometrical variables, like sweep and lean angle. A positive outcome was obtained by adding together the results of the separate studies into the design, leading to a viable open rotor configuration.
  • The generated drag due to the hub contributes approximately 10% to the total thrust, similarly to the thrust contribution of the stator. Therefore, the hub forces need to be included in the efficiency computation to have consistent performance and steer the design correctly. Additionally, the blades have an impact on the hub line forces generated, resulting in the production of 2.5% less drag in its overall contribution to the total thrust compared to the blades-off simulation.
  • It is possible to gain an approximately 10% stability margin with an increment of 5% of the RPM, sacrificing less than 1% in efficiency for the MXCR condition for the range of stability margin between 10 and 25%. The increment of OGV count does not impact as significantly to the stability margin as the increment in RPM.
  • A 14% clipping of the OGV represents a loss of 0.75% in efficiency, whereas with a 7%, the loss is around 0.25% and it already avoids the rotor vortices interaction. However, when looking further from the blades, the 14% clipping presents the best decrease in acoustic impact, whereas the mid-value clipping does not show a significant reduction.
  • The use of the harmonic balance solver with a coarse mesh gives results good enough to see the tendencies of the rotor-stator interaction and also dynamic forcing under angle-of-attack conditions. For the iterative design process, it is a viable option; however, a finer grid is necessary to validate the final design, and therefore further studies on acoustics are needed to fully determine the acoustic impact.

Author Contributions

Conceptualization, C.R.S. and R.S.; methodology, C.R.S., C.F. and R.S.; software, C.F.; validation, C.R.S.; formal analysis, C.R.S., C.F. and R.S.; investigation, C.R.S., T.D., C.F. and R.S.; writing—original draft preparation, C.R.S., C.F. and R.S.; writing—review and editing, C.R.S. and R.S.; visualisation, C.R.S.; supervision, R.S.; project administration, R.M.L. All authors have read and agreed to the published version of the manuscript.

Funding

The work of this paper is part of the PANDORA project which has received funding from the European Union’s Horizon research and innovation programme, under grant agreement no. 101096156.
Ijtpp 10 00028 i001

Data Availability Statement

The data in this paper is not available due to the confidentiality of the project.

Acknowledgments

The contents of this paper are part of the work contribution of the PANDORA project; therefore, the authors would like to sincerely appreciate all partners for their collaboration. The authors gratefully acknowledge the scientific support and HPC resources provided by the German Aerospace Center (DLR). The HPC system CARA is partially funded by the “Saxon State Ministry for Economic Affairs, Labour and Transport” and the “Federal Ministry for Economic Affairs and Climate Action”.

Conflicts of Interest

The authors declare no conflicts of interest.

Nomenclature

The following abbreviations are used in this manuscript:
Latin symbols
c p power coefficient c t thrust coefficient
Tthrust or axial forcePshaft power
pstatic pressureuaxial velocity
Greek symbols
α angle-of-attack α r e l relative inflow angle
η efficiency ρ fluid density
φ pitch
Subscripts
free stream values9exit
ax, xaxialdppressure force
hhubidideal
ovoverallproppropulsive
refreference valuetranstransfer
Superscripts
perturbation*normalised quantity
Acronyms
APRapproachCBcutback
CFDcomputational fluid dynamicsFPRfan pressure ratio
LEleading edgeMXCLmaximum climb
MXCRmaximum cruiseOGVoutlet guided vane
PSpressure sideSDLsideline
SSsuction sideTEtrailing edge
TKOFtake-off

References

  1. Degeorge, C.L. Large-Scale Advanced Prop-Fan (LAP) Technology Assessment Report; Tech Rep. NASA-CR-1882142; NASA: Cleveland, OH, USA, 1988. [Google Scholar]
  2. Mitchell, G.; Mikkelson, D. Summary and recent results from the NASA advanced high-speed propeller research program. In Proceedings of the 18th Joint Propulsion Conference, Cleveland, OH, USA, 21–23 June 1982. [Google Scholar]
  3. Groeneweg, J.F.; Bober, L.J. NASA Advanced Propeller Research; Tech Rep.; NASA: Cleveland, OH, USA, 1988; p. 101361. [Google Scholar]
  4. Baum, J.A.; Dumais, P.J.; Mayo, M.G.; Metzger, F.B.; Shenkman, A.M.; Walker, G.G. Prop-Fan Data Support Study; Tech Rep. NASA-CR-152141; NASA: Mountain View, CA, USA, 1978. [Google Scholar]
  5. Daydé-Thomas, V.; Polacsek, C.; Gloerfelt, X.; Sugiyama, M.; Mardjono, J. Tone noise prediction of an open-fan engine using a source-mode integral formulation. In Proceedings of the Forum Acousticum, Turin, Italy, 11–15 September 2023. [Google Scholar]
  6. Dittmar, J.H.; Hall, D.G. Cruise Noise of an Advanced Propeller with Swirl Recovery Vanes. J. Aircr. 1993, 30, 221–226. [Google Scholar] [CrossRef]
  7. Stokkermans, T.; van Arnhem, N.; Veldhuis, L. Mitigation of propeller kinetic energy losses with boundary layer ingestion and swirl recovery vanes. In Proceedings of the Applied Aerodynamics Research Conference, London, UK, 13–17 July 2016. [Google Scholar]
  8. Van Zante, D.E. Progress in Open Rotor Research: A U.S. Perspective. In Proceedings of the ASME Turbo Expo 2015: Turbine Technical Conference and Exposition. Volume 1: Aircraft Engine; Fans and Blowers; Marine, Montreal, QC, Canada, 15–19 June 2015. [Google Scholar]
  9. Khalid, S.A.; Lurie, D.; Breeze-Stringfellow, A.; Wood, T.; Ramakrishnan, K.; Paliath, U.; Wojno, J.; Janardan, B.; Goerig, T.; Opalski, A.; et al. Open Rotor Engine Aeroacoustic Techology Final Report; Tech Rep. DOT/FAA/AEE/2014-04; General Electric Company: Lincoln, NE, USA, 2013. [Google Scholar]
  10. Schnell, R.; Yin, J.; Voss, C.; Nicke, E. Assessment and Optimization of the Aerodynamic and Acoustic Characteristics of a Counter Rotating Open Rotor. J. Turbomach. 2012, 134, 061016. [Google Scholar] [CrossRef]
  11. Tantot, N.; Giannakakis, P.; Yesilcimen, H.; Binder, A. A performance modelling approach to open fan propeller module. In Proceedings of the Aerospace Europe Conference 2023—10th EUCASS—9th CEAS, Lausanne, Switzerland, 9–13 July 2023. [Google Scholar]
  12. Rovira Sala, C.; Dygutsch, T.; Frey, C.; Schnell, R.; Martinez Luque, R. Goals and Strategies for Open Fan Design. In Proceedings of the 16th European Turbomachinery Conference (ETC), paper n. ETC2025-123, Hannover, Germany, 24–28 March 2025. [Google Scholar]
  13. Becker, K.; Heitkamp, K.; Kügeler, E. Recent Progress In A Hybrid-Grid CFD Solver For Turbomachinery Flows. In Proceedings of the Fifth European Conference on Computational Fluid Dynamics(ECCOMAS CFD), Lisbon, Portugal, 14–17 June 2010. [Google Scholar]
  14. Wilcox, D.C. Reassessment of the scale-determining equation for advanced turbulence models. AIAA J. 1988, 26, 1299–1310. [Google Scholar] [CrossRef]
  15. Spalding, D.B. A Single Formula for the “Law of the Wall”. J. Appl. Mech. 1961, 28, 455–458. [Google Scholar] [CrossRef]
  16. Menter, F.R. Two-equation eddy-viscosity turbulence models for engineering applications. AIAA J. 1994, 32, 1598–1605. [Google Scholar] [CrossRef]
  17. Voß, C.; Aulich, M.; Kaplan, B.; Nicke, E. Automated Multiobjective Optimisation in Axial Compressor Blade Design. In Proceedings of the ASME Turbo Expo 2006: Power for Land, Sea, and Air. Volume 6: Turbomachinery, Parts A and B, Barcelona, Spain, 8–11 May 2006. [Google Scholar]
  18. Schnell, R.; Mennicken, M. Unified Assessment of Open and Ducted Propulsors. Aerospace 2024, 11, 1002. [Google Scholar] [CrossRef]
  19. Drela, M. Power Balance in Aerodynamic Flows. AIAA J. 2009, 47, 1761–1771. [Google Scholar] [CrossRef]
  20. Wald, Q.R. The aerodynamics of propellers. Prog. Aerosp. Sci. 2006, 42, 85–128. [Google Scholar] [CrossRef]
  21. Giannakakis, P.; Goulos, I.; Laskaridis, P.; Pilidis, P.; Kalfas, A.I. Novel Propeller Map Scaling Method. J. Propuls. Power 2016, 32, 1325–1332. [Google Scholar] [CrossRef]
  22. Schnoes, M.; Voß, C.; Nicke, E. Design optimization of a multi-stage axial compressor using throughflow and a database of optimal airfoils. J. Glob. Power Propuls. Soc. 2018, 2, 516–528. [Google Scholar] [CrossRef]
  23. Hall, K.C.; Thomas, J.P.; Clark, W.S. Computation of Unsteady Nonlinear Flows in Cascades Using a Harmonic Balance Technique. AIAA J. 2002, 40, 879–886. [Google Scholar] [CrossRef]
  24. Frey, C.; Ashcroft, G.; Kersken, H.; Voigt, C. A Harmonic Balance Technique for Multistage Turbomachinery Applications. In Proceedings of the ASME Turbo Expo 2014: Turbine Technical Conference and Exposition. Volume 2B: Turbomachinery, Düsseldorf, Germany, 16–20 June 2014. [Google Scholar]
  25. Junge, L.; Frey, C.; Ashcroft, G.; Kügeler, E. A New Harmonic Balance Approach Using Multidimensional Time. J. Eng. Gas Turbines Power 2021, 143, 081007. [Google Scholar] [CrossRef]
  26. Junge, L.; Frey, C.; Ashcroft, G.; Kügeler, E. Simulation of Indexing and Clocking with a New Multidimensional Time Harmonic Balance Approach. Int. J. Turbomach. Propuls. Power 2024, 9, 17. [Google Scholar] [CrossRef]
  27. Jang, J.S.; Choi, S.; Kwon, H.I.; Im, D.K.; Lee, D.J.; Kwon, J.H. A Preliminary Study of Open Rotor Design Using a Harmonic Balance Method. In Proceedings of the 50th AIAA Aerospace Sciences Meeting Including the New Horizons Forum and Aerospace Exposition, Nashvielle, TN, USA, 9–12 January 2012. [Google Scholar]
  28. Kwon, H.I.; Yi, S.G.; Choi, S.; Lee, D.J.; Kwon, J.H.; Im, D.K. Design of a Low-Noise Open Rotor Using an Implicit Harmonic Balance Method. In Proceedings of the 51th AIAA Aerospace Sciences Meeting Including the New Horizons Forum and Aerospace Exposition, Grapevine, TX, USA, 7–10 January 2013. [Google Scholar]
Figure 1. Propulsive efficiency and flight Mach number at different levels of fan pressure ratio (FPR).
Ijtpp 10 00028 g001
Figure 2. Open fan geometry and computational domain.
Ijtpp 10 00028 g002
Figure 3. Iso-thrust propulsive efficiency from Equation (2) with increasing pressure-based force contribution F dp in relation to the total net thrust F N .
Ijtpp 10 00028 g003
Figure 4. Outflow velocity u 9 with increasing pressure force contribution F dp in relation to the total net thrust F N .
Ijtpp 10 00028 g004
Figure 5. Propulsive efficiency dependence on power coefficient c p for different flight Mach numbers and advance ratios J. Solid lines denote ideal propeller efficiencies η prop , id as in [20,21], dashed lines are propulsive efficiencies according to Equation (2) at given c p , and reference conditions with zero swirl and no pressure terms (for more details, see [18]).
Ijtpp 10 00028 g005
Figure 6. Rotor overall efficiency η ov , rotor vs. power coefficient c p results from global RANS-based design optimisation. The blue dashed line denotes the ideal propulsive efficiency η prop , id in the corresponding c p regime, as shown in Figure 5. The darker symbols indicate higher overall efficiency, with an increment between white and black of 2%.
Ijtpp 10 00028 g006
Figure 7. Open fan overall efficiency η ov vs. axial force contribution from the OGV, darker symbols indicate higher overall rotor efficiency; force increment: 2 kN, efficiency increment: 2.5%. The blue dashed line denotes the linearized ideal propulsive efficiency as in Figure 6.
Ijtpp 10 00028 g007
Figure 8. Relative contribution to the total thrust of the (a) hub and (b) overall hub and blades for two designs, and a comparison between blades-on and blades-off simulations.
Ijtpp 10 00028 g008
Figure 9. Open fan efficiency over stability margin for different rotational speeds and OGV blade counts. The labels on each symbol refers to the percentage of RPM for the RPM study (solid line) and the additional OGV blades compared to the baseline for the OGV count study (dashed and dotted lines).
Ijtpp 10 00028 g009
Figure 10. Rotor overall pseudo-efficiency at TKOF over overall effective efficiency at MXCR from dual-point, high-fidelity optimisation; symbols colour-coded with rotor isentropic efficiency difference relative to a given baseline η is , rotor . Dashed line denotes the Pareto front.
Ijtpp 10 00028 g010
Figure 11. Normalised pressure field at TKOF conditions with streamlines and a plane presenting the turbulence kinetic energy generated due to the flow migration phenomenon at the suction side of the rotor blade.
Ijtpp 10 00028 g011
Figure 12. Normalised pressure field comparison between two designs with high (a,b) and low (c,d) axial sweep and tangential lean angles in the stator blade.
Ijtpp 10 00028 g012
Figure 13. Open fan characteristics: (a) total thrust (b); overall pseudo (solid lines) and overall effective (dashed lines) efficiencies for different rotor pitch settings and mission points, together with their thrust requirements (stars).
Ijtpp 10 00028 g013
Figure 14. Surface streamlines (lines with arrows) and normalised pressure contours of the blades with pink iso-surfaces of 0 axial velocity at design conditions. The boxes mark where there is detachment of the flow.
Ijtpp 10 00028 g014
Figure 15. Surface streamlines (lines with arrows) and normalised pressure contours with pink iso-surfaces of 0 u-velocity at off-design conditions for different pitch settings used to maximise stability by OGV pitch variations.
Ijtpp 10 00028 g015
Figure 16. Iso-surfaces of the instantaneous vorticity field with contours of the normalised pressure for three different levels of stator clipping. The boxes mark the area of rotor-stator interaction.
Ijtpp 10 00028 g016
Figure 17. Sound pressure level of the first harmonic for the pressure side of the stator blade at TKOF conditions for different levels of clipping.
Ijtpp 10 00028 g017
Figure 18. Normalised real part of the pressure perturbation in both relative systems (first harmonic, take-off conditions) at the acoustic analysis plane at 5 m for different levels of clipping. A marks the rotor zone and B the stator zone.
Ijtpp 10 00028 g018
Figure 19. Pressure amplitude for modes ± 4 obtained by the circumferential Fourier decomposition along lines constant in the x direction for an analysis plane at 5 m. Grey dashed line indicates position of rotor–stator interface. The blades (in grey) and hubline geometry has been included at the bottom of the plot for reference.
Ijtpp 10 00028 g019
Figure 20. Open fan under 15 angle-of-attack condition at take-off: relative flow angles at constant radius near rotor tip.
Ijtpp 10 00028 g020
Figure 21. Open fan under 10 angle-of-attack condition at take-off: instantaneous streamlines (lines with arrows), velocity field contours, and blade pressures (left); and instantaneous surface pressure perturbation and velocity disturbance at rotor exit (right).
Ijtpp 10 00028 g021
Disclaimer/Publisher’s Note: The statements, opinions and data contained in all publications are solely those of the individual author(s) and contributor(s) and not of MDPI and/or the editor(s). MDPI and/or the editor(s) disclaim responsibility for any injury to people or property resulting from any ideas, methods, instructions or products referred to in the content.