Article

Reducing Gas Accumulation in Horizontal Diffusers Under Two-Phase Flow Using Upstream Cross-Flow Steps †

1
Mechanical Power Engineering Department, Faculty of Engineering-Mataria, Helwan University, Cairo 11718, Egypt
2
Laboratory of Fluid Dynamics & Technical Flows, University of Magdeburg “Otto Von Guericke”, 39106 Magdeburg, Germany
3
Department of Engineering, University of Ferrara, Via Saragat 1, 44122 Ferrara, Italy
*
Author to whom correspondence should be addressed.
This paper is an extended version of our paper published in 16th European Turbomachinery Conference (ETC16) Turbomachinery, Fluid Dynamics and Thermodynamics, Hannover, Germany, 24–28 March 2025.
Int. J. Turbomach. Propuls. Power 2025, 10(3), 20; https://doi.org/10.3390/ijtpp10030020
Submission received: 30 April 2025 / Revised: 22 July 2025 / Accepted: 23 July 2025 / Published: 7 August 2025

Abstract

In gas–liquid two-phase flows, diverging channels such as diffusers often develop low-pressure separation zones where gas can accumulate, hindering pressure recovery and reducing system performance. This issue is particularly critical in centrifugal pumps, where it leads to efficiency losses. Unlike pumps, diffusers without rotating components allow for more precise experimental studies. This research investigates a passive control method using upstream cross-flow steps to reduce gas accumulation in a horizontal diverging channel. Thin metallic sheets with toothed geometries of 2 mm, 5 mm, and 8 mm heights were installed upstream to interact with the flow. These features aim to enhance turbulence, break up larger gas pockets, and promote vertical bubble dispersion, all while minimizing additional flow separation. The diffuser was intentionally designed with an expanding angle to encourage flow separation and gas accumulation. The experiments covered various two-phase flow conditions (liquid Reynolds number 59,530–78,330; gas Reynolds number 3–9.25), and high-speed imaging captured detailed phase interactions. The results show that the steps significantly reduce gas accumulation, especially at higher water flow rates. These findings support the development of more accurate computational models and offer insights for optimizing centrifugal pump designs by minimizing gas buildup in separated flow regions.

1. Introduction

Gas–liquid two-phase flows are prevalent in various engineering and energy applications [1,2,3,4]. These flows present significant challenges due to their complex dynamics and unsteady interactions, even at low gas contents. Diffusers, with their variable cross-sectional areas, further complicate these flows by introducing flow separation and potential gas accumulation within the diverging section. This hinders pressure recovery. Such gas accumulations are similar to those found in centrifugal pump impeller channels under two-phase conditions, leading to flow instabilities and significantly reduced performance [5,6,7,8,9,10,11]. Numerical simulations of these complex flows often struggle to accurately capture the intricate turbulent interactions between the two phases at high flow rates [12,13,14,15]. Therefore, further experimental characterization is crucial.
This study is conducted within the framework of existing turbomachinery research, focusing on the critical impact of gas accumulation within diverging impeller channels on centrifugal pump performance. While these pumps function reliably with pure liquids, their efficiency significantly decreases when handling two-phase mixtures. As gas content increases, rapid accumulation, flow instabilities, and even pump “breakdown” can occur [4,8,16,17,18,19,20]. Therefore, reducing or preventing gas accumulation is a primary objective in research focused on improving two-phase pump performance [21].
Previous studies on two-phase flows have primarily focused on horizontal rectangular flow channels with constant cross sections [22,23,24,25] or sudden changes in cross section [2,26,27,28,29]. However, gradual diverging channels have been less explored, especially for two-phase flows. The pressure recovery of a gas–liquid flow was studied in a vertical circular diffuser [30]. The two-phase pressure drop was also studied in a micro-scale horizontal, converging, or diverging rectangular channel [31]. It was found that the speed of the gas slowed down in the diverging section, causing the gas bubbles to merge, which strongly affected the flow behavior. Nonetheless, the majority of previous studies employed constant included angles (flat or non-curved diffuser) for the diverging sections [29,30,31,32,33,34,35,36,37], where large flow separation and the development of big gas accumulations are less likely observed.
In previous research [13], we investigated two-phase flows in a horizontal, diverging channel with a gradually increasing included angle. We observed key parameters leading to gas accumulation and phase segregation. Large recirculation zones resulting from flow separation trapped bubbles, causing significant accumulations. Increasing the air Reynolds number monotonically increased accumulation size. However, increasing the water Reynolds number initially expanded accumulation size due to larger recirculation zones but then decreased it due to strong turbulence fluctuations. Surprisingly, even at low gas contents (0.05% by volume), a large air pocket formed near the end of the diverging section, impacting velocity distribution and reducing pressure recovery. Our findings identified factors contributing to decreasing gas accumulation, such as reducing flow separation or increasing turbulence [13].
Previous research [14,38,39] has also compared experimental data from [13] with various numerical models to improve prediction accuracy. The Reynolds stress model (RSM) combined with the volume of fluid (VOF) method showed promising results in predicting gas accumulation size and shape [14]. However, numerical errors increased at high Reynolds numbers. The disperse two-fluid approach and turbulence modeling struggled to detect gas accumulation in some cases [38]. The most accurate predictions were achieved using a hybrid multiphase approach combining Eulerian–Eulerian solvers, VOF enhancements, and large eddy simulations (LESs) [39]. This approach effectively captured flow characteristics and predicted gas accumulation size and position. However, its accuracy depended on the specified bubble size, highlighting the need for further development of computational methods, including bubble size distribution. The limitations of numerical studies in predicting gas accumulation in diverging channels emphasize the continued importance of experimental investigations.
Accordingly, to minimize gas accumulation in two-phase flows within diverging channels, this study employs upstream cross-flow millimeter-size steps made of thin metal sheets. These steps should ideally reduce the gas accumulation by (1) enhancing turbulence, (2) breaking larger bubbles into finer ones, and (3) promoting vertical bubble dispersion while (4) minimizing additional flow separation on the upper diffuser side. These flow mechanisms, i.e., turbulence enhancement, bubble size reduction, vertical redistribution, and flow separation control, are integral to achieving the intended reduction of gas accumulation. Three toothed metal sheets with varying tooth heights (2 mm, 5 mm, 8 mm) were investigated. The same experimental setup and diffuser geometry used in previous research [13,14,38,39,40] were utilized. To ensure flow separation, the diffuser was designed with an increasing included angle. A wide range of two-phase flow conditions (ReL = 59,530–78,330, ReG = 3–9.25) were considered, with two-phase interactions recorded using high-speed cameras. Results show a clear reduction in gas accumulations for some flow conditions. This research provides a validation database for predictive models, enabling improved accuracy in numerical simulations for two-phase flows. Unlike pumps, the simplified diffuser configuration used in this study ensures a more accurate and detailed experimental characterization, which facilitates the validation and refinement of existing models. Furthermore, the findings will contribute to design guidelines for optimizing centrifugal pumps by offering insights into minimizing gas accumulation within the impeller channels.

2. Experimental Setup

A sketch of the experimental setup is shown in Figure 1. To allow for clear observation of the flow and optical measurements, the test section of the diverging part was manufactured from transparent acrylic glass. As shown, a submersible pump circulates water from a 6.0 m 3 water tank through the test section. Air from a compressed air supply is mixed with the water flow at a mixing point before entering the channel. The air flow is inserted into the mixing joint through 21 tiny holes, each 1.0 mm in diameter, which are arranged around the circumference of the mixing joint. The flow rates of water and air are independently measured and regulated using control valves. The water flow is measured with an electromagnetic flow meter (Endress+Hauser Promag 30 F with an accuracy of ±0.5% RD), while air flow is controlled by a rotameter (Yokogawa RGC1263 with ±2.5% RD accuracy). The temperatures of both water and air are measured separately before being mixed, using two RTD (Resistance Temperature Detector) temperature sensors (Pt100 Sensor Probe, Class B with a maximum absolute error of ±0.3 K). For accurate control of the air flow, the air supply includes a service unit, a control valve, a pressure regulator, and a restriction valve. As shown in Figure 1, the pressure changes along the diverging section are monitored by eight pressure sensors (Cerabar T PMC131 (−1:+1) bar) with ±0.5% RD accuracy). The average uncertainty associated with the reported pressure measurements is estimated to be approximately 2.9%. Further information about the measurement devices and their accuracy can be found in [13].
The channel has upstream and downstream rectangular cross-sections of 40 × 44 mm and 100 × 44 mm , respectively. This results in a hydraulic diameter ratio of 1.45, where the upstream and downstream hydraulic diameters are d h u = 42 mm and d h d = 61 mm , respectively. The upstream channel has enough length before the diffuser to establish fully developed flow conditions. The lengths of the straight upstream and downstream parts are L 1 = 34 d h u and L 2 = 15.5 d h u , respectively. The diffuser is designed with a gradually increasing included angle along the flow direction. In this way, the flow separates within wide flow conditions, forming large recirculation zones, and, consequently, air accumulation. Explicitly, the diffuser begins with a half-included angle of 6, whose upper curve is described by the function x = 13.5 y y 2 / 10 230 (x: axial direction, y: vertical direction). Accordingly, the half-included angle increases gradually to 16. The flow channel is positioned horizontally because, in this configuration, the gravitational force acts perpendicular to the flow direction. This setup, while not identical to the Coriolis force in pumps, provides a degree of similarity in terms of lateral force interactions, which would not be achievable in a vertical channel where gravity acts parallel to the flow direction. Moreover, the horizontal orientation effectively replicates gas accumulation phenomena analogous to those observed in impeller channels. This approach allows for a meaningful exploration of gas accumulation reduction techniques, which can be later applied in centrifugal pumps.
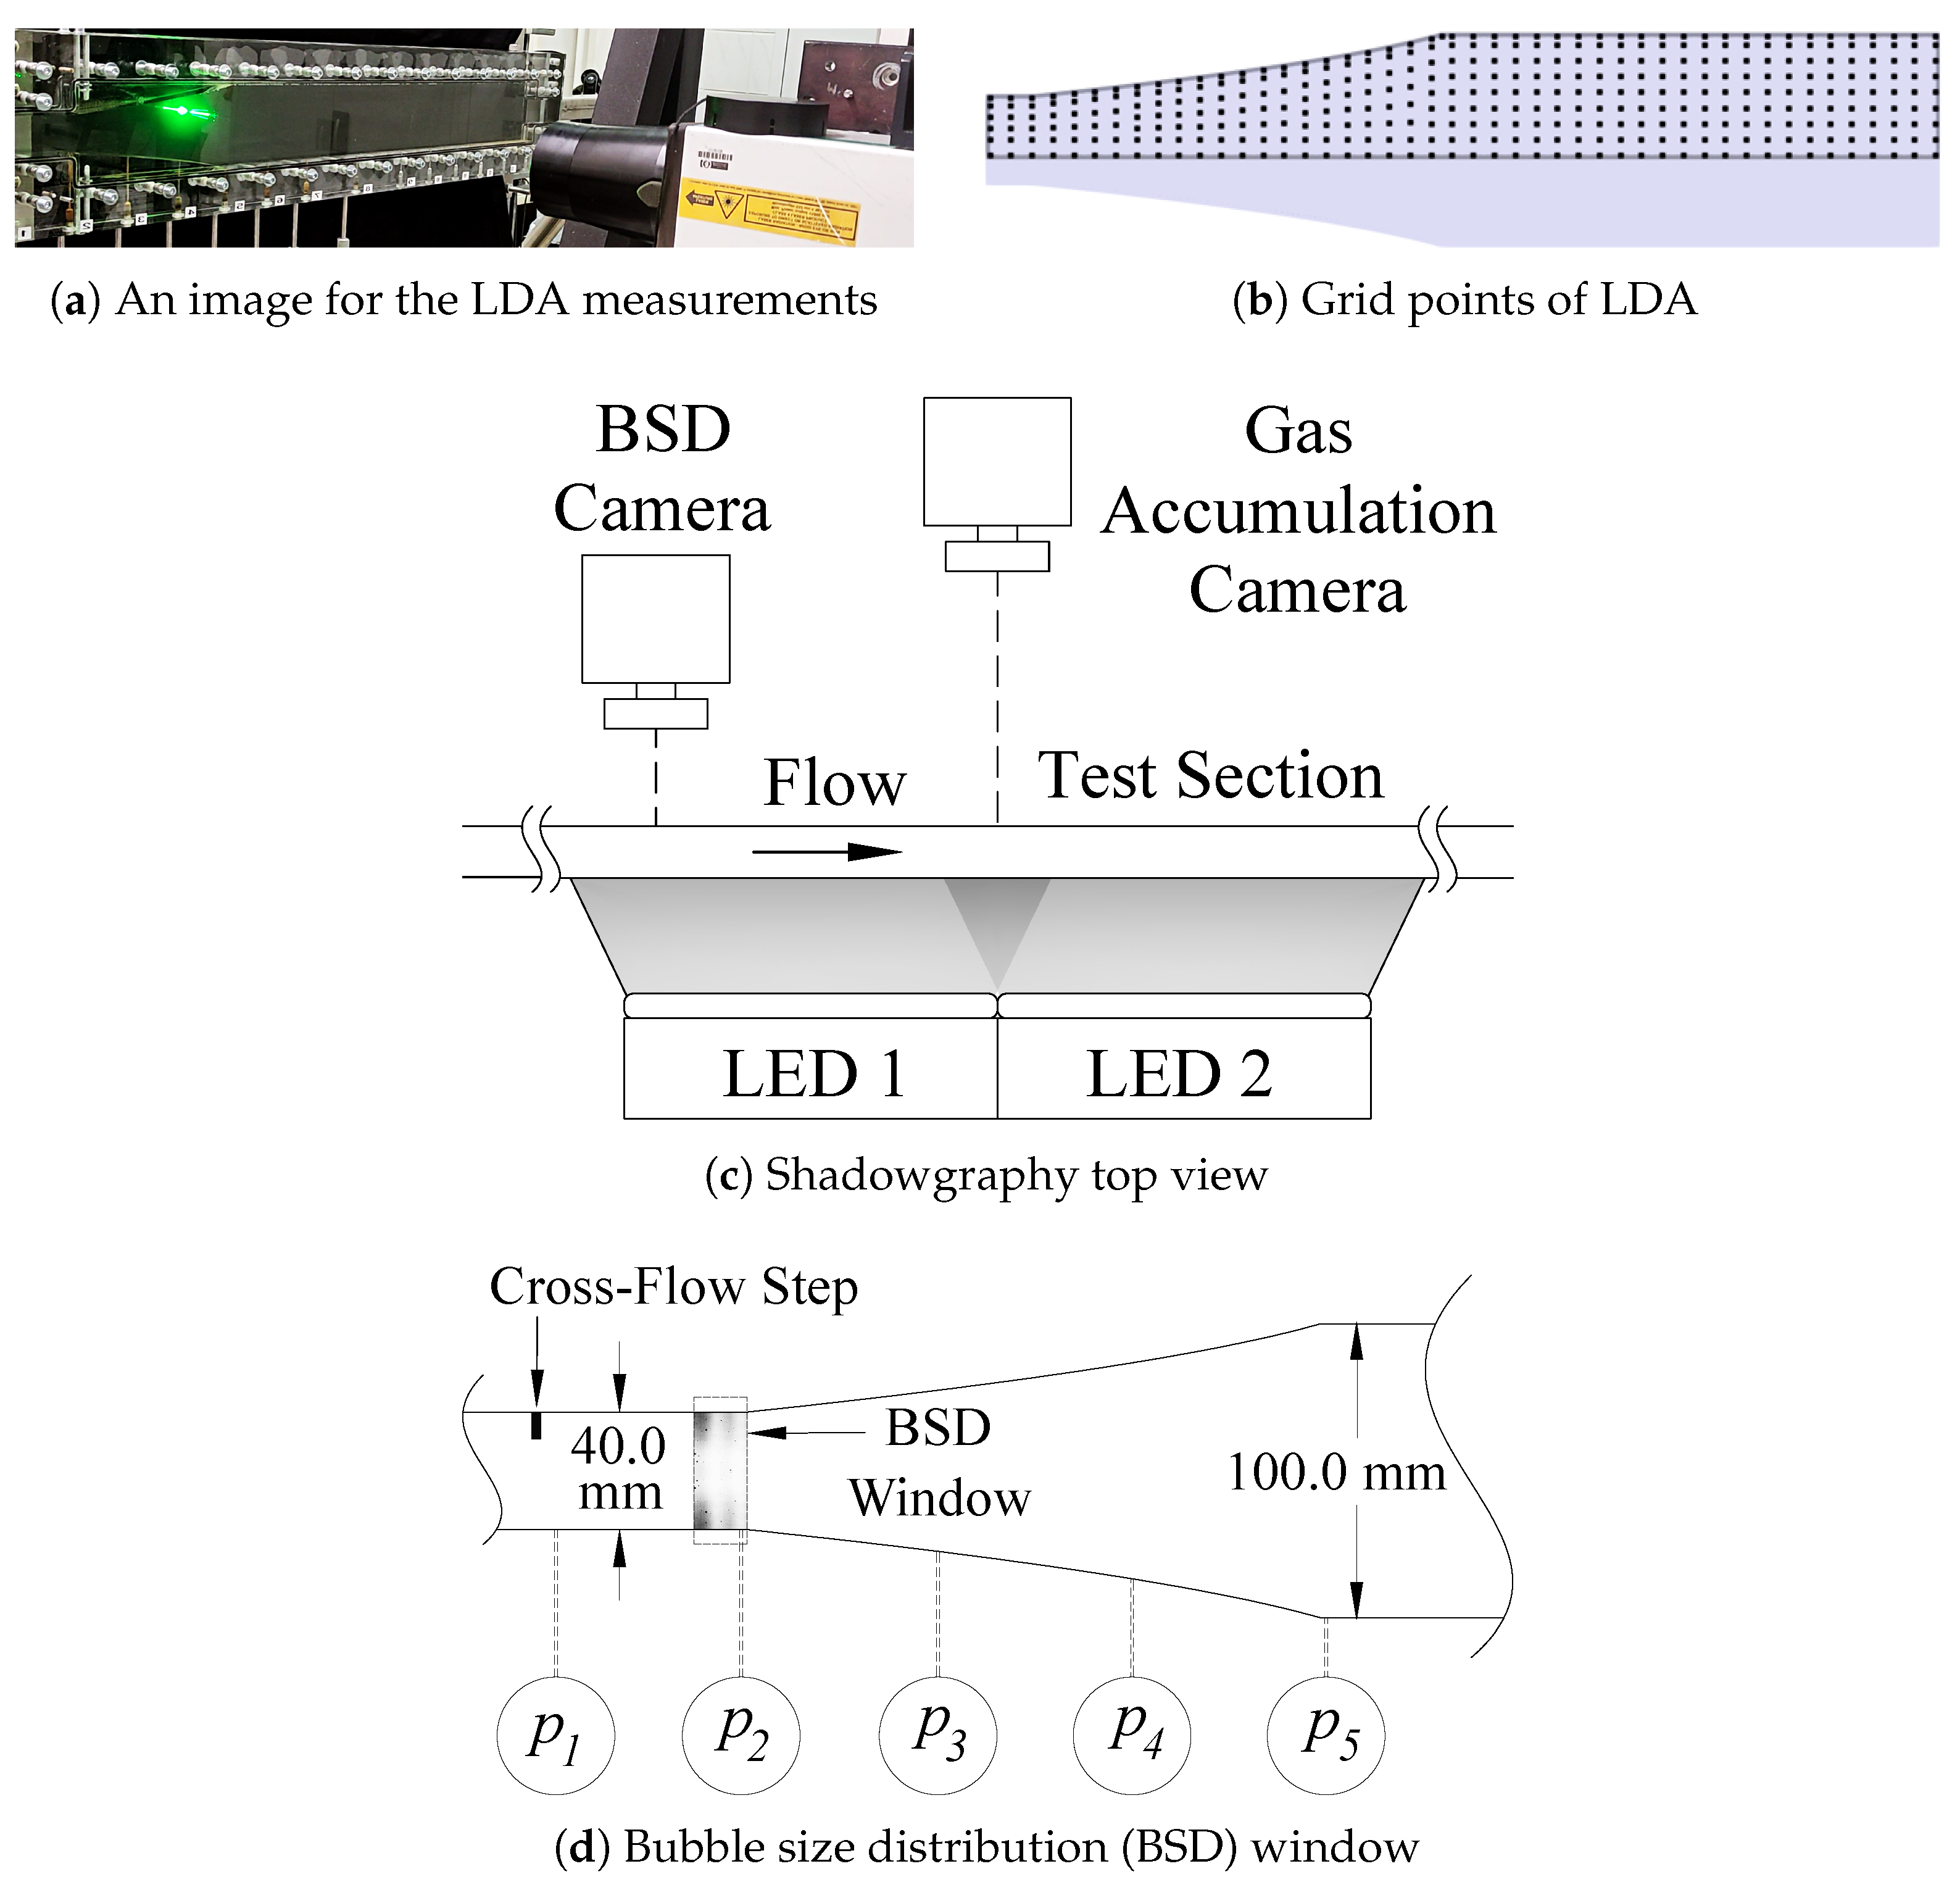
The single-phase flow (pure water) velocities were recorded for the top part of the diffuser using a two-component Laser Doppler Anemometry (LDA) system (Dantec Dynamics 2-D; see Figure 2a). The total estimated uncertainty in the velocity measurements is quantified to be less than 0.5%. Utilizing an automatic traversing system, the velocity was measured for a grid of 325 measurement points at the mid-longitudinal section of the channel, as shown in Figure 2b, and then the velocity field was deduced. The horizontal and vertical grid spaces are x = 10 mm and y = 7.5 mm. At each measurement point, a total of 25,000 samples were collected to ensure high statistical reliability. The average data acquisition rate was about 1.5 kHz. The precise location of each measurement point was determined through calibration, accounting for the refraction of laser beams as they passed through the acrylic glass and water. Further details about the LDA system and the calibration based on the refraction indices can be found in [41]. Glass spheres with a mean diameter of 10 μ m and a density of 1000 kg / m 3 were employed as tracer particles for LDA measurements. To record the size of the accumulated gas, shadowgraphy images were captured using a high-speed camera. The test section was illuminated from behind by two LED (Light Emitting Diode) panels (facing the cameras), as depicted in Figure 2c. This arrangement produced dark outlines of the water–air interface, allowing for clear visualization of accumulated gas. Similarly, the bubble size distributions (BSDs) were recorded within a sample window (length = 25 mm and height = 40 mm) just before the beginning of the diffuser using another high-speed camera, as shown in Figure 2d. The calculated uncertainty of the measured bubble diameters yielded a root mean square value of less than 4.9%. The BSD measurement is substantial for validating numerical models since it can strongly affect the prediction accuracy [39].
Three different toothed cross-flow steps with varying teeth heights of 2 mm, 5 mm, and 8 mm were studied, as shown in Figure 3. These metal sheets had a thickness of 0.5 mm and were always installed at a distance of 1.8 d h u before the diverging part with the teeth on the top side of the channel, as presented in Figure 3a. The reference cross-sectional area of the channel without steps (0 mm) is shown in Figure 3b, while the other subfigures show the dimensions of the three cross-flow steps. Here, only the tooth height was modified; all other dimensions remained constant.

3. Results

Based on the results of the previous investigations [13,14,38,39,41], different flow conditions were selected for the present research. Two different single-phase flow conditions of water ( Q L ) were considered. Further, two different air flow rates ( Q G ) were chosen, resulting in a total of four different two-phase cases. Accordingly, different sizes and shapes of gas accumulations were covered to investigate the effects of cross-flow steps in detail. Table 1 lists the considered flow conditions. The superficial Reynolds numbers of water ( Re L ) and air ( Re G ) are calculated by Equation (1). The superficial Reynolds number is a dimensionless parameter that characterizes the flow behavior of each phase as if it were flowing alone through the entire cross-sectional area of the channel. In Equation (1), ρ is the density; u is the superficial velocity in the inlet channel, calculated by Equation (2); μ is the dynamic viscosity; the subscripts L and G refer to water and air, respectively; A u is the upstream cross-sectional area of the channel; and ε ˙ is the gas volume fraction, determined by Equation (3). Please note that the setup was designed to operate under non-cavitating flow conditions to eliminate the potential confusion between vapor and air bubbles. To confirm cavitation-free conditions, the minimum cavitation number was calculated ( σ = 18.5 ) and found to be significantly higher than the critical value ( σ c r i t = 0.3 ), even under the maximum velocity, considering the flow fluctuations and the largest tooth height. Accordingly, no cavitation phenomena were observed during the entire experiments.
Re L , G = ρ L , G u L , G d h u μ L , G
u L , G = Q L , G A u
ε ˙ = Q G Q G + Q L

3.1. Measurements of Single-Phase Velocities

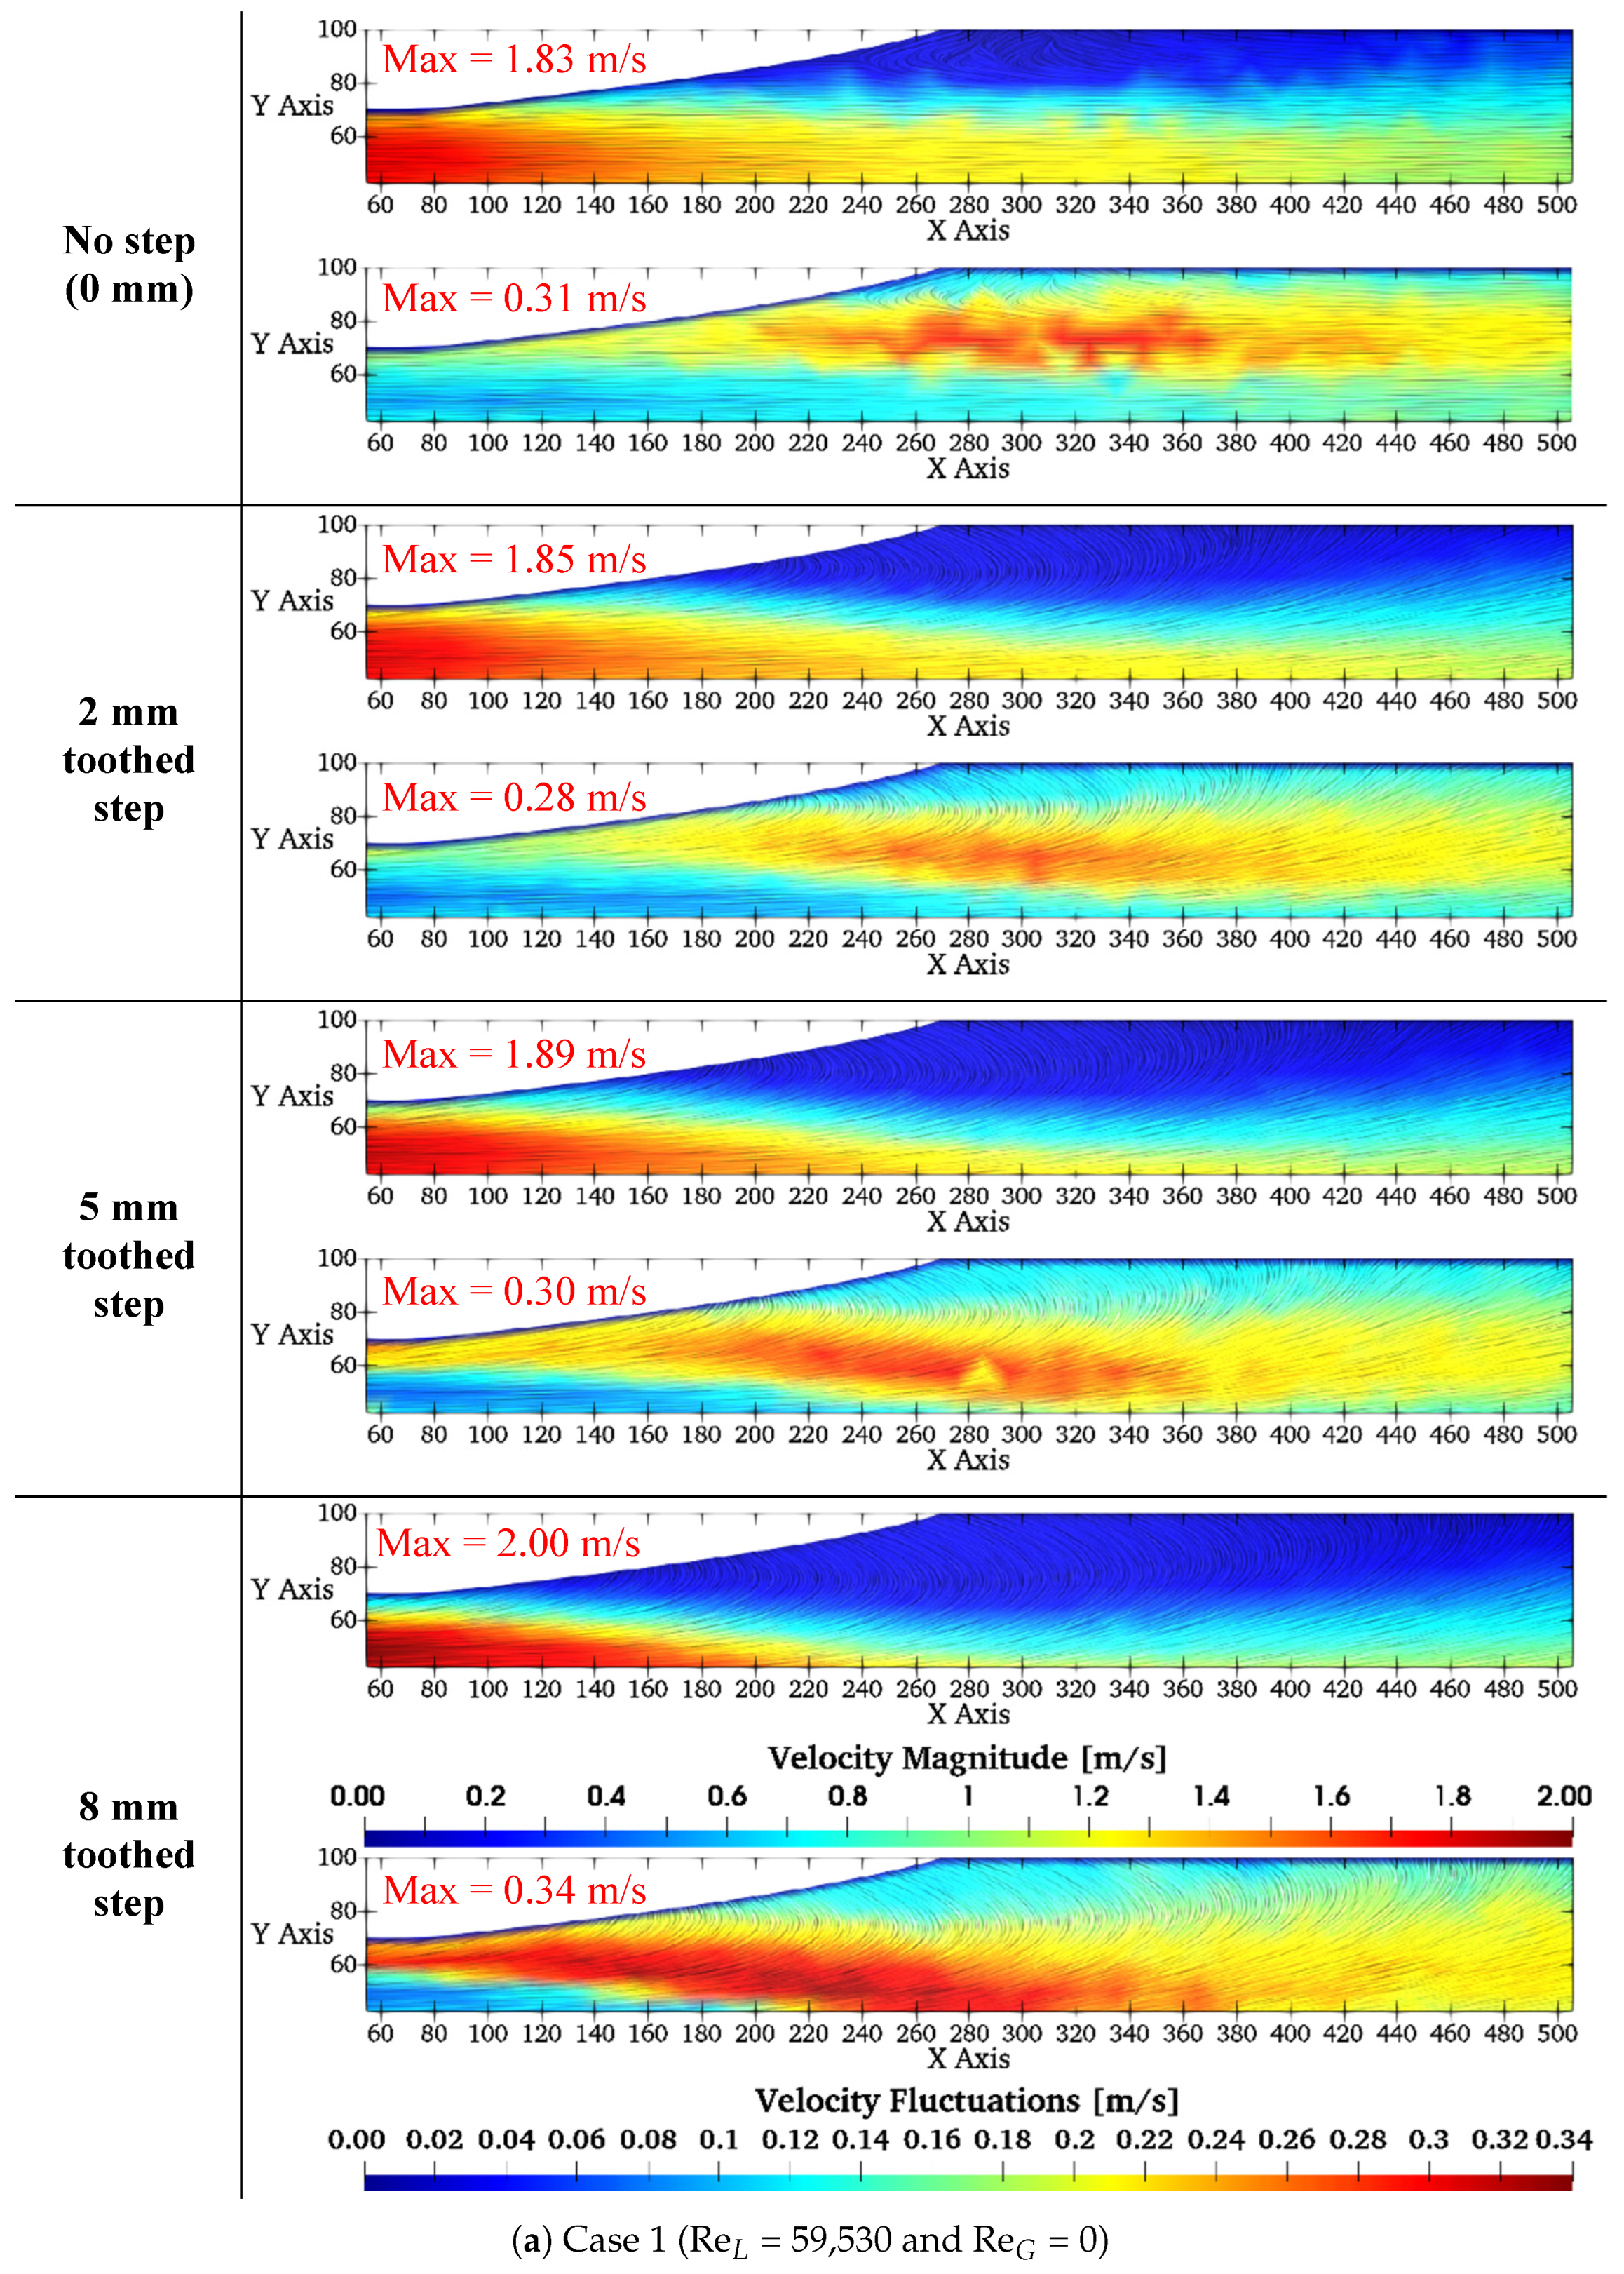
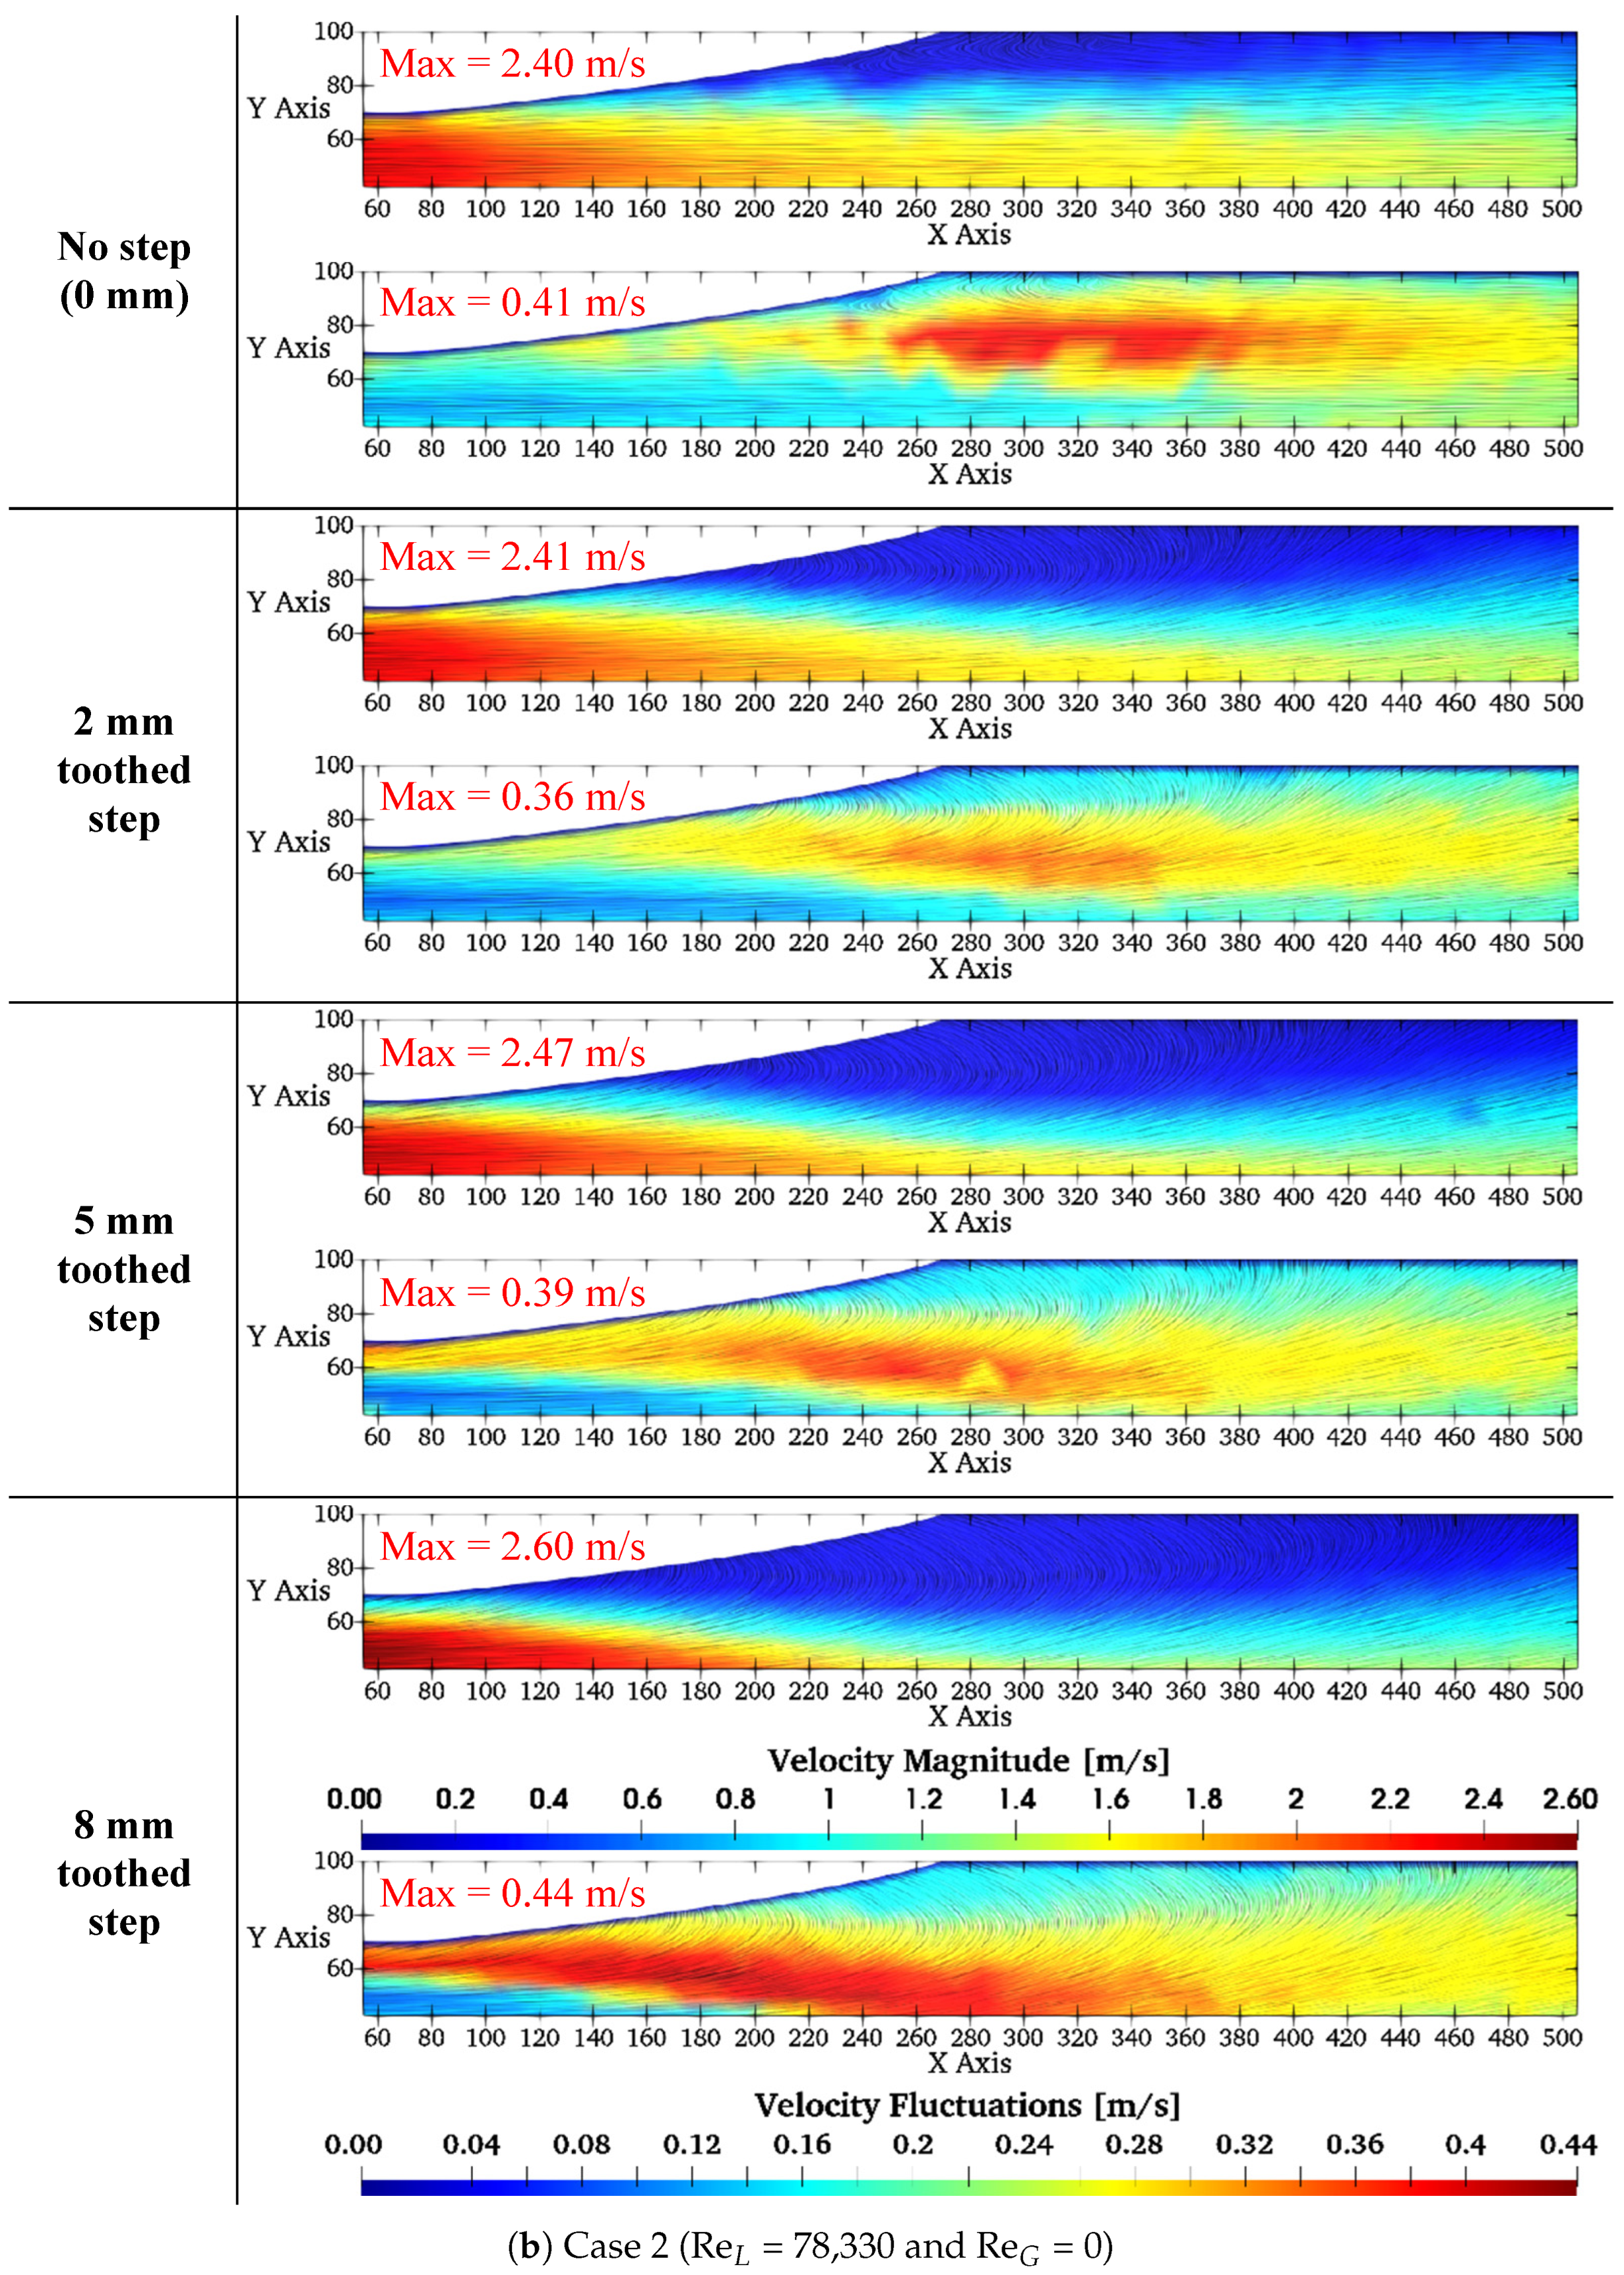
Although the flow in the channel was inherently three-dimensional [14], the velocity measurements were primarily conducted at the midsection. This region effectively captures key phenomena, including jet direction, flow separation, and turbulence intensity, all of which influence gas accumulation behavior under two-phase conditions. The data obtained at the midsection are sufficient for assessing the flow structure and enable meaningful comparisons between the various cases studied. Figure 4 shows the measured single-phase velocity magnitude and the velocity fluctuations for all considered configurations. As shown, a flow separation occurs on the upper part of the diffuser in all cases. In the reference case (without steps), the flow separation is slightly smaller compared with the cases with cross-flow steps. Additionally, it becomes undesirably larger as the teeth height increases for both flow rates. Further, the maximum values of velocity fluctuations of the 2 mm teeth decrease when compared with those of the reference case. However, for the 5 mm and 8 mm teeth, much higher velocity fluctuations are observed on the upper surface of the diffuser. The maximum values of velocity fluctuations of the 8 mm teeth exceed those of the reference case. These two effects would be useful to reduce the gas accumulation under two-phase conditions.

3.2. Measurements of Two-Phase Flow Conditions (Bubble Dispersion and Size Distributions)

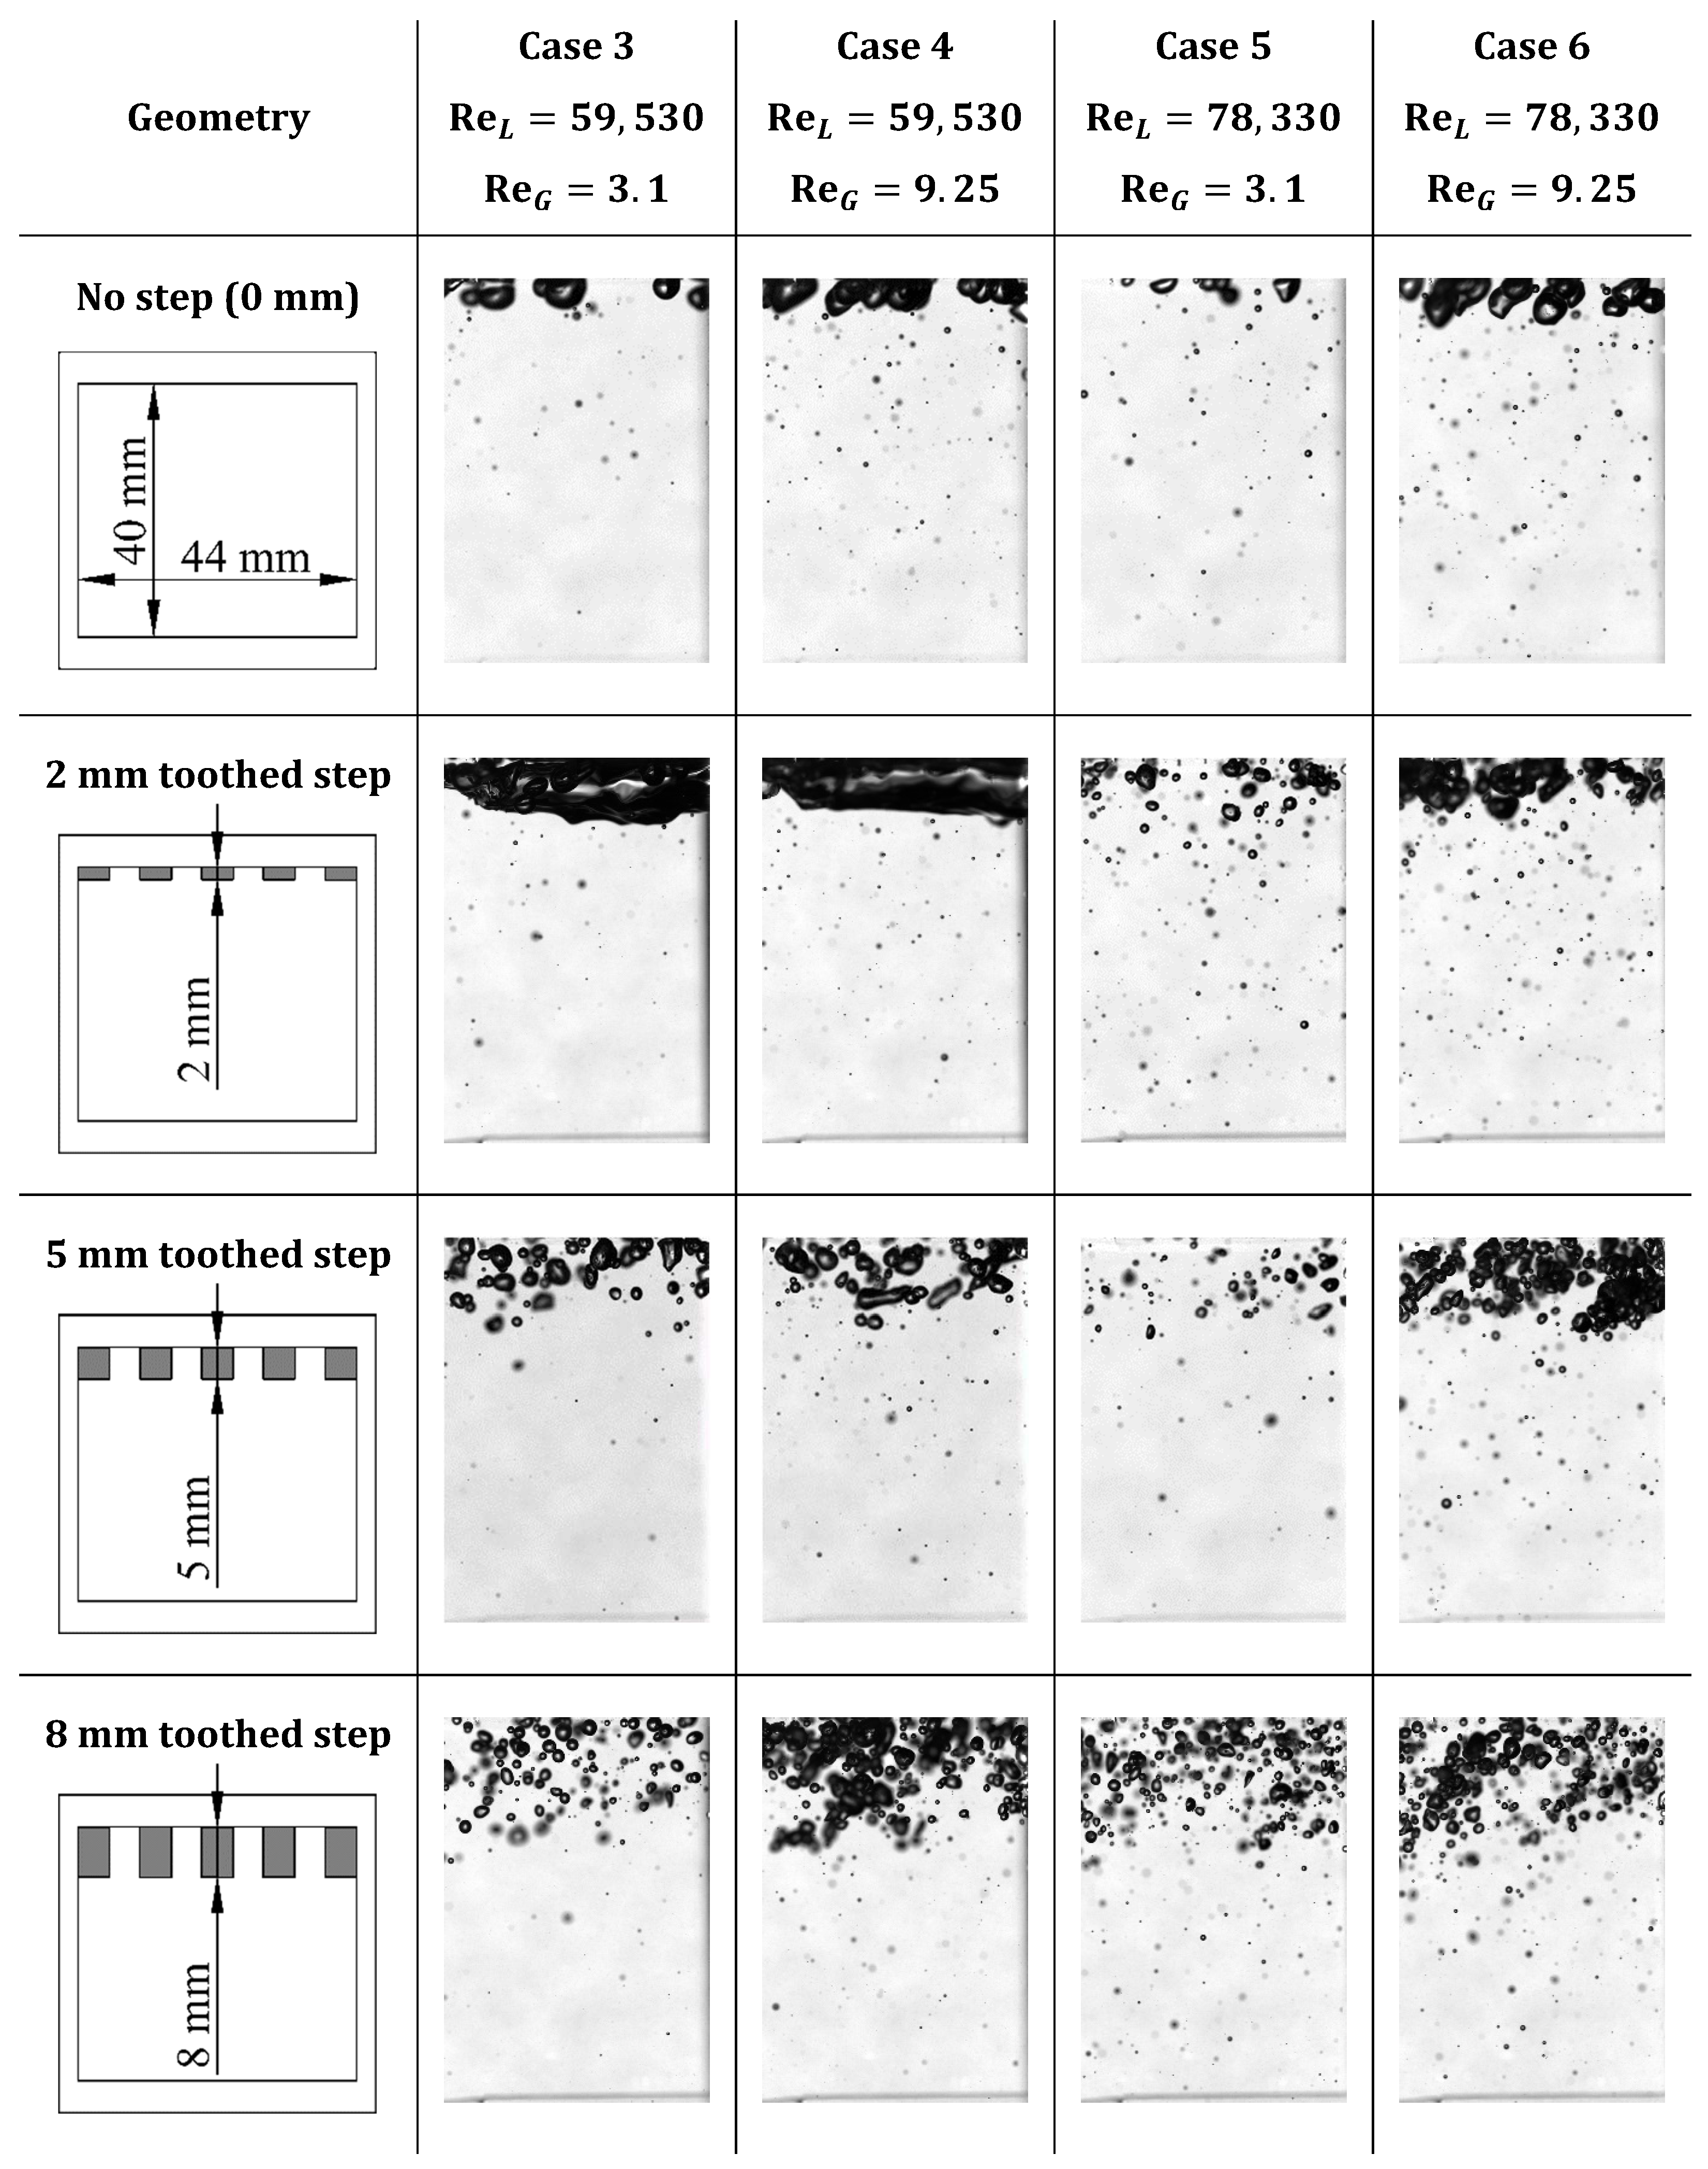
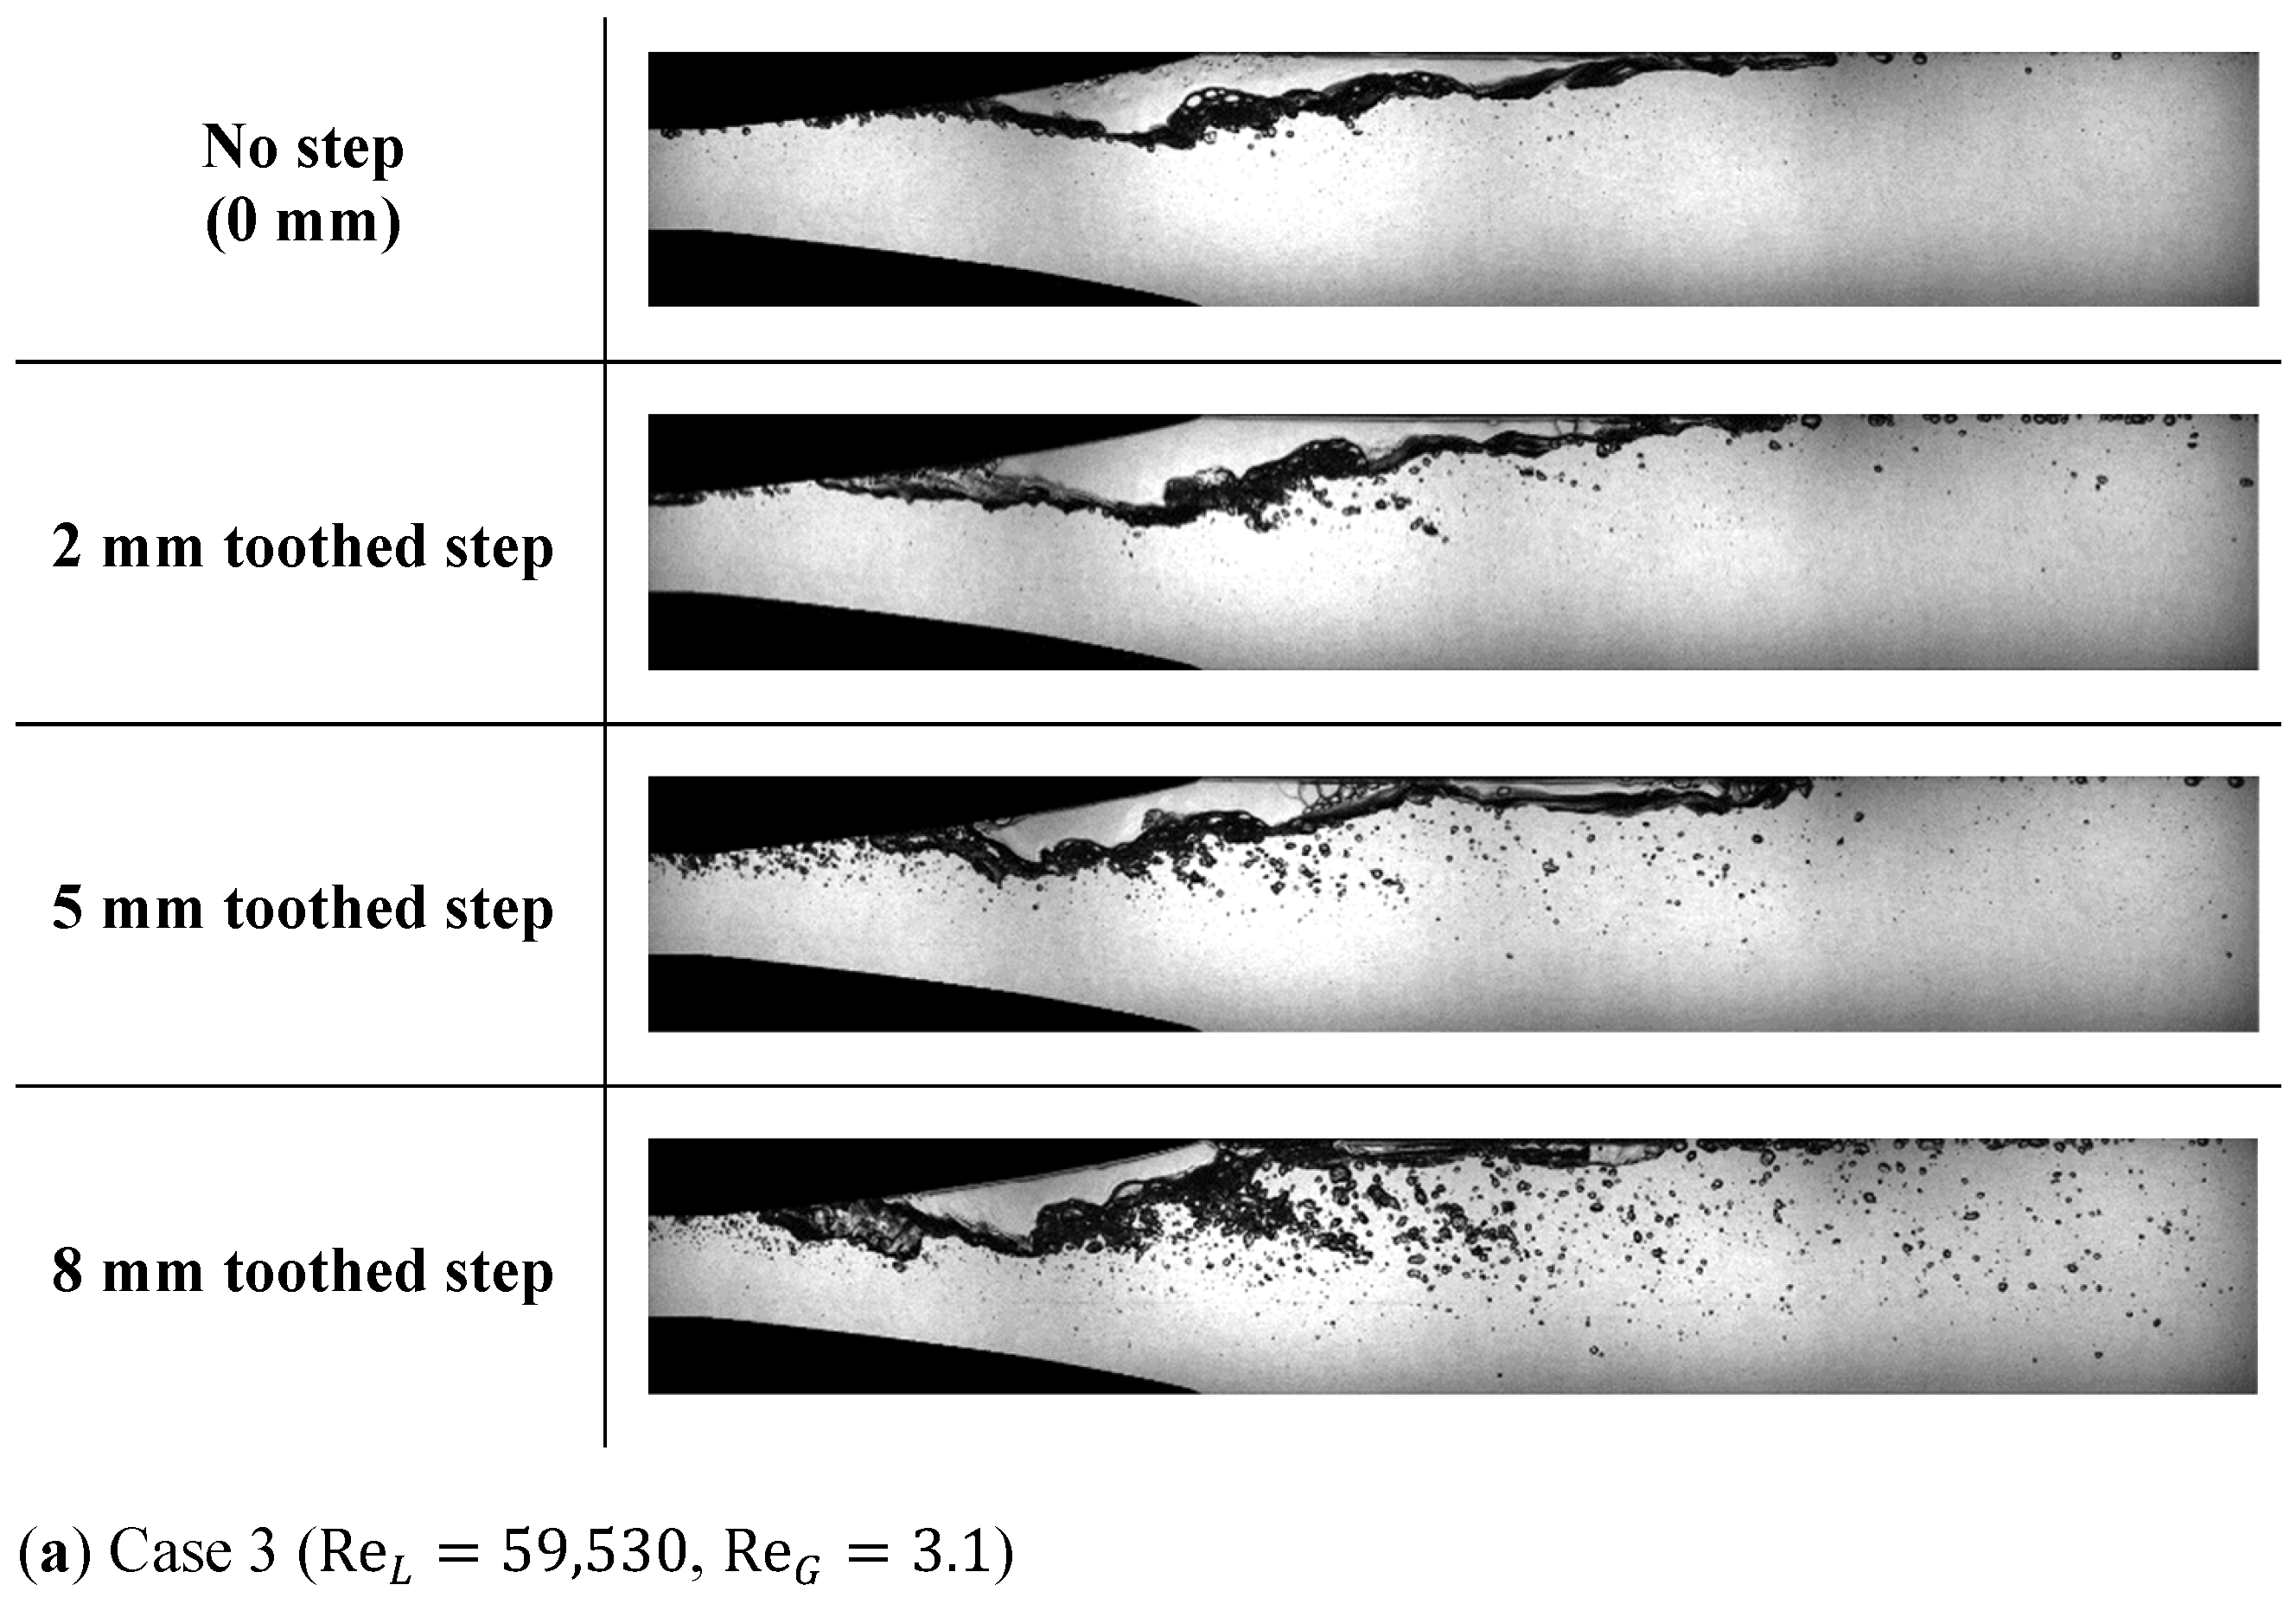
The bubble dispersion and size distributions at the inlet were measured and compared. As shown in Figure 5 for the reference case, large bubbles (typically bigger than 2 mm) are present on the top surface for all four two-phase conditions (Cases 3 to 6). Bubbles are notably larger in Case 4 with low water and high air flow. For the 2 mm teeth, a stratified flow develops at low flow (Cases 3 and 4) behind the step, where the teeth are too short to disturb the bubbles. The step merely slows down these big bubbles, leading to bubble coalescence and increased gas accumulation. However, this does not occur at higher water flow rates (Cases 5 and 6), where bubble dispersion improves slightly. For the 5 mm toothed step, bubble dispersion is observed across all flow conditions, with further improvement in the vertical direction for the 8 mm step, where finer bubbles are also seen. Crushing larger bubbles into finer ones and pushing them toward the channel center typically reduces accumulated gas in the separation zone at the top of the diverging part.
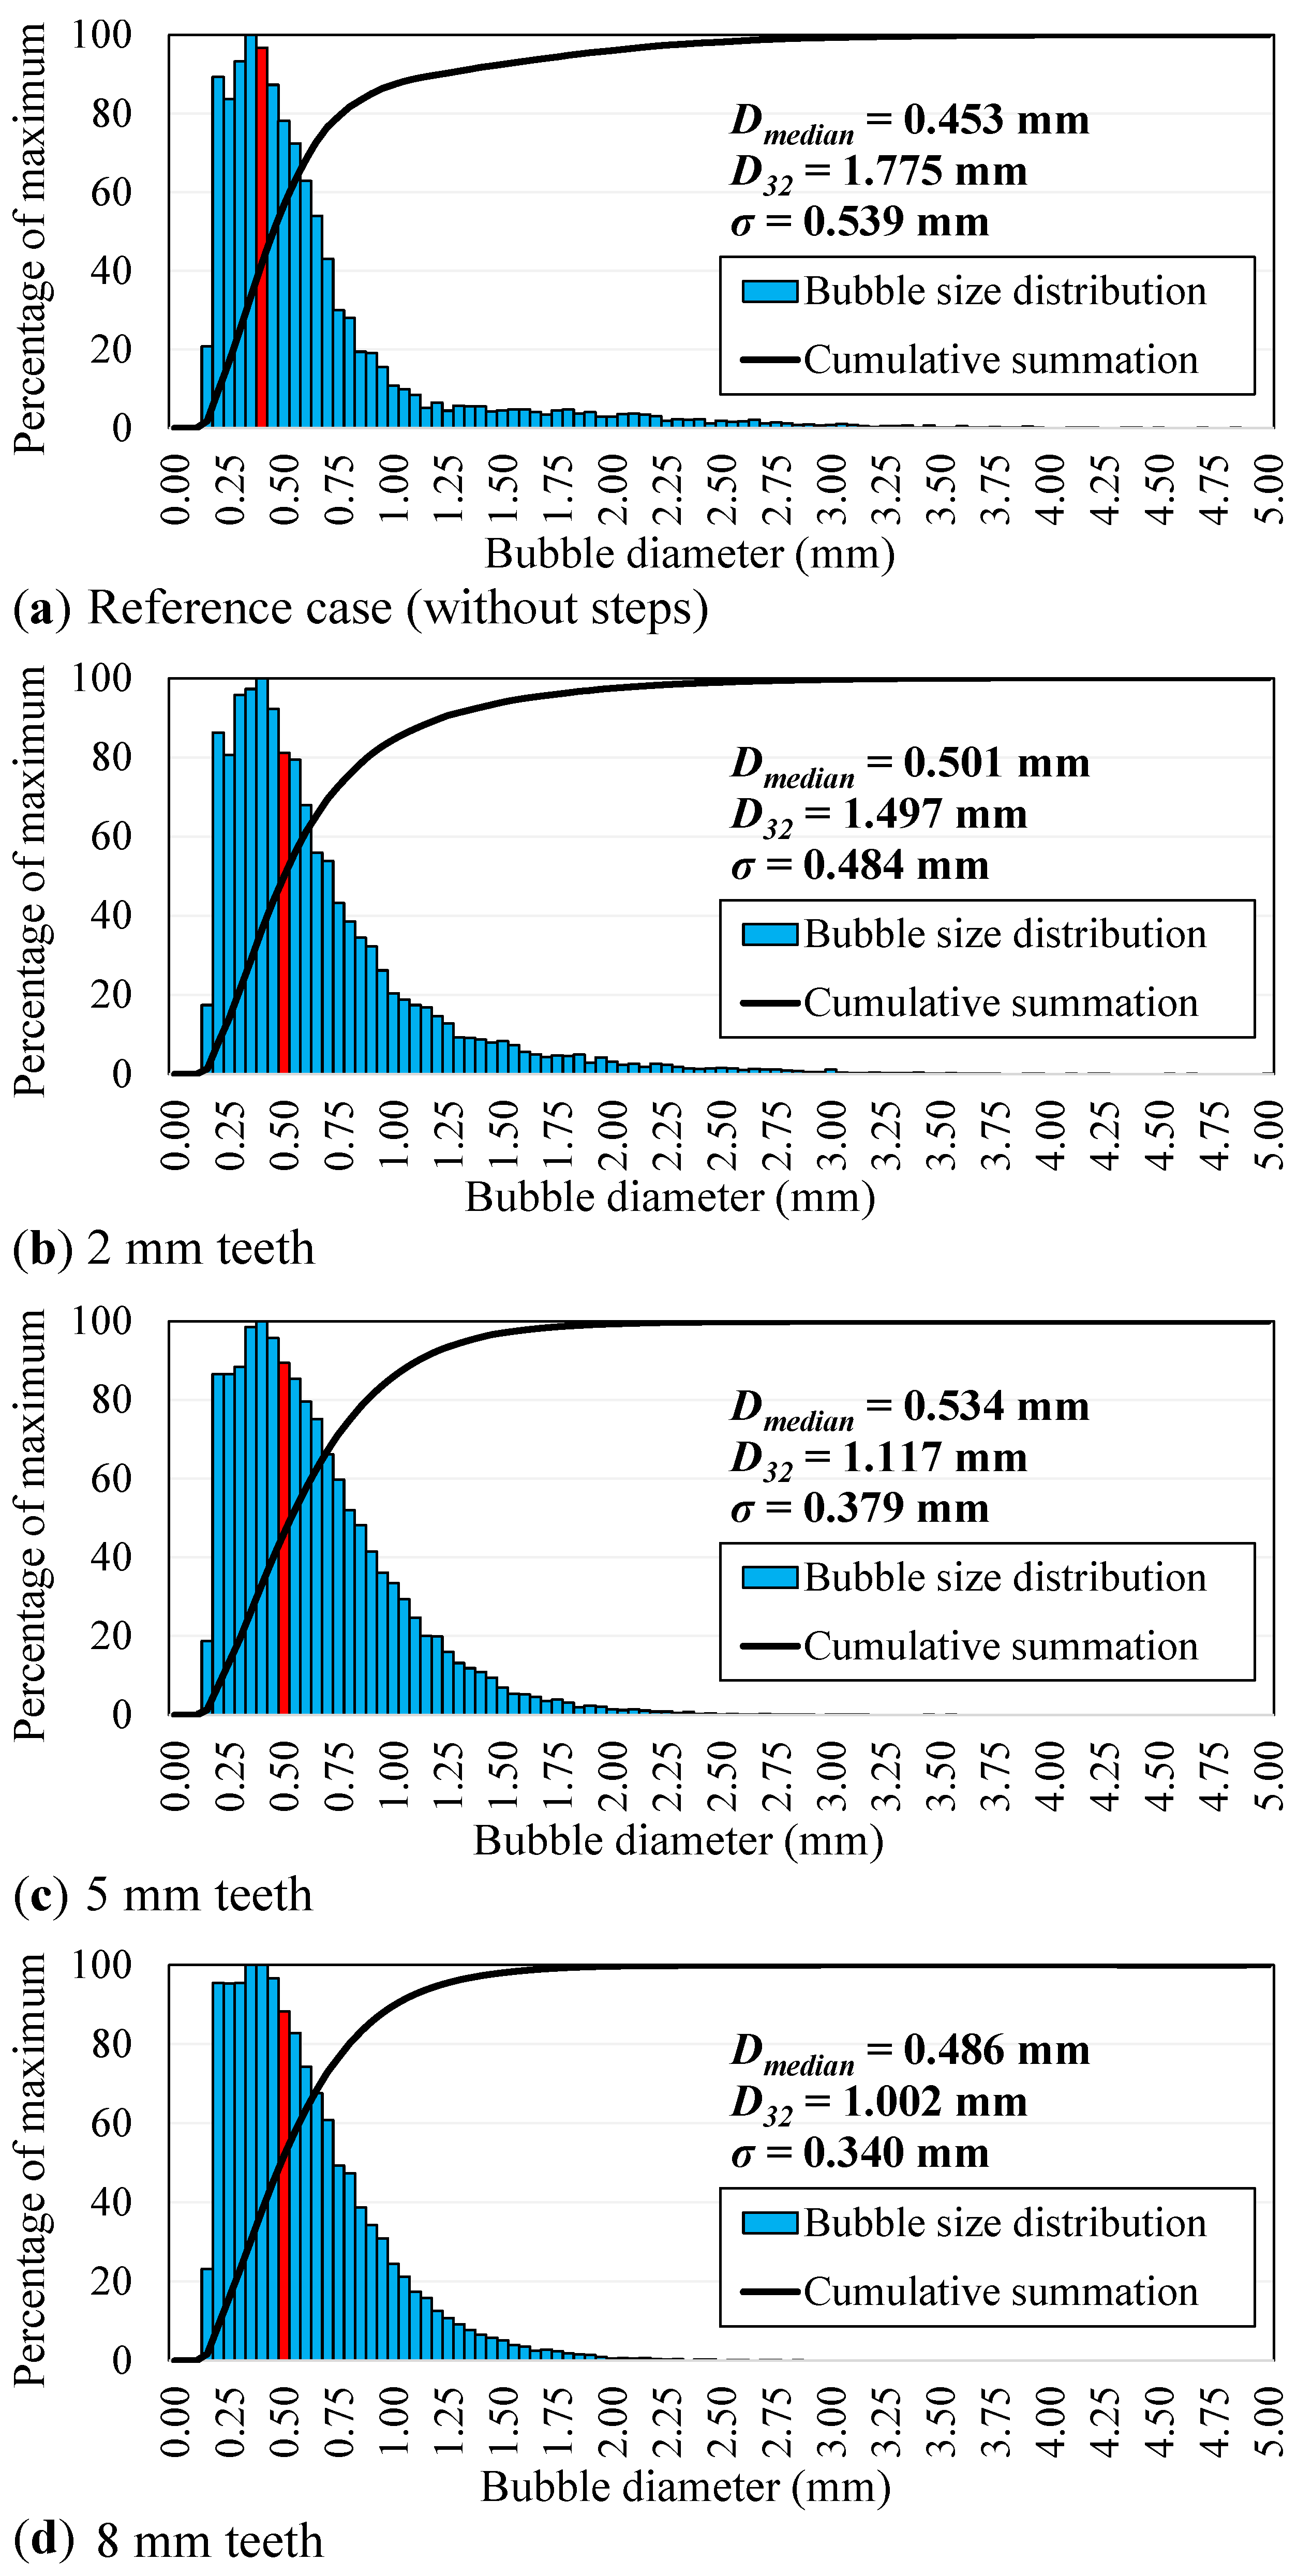
Figure 6 shows the measured BSD for different geometries in a sample two-phase flow (Case 5). The median diameter ( D m e d i a n ), the Sauter mean diameter D 32 , and the standard deviation ( σ ) of each distribution are also shown. Here, the median diameter is the size at which half of the bubbles in a distribution are larger and half are smaller. The Sauter mean diameter is the ratio of the total volume to the total surface area of the bubbles, representing a measure of the average bubble size. The median diameter ( D m e d i a n ) across all cases is around 0.5 mm. However, the Sauter mean diameter ( D 32 ) and standard deviation ( σ ) decrease with increasing teeth height, confirming effective bubble breakup by the cross-flow steps.
Figure 7 shows a direct comparison between all three cross-flow steps and the reference case, showing a monotonic reduction in the Sauter mean diameter and the standard deviations with the increase in step height, which again highlights the positive effects of the cross-flow steps on crushing and dispersing the bubbles.

3.3. Measurements of Gas Accumulation

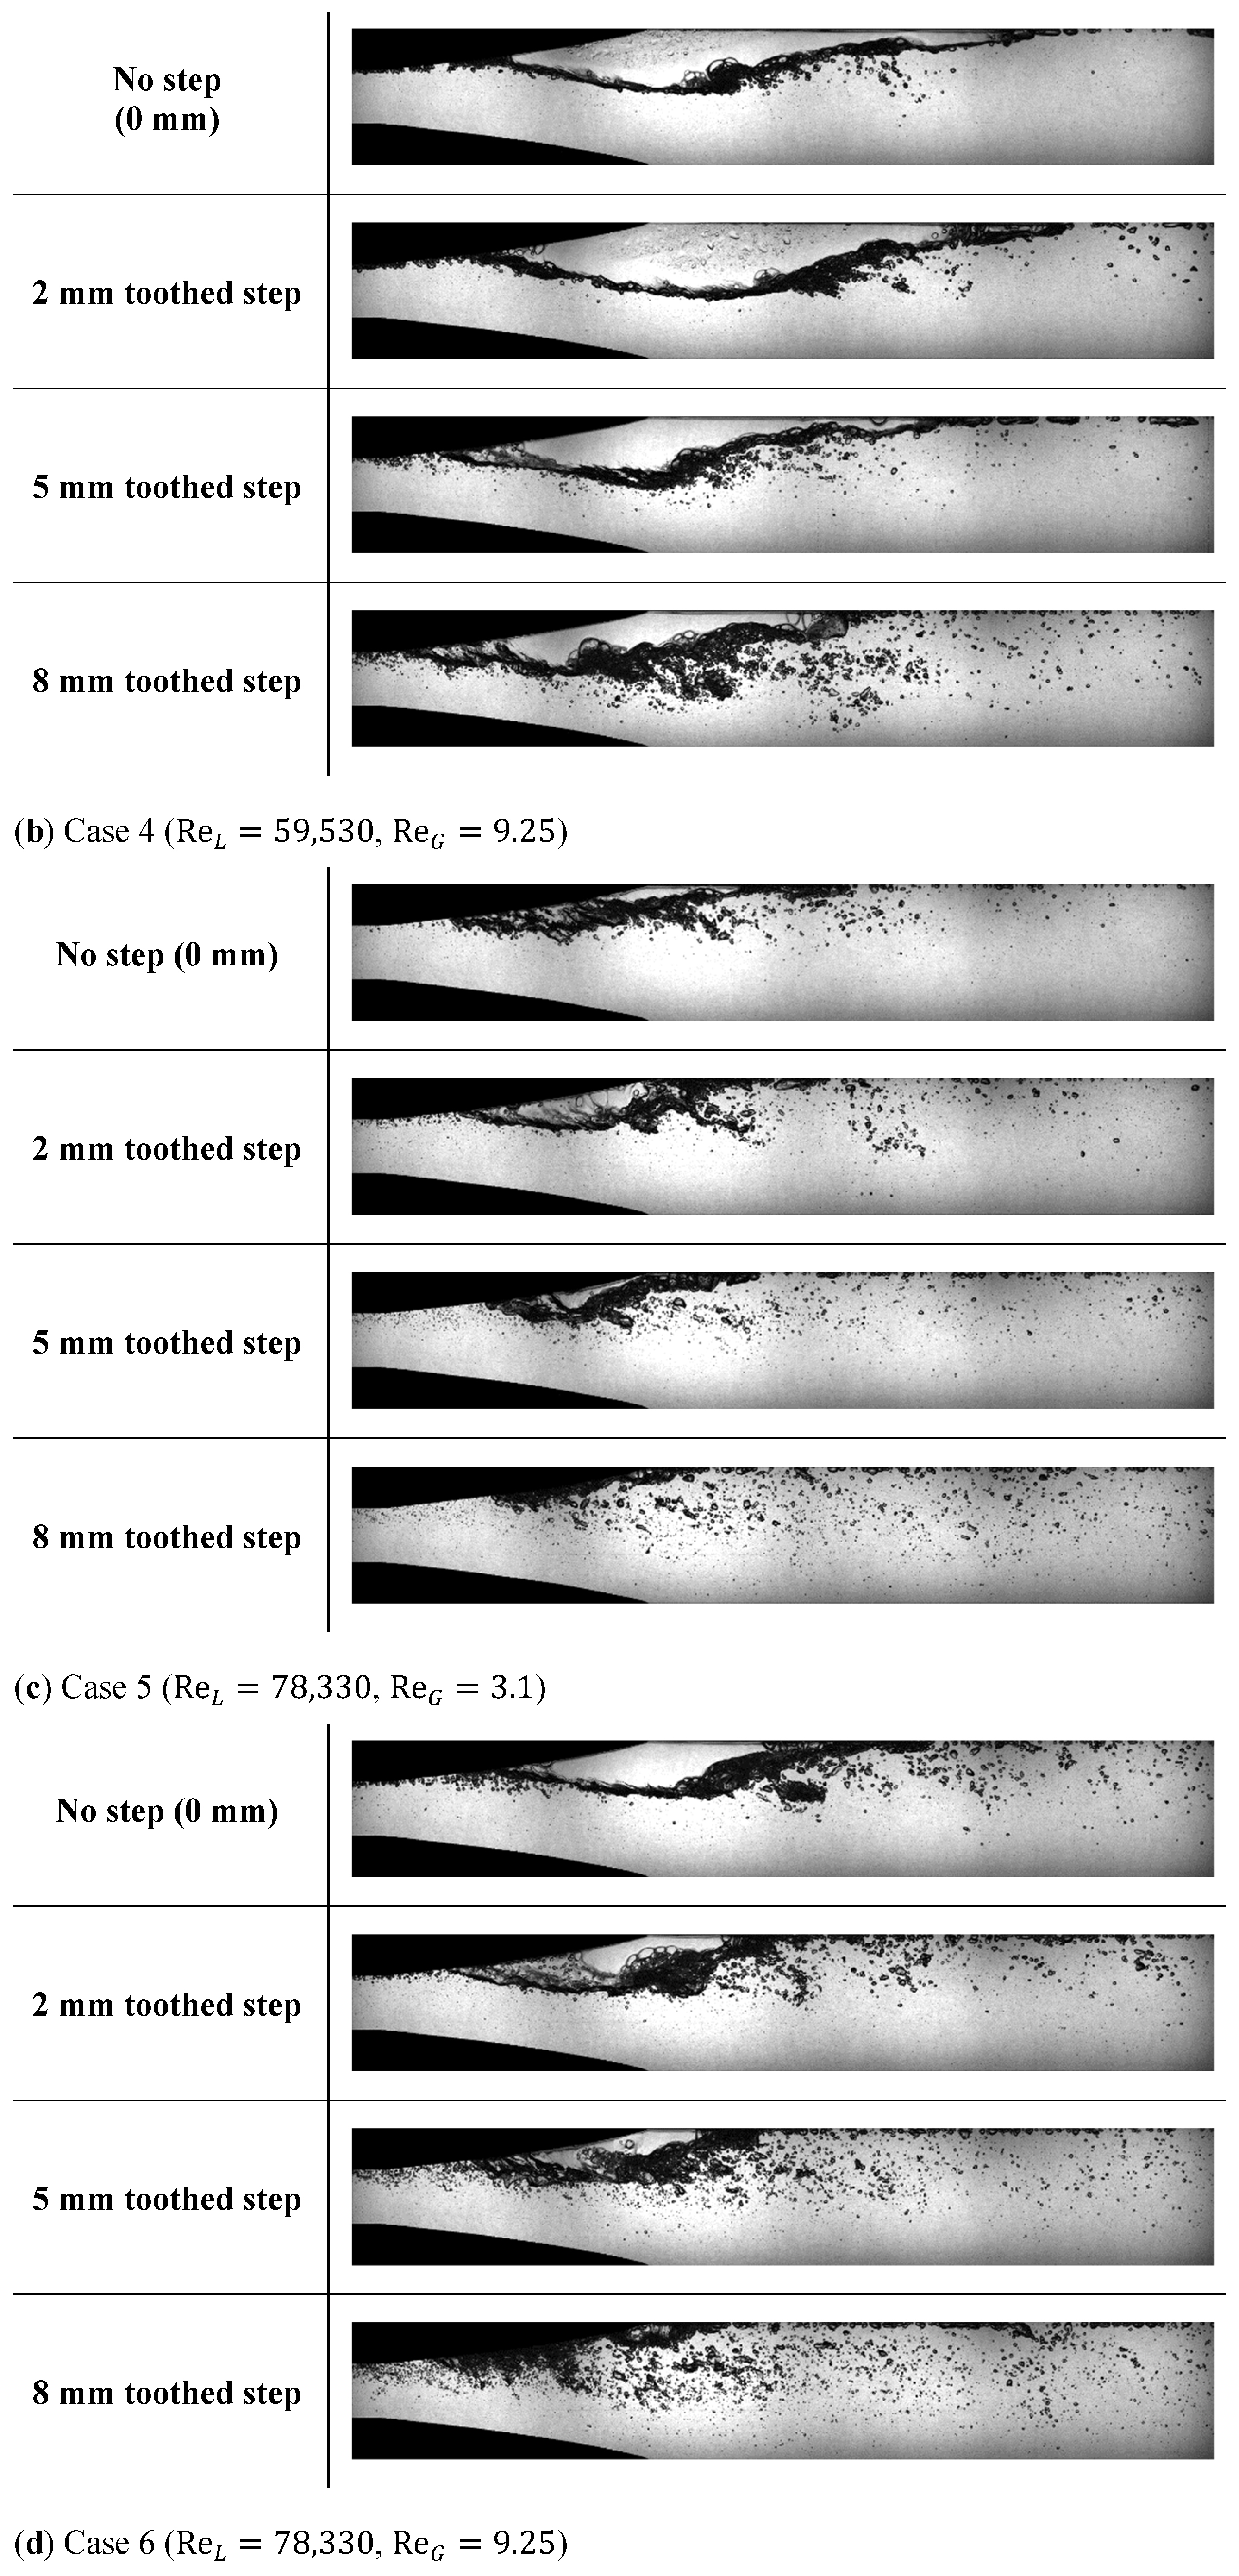
For the reference case (without steps), the four selected two-phase cases lead to large gas accumulations with remarkable changes in size and shape, as can be seen in Figure 8. Here, the largest accumulation is seen for Case 4, as it has a low water flow and a high gas flow, while the smallest accumulation occurs for Case 5, which has a high water flow and a low gas flow. For the 2 mm toothed step, the gas accumulation becomes slightly larger for most cases (Cases 3, 4, and 5) because this small step cannot disperse the bubbles; rather, it decelerates them near the channel inlet (see again Figure 5). Accordingly, the gas accumulation is undesirably larger.
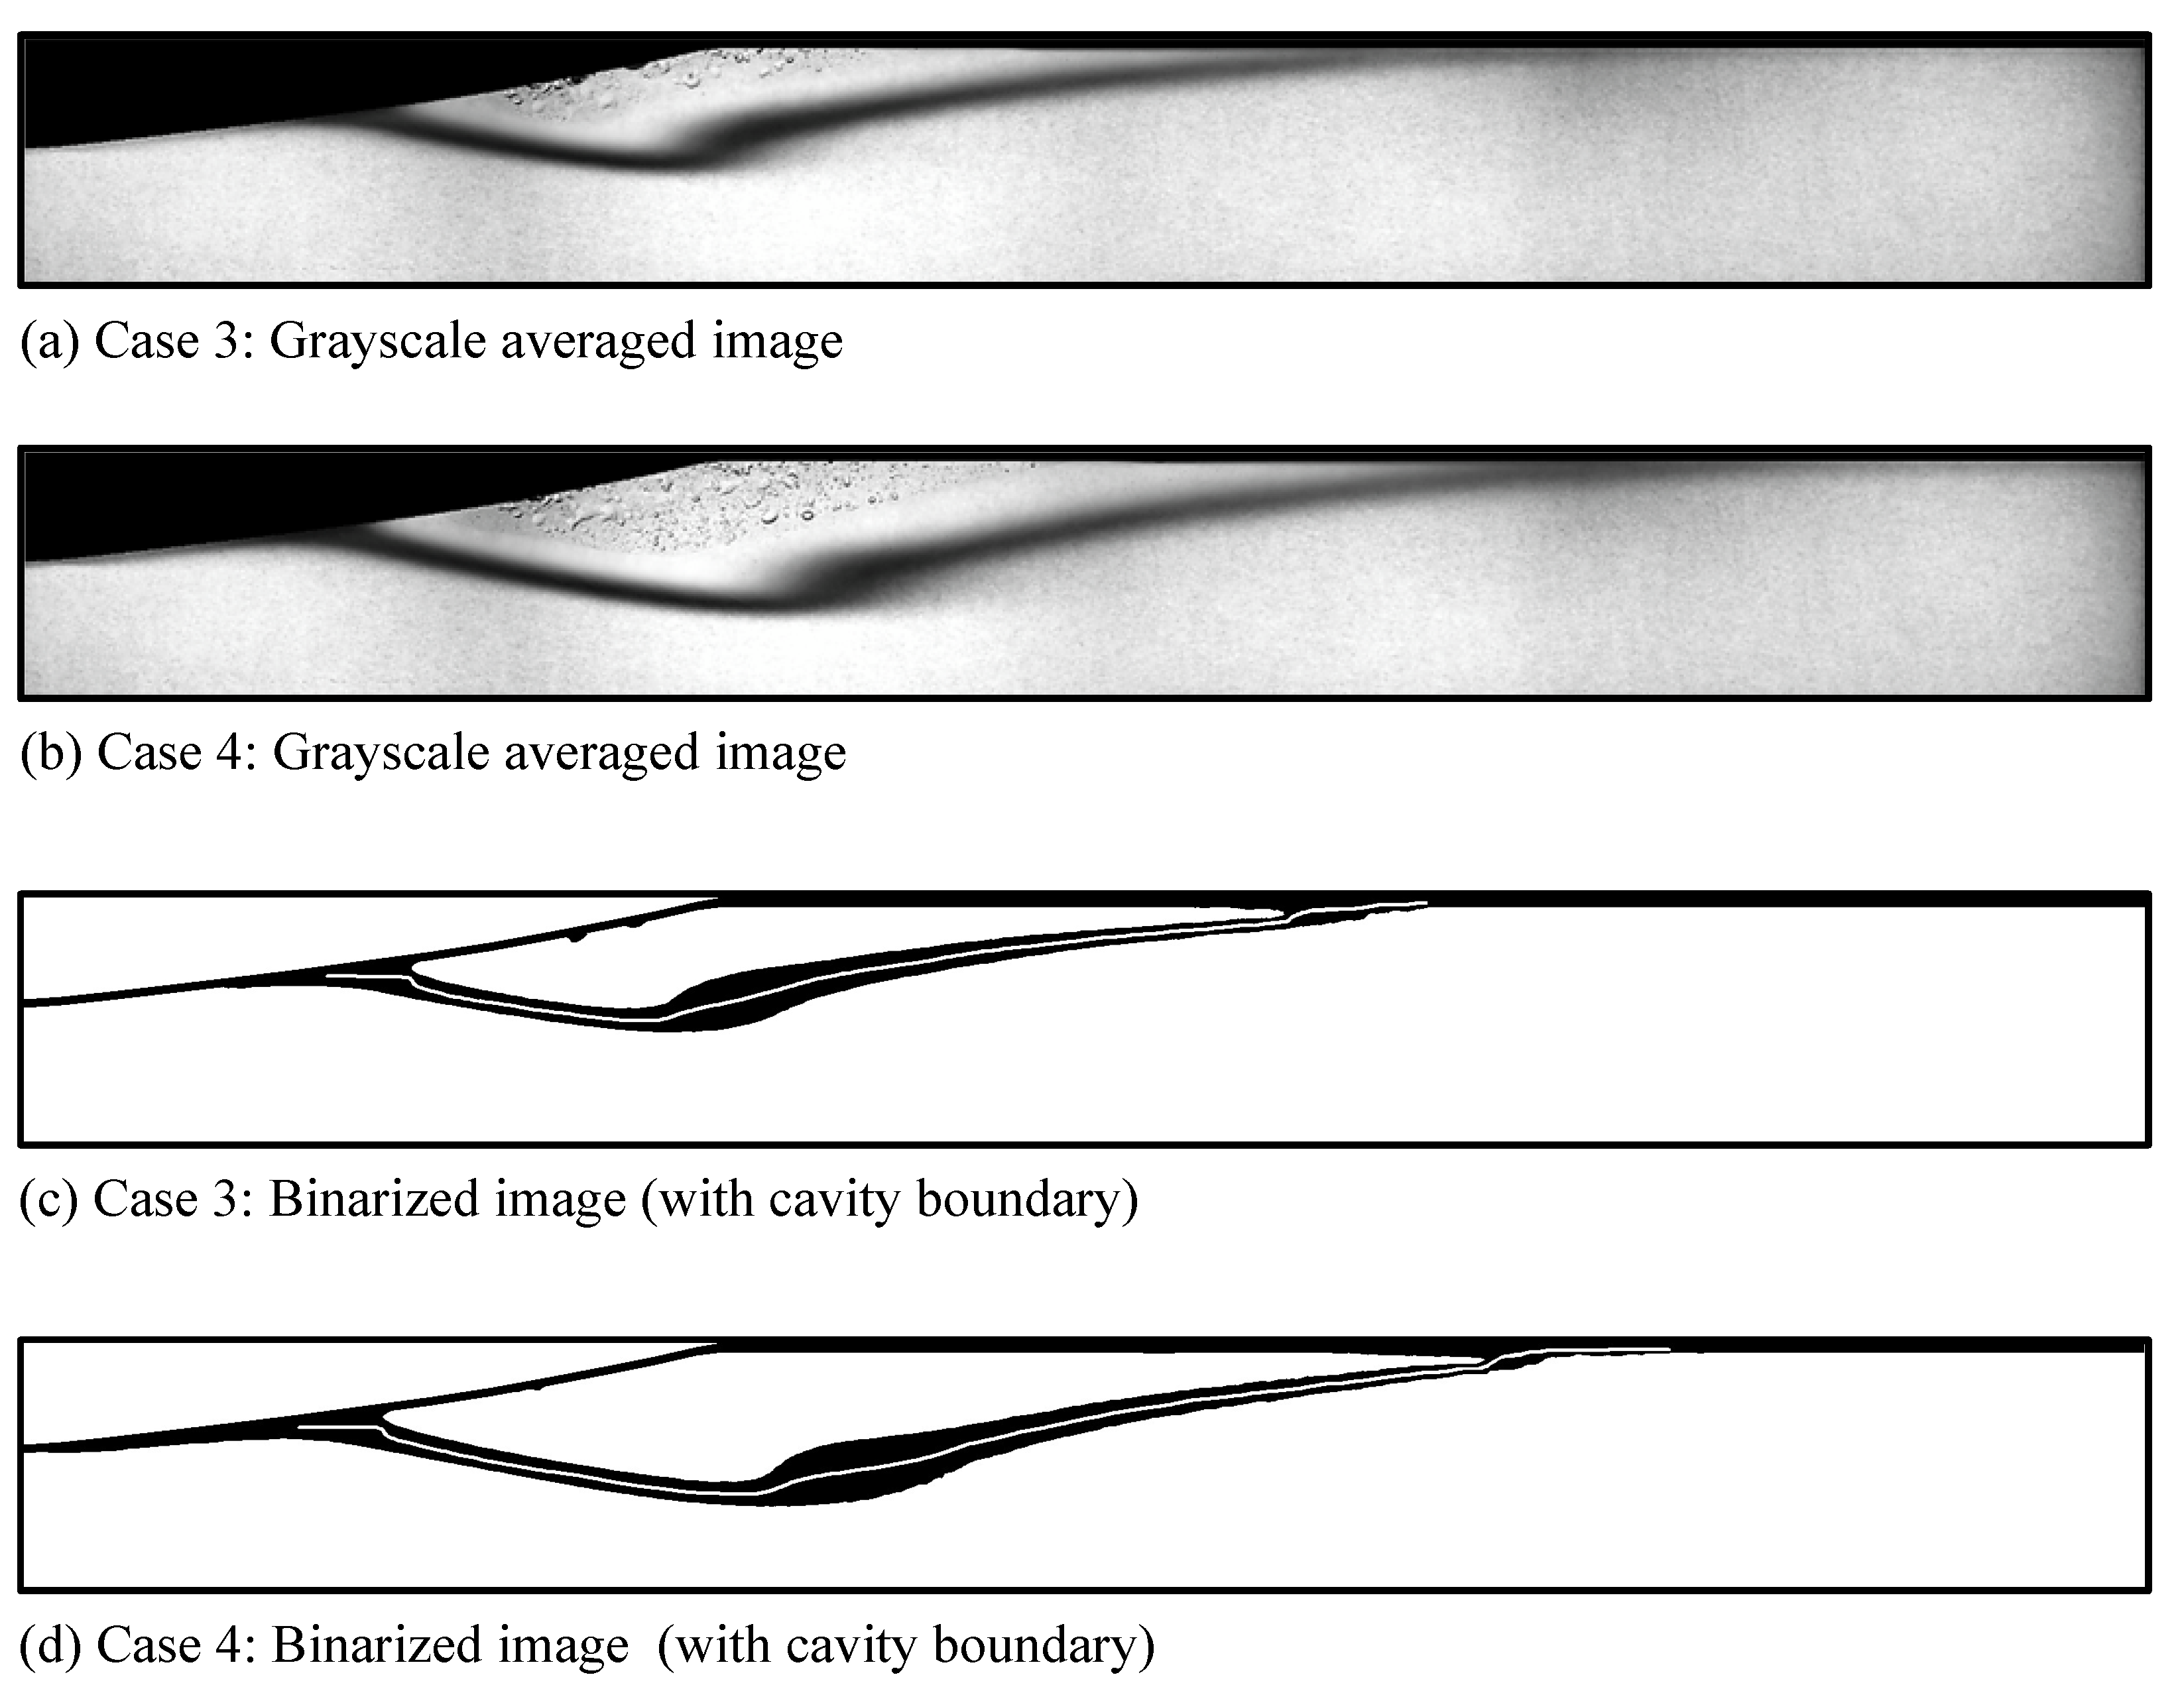
In the experiments, the accumulated air consistently fills the entire width of the channel, with only instantaneous unsteady variations observed locally at the beginning of the accumulation. To determine the average size of the accumulated gas, a grayscale average image was generated from 1500 instantaneous images captured at a low frequency of 50 Hz, providing a stable representation of the air–water interface. This effectively eliminates all transient and unsteady effects in the interface and also ensures that any potential three-dimensional variations are negligible in the observed results. These averaged images were then binarized using an intensity threshold (I) determined from their brightness spectra. Figure 9 presents representative examples of the averaged and binarized images. A MATLAB R2022b script was employed to identify the black pixels corresponding to the accumulated air boundary. The script then located the middle pixel of this boundary to define the bottom edge of the accumulated gas. The calculated mean boundaries, as determined by the script, are overlaid on the binarized images in Figure 9 as thin white lines. For a detailed description of the calculations, please refer to [13,41].
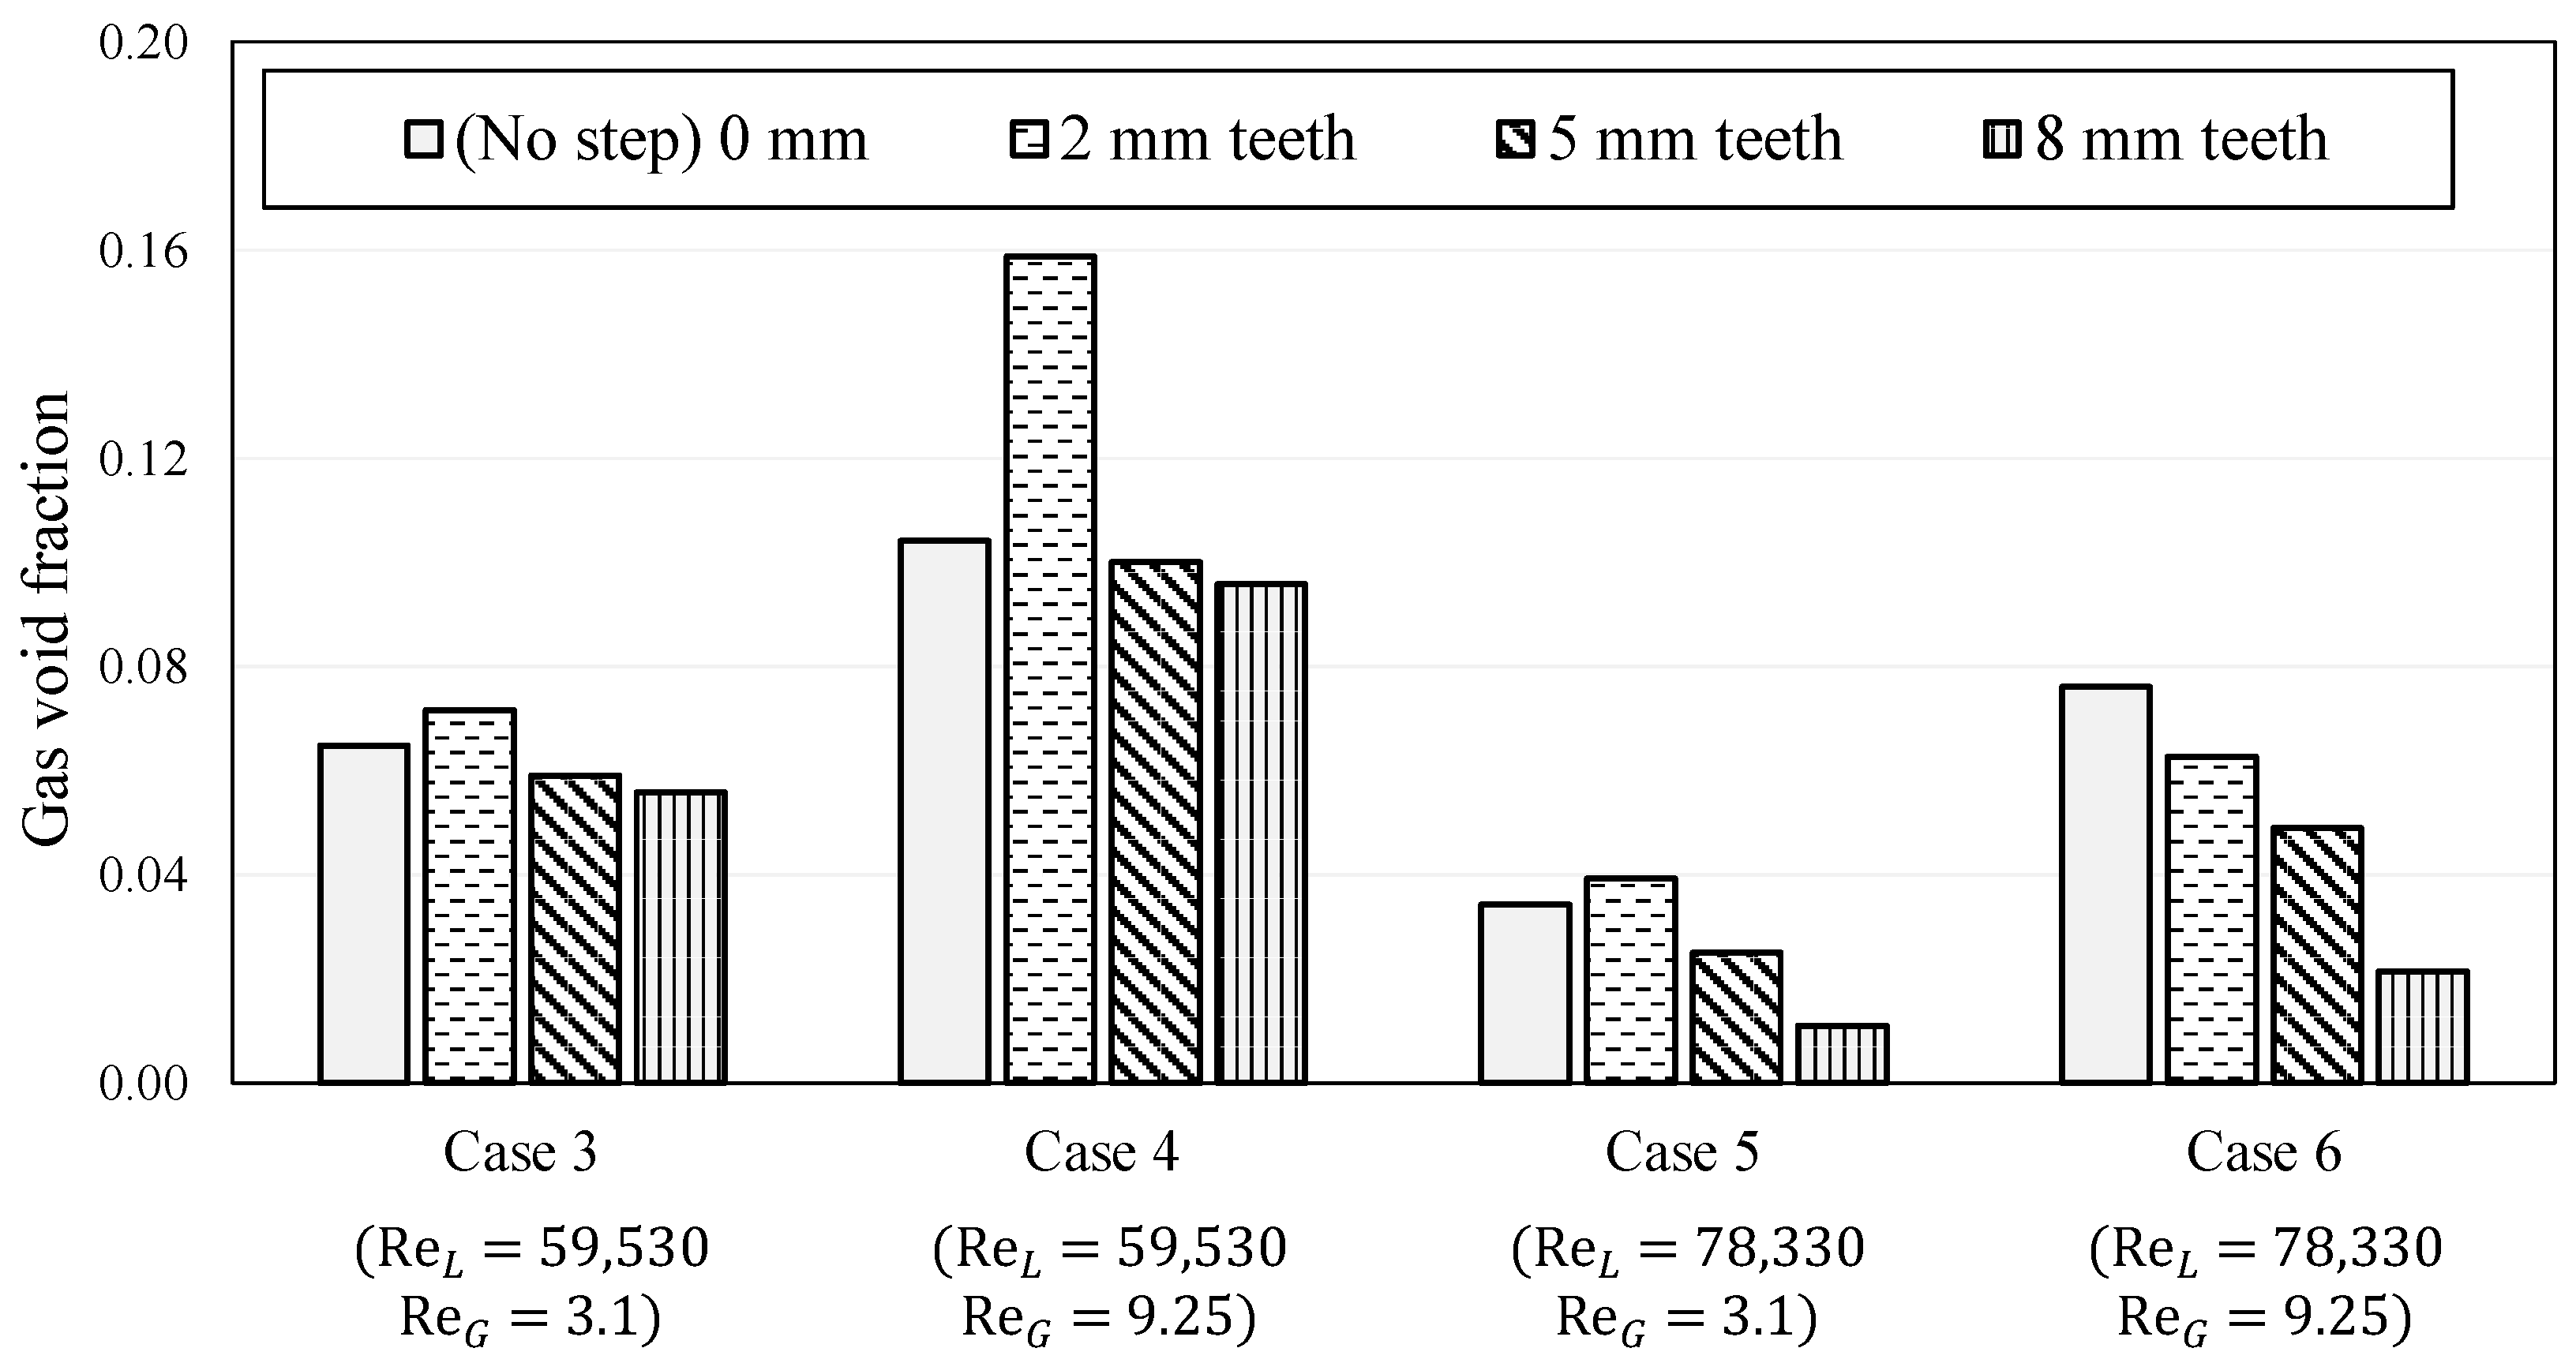
Figure 10 presents the gas void fraction of the accumulated gas in the channel for all studied cases. This fraction is calculated by dividing the average accumulated gas volume by the total channel volume, measured from the inlet plane of the diverging section. As anticipated, the 2 mm toothed step generally leads to greater gas accumulation compared with cases without steps. Nevertheless, a gradual decrease in accumulated gas is observed as the tooth height increases to 5 mm and 8 mm. Notably, these larger cross-flow steps prove more effective in reducing gas accumulation under high flow conditions (Cases 5 and 6), as illustrated in Figure 10. For instance, the 8 mm toothed step could reduce the size of the accumulated gas by approximately 14%, 8%, 68%, and 72% for Cases 3, 4, 5, and 6, respectively.

3.4. Pressure Recovery

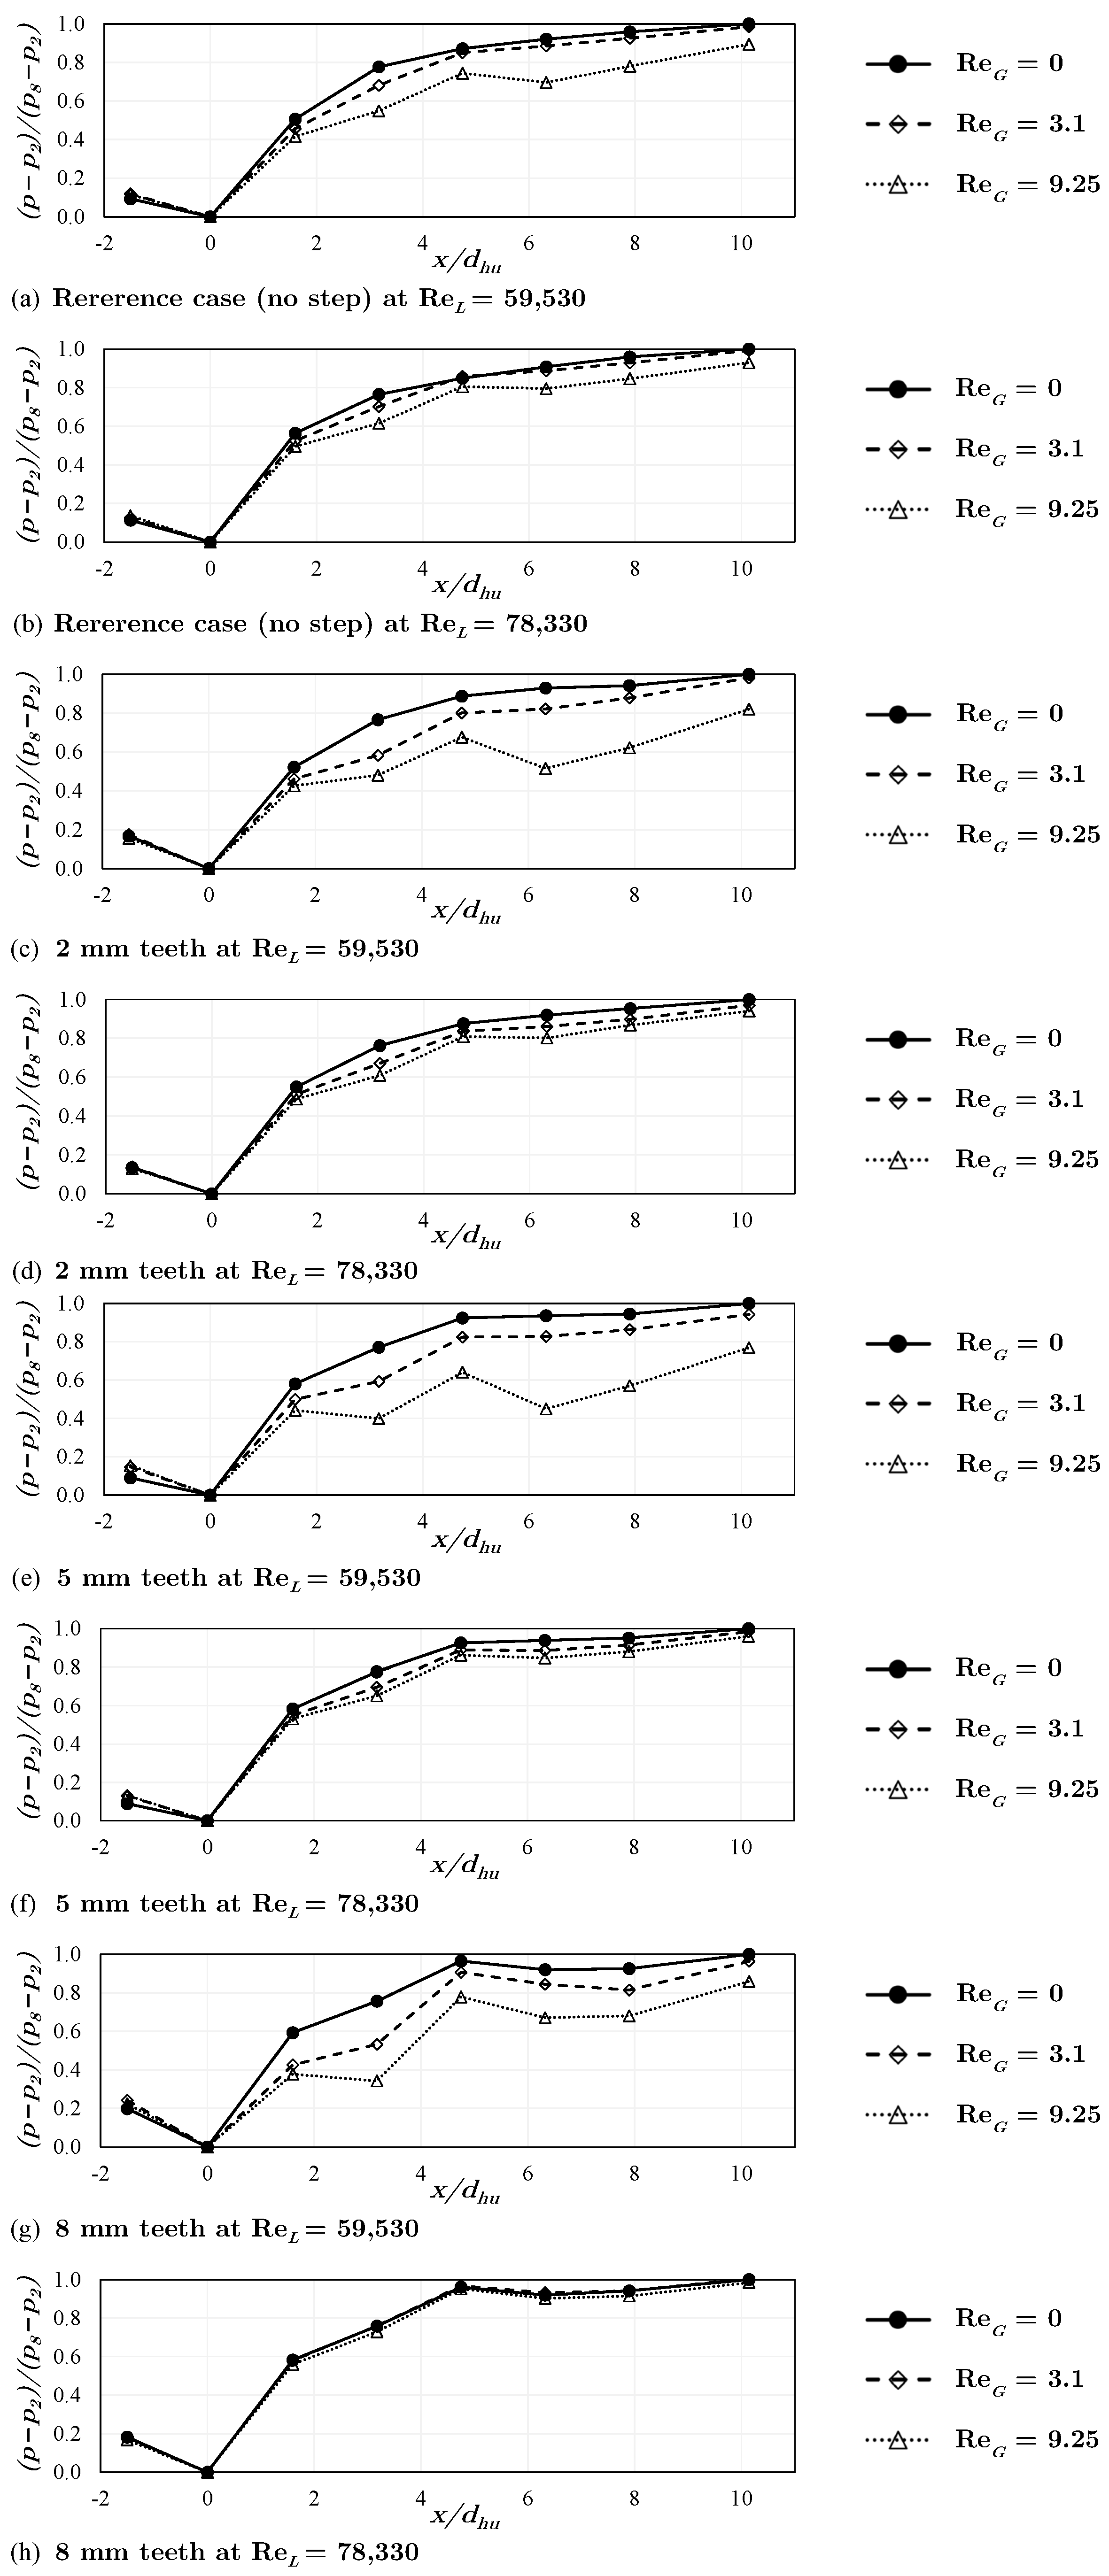
In this last section, the pressure recovery is compared and discussed. Figure 11 illustrates the impact of accumulated gas on pressure recovery within the diffuser. Pressure measurements were taken at eight distinct axial locations along the streamwise direction (refer back to Figure 1). Due to the highly turbulent nature of the flow, an average value of the pressure was calculated after continuously monitoring the readings at each point for several minutes at a frequency of 8 Hz. Pressure sensor number 2, installed at the diffuser inlet (i.e., at x = 0), was used as a reference point for the pressure difference. The values shown were then normalized by the maximum pressure difference of the single-phase flow of each case ( p 8 p 2 ). The pressure results are shown in Figure 11 for Re L = 59,530 and Re L = 78,330. As can be seen for the reference configuration, a reduction in the pressure recovery is taking place as the gas accumulation size increases. No significant improvement in the pressure recovery within the diffuser could be seen for the 2 mm case since these short teeth fail to reduce gas accumulation. For the 5 mm teeth, the improvements are limited due to the increased flow separation. Nonetheless, a significant improvement can be seen in the pressure recovery of the 8 mm teeth at Re L = 78,330 regardless of the increased separation since it could highly reduce the gas accumulations. Here, the two-phase pressure recovery is very similar to that of the single-phase flow. The slight decrease in pressure observed for x / d h u > 4 in Figure 11g,h can be attributed to the large recirculation zone that develops with the 8 mm teeth configuration. This region of pressure reduction occurs just downstream of the diverging section at sensors 6 and 7. Although the channel transitions into a constant cross-sectional area and the geometric area remains unchanged, the height of the recirculation zone on the upper side continues to slightly expand (see Figure 4), reducing the available effective flow area. This contraction locally accelerates the flow, leading to a minor reduction in pressure. Nonetheless, the pressure begins to increase again at sensor 8, corresponding to a decrease in the height of the recirculation zone and a recovery of the effective flow area.

4. Conclusions

Various gas–liquid two-phase conditions were experimentally investigated in a horizontal diffuser, where significant gas accumulations develop due to flow separation. The velocity measurements revealed large separation zones on the upper side of the diffuser, where air tends to accumulate. To mitigate this, three upstream cross-flow toothed steps with varying heights (2, 5, and 8 mm) were implemented. It was observed that the separation zone increases with the height of the teeth; however, the turbulence fluctuations were also positively improved. The two-phase interactions and bubble size distributions were captured using shadowgraphy with high-speed cameras. The results show that the 2 mm toothed step does not effectively disperse the bubbles or reduce the accumulated gas, as the teeth are too short to induce sufficient mixing. In contrast, the 5 mm and 8 mm steps led to more pronounced bubble dispersion and breakup, resulting in significantly reduced gas accumulations. These effects were particularly noticeable at higher water flow rates. Moreover, the 8 mm step demonstrated an enhanced pressure recovery, particularly at high water flows, with minimal pressure decay under two-phase conditions. These experimental findings are crucial for the validation of numerical simulations and will contribute to improving the design of centrifugal pumps by minimizing gas accumulation in the diffuser region, thus increasing pump efficiency. Additionally, this study highlights the potential for passive control strategies using upstream flow modifications, providing valuable insights into optimizing gas–liquid two-phase flow transport.

Author Contributions

Conceptualization, M.M.; methodology, M.M., N.Z. and M.S.; software, M.M., N.Z. and M.S.; validation, M.M.; formal analysis, M.M.; investigation, M.M., N.Z. and M.S.; resources, D.T.; data curation, M.M., N.Z. and M.S.; writing—original draft preparation, M.M.; writing—review and editing, N.Z., M.S., M.P., A.S. and D.T.; visualization, M.M., N.Z. and M.S.; supervision, D.T.; project administration, D.T.; funding acquisition, D.T. All authors have read and agreed to the published version of the manuscript.

Funding

This research project was carried out in the framework of the industrial collective research program (IGF 23051). It was supported by the Federal Ministry for Economic Affairs and Climate Action (BMWK) through the AiF (German Federation of Industrial Research Associations eV) based on a decision taken by the German Bundestag.

Institutional Review Board Statement

Not applicable.

Informed Consent Statement

Not applicable.

Data Availability Statement

The data that support the findings of this study are available from the corresponding author upon reasonable request.

Acknowledgments

The authors gratefully acknowledge the support of the project by the Verband Deutscher Maschinen-und Anlagenbau e.V. (VDMA) and the collaboration with Romuald SkodaChangkyu Park, and Siddharth Sharma from Ruhr University in Bochum.

Conflicts of Interest

The authors declare no conflicts of interest.

Nomenclatures and Abbreviations

The following nomenclatures are used in this manuscript:
Roman characters
A u upstream cross-sectional area( m 2 )
D 32 Sauter mean diameter(mm)
D m e d i a n median diameter(mm)
d h d downstream hydraulic diameter(m)
d h u upstream hydraulic diameter(m)
Ilight intensity(cd)
L 1 upstream straight pipe length(m)
L 2 downstream straight pipe length(m)
P 2 reference pressure (sensor 2)(mbar)
plocal pressure(mbar)
Q G gas volume flow rate(L/h)
Q L liquid volume flow rate( m 3 / s )
Re G superficial gas Reynolds number
Re L superficial liquid Reynolds number
u G superficial gas velocity(m/s)
u L superficial liquid velocity(m/s)
xaxial distance(m)
yvertical distance(m)
Greek characters
ε ˙ gas volume fraction(%)
ρ G density of gas( kg / m 3 )
ρ L density of liquid( kg / m 3 )
σ standard deviation of BSD(mm)
μ G viscosity of gas( Pa · s )
μ L viscosity of liquid( Pa · s )
Subscripts
ddownstream
Ggas
hhydraulic
Lliquid
uupstream
Abbreviations
% RDpercentage of reading (for accuracy quantification)
BSDbubble size distribution
LDALaser Doppler Anemometry
LEDLight Emitting Diode
LESlarge eddy simulation
RSMReynolds stress model
RTDResistance Temperature Detector
VOFvolume of fluid

References

  1. Ewing, M.E.; Weinandy, J.J.; Christensen, R.N. Observations of Two-Phase Flow Patterns in a Horizontal Circular Channel. Heat Transf. Eng. 1999, 20, 9–14. [Google Scholar] [CrossRef]
  2. Chen, I.Y.; Tseng, C.Y.; Lin, Y.T.; Wang, C.C. Two-phase flow pressure change subject to sudden contraction in small rectangular channels. Int. J. Multiph. Flow 2009, 35, 297–306. [Google Scholar] [CrossRef]
  3. Sharma, A.; Tyagi, V.; Chen, C.; Buddhi, D. Review on thermal energy storage with phase change materials and applications. Renew. Sustain. Energy Rev. 2009, 13, 318–345. [Google Scholar] [CrossRef]
  4. Mansour, M.; Wunderlich, B.; Thévenin, D. Effect of tip clearance gap and inducer on the transport of two-phase air-water flows by centrifugal pumps. Exp. Therm. Fluid Sci. 2018, 99, 487–509. [Google Scholar] [CrossRef]
  5. Manzano Ruiz, J.J. Experimental and Theoretical Study of Two-Phase Flow in Centrifugal Pumps. Ph.D. Thesis, Massachusetts Institute of Technology, Cambridge, MA, USA, 1980. Available online: https://hdl.handle.net/1721.1/15856 (accessed on 22 July 2025).
  6. Zhu, Z.; Xie, P.; Ou, G.; Cui, B.; Li, Y. Design and Experimental Analyses of Small-flow High-head centrifugal-vortex Pump for Gas-Liquid Two-phase Mixture. Chin. J. Chem. Eng. 2008, 16, 528–534. [Google Scholar] [CrossRef]
  7. Barrios, L.; Prado, M.G. Experimental Visualization of Two-Phase Flow Inside an Electrical Submersible Pump Stage. J. Energy Resour. Technol. 2011, 133, 042901. [Google Scholar] [CrossRef]
  8. Mansour, M.; Wunderlich, B.; Thévenin, D. Experimental study of two-phase air/water flows in a centrifugal pump working with a closed or a semi-open impeller. In Proceedings of the ASME Turbo Expo 2018: Turbomachinery Technical Conference and Exposition, Oslo, Norway, 11–15 June 2018; p. V009T27A012. [Google Scholar] [CrossRef]
  9. Mansour, M.; Kopparthy, S.; Thévenin, D. Investigations on the effect of rotational speed on the transport of air-water two-phase flows by centrifugal pumps. Int. J. Heat Fluid Flow 2022, 94, 108939. [Google Scholar] [CrossRef]
  10. Hundshagen, M.; Skoda, R. State of the art on two-phase non-miscible liquid/gas flow transport analysis in radial centrifugal pumps Part C: CFD approaches with emphasis on improved models. Int. J. Turbomach. Propuls. Power 2023, 8, 15. [Google Scholar] [CrossRef]
  11. Mansour, M.; Thévenin, D. State of the art on two-phase non-miscible liquid/gas flow transport analysis in radial centrifugal pumps Part B: Review of experimental investigations. Int. J. Turbomach. Propuls. Power 2023, 8, 42. [Google Scholar] [CrossRef]
  12. Müller, T.; Limbach, P.; Skoda, R. Numerical 3D RANS simulation of gas-liquid flow in a centrifugal pump with an Euler-Euler two-phase model and a dispersed phase distribution. In Proceedings of the 11th European Conference on Turbomachinery Fluid Dynamics and Thermodynamics, Madrid, Spain, 23–27 March 2015; Available online: https://euroturbo.eu/publications/proceedings-papers/etc2015-076/ (accessed on 22 July 2025).
  13. Mansour, M.; Kováts, P.; Wunderlich, B.; Thévenin, D. Experimental investigations of a two-phase gas/liquid flow in a diverging horizontal channel. Exp. Therm. Fluid Sci. 2018, 93, 210–217. [Google Scholar] [CrossRef]
  14. Kopparthy, S.; Mansour, M.; Janiga, G.; Thévenin, D. Numerical investigations of turbulent single-phase and two-phase flows in a diffuser. Int. J. Multiph. Flow 2020, 130, 103333. [Google Scholar] [CrossRef]
  15. Hundshagen, M.; Mansour, M.; Thévenin, D.; Skoda, R. Numerical investigation of two-phase air-water flow in a centrifugal pump with closed or semi-open impeller. In Proceedings of the 13th European Turbomachinery Conference on Turbomachinery Fluid Dynamics and Thermodynamics, ETC 2019, Lausanne, Switzerland, 8–12 April 2019. [Google Scholar] [CrossRef]
  16. Poullikkas, A. Effects of two-phase liquid–gas flow on the performance of nuclear reactor cooling pumps. Prog. Nucl. Energy 2003, 42, 3–10. [Google Scholar] [CrossRef]
  17. Caridad, J.; Asuaje, M.; Kenyery, F.; Tremante, A.; Aguillón, O. Characterization of a centrifugal pump impeller under two-phase flow conditions. J. Pet. Sci. Eng. 2008, 63, 18–22. [Google Scholar] [CrossRef]
  18. Amoresano, A.; Langella, G.; Niola, V.; Quaremba, G. Advanced Image Analysis of Two-Phase Flow inside a Centrifugal Pump. Adv. Mech. Eng. 2014, 6, 958320. [Google Scholar] [CrossRef]
  19. Zhu, J.; Guo, X.; Liang, F.; Zhang, H.Q. Experimental study and mechanistic modeling of pressure surging in electrical submersible pump. J. Nat. Gas Sci. Eng. 2017, 45, 625–636. [Google Scholar] [CrossRef]
  20. Monte Verde, W.; Biazussi, J.L.; Sassim, N.A.; Bannwart, A.C. Experimental study of gas-liquid two-phase flow patterns within centrifugal pumps impellers. Exp. Therm. Fluid Sci. 2017, 85, 37–51. [Google Scholar] [CrossRef]
  21. Mansour, M.; Kopparthy, S.B.; Thévenin, D. Improving air-water two-phase flow pumping in centrifugal pumps using novel grooved front shrouds. Chem. Eng. Res. Des. 2023, 197, 173–191. [Google Scholar] [CrossRef]
  22. Chen, I.Y.; Chen, Y.M.; Yang, B.C.; Wang, C.C. Two-phase flow pattern and frictional performance across small rectangular channels. Appl. Therm. Eng. 2009, 29, 1309–1318. [Google Scholar] [CrossRef]
  23. Wambsganss, M.; Jendrzejczyk, J.; France, D.; Obot, N. Frictional pressure gradients in two-phase flow in a small horizontal rectangular channel. Exp. Therm. Fluid Sci. 1992, 5, 40–56. [Google Scholar] [CrossRef]
  24. Vallée, C.; Höhne, T.; Prasser, H.M.; Sühnel, T. Experimental investigation and CFD simulation of horizontal stratified two-phase flow phenomena. Nucl. Eng. Des. 2008, 238, 637–646. [Google Scholar] [CrossRef]
  25. Aziz, W.; Chaturvedi, S.; Kheireddine, A. Thermodynamic analysis of two-component, two-phase flow in solar collectors with application to a direct-expansion solar-assisted heat pump. Energy 1999, 24, 247–259. [Google Scholar] [CrossRef]
  26. Chen, I.Y.; Liu, C.C.; Chien, K.H.; Wang, C.C. Two-phase flow characteristics across sudden expansion in small rectangular channels. Exp. Therm. Fluid Sci. 2007, 32, 696–706. [Google Scholar] [CrossRef]
  27. Abdelall, F.F.; Hahn, G.; Ghiaasiaan, S.M.; Abdel-Khalik, S.I.; Jeter, S.S.; Yoda, M.; Sadowski, D.L. Pressure drop caused by abrupt flow area changes in small channels. Exp. Therm. Fluid Sci. 2005, 29, 425–434. [Google Scholar] [CrossRef]
  28. Ahmed, W.H.; Ching, C.Y.; Shoukri, M. Development of two-phase flow downstream of a horizontal sudden expansion. Int. J. Heat Fluid Flow 2008, 29, 194–206. [Google Scholar] [CrossRef]
  29. Pakhomov, M.A.; Terekhov, V.I. Modeling of turbulent heat-transfer augmentation in gas-droplet non-boiling flow in diverging and converging axisymmetric ducts with sudden expansion. Energies 2022, 15, 5861. [Google Scholar] [CrossRef]
  30. Anupriya, S.; Jayanti, S. Experimental and modelling studies of gas–liquid vertical annular flow through a diverging section. Int. J. Multiph. Flow 2014, 67, 180–190. [Google Scholar] [CrossRef]
  31. Hwang, J.J.; Tseng, F.G.; Pan, C. Ethanol-CO2 two-phase flow in diverging and converging microchannels. Int. J. Multiph. flow 2005, 31, 548–570. [Google Scholar] [CrossRef]
  32. Deniz, E.; Eskin, N. Hydrodynamic characteristics of two-phase flow through horizontal pipe having smooth expansion. ISI Bilim. Ve Tek. Derg.-J. Therm. Sci. Technol. 2015, 35, 1–9. [Google Scholar]
  33. Kourakos, V.G.; Rambaud, P.; Chabane, S.; Pierrat, D.; Buchlin, J.M. Two-phase flow modelling within expansion and contraction singularities. Comput. Methods Multiph. Flow V 2009, 63, 27. [Google Scholar] [CrossRef]
  34. Deniz, E.; Eskin, N. Experimental and Numerical Investigation of Two-Phase Flow through Enlarging Singularity. In Proceedings of the International Refrigeration and Air Conditioning Conference, West Lafayette, IN, USA, 16–19 July 2012; pp. 1–9. Available online: https://docs.lib.purdue.edu/iracc/1254/ (accessed on 22 July 2025).
  35. Eskin, N.; Deniz, E. Pressure drop of two-phase flow through horizontal channel with smooth expansion. In Proceedings of the International Refrigeration and Air Conditioning Conference, West Lafayette, IN, USA, 16–19 July 2012; pp. 1–10. Available online: https://docs.lib.purdue.edu/iracc/1255/ (accessed on 22 July 2025).
  36. Ahmadpour, A.; Noori Rahim Abadi, S.; Kouhikamali, R. Numerical simulation of two-phase gas–liquid flow through gradual expansions/contractions. Int. J. Multiph. Flow 2016, 79, 31–49. [Google Scholar] [CrossRef]
  37. Ding, G.; Chen, J.; Li, Z. An investigation on the bubble breakup characteristics by recirculation flow in a venturi channel. In Proceedings of the Fluids Engineering Division Summer Meeting, Online, 10–12 August 2021; Volume 3, Fluid Mechanics; Micro and Nano Fluid Dynamics; Multiphase Flow. p. V003T08A002. [Google Scholar] [CrossRef]
  38. Hundshagen, M.; Mansour, M.; Thévenin, D.; Skoda, R. 3D simulation of gas-laden liquid flows in centrifugal pumps and the assessment of two-fluid CFD methods. Exp. Comput. Multiph. Flow. 2021, 3, 186–207. [Google Scholar] [CrossRef]
  39. Nguyen, B.D.; Popp, S.; Hundshagen, M.; Skoda, R.; Mansour, M.; Thévenin, D.; Hasse, C. Large eddy simulations of turbulent gas-liquid flows in a diverging horizontal channel using a hybrid multiphase approach. J. Fluids Eng. 2022, 145, 031501. [Google Scholar] [CrossRef]
  40. Mansour, M.; Zanini, N.; Shenouda, M.; Pinelli, P.; Thévenin, D.; Suman, A.; Thévenin, D. Minimizing gas accumulation in two-phase flow within a diverging horizontal channel using cross-flow millimeter-size steps. In Proceedings of the 16th European Turbomachinery Conference on Turbomachinery Fluid Dynamics and Thermodynamics ETC16, Hannover, Germany, 24–28 March 2025. [Google Scholar]
  41. Mansour, M. Transport of Two-Phase Air-Water Flows in Radial Centrifugal Pumps. Ph.D. Thesis, University of Magdeburg, Magdeburg, Germany, 2020. [Google Scholar] [CrossRef]
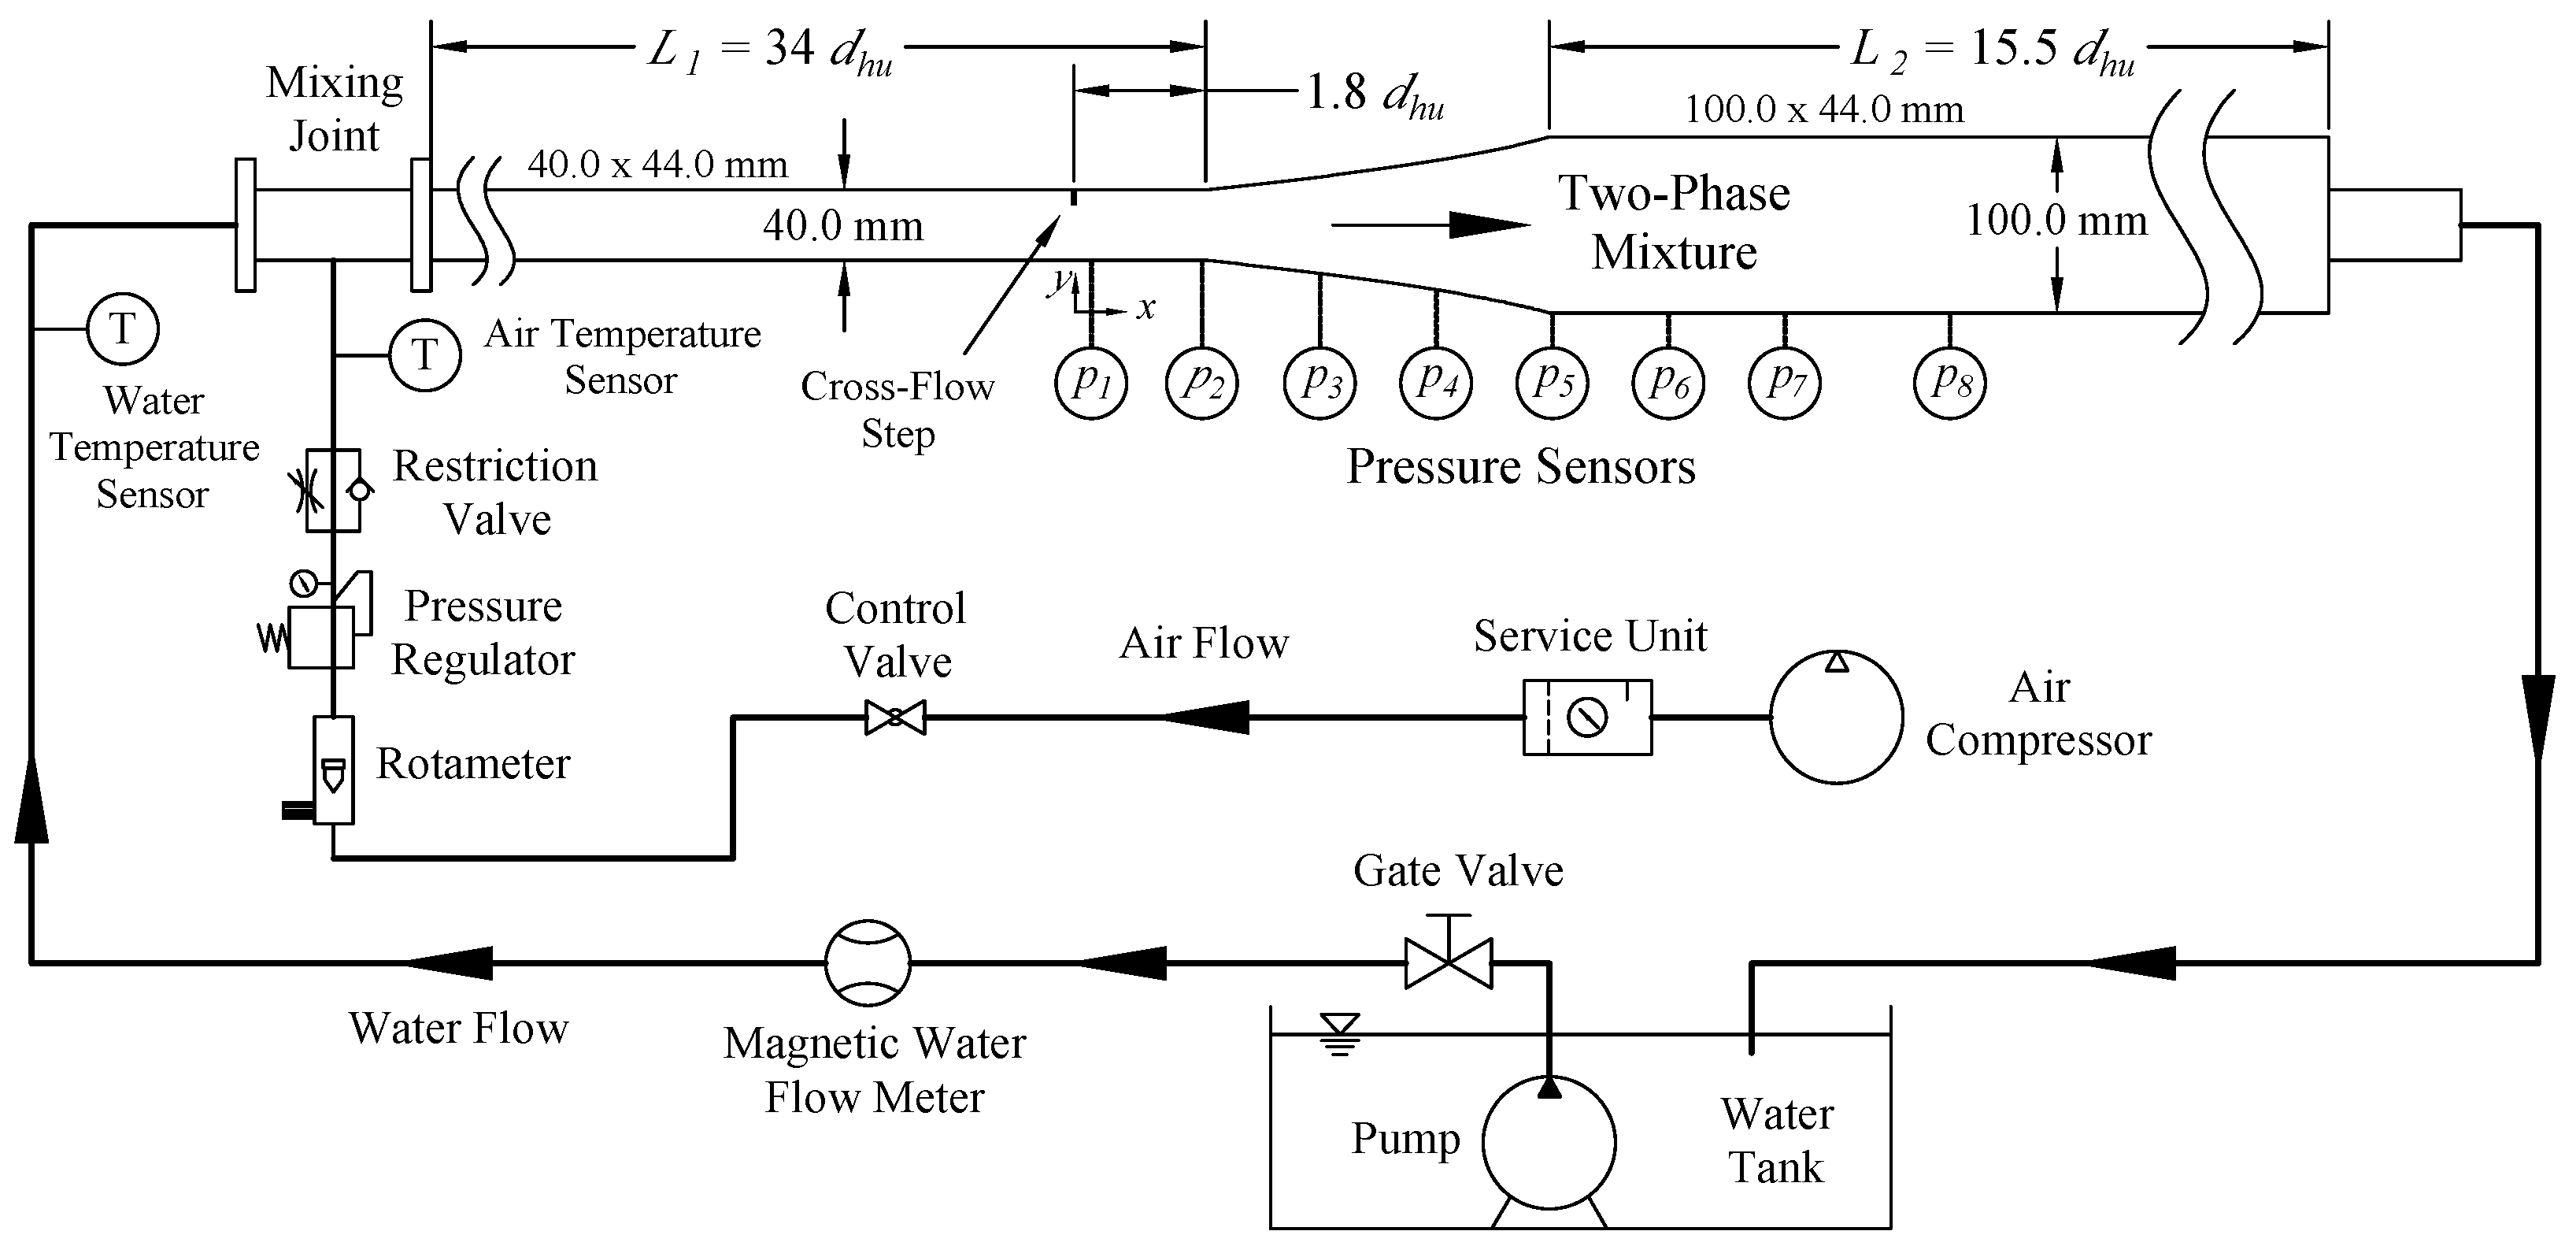
Figure 1. Sketch of the experimental loop.
Ijtpp 10 00020 g001
Figure 2. Details of the measurements. (a) An image for the LDA measurements; (b) Grid points of LDA; (c) Shadowgraphy top view; (d) Bubble size distribution (BSD) window location.
Ijtpp 10 00020 g002
Figure 3. Details of the cross-flow steps studied. (a) Step installation view. (b) Reference case (no step). (c) Step with 2 mm teeth. (d) Step with 5 mm teeth. (e) Step with 8 mm teeth.
Ijtpp 10 00020 g003
Figure 4. Single-phase velocity measurements (Case 1 (a), Case 2 (b)). (Top): velocity magnitude; (Bottom): velocity fluctuations, with corresponding color scales at the bottom of the figure.
Ijtpp 10 00020 g004aIjtpp 10 00020 g004b
Figure 5. Bubble dispersion for all two-phase configurations just before the diffuser inlet (camera focus is set on the mid-longitudinal section).
Ijtpp 10 00020 g005
Figure 6. Bubble size distributions (BSD) of different geometrical conditions for Case 5. (a) Reference case (without steps); (b) 2 mm teeth; (c) 5 mm teeth; (d) 8 mm teeth.
Ijtpp 10 00020 g006
Figure 7. Comparison of Sauter mean diameters ( D 32 ) and standard deviations ( σ ) for the BSD of Case 5 for different geometrical conditions.
Ijtpp 10 00020 g007
Figure 8. Gas accumulations for all two-phase configurations (Cases 3 (a), 4 (b), 5 (c), and 6 (d)).
Ijtpp 10 00020 g008aIjtpp 10 00020 g008b
Figure 9. Illustration of the image processing for quantifying the accumulated gas. (a) Grayscale averaged image for Case 3; (b) Grayscale averaged image for Case 4; (c) Binarized image for Case 3; (d) Binarized image for Case 4.
Ijtpp 10 00020 g009
Figure 10. Gas void fraction for all considered cases.
Ijtpp 10 00020 g010
Figure 11. Pressure recovery for all considered cases. (a) Reference case at Re L = 59,530; (b) Reference case at Re L = 78,330; (c) 2 mm teeth at Re L = 59,530; (d) 2 mm teeth at Re L = 78,330; (e) 5 mm teeth at Re L = 59,530; (f) 5 mm teeth at Re L = 78,330; (g) 8 mm teeth at Re L = 59,530; (h) 8 mm teeth at Re L = 78,330.
Ijtpp 10 00020 g011
Table 1. Details of the considered flow conditions.
Case no. Q L (m3/h) Q G (L/h)ReL ReG ε ˙ (%)
19.5059,53000
212.5078,33000
39.57.0759,5303.100.074
49.521.2159,5309.250.223
512.57.0778,3303.100.056
612.521.2178,3309.250.169
Disclaimer/Publisher’s Note: The statements, opinions and data contained in all publications are solely those of the individual author(s) and contributor(s) and not of MDPI and/or the editor(s). MDPI and/or the editor(s) disclaim responsibility for any injury to people or property resulting from any ideas, methods, instructions or products referred to in the content.