Article

Cavity Flow Instabilities in a Purged High-Pressure Turbine Stage †

by
Lorenzo Da Valle
1,2,*,
Bogdan Cezar Cernat
1 and
Sergio Lavagnoli
1
1
Turbomachinery and Propulsion Department, von Kàrmàn Institute for Fluid Dynamics, Chaussée de Waterloo 72, 1640 Rhode-St-Genèse, Belgium
2
Departement of Aerospace & Mechanical Engineering, University of Liège, Allée de la Découverte 9, 4000 Liège, Belgium
*
Author to whom correspondence should be addressed.
This manuscript is an extended version of the ETC2025-291 meeting paper published in the Proceedings of the 16th European Turbomachinery Conference, Hannover, Germany, 24–28 March 2025.
Int. J. Turbomach. Propuls. Power 2025, 10(3), 15; https://doi.org/10.3390/ijtpp10030015
Submission received: 8 April 2025 / Revised: 22 April 2025 / Accepted: 13 June 2025 / Published: 7 July 2025

Abstract

As designers push engine efficiency closer to thermodynamic limits, the analysis of flow instabilities developed in a high-pressure turbine (HPT) is crucial to minimizing aerodynamic losses and optimizing secondary air systems. Purge flow, while essential for protecting turbine components from thermal stress, significantly impacts the overall efficiency of the engine and is strictly connected to cavity modes and rim-seal instabilities. This paper presents an experimental investigation of these instabilities in an HPT stage, tested under engine-representative flow conditions in the short-duration turbine rig of the von Karman Institute. As operating conditions significantly influence instability behavior, this study provides valuable insight for future turbine design. Fast-response pressure measurements reveal asynchronous flow instabilities linked to ingress–egress mechanisms, with intensities modulated by the purge rate (PR). The maximum strength is reached at PR = 1.0%, with comparable intensities persisting for higher rates. For lower PRs, the instability diminishes as the cavity becomes unsealed. An analysis based on the cross-power spectral density is applied to quantify the characteristics of the rotating instabilities. The speed of the asynchronous structures exhibits minimal sensitivity to the PR, approximately 65% of the rotor speed. In contrast, the structures’ length scale shows considerable variation, ranging from 11–12 lobes at PR = 1.0% to 14 lobes for PR = 1.74%. The frequency domain analysis reveals a complex modulation of these instabilities and suggests a potential correlation with low-engine-order fluctuations.

1. Introduction

As materials and manufacturing technologies advance, modern turbofan engines continue to push turbine inlet temperatures to higher values in order to improve thermodynamic cycle efficiency. Achieving these gains depends on reliable internal cooling and sealing strategies, particularly in high-pressure turbines (HPTs), where components must withstand severe thermal loads. The purge system prevents the ingestion of hot annulus flow into the wheel space region, thereby keeping metal temperatures and thermal stresses under control. Critical to its design are the rim seal geometry and the definition of the purge rate. Numerous studies have extensively documented the advantages associated with enhanced sealing effectiveness resulting from increased cooling [1]. However, higher purge rates reduce engine cycle efficiency and are generally responsible for reinforcing secondary flows in the near-hub region, affecting the aerodynamic performance of the rotor [2,3,4]. Consequently, rim seal geometries and operating conditions must be carefully optimized to ensure reliable cooling while minimizing losses.
An additional factor to consider is the inherent unsteadiness in the rim seal region, which typically manifests itself as an asynchronous rotating structure—revealed by pressure and temperature fluctuations—that occupies frequency bands different from the blade passing or disk rotating frequencies [5]. Multiple investigations have linked these rotating structures to the localized ingestion of hot gas [6,7,8,9], causing harmful thermal cycling, reduced sealing effectiveness within the cavity, and potentially unwanted acoustic phenomena [10].
These unsteady phenomena have been documented in many studies [5], highlighting the roles of the injected purge flow rate, annulus flow conditions, and rim seal geometries. Each factor not only modifies the characteristics of the unsteadiness but can also influence its nature. Typically, these instabilities are described in terms of spectral intensity and characteristics of the rotating structures, namely rotating velocity and minimum length scale (i.e., cell count). These characteristics are determined following the methodology proposed by Beard et al. [11], which assumes the flow structures as an ideal rotating (periodic) pressure field. Using this framework, Gao et al. [12] and Bru Revert et al. [13] identified inertial waves as the trigger of the rim-seal instability. In contrast, Horwood et al. [14] and Iranidokht et al. [15] traced the onset of these instabilities to Kelvin–Helmholtz and shear-layer dynamics, while further studies by Horwood et al. [6] and Gao et al. [8] pointed to Taylor–Couette modes as the driver for unsteadiness.
From the perspective of turbine design, the rim seal shape [16,17] and operating conditions [18,19] have been shown to affect the characteristics of these structures. The study by Vella et al. [10] investigates the effect of seal clearance, the flow coefficient, and the purge rate on both sealing effectiveness and rim-seal instability. Their spectral analysis revealed a strong sensitivity to the flow coefficient, whereas the clearance, although less influential, still demonstrated that better sealing performances coincided with increased spectral activity.
Monge-Concepción et al. [9] examined the impact of vane trailing-edge cooling on rim seal design. Their findings indicated a reduction in instability in cooled cases, with no further changes to the general characteristics of the structures. In contrast, raising the purge rate caused a decrease in both the instability length scale and its rotational speed while preserving the same frequency band. Rozman et al. [7] observed a similar trend while studying transient purge rates. In addition, the time scale to transition from one cell count to another induced by a change of purge flow was measured in the order of 20–30 revolutions. Notably, the instability proved to be insensitive to the rotor speed.
Although these studies deepen our understanding of rim-seal instabilities, they also underscore the strong case dependency of the underlying mechanisms. This highlights the need for further experiments in engine-like conditions to identify the trigger mechanisms more pertinent to real applications.
This paper presents the experimental characterization of the cavity and rim-seal instabilities manifesting in an HPT stage operated at engine-relevant flow and purge conditions in the short-duration turbine test rig of the von Karman Institute. High-frequency pressure signals measured inside the cavity and in the rim seal region are exploited to characterize the flow instabilities established at different purge flow rates. The intensity, length scales, and rotational speed of the asynchronous structures are identified by applying a newly developed method based on the determination of the cross-power spectral density (CPSD) [20].
The intensity of rim-seal instability is found to be strongly modulated by the purge rate, reaching its maximum at PR = 1.0%. For higher rates, the intensity is slightly reduced, while the fluctuations are quickly dumped for lower rates. The asynchronous structures show rotating velocities of approximately 65% of the rotor speed, with a small modulation due to the operating point. More significant is the effect of the purge rate on the structure’s length scale. For the condition of higher intensity of the fluctuation (PR = 1.0%), length scales equivalent to 11 and 12 lobes are identified. For the condition of a higher purge rate (PR = 1.74%), the scale is reduced and 14 lobes are identified.
This manuscript corresponds to the paper published in the proceedings of the 16th European Turbomachinery Conference [21].

2. Experimental Setup

2.1. Test Article

The experimental campaign was carried out in the short-duration turbine test rig [22] of the von Karman Institute for Fluid Dynamics (VKI). The facility, presented in Figure 1, hosts a fully instrumented turbine stage, purposely developed for this study and described in detail by Cernat et al. [23]. The test article, a scaled-up version of the first stage of an aeroengine HPT, features 34 vanes and 48 rotor airfoils. An engine-relevant rim seal geometry is adopted at the vane-rotor interface, and the turbine rotor is operated in rainbow configuration. This feature enabled the simultaneous evaluation of six distinct sectors, each featuring a specific combination of hub and tip geometry, while sharing a common baseline airfoil profile.
Figure 2a presents the multi-sector rotor configuration. Sectors H1 and H2 features 16 blades each, characterized by the two specific hub geometries. Within each sector, two 8-blade sub-sectors are present, hosting tip geometries T1 and T2, respectively. The remaining group of 16 rotor airfoils shares the same tip geometry, T1, and is split into two sectors with hub configurations H3 and H4, each covering 8 blades. Further insights into the associated design space and optimization process, which did not involve the rim seal region, are provided by Burigana et al. [24].
Purge flow is injected in the test section at the vane/rotor rim seal through 12 pneumatic pipes distributed along the annulus in the inner cavity. Figure 2b shows the meridional view and geometric characteristics of the angel wing rim seal design. The lower region of the cavity is isolated from the disk region by a labyrinth seal.
Each test is defined by a useful time window of roughly 200 ms. During this period, engine-relevant flow conditions (Reynolds number, Mach number, pressure ratio) are established in the test section. Table 1 summarizes the flow conditions at the nominal operating point (NP), characterized by a purge rate equal to 1.74% of the main flow, and at off-design operation (PR1), characterized by a purge flow rate of 1%. High-subsonic flow conditions are established at the stage outlet, with a M r of 0.78 and a R e C R , a x of 2.76 × 10 5 . The table provides both the average values and the respective test-to-test repeatability expressed with 95% confidence interval.
The purge flow is distributed by a secondary air system featuring a pressurized air tank and sonic orifices, which allow accurate control of the mass flow injected into the cavity. A pre-swirler, presenting a swirl angle of 80 deg, ensures a purge flow entrainment coefficient of 0.37 throughout the testing time. Under nominal purge conditions, the rotational Reynolds number R θ ( = ω b 2 / ν ) and the Mach number at the vane–rotor interface M 2 are 2.6 × 10 6 and 0.81, respectively.
In addition to NP and PR1 configurations, whose time-averaged and time-resolved aerodynamics are extensively characterized in [23], the turbine stage was tested at other purge rates. These rates were imposed while maintaining the same annulus flow conditions as in Table 1. Table 2 summarizes the purge flow conditions considered in this analysis, together with the corresponding number of tests.

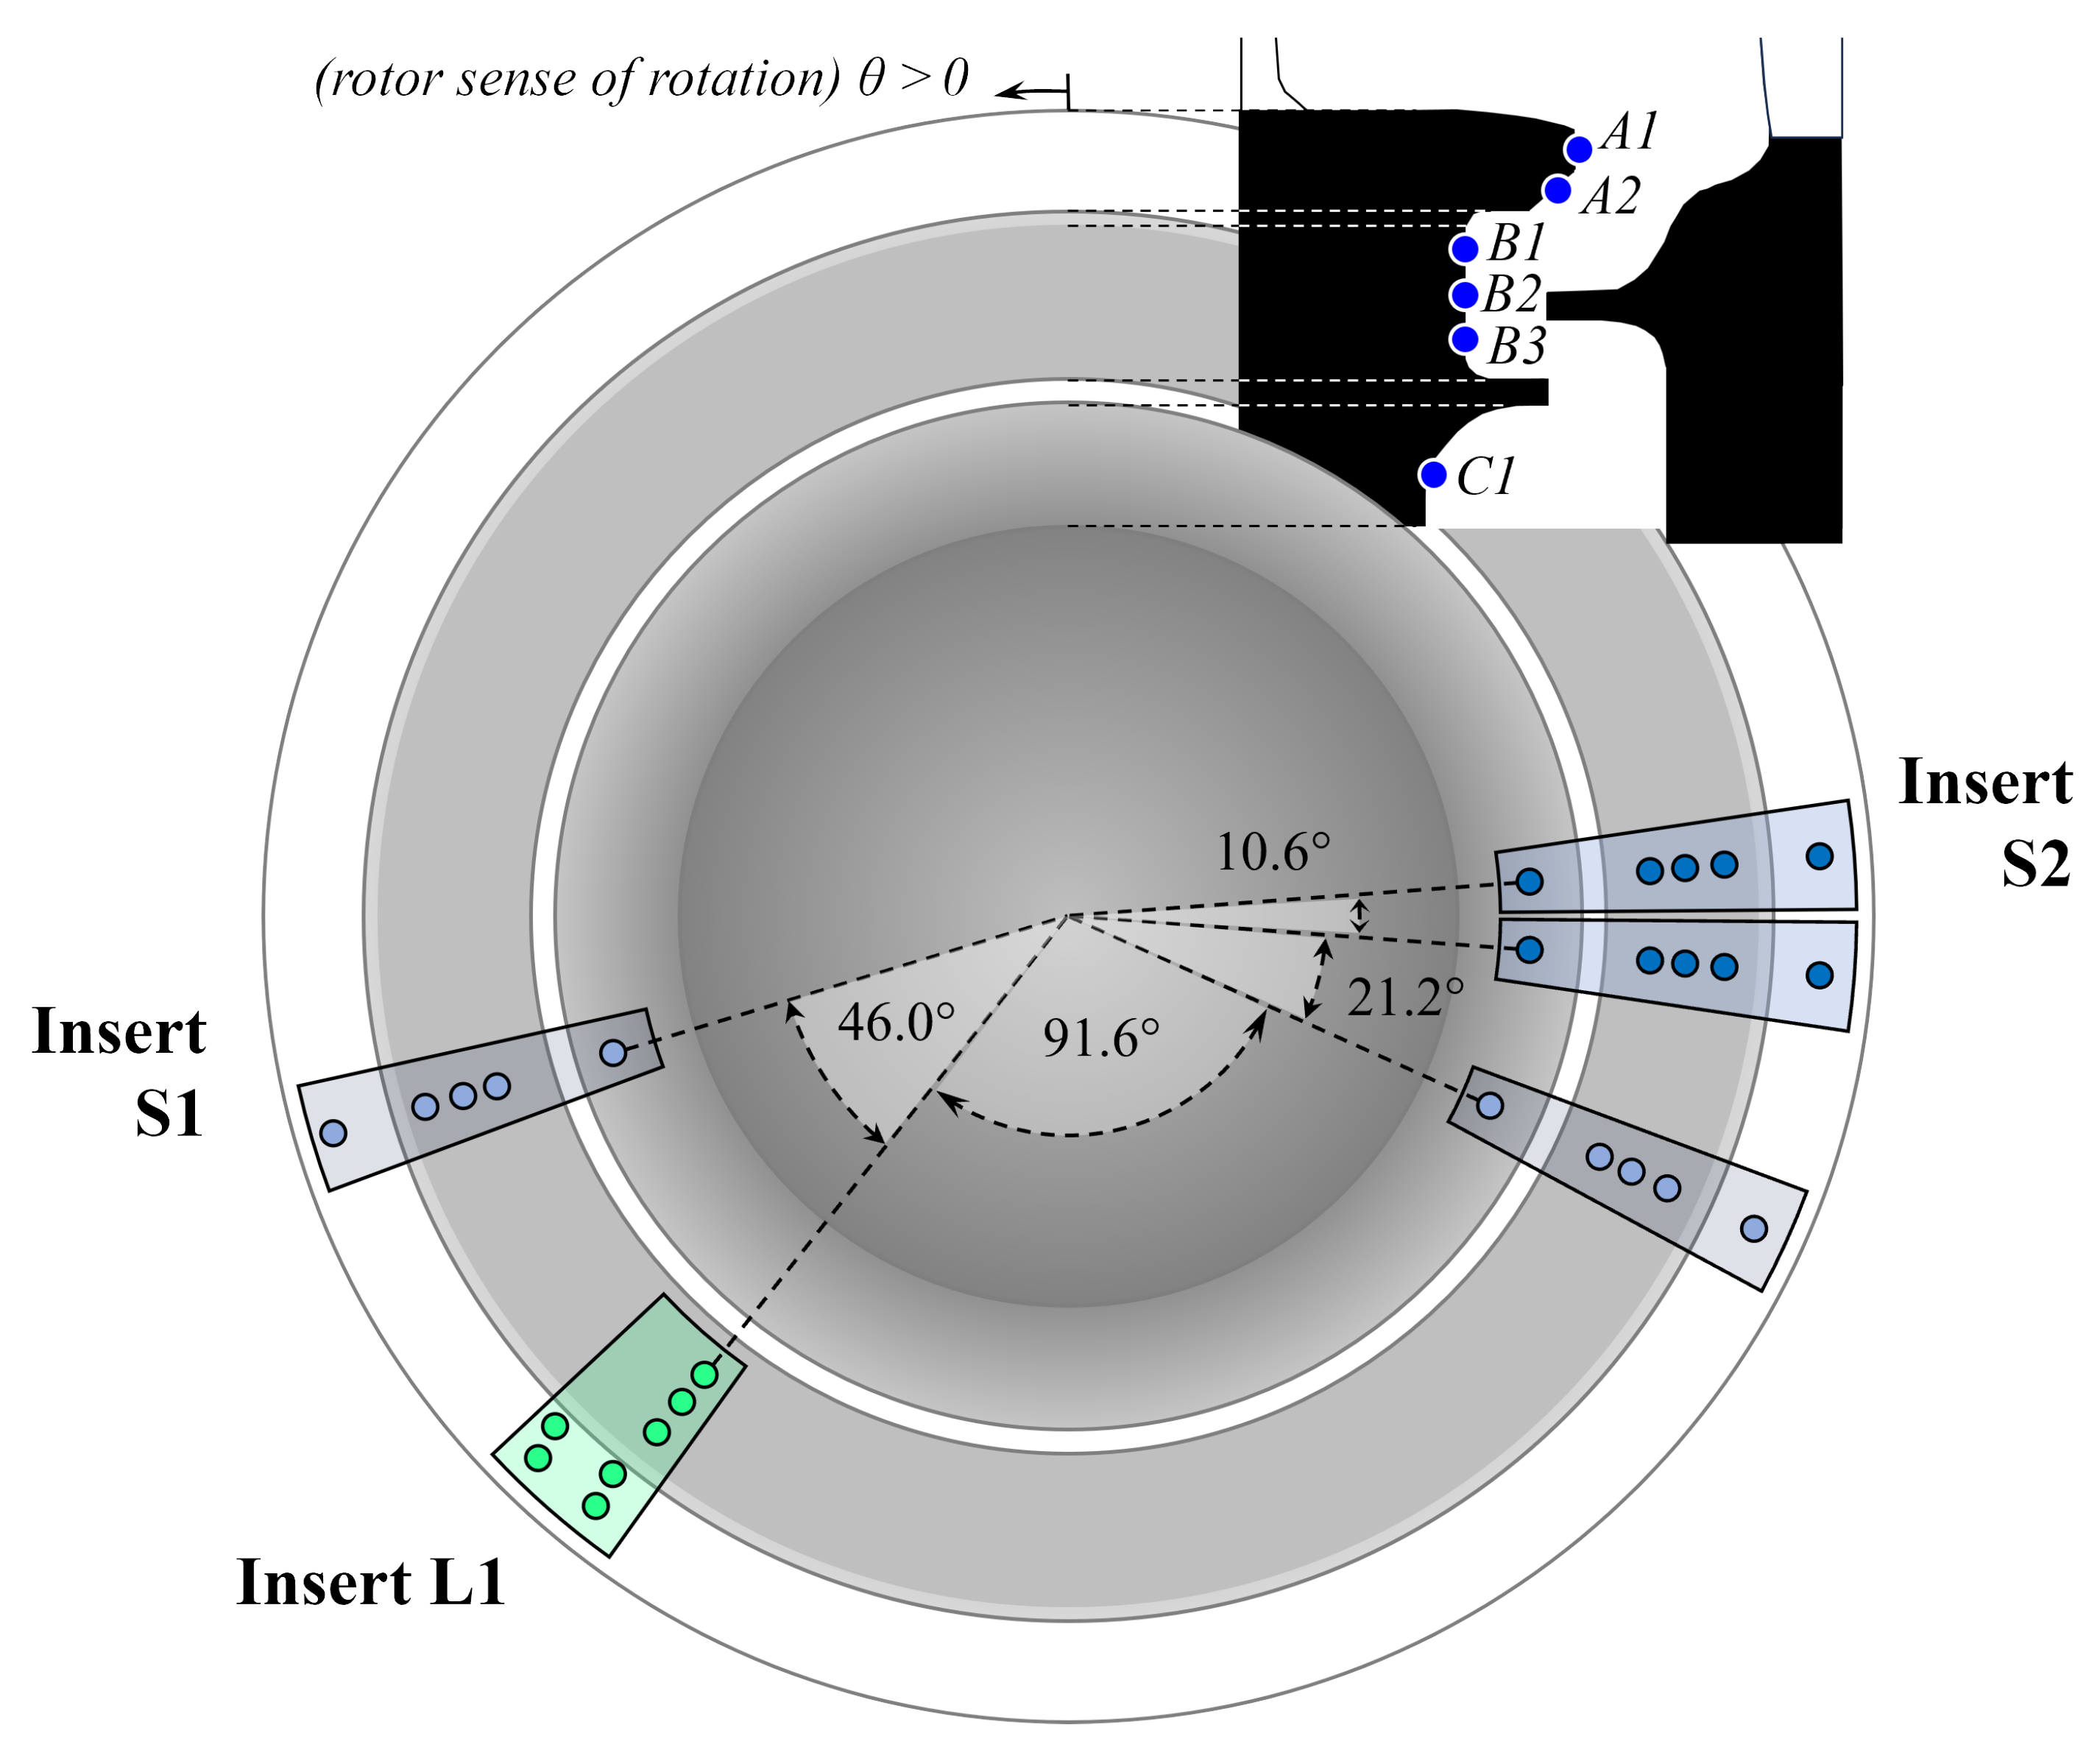
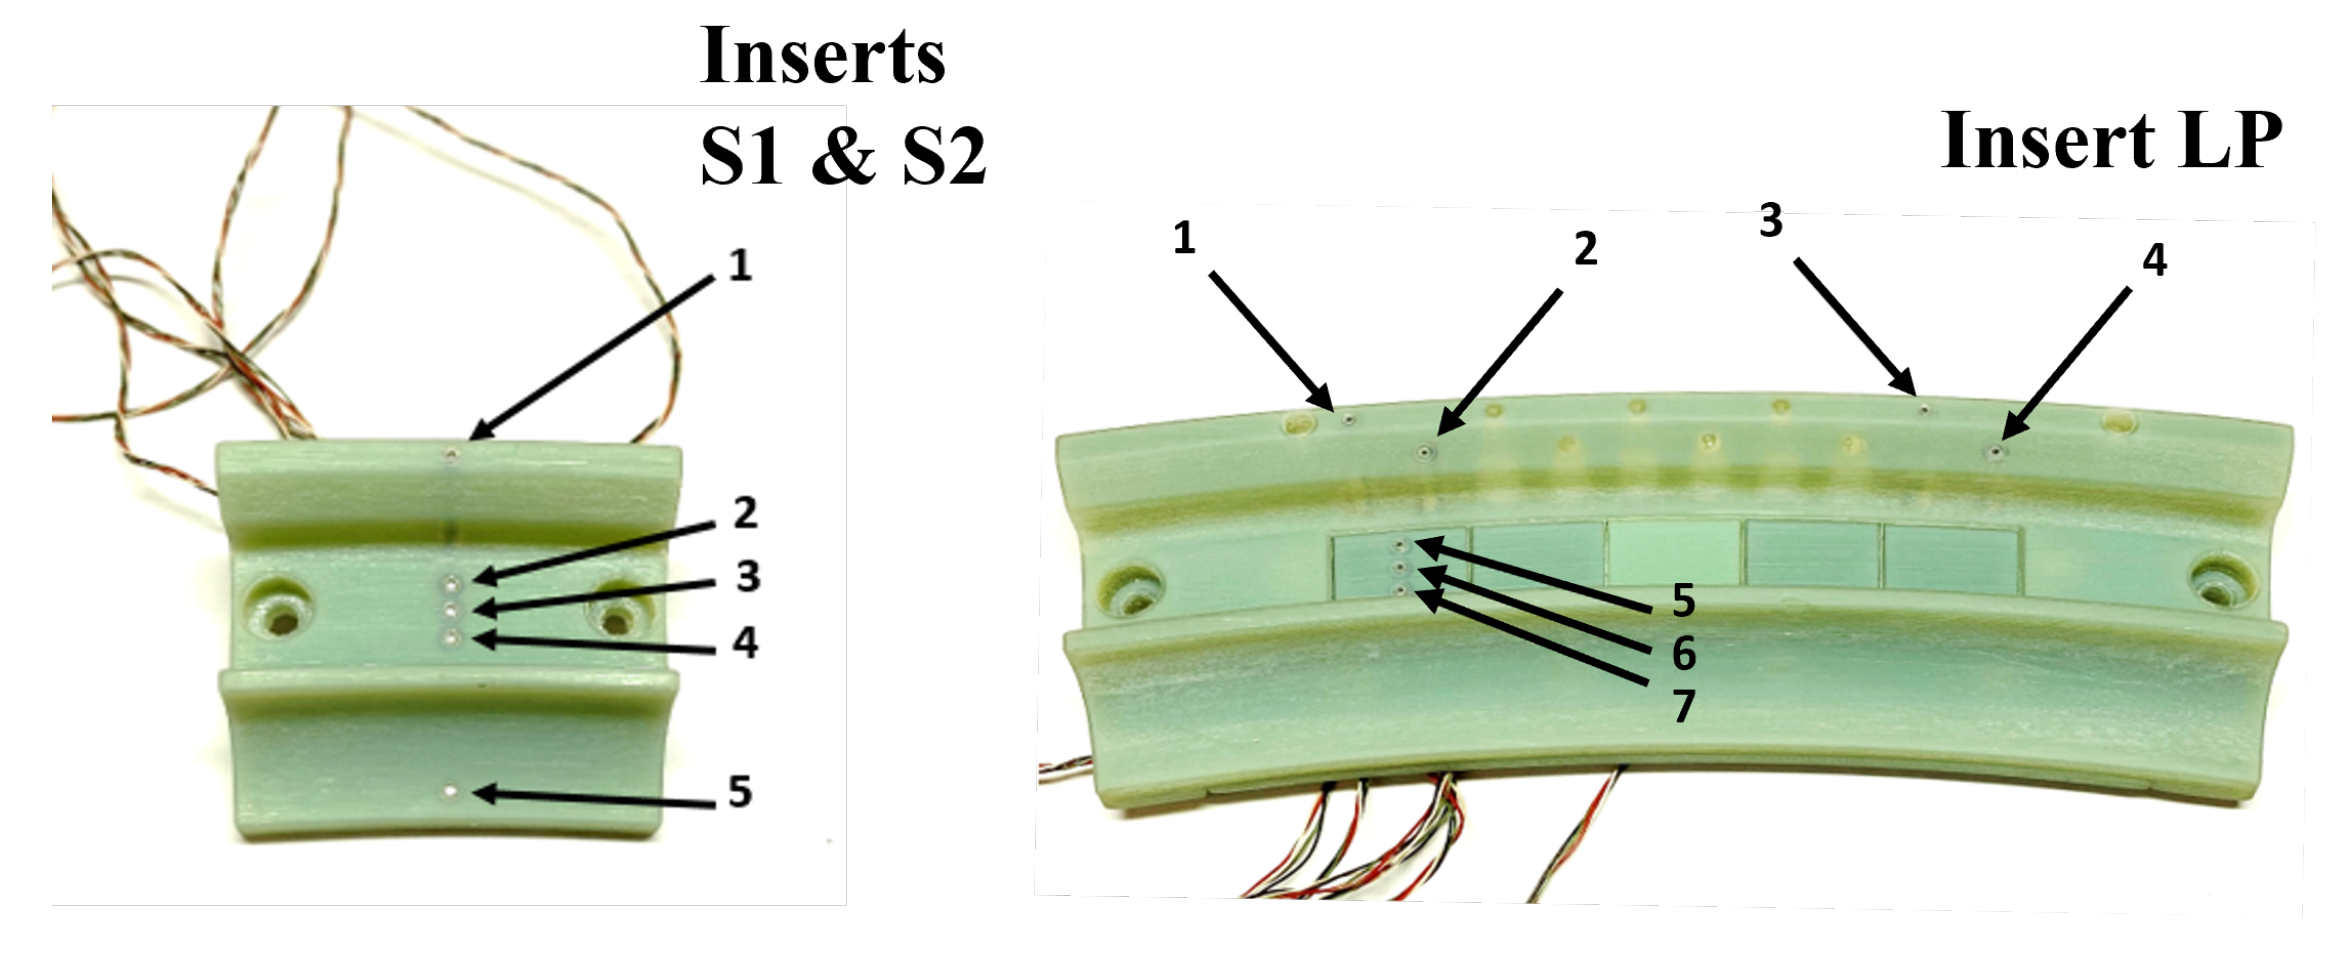
2.2. Instrumentation

The time-resolved flow field at the rim-seal is measured using an array of fast-response pressure transducers strategically positioned across the annulus via different inserts. Figure 3 presents a schematic representation of their azimuthal position. The radial location of the sensors is denoted by blue markers in the meridional view. The sensors in A1 and A2 are located on the upper lip of the rim-seal cavity. The taps in B1, B2, and B3 are installed in the buffer cavity, opposed to the rotor’s angel-wing. Lastly, transducers in C1 measure the flow within the sealed cavity.
The inserts, fabricated from ABS using rapid prototyping, are integrated into the inner stator annulus and house Kulite XCQ-062–25A fast-response piezo-resistive sensors. The ABS blocks provide low thermal conductivity and ensure precise radial alignment of the measurement inserts with the internal abradable liner, within a tolerance of 0.05 mm (measured in situ). A mechanical analysis of the ABS block imposing a pressure differential of 1 bar predicted deformations of approximately 0.04 mm, well within the 0.1 mm tolerance typical of rapid prototyping. A tap diameter of 0.6 mm was selected to achieve optimal spatial resolution while maintaining a measurement bandwidth higher than 90 kHz. In-situ calibration of the sensors [25], compensates for thermal transients during the short-duration test, reducing systematic uncertainty to ±3–5 mbar (95% CI) with a precision error of ±0.1 mbar.
Figure 4 shows pictures of the cavity pressure measurements inserts, with reference to the measurement locations indicated in Figure 3. Insert S1 and S2 are two identical components. Each insert features five transducers at the same azimuthal location, measuring across five different radial positions, namely A1, B1, B2, B3, and C1. Both inserts were installed in two different annular locations (blue sectors in Figure 3) and used across all operating conditions. Insert L1 consists of two pairs of sensors at positions A1 and A2, separated by an angle of 0.8 times the vane periodicity, and three sensors at radial locations B1, B2, and B3. Similar to S1 and S2, L1 was tested across all operating conditions.

2.3. Signal Acquisition

To enhance measurement resolution, the analog signals from the fast-response transducers are split into two components, a low-frequency (LF) signal and a high-frequency (HF) signal. Both components are generated through analog filters with known gain and frequency responses, calibrated between 0 Hz and 1 MHz. The LF signal, low-pass filtered at 500 Hz and acquired at 10 Hz with 16-bit resolution, captures lower frequency dynamics. The HF signal, band-pass filtered from 60 Hz to 200 kHz and acquired at 1 MHz with 16-bit resolution, enables the acquisition of the measurements’ unsteady component with enhanced resolution. Upon A/D conversion, the signal is reconstructed by combining the quasi-steady LF component with the HF signal.
A 200 ms period is analyzed to ensure the stabilization of steady and unsteady fields in the cavity, allowing for a consistent comparison across all tests. Analyses of characteristic timescales in the annulus, rim seal, and possible acoustic disturbances support the choice of this time window. In the annulus, high axial velocities determine a through-flow time below 1 ms. In the rim seal, mean seal velocities in the order of 10 0 1 m/s translate to residence times of 1–10 ms. In the tangential direction, the traveling time for one revolution of an acoustic perturbation is approximately 5–10 ms; whereas the asynchronous structures themselves, traveling at roughly two-thirds of the rotor speed, require about 15 ms for a full rotation. All of these timescales are at least an order of magnitude shorter than both the measurement window (200 ms) and the facility’s initial transient phase (100 ms). These considerations, together with the stable power spectral density (PSD) observed, suggest that the flow was fully developed within the selected interval.
Moreover, Rozman et al. [7] reported no effect of rotor speed on the instability characteristics, thus ruling out major velocity-driven changes, but did observe a sudden change in rotation speed and lobe count at specific purge rates, occurring within 20–30 revolutions and marked by PSD changes. Considering the approximate 20 rotor revolutions within the 200 ms window and the stable PSD behavior, these findings further solidify the hypothesis that the rotating structures remain fully established throughout the test window.

3. Methodology

The asynchronous instabilities developed in the cavity region are analyzed in different steps. Initially, the bandwidth occupied by the instabilities is identified through the power spectral density (PSD) of the cavity unsteady pressure signals. The root-mean-square (RMS) of the pressure fluctuations is calculated to assess the intensity of the cavity modes (CMs) instability. Then, the mode characteristics are determined through the analysis of the cross-power spectral density (CPSD) and cross-correlation.

3.1. Spectral Analysis

The PSD distributions are computed via the Welch method utilizing the MATLAB function ’pwelch’. Default Hamming windowing is applied with an 80% overlap between windows. A window size of 100 k samples, corresponding to a 10 Hz frequency resolution, is chosen to impose a separation of one order of magnitude between the PSD resolution and one engine order ( E O = 98.8 Hz ). To allow consistent comparisons between tests, the PSD distributions are computed for the normalized pressure fluctuation P ˜ ( t ) , defined as ( P ( t ) P a v g ) / P a v g .
The analysis of the spectra is performed following the procedure described by Da Valle et al. [20]. The settings for the computation of the spectra are applied to each test, and the resulting PSDs are averaged for each sensor. Under NP and PR1 conditions, all sensors in inserts S1, S2, and PL already display the asymptotic behavior of the average distributions for a reduced number of tests (5). In the complete analysis (not provided here for brevity), the number of revolutions considered exceeds 300 for both operating conditions.
For OD-A, -B, -C, and -D conditions, the number of samples is limited to ∼40 revolutions each. Nonetheless, these operating points register a modulation of the CMs instability intensity while preserving features similar to NP and PR1 measurements. This suggests a common flow mechanism responsible for the instability, with similar PSD repeatability levels. This justifies the inclusion of these sets of measurements in the spectra analysis.

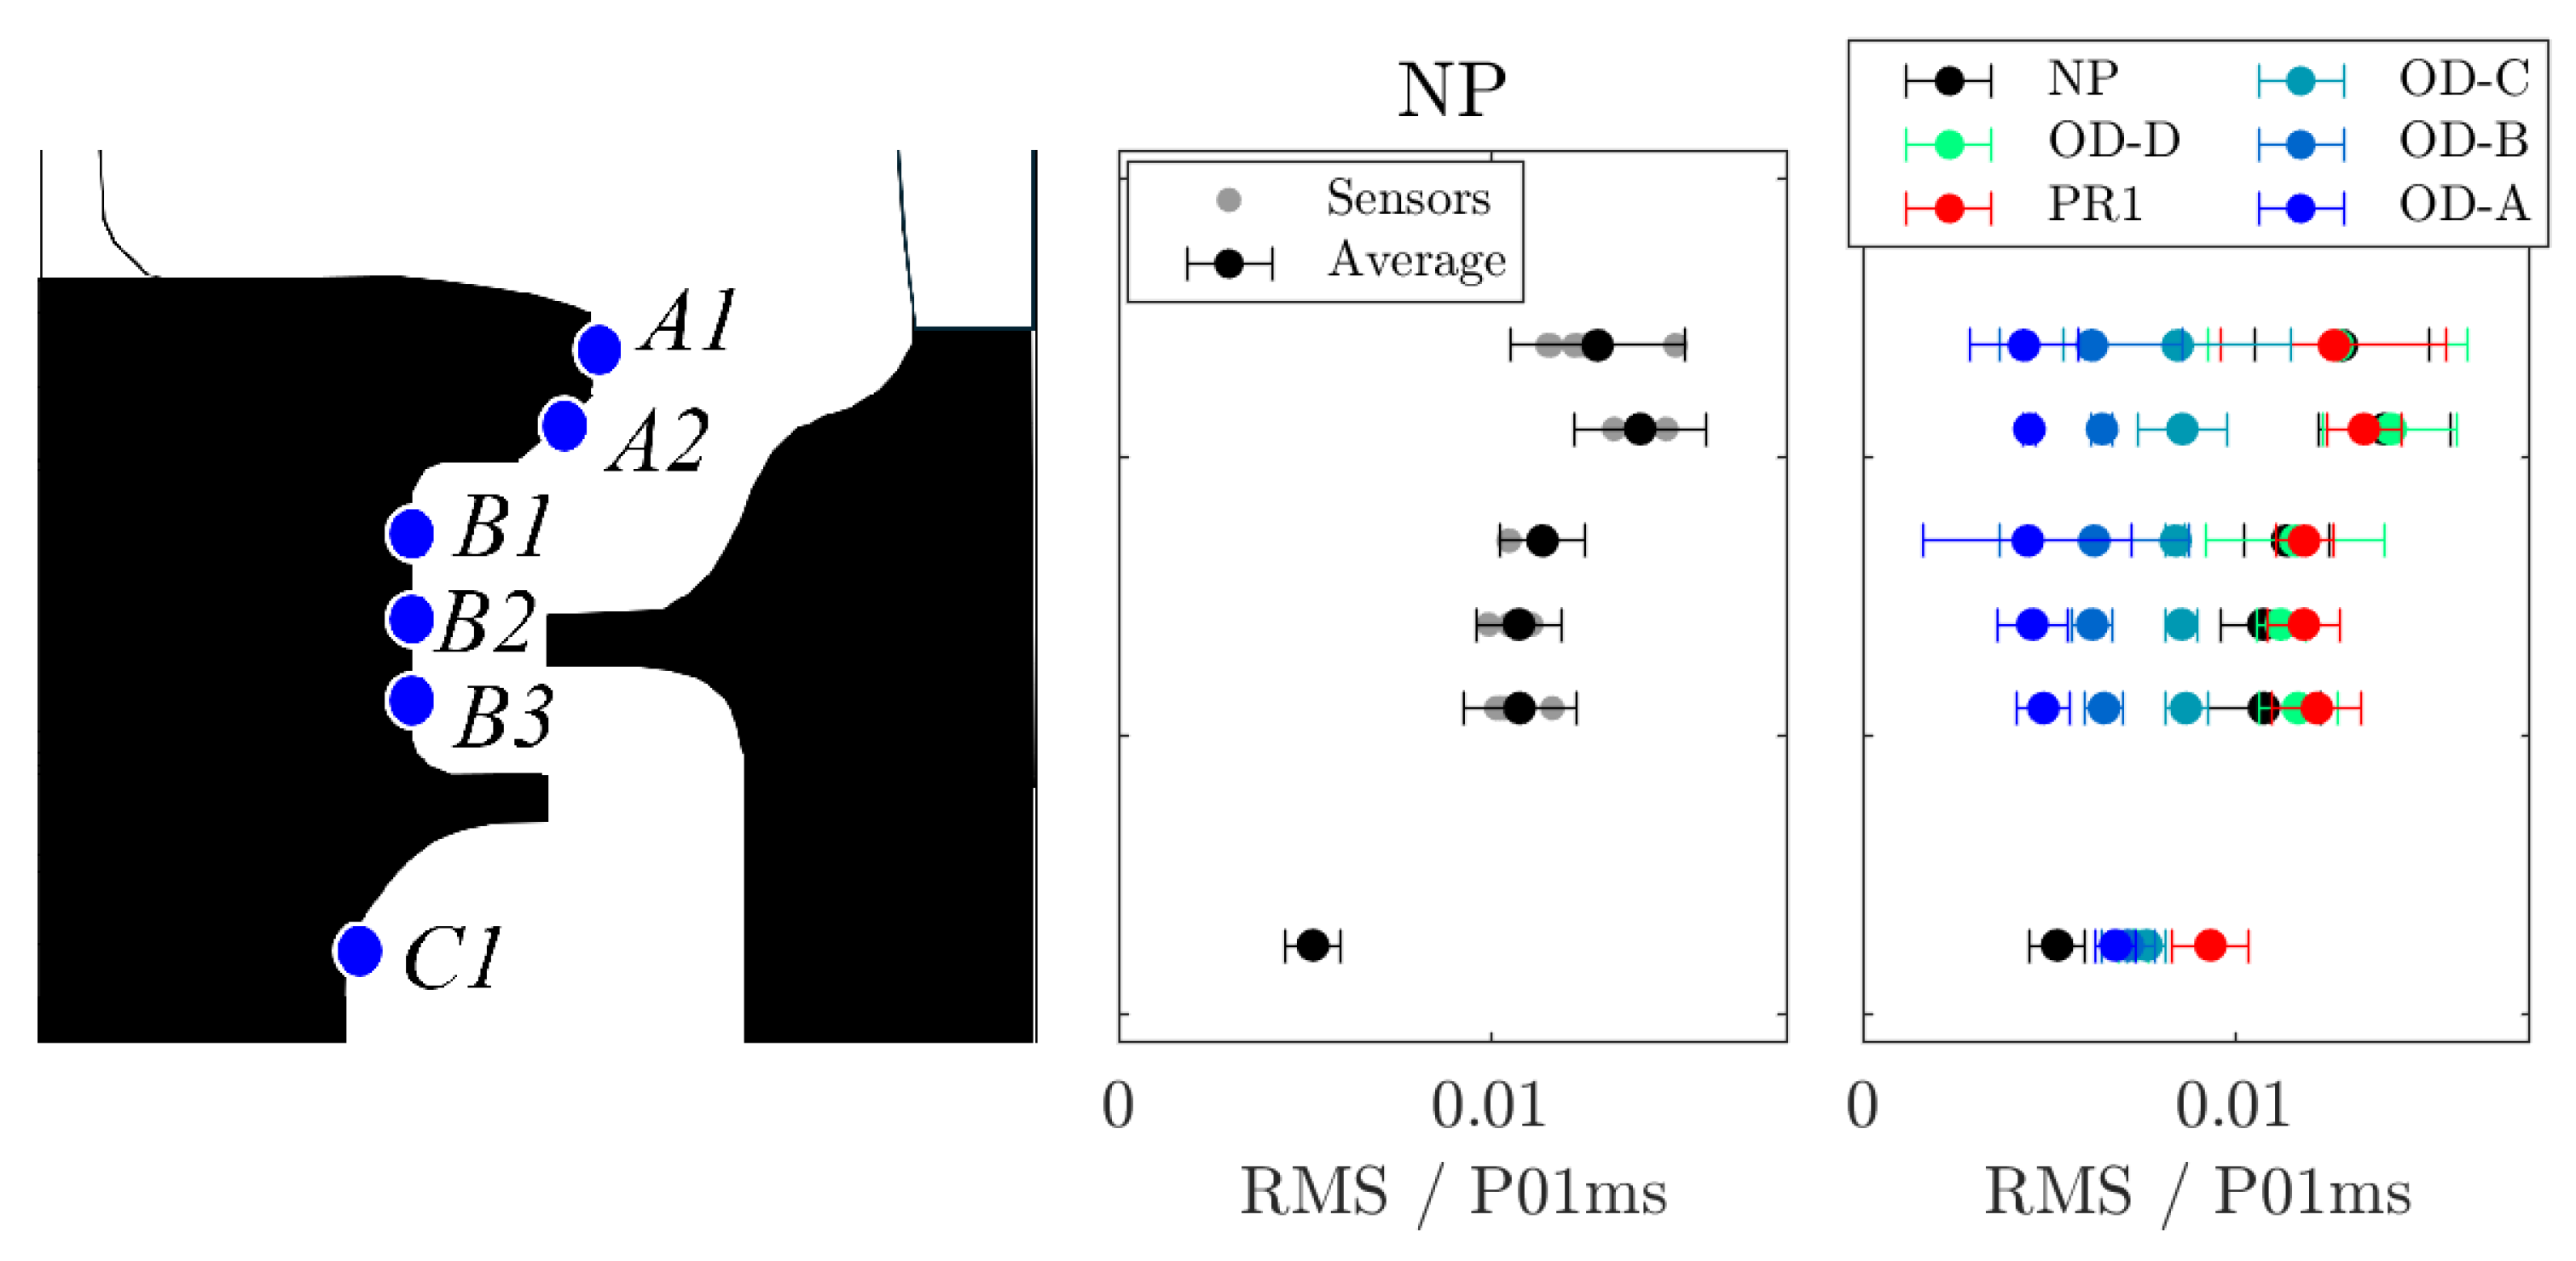
3.2. Instability Intensity Quantification

The intensity of the pressure fluctuation induced by the CMs is evaluated following the procedure described by Da Valle et al. [20]. For each test, a pass-band filter is applied to isolate the region of the spectra occupied by the CMs. The single test fluctuation amplitude is determined from the RMS expressed at a 95% CI (i.e., = 1.96 · σ ). Then, the mean value for each sensor is calculated from all available experimental tests.
This methodology enables a precise assessment of the unsteadiness associated with the entire bandwidth of the CMs. This approach is more robust than evaluating the spectral intensity at the peak(s) locations, which may shift and evolve during (or between) tests. Da Valle et al. [20] show that, even in the presence of considerable PSD variability, the intensity of fluctuation (i.e., the area beneath the PSD distribution) remains stable. This finding justifies the application of this procedure for datasets with limited sample sizes (i.e., measurements at OD-A, -B, -C, and -D). The stability displayed by the PSD distribution provides additional assurance of the validity of the results.

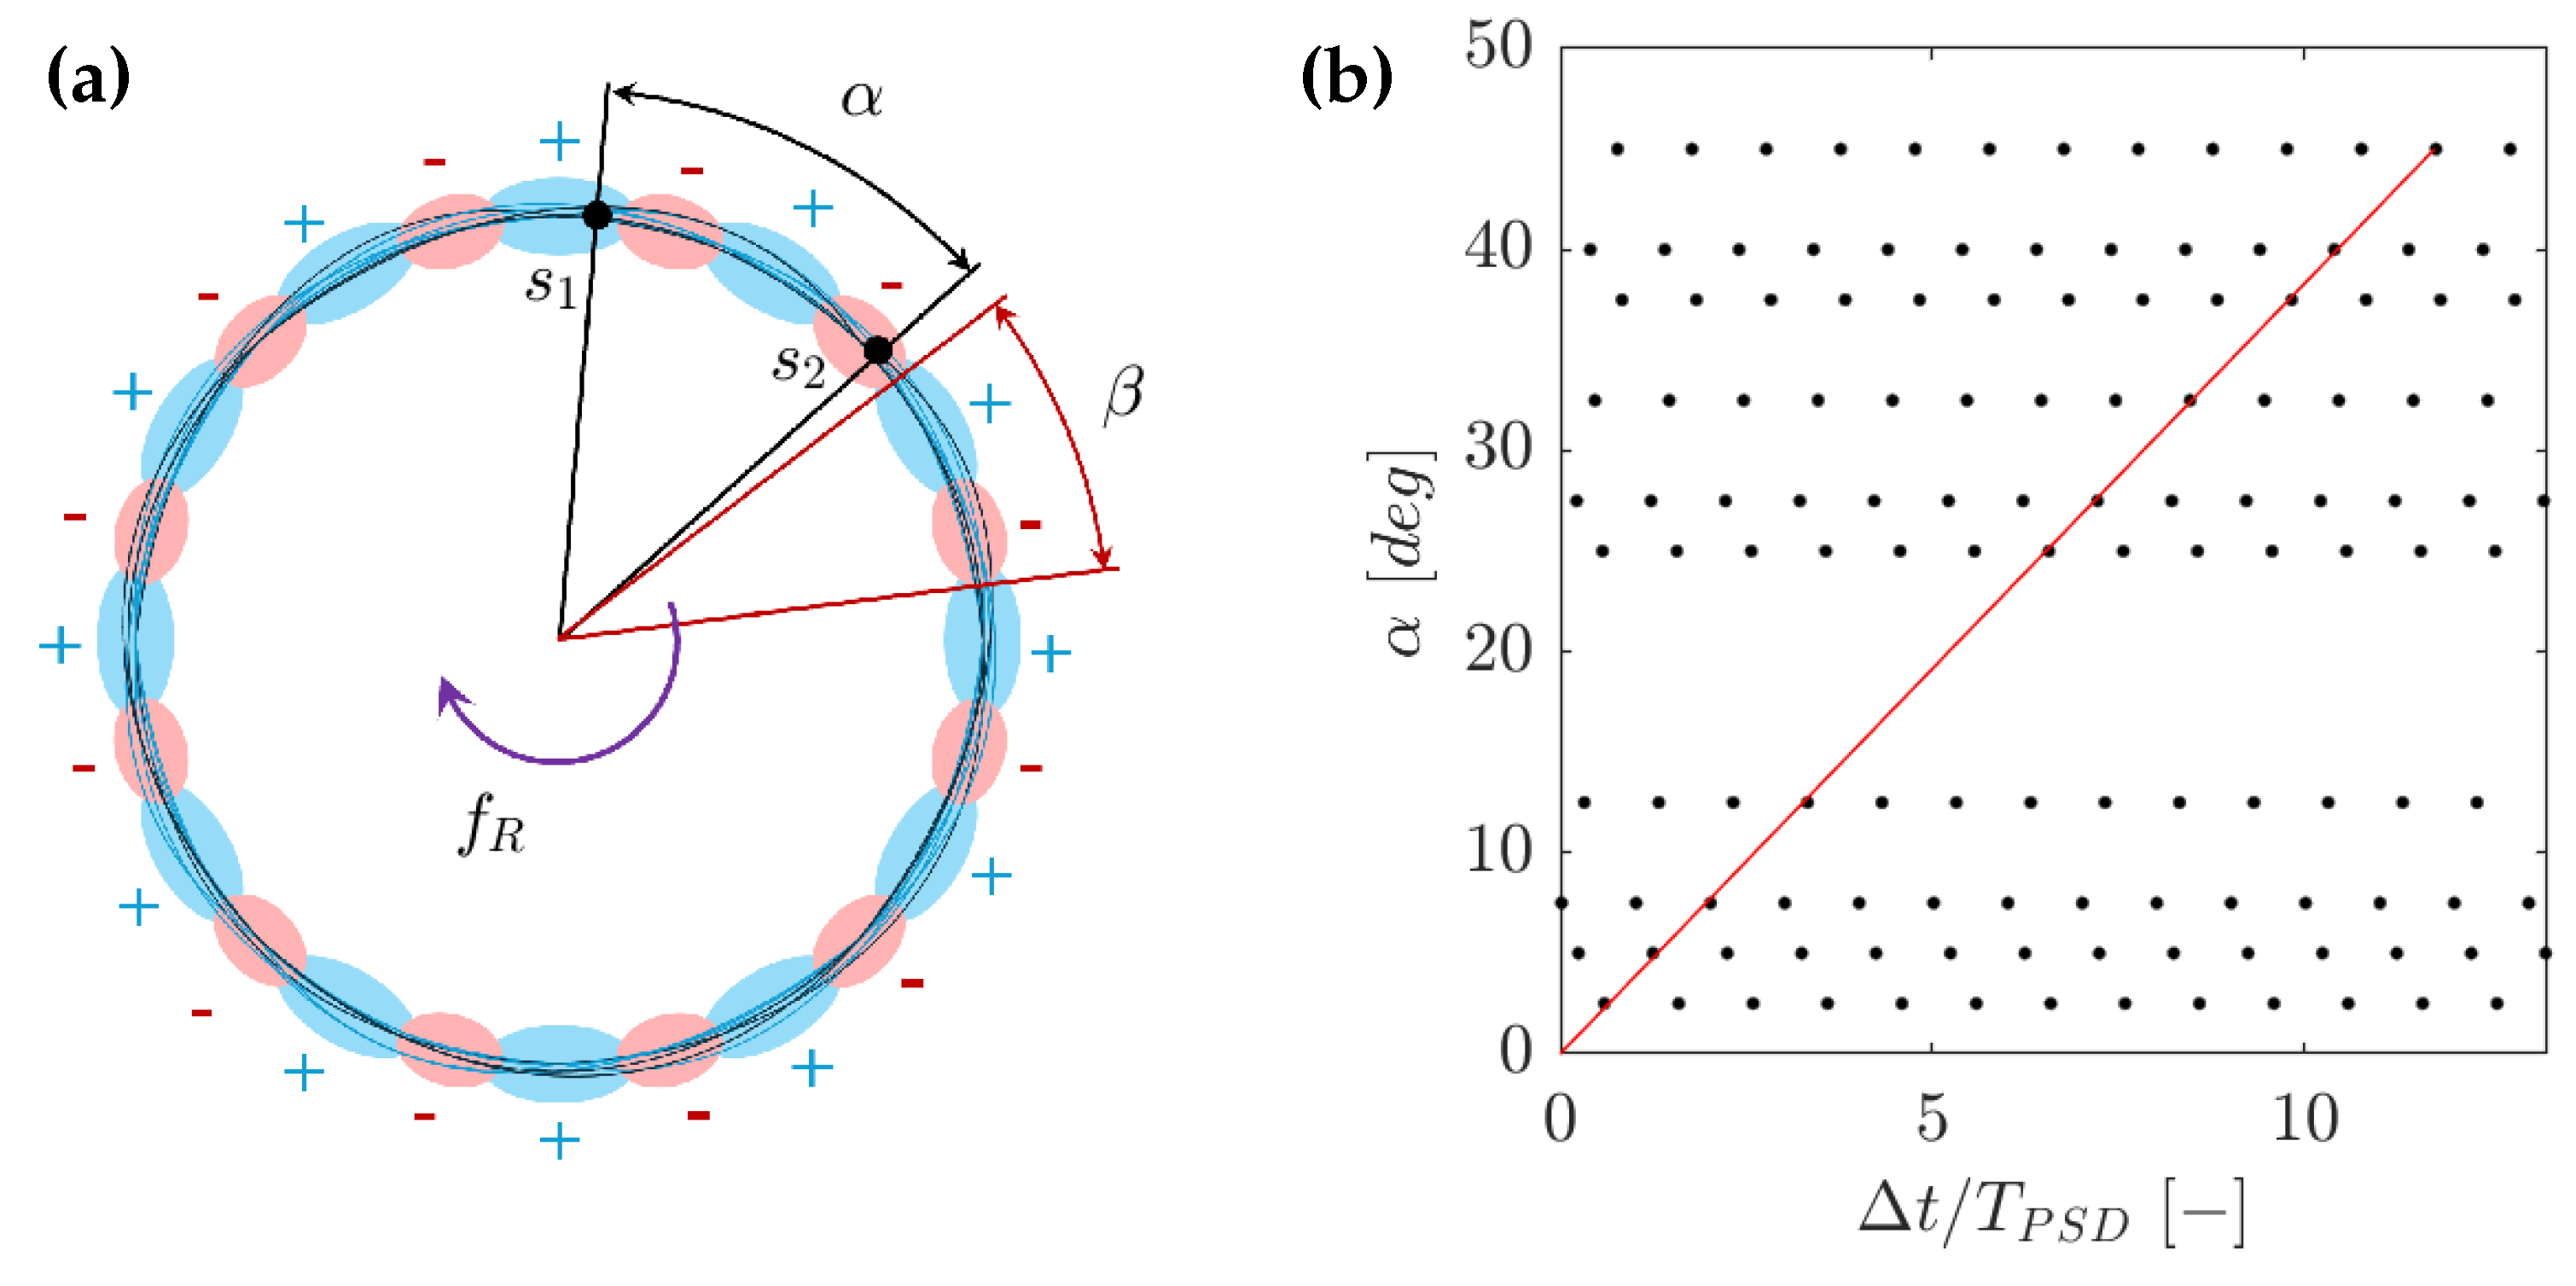
3.3. Cavity Mode Analysis

The analysis of cavity modes typically relies on fast-response pressure measurements, detecting modes as a periodic pressure field with a spatial length scale β rotating at a specific speed v R = 2 π f R . Figure 5a provides a schematic representation of the periodic pressure field displayed as a finite number of lobes (i.e., the peak count) n = 2 π / β .
Typically, the number and rotational velocity of the cavity flow structures are determined by the cross-correlation of signals sampled simultaneously at different peripheral locations across the annulus, following the methodology described by Beard et al. [11]. More recently, Da Valle et al. [20] proposed a methodology based on the properties of the cross-power spectral density (CPSD), which further improves the accuracy of the cavity mode characterization.

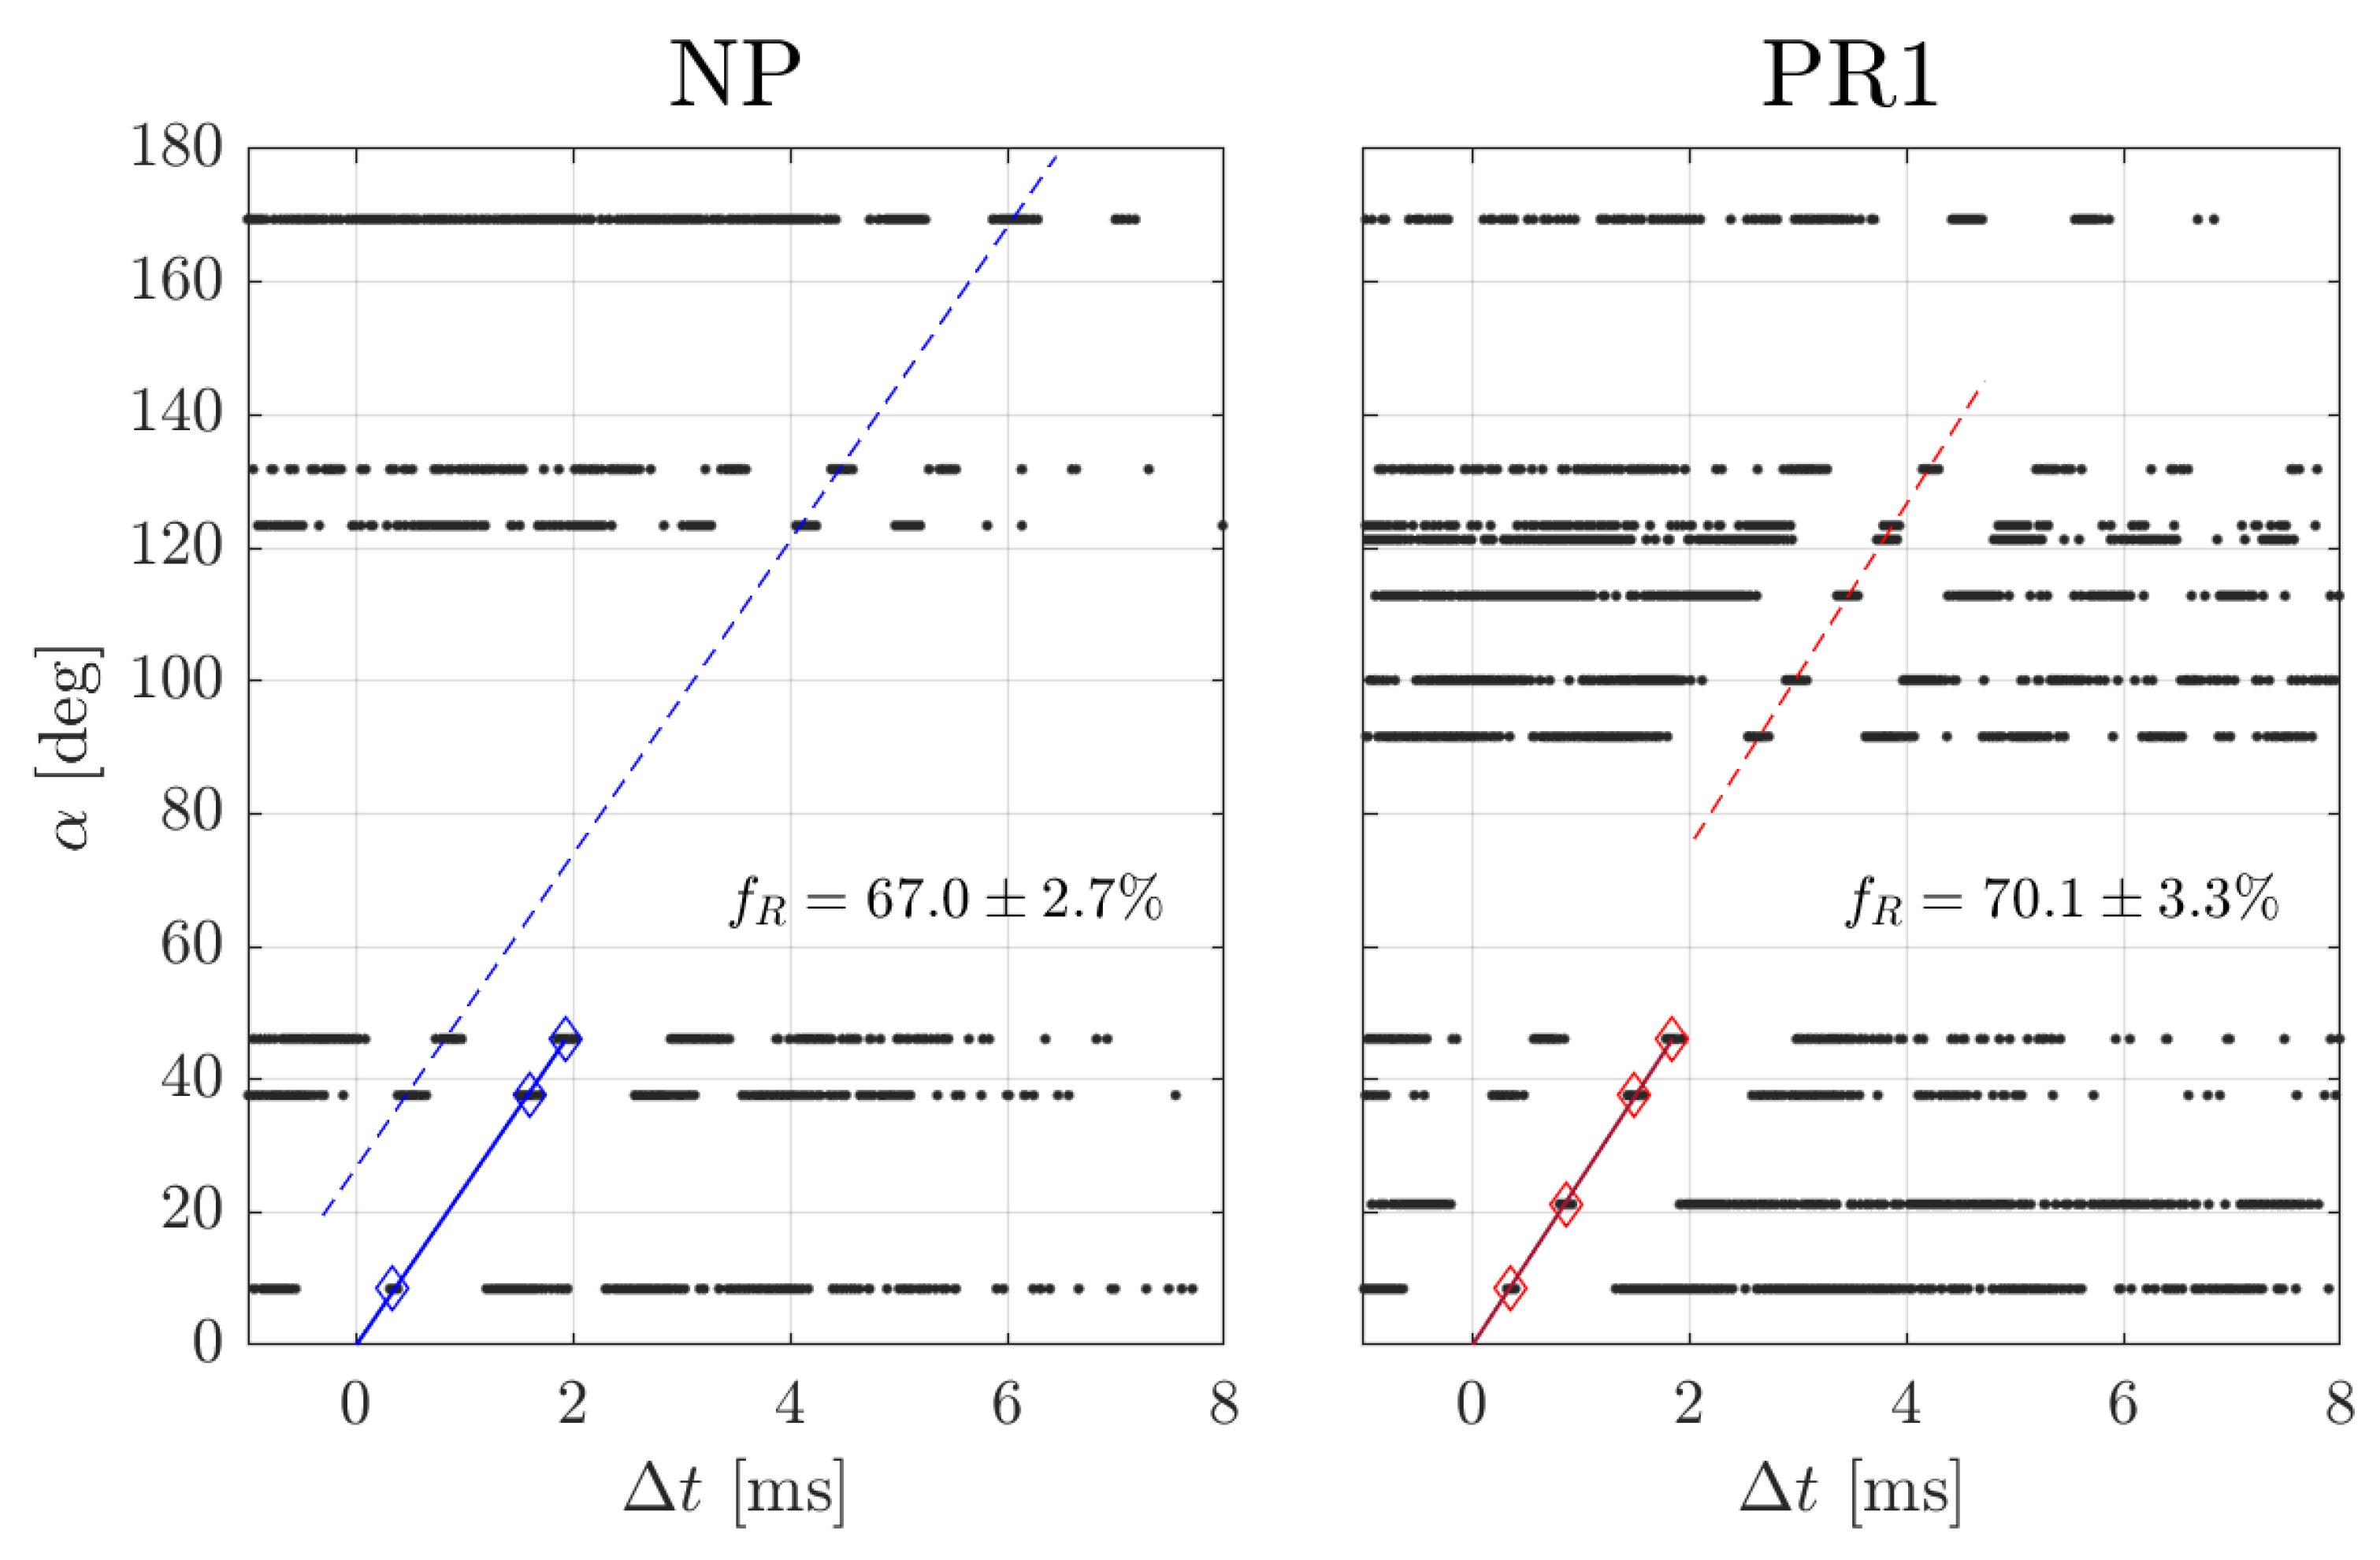
3.3.1. Cross-Correlation Method

The cross-correlation technique is based on determining the time delay Δ t α associated with the CM structures traveling between two sensors. The delay is determined through the cross-correlation of the pressure signals, which are pass-band filtered to isolate the CM frequency. By knowing the relative distance between the two sensors α , the frequency of the CM fluctuation observed by the pressure transducers f P S D , and by assuming that the sensor distance is smaller than the wavelength of the rotating structures ( β < α ), velocity and lobe counts are computed from f R = α / ( 2 π Δ t α ) and n = f P S D / f R , respectively.
To avoid inferring a priori the minimum distance between two consecutive lobes, Beard et al. [11] proposed iterating the time delay computation for various sensor combinations and across multiple time windows (typically of the duration of one rotor revolution). Then, the data are collected into time lag plots ( Δ t α vs α plots), from which n and f R are identified from the linear regression that better fits the measured time lags. Figure 5b provides an example of an ideal time lag plot where the time delay is normalized through the frequency f P S D . The optimal regression, represented by the red line, is defined by the linear fit connecting the delays for each angular position.
In this study, the time lag plot is populated considering all available tests. The plot was generated including the most energetic peaks of the cross-correlation, calculated for time windows of one revolution employing the MATLAB function ‘xcorr’. The lag measurements are organized in clusters, generating a pattern similar to that in Figure 5b, where the black dots are representative of the centroids of the clusters. The set of clusters associated with the best combination is selected as the one minimizing the regression error. Finally, a bootstrapping procedure is applied to the set, and n and f R are computed, along with their uncertainties, from the best regression slope m c o r r as f R = m c o r r / 360 and n = f P S D / f R . This procedure allows for a rigorous assessment of the instability characteristics and of the precision of the measurement.

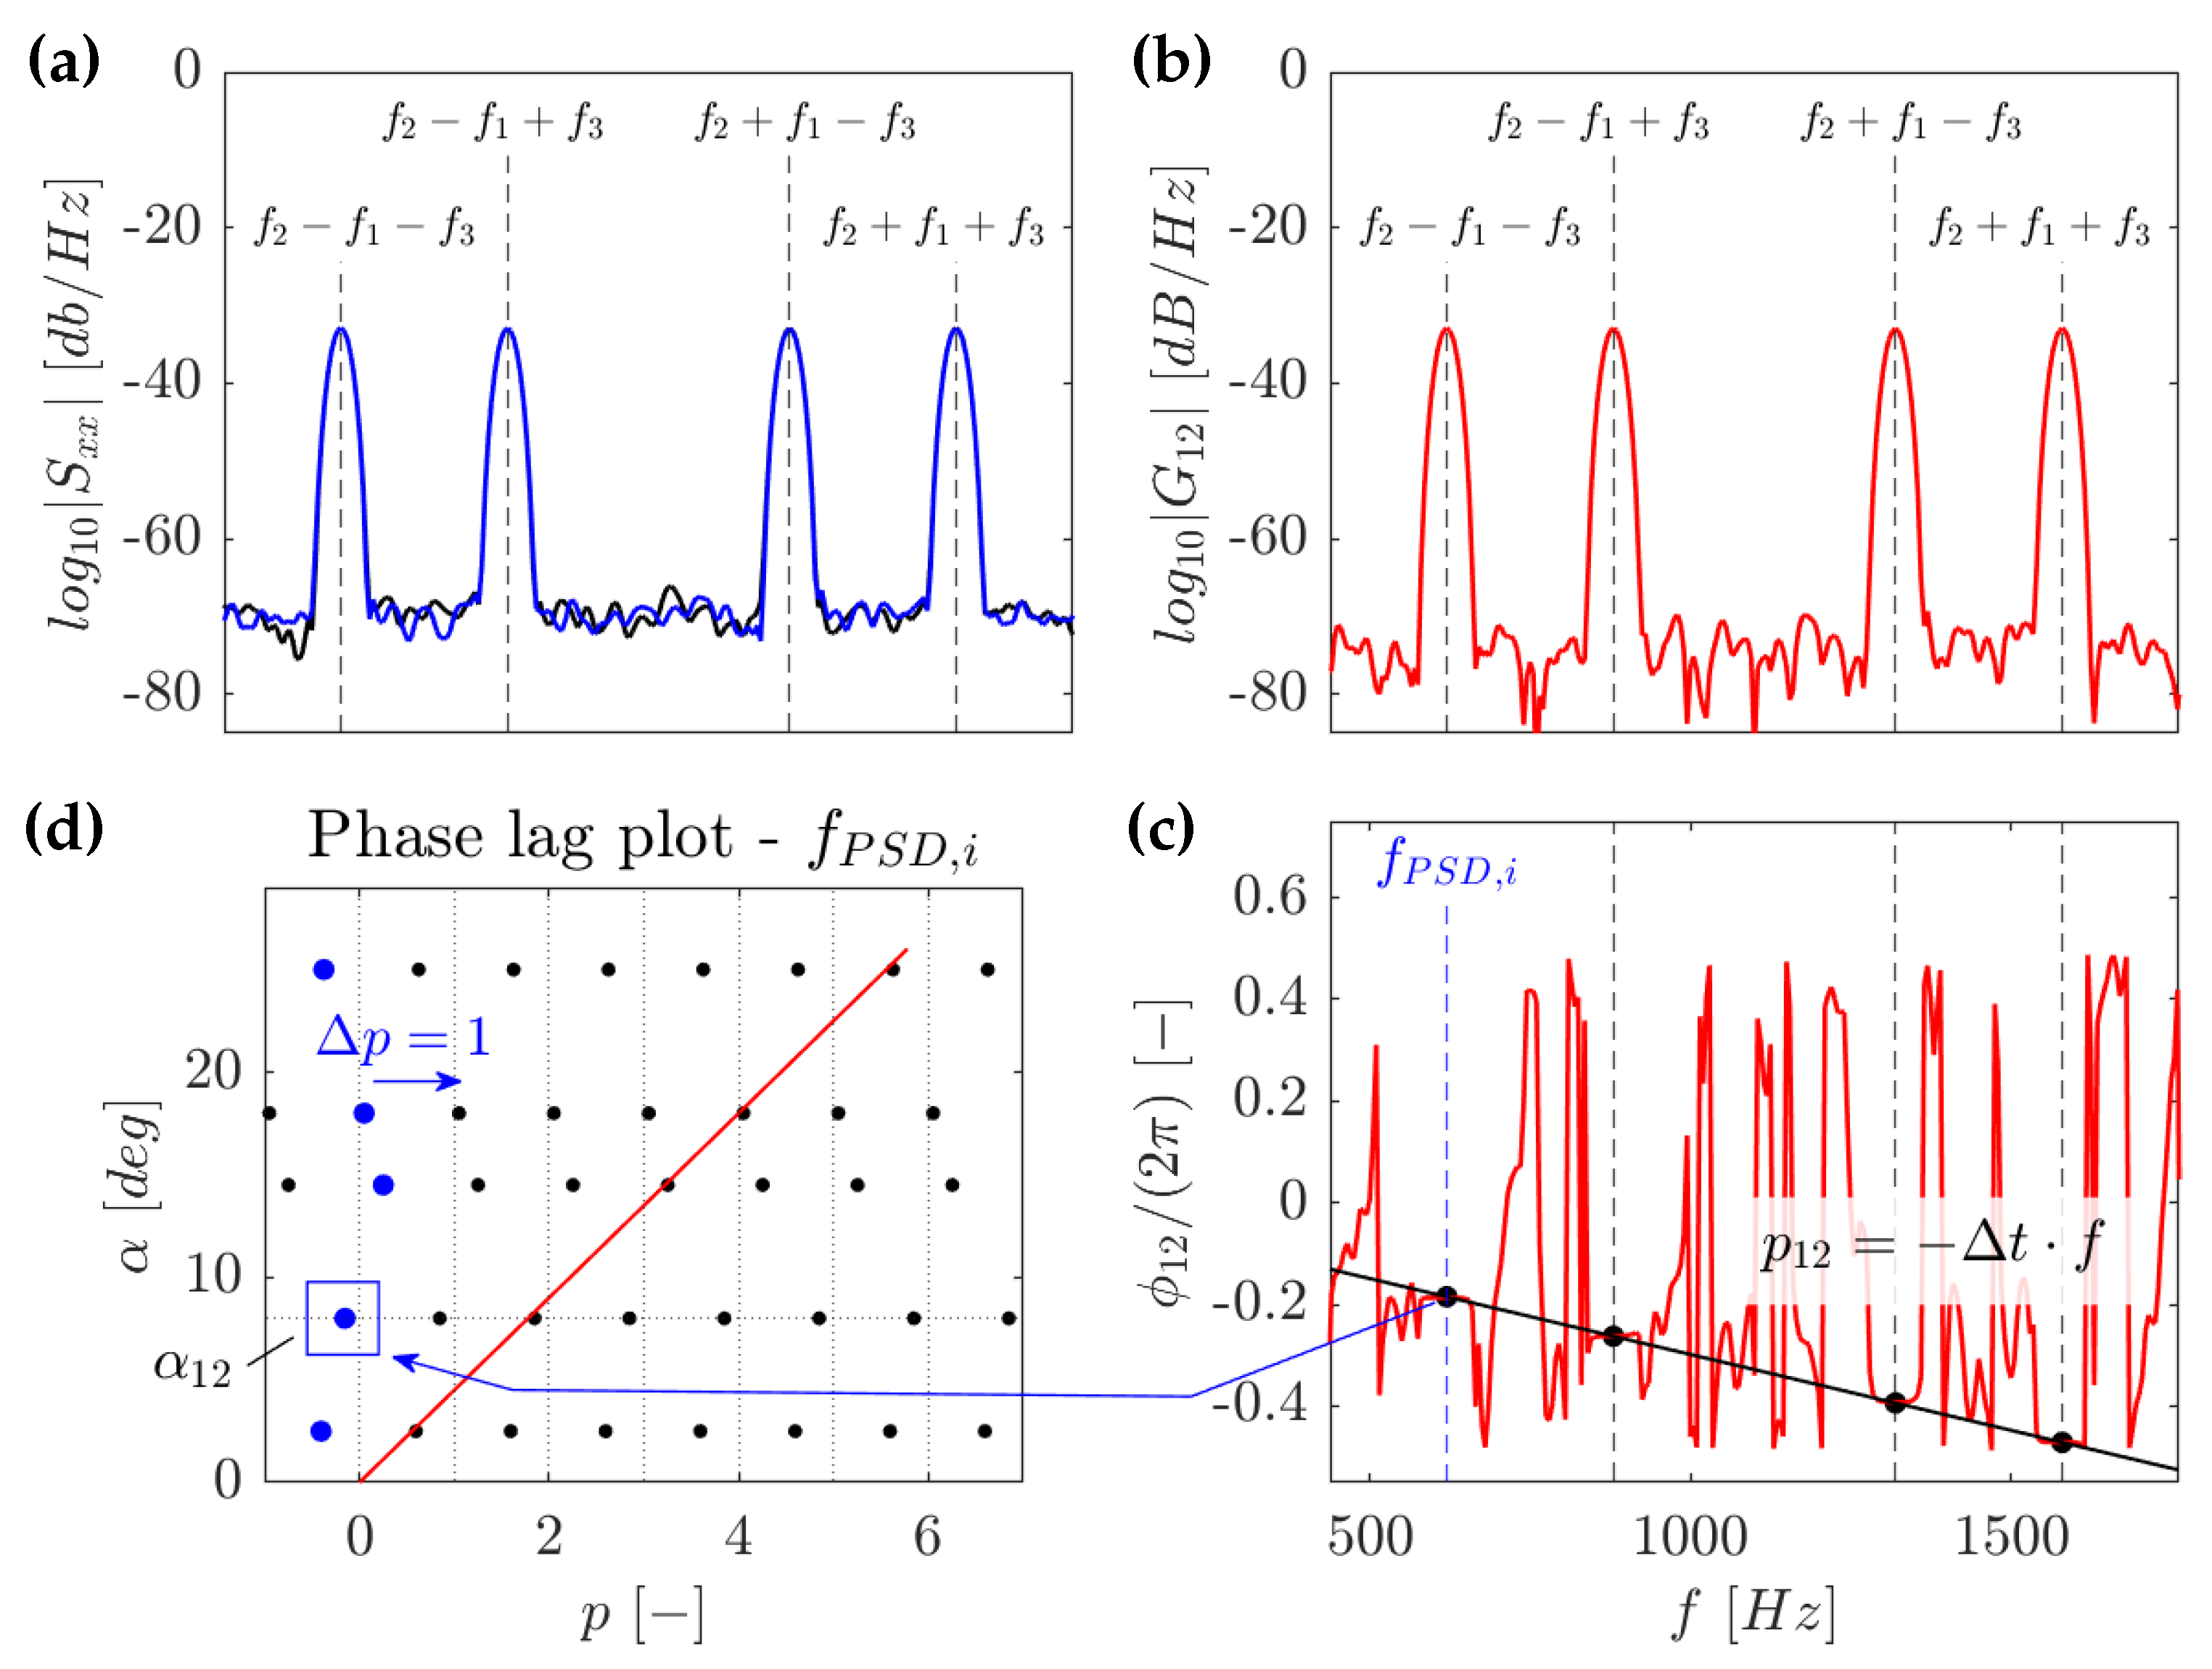
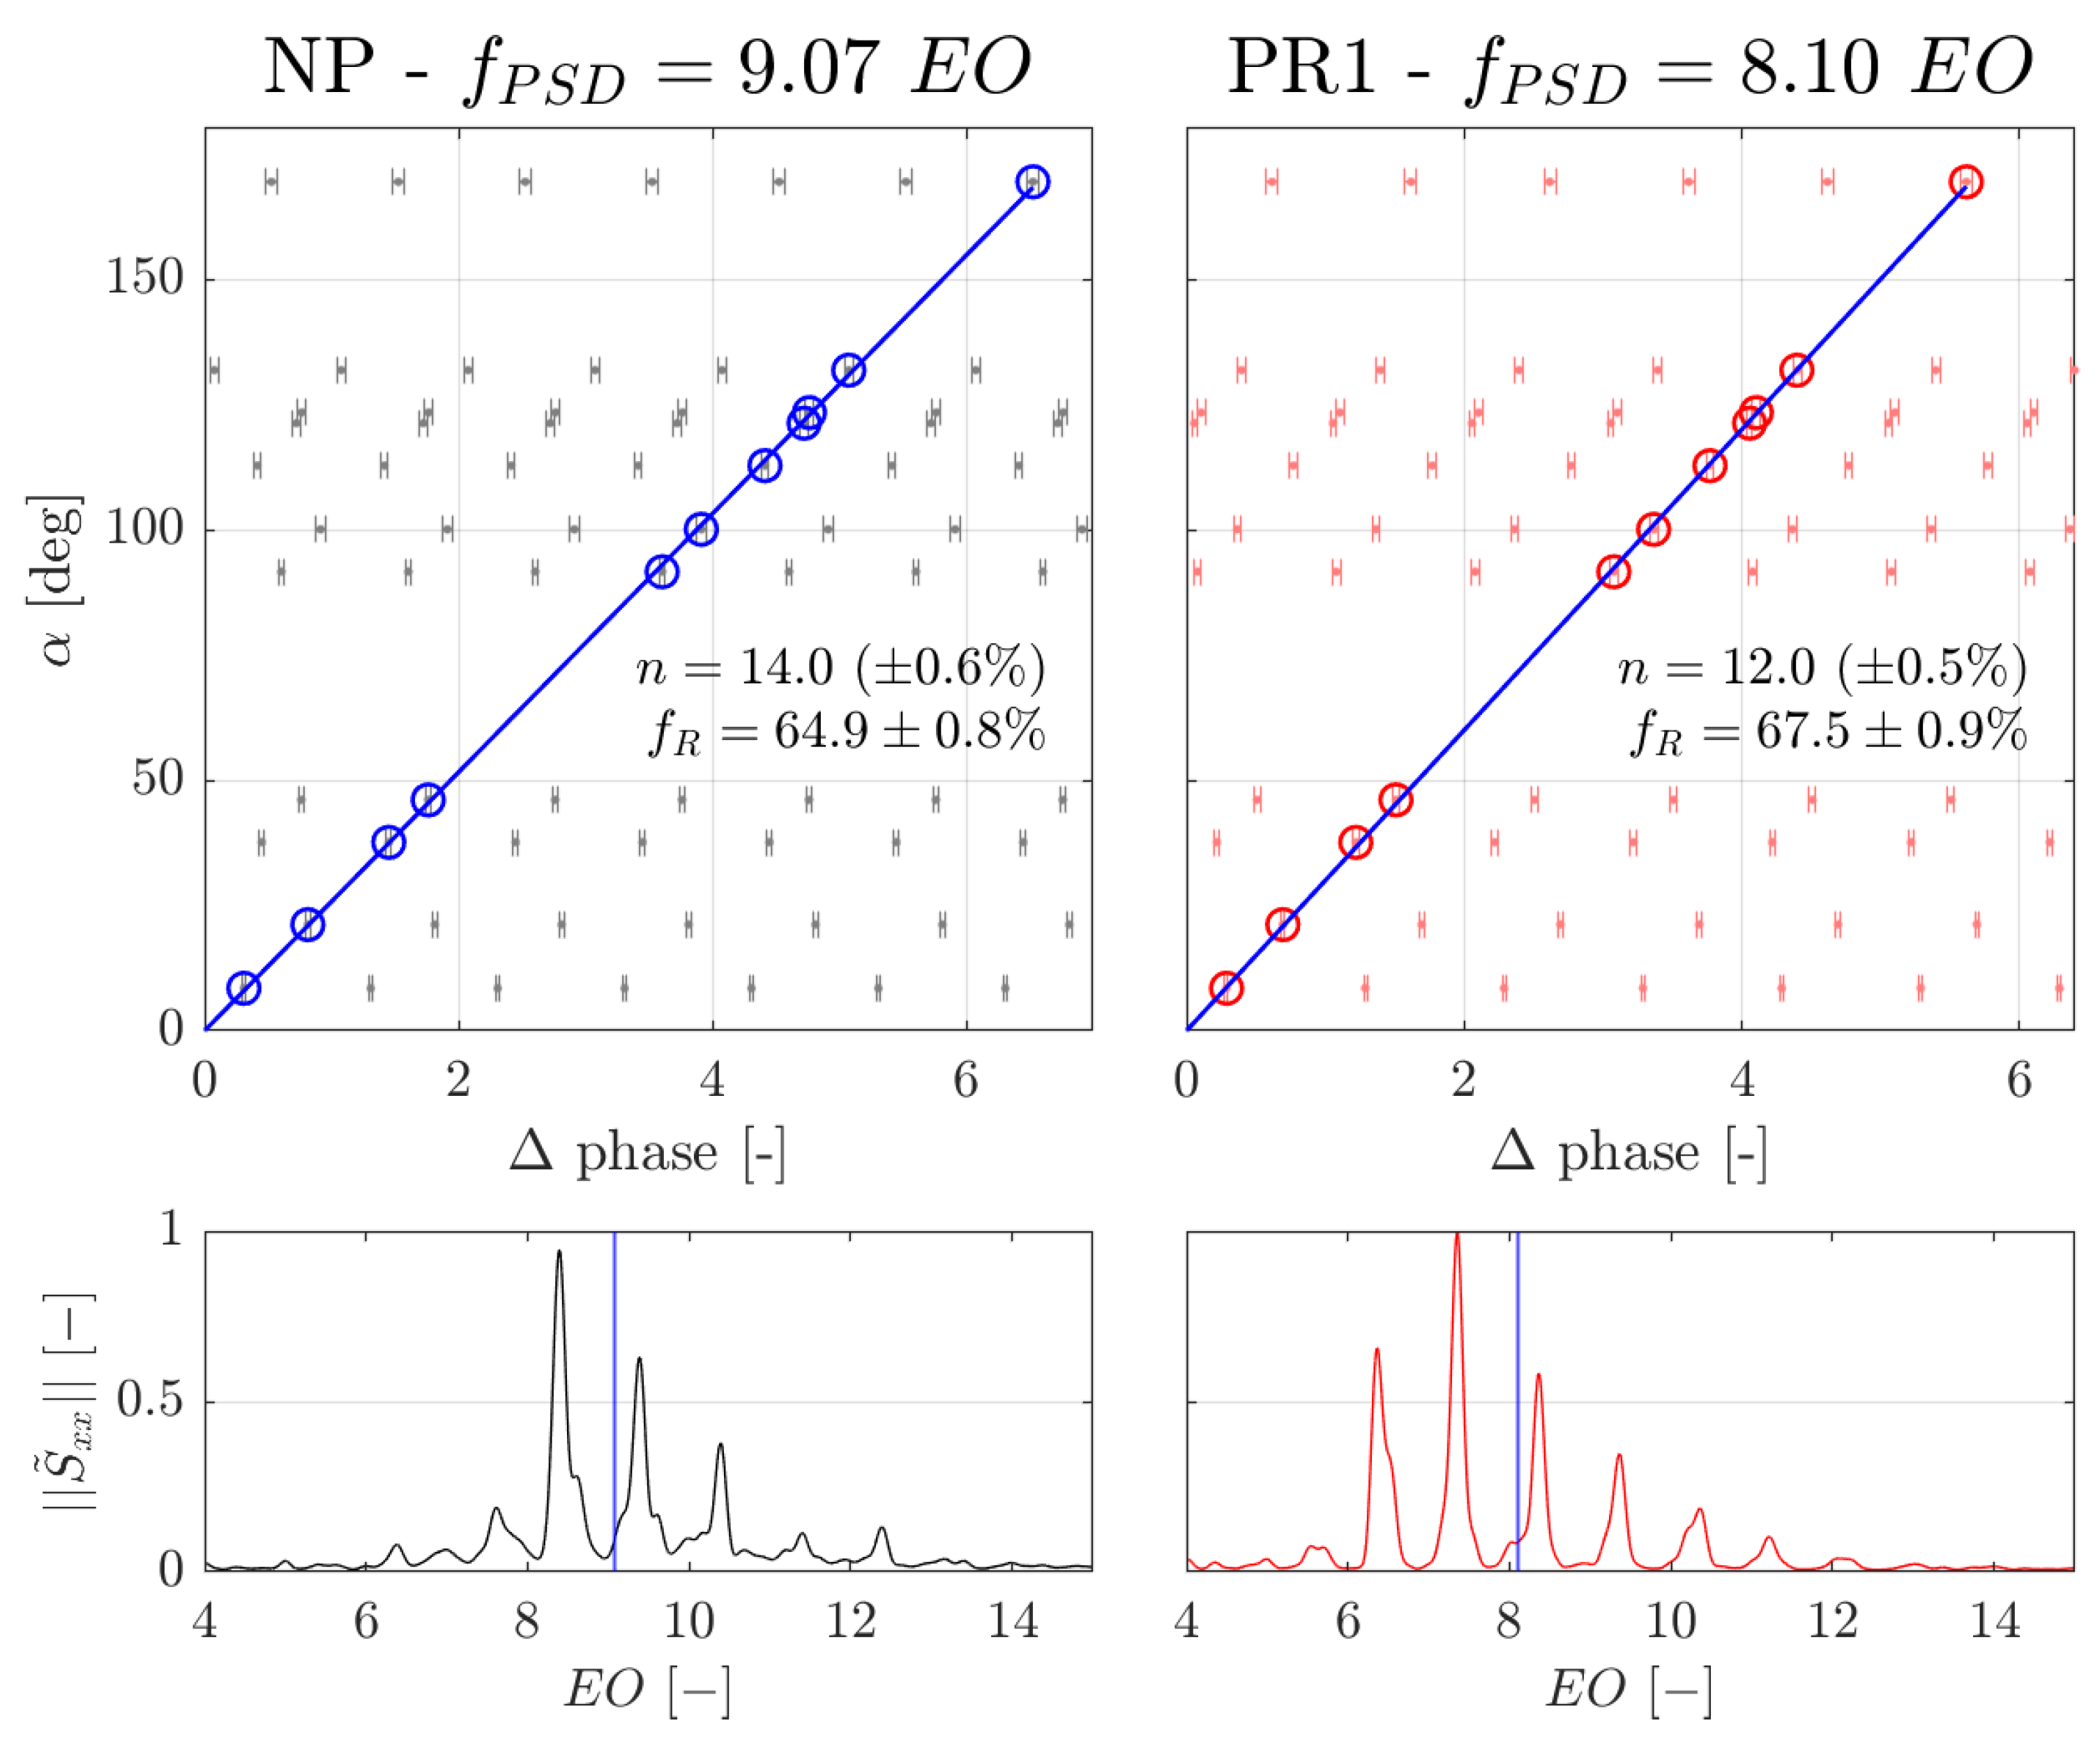
3.3.2. Cross-Power Spectral Density Method

The technique exploits the properties of the phase of the CPSD distribution, which is defined as the Fourier transform of the cross-correlation of two signals. Assuming two generic signals x 1 and x 2 ( t ) = x 1 ( t Δ t ) , their cross-correlation R 12 ( τ ) is equal to R 11 ( τ Δ t ) , where R 11 is the auto-correlation of x 1 . This relationship links the first peak of the cross-correlation R 12 ( τ ) to the time delay Δ t , which is the fundamental concept exploited by the cross-correlation method. By computing the Fourier transform of R 12 ( τ ) , it is found that
G 12 ( f ) = G 11 ( f ) · e j 2 π f Δ t
where G 11 is equal to the the power spectral density S 11 of x 1 (i.e., the Fourier transform of R 11 for the Wiener–Khinchin theorem [26]) and G 12 is the CPSD of the signals x 1 and x 2 . For real functions, the auto-correlation is symmetric and real. Consequently, the same is true for its Fourier transform (i.e., ϕ 11 = 0 ). Therefore, the angular phase of the CPSD distribution is
ϕ 12 ( f ) = 2 π f Δ t
which links the time delay Δ t to the phase p 12 = ϕ 12 / 2 π = f Δ t , referred to as the phase law.
Figure 6 shows the application of these properties to two synthetic signals x 1 and x 2 , defined as
x 1 ( t ) = x ( t ) + w ( t ) , x 2 ( t ) = x ( t Δ t ) + w ( t )
x ( t ) = s i n ( 2 π f 1 t ) · s i n ( 2 π f 2 t ) · s i n ( 2 π f 3 t )
where w ( t ) is white noise set to 50% of the amplitude of x ( t ) .
Figure 6a displays the modulus of S 11 and S 22 . As expected, the distributions overlap in the regions of the four peaks ( | S 22 | = | F [ R 11 ( τ Δ t ) ] | = | F [ R 11 ( τ ) ] | = | S 11 | ), located at the linear combination of frequencies f 1 , f 2 , and f 3 . Negligible discrepancies, three orders of magnitude lower in modulus, develop outside of these regions because of the noise. The same observation applies to Figure 6b, where the modulus of the PSD perfectly matches that of the CPSD ( | G 12 | = | G 11 | ).
Figure 6c shows the phase of the CPSD. Equation (2) is verified in correspondence with the four modulus peaks, which are the zones of the spectra where the signal is well-defined. Outside these locations, the CPSD module becomes too small, and the effects of numerical error, noise, and frequency resolution become predominant.
Following the computation of p i j ( f ) between all available sensors, phase lag plots such as in Figure 6d are generated for each frequency peak f P S D in the spectra. Since the value of p i j is confined between −0.5 and 0.5, these plots are ‘populated’ by adding finite integers to the measured phase delay. This is equivalent to adding a finite number of periods to the measured time delays. However, since this step is performed in the phase domain, selecting a specific period of fluctuation ( T P S D ) is not necessary, as the phase is already normalized. Once the phase lag plot is completed, the optimum linear regression is computed, allowing us to determine the number and velocity of the rotating structure lobes.
Da Valle et al. [20] demonstrated how the computation of the phase law can be used to improve the accuracy and robustness of the phase lag computation. The general idea is that if the CMs occupy more spectra locations, each peak’s phase will be aligned, as in Figure 6c. Therefore, the effects of noise and numerical error can be mitigated by computing the linear regression that better approximates the phase law p i j = q i j + m i j · f . This regression is used to determine p i j at the frequency f P S D , and the phase lag plots are populated. As a result, this method accounts for the complete information available in the spectra and grants higher accuracy compared to the cross-correlation method, which only provides the average estimation of the time delay.
In this study, the CPSD methodology is applied collecting the phase at the location of the peaks for each sensor combination and for all available tests. This dataset is used to determine the phase law regression through a bootstrapping procedure. These regressions are used to identify the probability density function (pdf) of the phase delay computed for each f P S D investigated. Then, the phase lag plots are generated using the average values, and the set of points composing the best combination is identified. Finally, a new bootstrapping procedure is applied to determine the slope of the best regression, considering the pdf distributions from the phase law for the computation. f R and n, along with their uncertainties, are determined as n = 360 / m C P S D and f R = f P S D / n from the slope of the best regression, m C P S D .

4. Results and Discussion

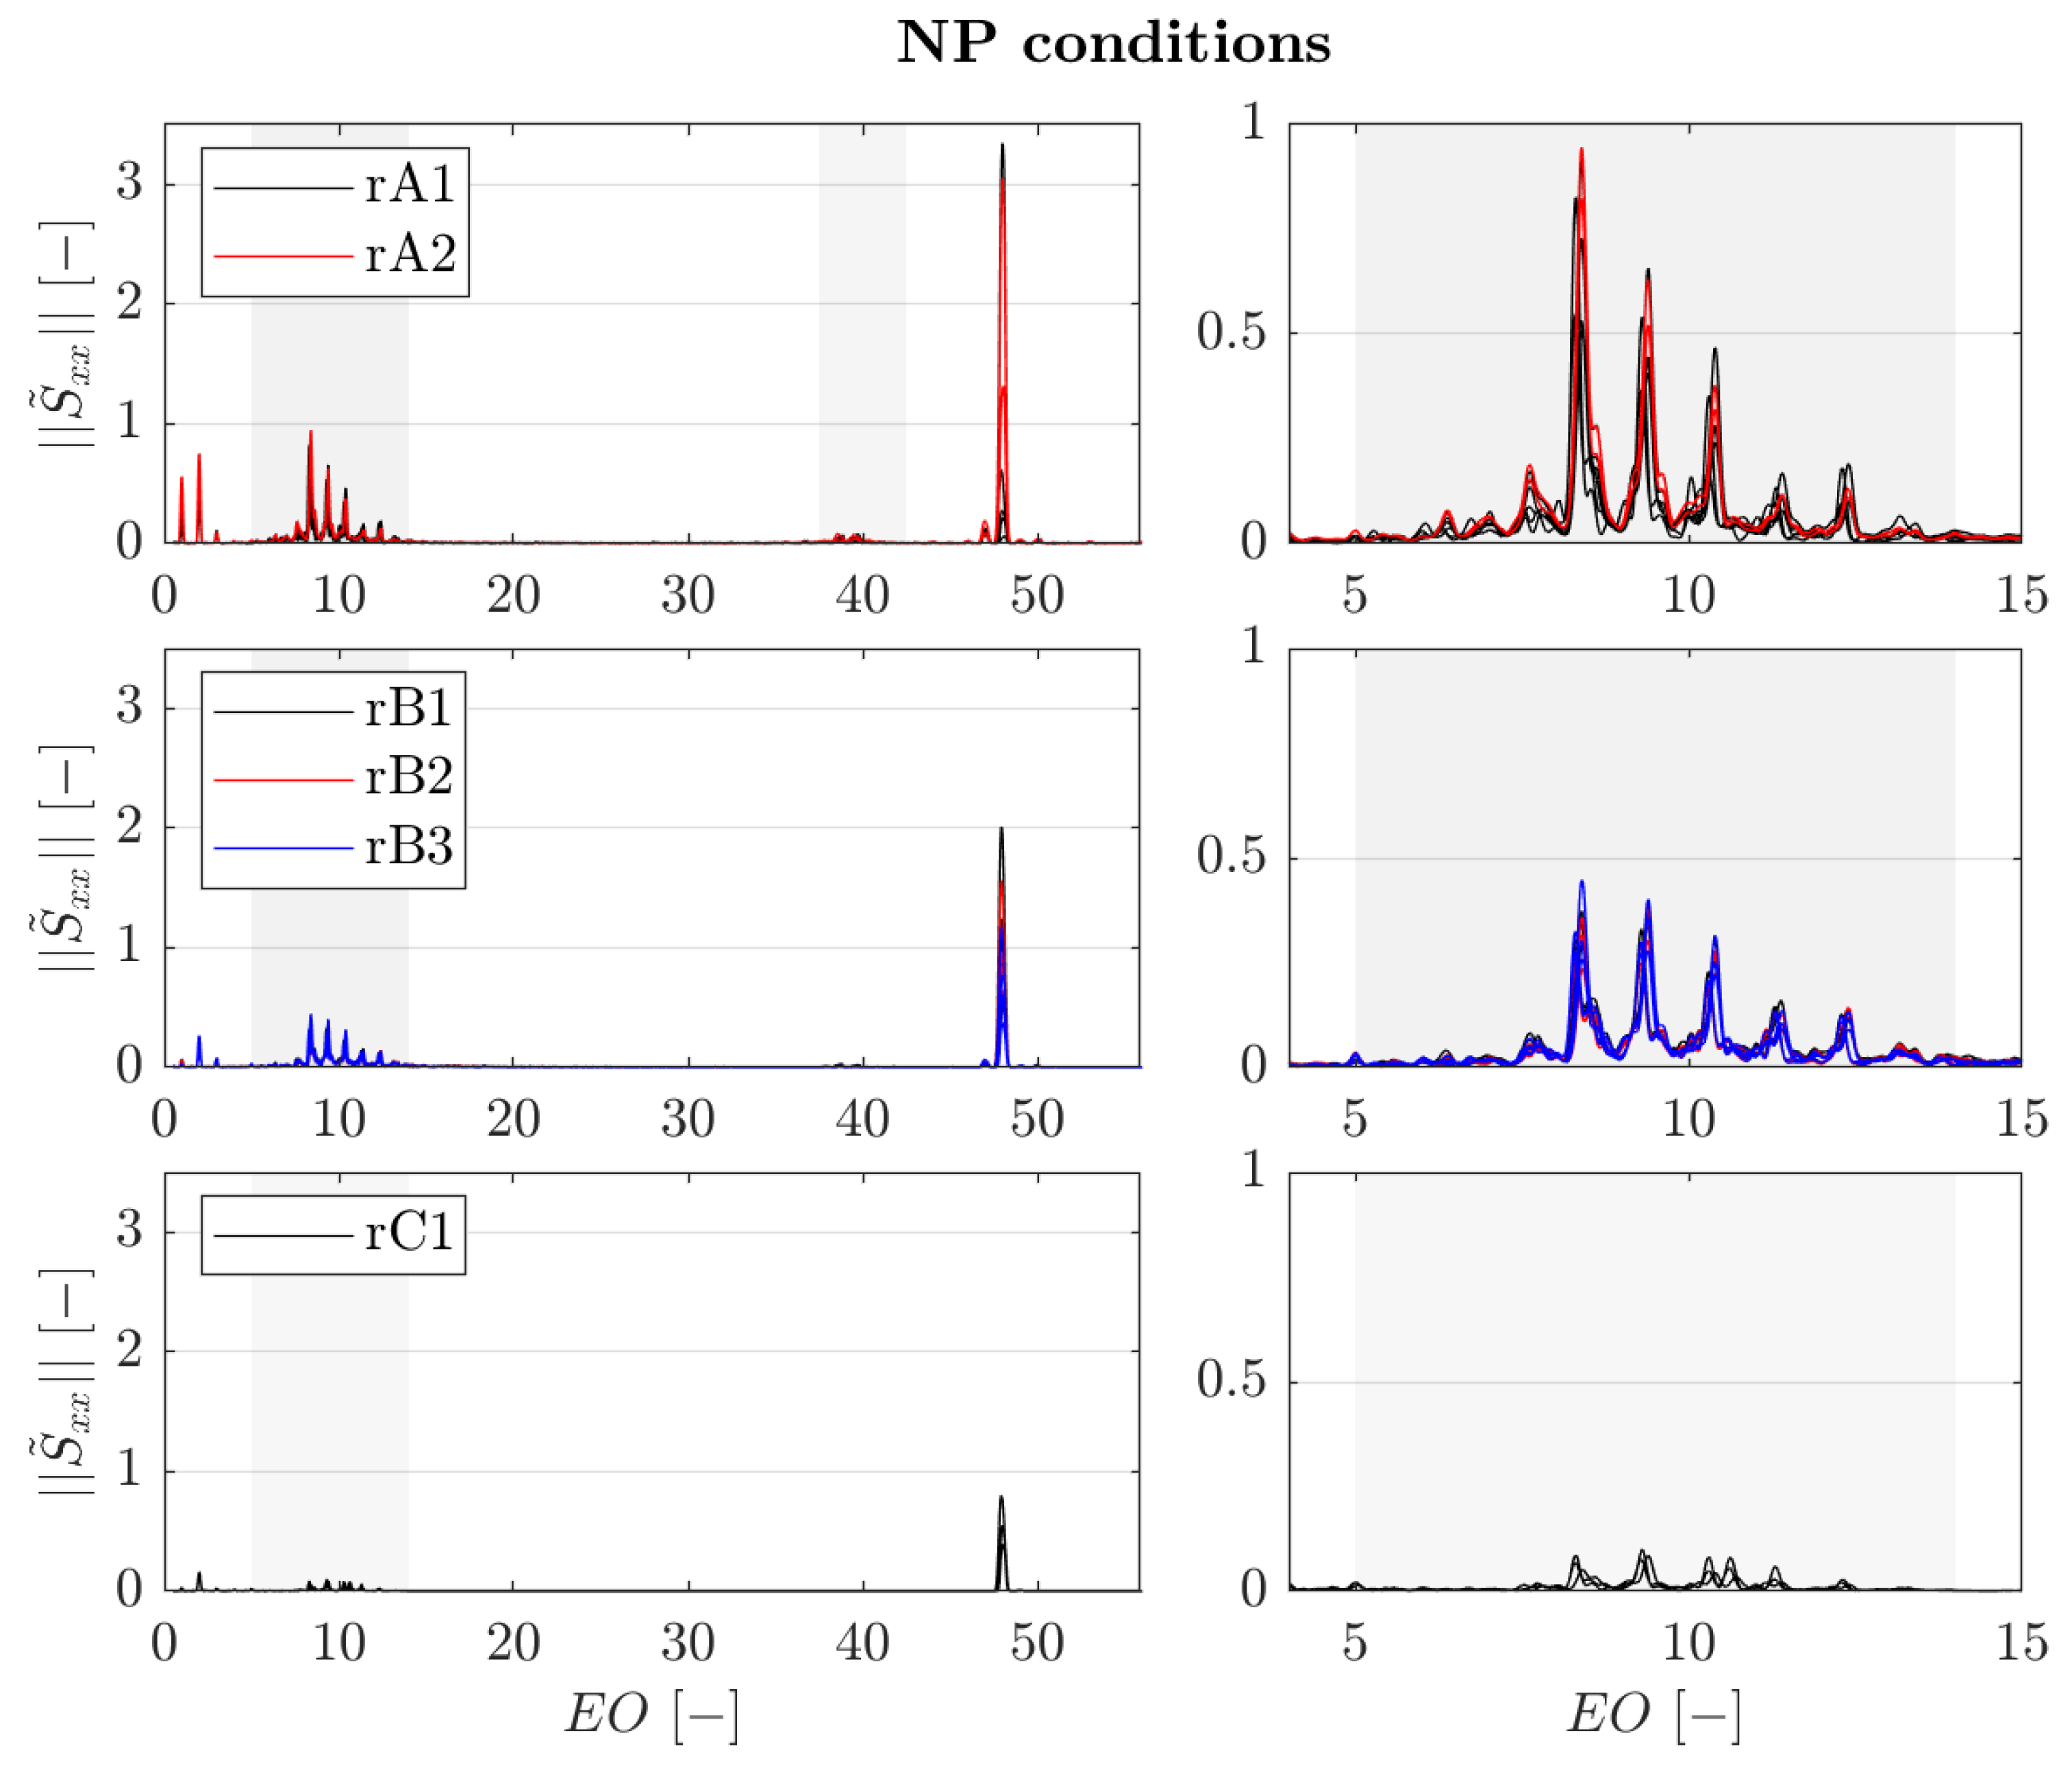
4.1. Spectra Analysis

Figure 7 provides the average distribution measured under nominal purge conditions in the rim seal region by all available sensors. The figure shows the sensor measurements divided into three groups. Radial positions A1 and A2 are shown at the top. The measurements in the buffer cavity (positions B1, B2, and B3) are shown in the middle, and the measurements in the sealed cavity (position C1) are provided at the bottom.
Three different sources of unsteadiness are recognizable in the spectra. The first consists of a low-engine-order fluctuation, determined by two peaks at 1 EO and 2 EO. The maximum intensity is registered on the upper lip of the rim seal and is progressively attenuated in the lower region of the cavity. For this reason, this fluctuation could be associated with the annulus flow periodicity.
The second source of unsteadiness is located at the BPF and is therefore associated with the rotor blade passing event. Similar to the low EO fluctuation, the BPF fluctuation intensity is also reducing at lower radial locations within the cavity, as the influence of the rotor airfoil potential field progressively decreases. Notably, despite the presence of the angel wing, the BPF perturbation is still perceived in the sealed cavity.
The last source of flow instability is identified in the band between 7 and 14 EO, highlighted in gray and shown on the right-hand-side figures. The comparison of the spectra reveals, similarly to other sources, a significant modulation across the rim seal. Measurements in the same regions show a higher agreement than for the BPF, and the positions of the five peaks (equally spaced by 1 EO) are consistent between the different measurement locations. Moreover, in the region of the upper lip (and partially in the buffer cavity), the spectra show linear interactions with the BPF fluctuation, which are highlighted in gray in the top-left figure (∼40 EO).
The nature of this instability is identified from the effects of the purge rate on the spectra. Figure 8 shows the PSD measured by three sensors, each one located in one of the three regions of the rim seal and acquired under all operating conditions. The use of a single sensor is justified by the consistency of the measurements in Figure 7, which was verified across all tested conditions (not shown for brevity).
The variation in the purge rate shows minimal effects on the low-EO perturbations and, partially, on the BPF peak, which remains unaffected in both the buffer and sealed cavity. However, the BPF peak is strongly modulated in the region of the upper lip as a result of the effect of the purge rate on the rotor aerodynamics.
The region of the spectra that is most affected by the purge rate is highlighted in gray. The cavity purge rate modifies the energy, shape and the frequency band of the pressure spectra within this region. This observation suggests that the instability is linked to ingress–egress mechanisms within the rim seal region, which are usually significantly affected by the purge flow rate [5]. The close-out view of that region shows that for the PR1 condition (red line), the band occupied by the instability is stretched and shifted towards lower frequencies by approximately 2 EO. Under OD-D (blue line), which features a purge flow rate in between NP and PR1, the spectrum of the instability is found at an intermediate state, shifted by 0.5 EO but already showing an enlargement of the band occupied. Under OD-C, OD-B, and OD-A conditions, each radial location shows a significant decrease in the strength of the rim-seal instability.
These trends are verified at each radial location; however, they become increasingly challenging to discern as one approaches the sealed cavity. Figure 9 shows the evolution of the rim-seal fluctuation strength throughout the seal and for each operating condition. The figure shows the RMS (95% CI), computed over the pass-banded signals, and its repeatability (error bars, also at 95% CI). This is calculated for each operating condition and includes all available measurements and sensors. The central plot illustrates the measurements obtained by each sensor under NP conditions (represented in gray), which are compared with the average distribution (in black). As expected from the results of the analysis in Figure 7, the measures show high repeatability.
The plot on the right-hand side shows the effect of the operating condition on the strength of the fluctuation. For NP, PR1, and OC-C conditions, the intensity of the fluctuation is matched in the upper lip and the buffer cavity. In the sealed cavity region, the intensity keeps decreasing for each condition; however, for NP, it becomes significantly lower (approximately half that of PR1). Across the rim seal, the peak in intensity is reached under PR1 conditions. For lower purge flow rates (OD-C, OD-B, and OD-A), the trend is inverted and the fluctuation decreases progressively with the purge rate. This trend is generated by the gradual attenuation of the unsteady ingress–egress mechanisms as a result of an increasingly stable ingress of the main flow in the cavity. In contrast, for higher purge rates, the attenuation of the rim-seal instability is caused by an increase in the cavity sealing effectiveness.

4.2. Cavity Mode Characteristics

Figure 10 presents the results of the cross-correlation analysis performed on the measurements at NP and PR1. Under NP conditions, the rotational speed is recorded at 67.0 ± 2.7 % , while for PR1, it is 70.1 ± 3.3 % of the rotor speed. The observed increase in speed is approximately ≈3%, yet it remains comparable to their estimated uncertainty. The reason for such uncertainty magnitudes is found in the time lag plots for sensor combinations with spacing exceeding an angle of 60 degrees. For those combinations, the cross-correlation fails to provide a time delay consistent with those derived from smaller angle combinations, thereby precluding the use of these measurements for computing the optimal regression and its uncertainty. For sensors with greater angular separation, the most pronounced and accurate peaks are detected one or two periods prior to the actual time delay. The two dotted lines in Figure 10, parallel to the one passing by the origin, show the alignment of these clusters of points one period before the expected delay.
The alignment provides a qualitative confirmation of the solution but cannot be integrated into an algorithm without further assumptions regarding the period of the fluctuation, f P S D . Therefore, to achieve higher measurement precision, it is necessary to include all combinations in the calculation of the best regression. This is possible if the analysis is moved into the frequency domain, where the phase is, by definition, normalized between 0 and 1, and the angular distance between sensors does not affect the procedure for the computation of the optimum regression.
Figure 11 shows the phase delay measured between the two sensors placed at the maximum distance (∼ 170 ) on the rim seal. Under both NP and PR1 conditions, the phases collected in the peaks of the spectra are organized into clusters of points, reproducing a situation which is consistent with the synthetic example in the methodology section. This is evidence that each peak shares a common Δ t or, given that the angle α 12 is fixed, rotating velocity.
The trend observed in the spectral analysis is confirmed by the phase laws. Under PR1, the frequency content of the rim-seal instability is shifted towards lower frequencies and spread over a broader bandwidth. Moreover, the slope of the phase laws, which is directly proportional to Δ t , shows a decrease of approximately 2.5% for PR1 conditions. This is consistent with the trend observed from the result of the cross-correlation analysis, as lower Δ t corresponds to higher f R for a fixed α 12 .
Ultimately, thanks to its low sensitivity to noise and uncorrelated fluctuations, the use of the CPSD allows us to retain a precise evaluation of the phase delay, even between sensors separated by a wide angle. This allows for the inclusion of all sensor combinations in the analysis of the best regression of the phase lag plots, increasing the reliability of the measure.
Once the phase law is determined, Δ p = Δ p ( f ) , the phase lag plots are populated for the frequencies f P S D identified in the spectra. f P S D corresponds to the product of the number of structures and the speed of rotation, f P S D = n · f R . Hence, it is the frequency of the rim-seal instability perturbation as it is measured by the sensors, which is typically associated with a peak in the spectra.
Figure 12 shows the results of the CPSD analysis applied to NP and PR1 conditions while searching for the rim-seal instability characteristics at f P S D occupied by the peaks in spectra. The measure of the rotating speeds roughly matches the cross-correlation measure (∼3.5% discrepancy), displaying an increase under PR1 in the order of 2%. This confirms the trend identified by the cross-correlation in Figure 10 and the observations in Figure 11.
Both the measure of rotating speed and the spatial length scale exhibit low uncertainties; however, the number of lobes is non-integer for both operating conditions and for each peak in the spectra (the remaining cases are not included for brevity). This result is confirmed by the cross-correlation measures in Figure 10 (but within uncertainty ranges ± 4.5 % ) and, if confirmed, would prove the presence of non-axisymmetric structures regenerating and constantly evolving in the span of one rotation. This hypothesis is not supported by the consistency of the spectra measured across the duration of each test (not shown for brevity), as there is no evident abrupt variation in the peak positions to confirm the transition from one instability state to another. Moreover, for structures undergoing continuous evolution, the cross-correlation distributions should be able to directly measure the time delay. This is because the time signature of the fluctuations would be sufficiently distinctive to allow for a pronounced correlation only for τ = Δ t (in symbols, R 12 ( Δ t ) > > R 12 ( τ Δ t ) ).
These observations hint at a situation similar to that of the synthetic example in Figure 6. There, the frequency content of the fluctuation occupies multiple locations in the spectrum as the result of a modulation of an original fluctuation (harmonic f 2 ) by other low-frequency sinusoidal perturbations ( f 1 and f 3 ). This modulation, which can be interpreted as an interaction between the original perturbation and two different fields, results in a spectrum with four peaks at frequencies that are linear combinations of f 2 with f 1 and f 3 . In essence, the original fluctuation at frequency f P S D = f R · n is now modulated and occupies different regions of the spectra as the result of interactions with other (relative) pressure fields (rotor, vane, etc.).
In this application, despite a measured rotating speed of only 2/3 of the rotor speed (i.e., the expected separation), the PSD peaks are spaced by one EO, pointing toward the low-EO fluctuations as the cause of this modulation. In particular, under NP, the shape of the spectra is observed to resemble a mirrored version of the 1-2-3 EO perturbation. These fluctuations, as shown in the spectral analysis, are hypothesized to be connected with the annulus flow periodicity, which is therefore identified as a possible cause of the modulation of the rim-seal instability.
This interpretation is consistent with the observed high test-to-test repeatability and the stability of the PSD distributions. Moreover, it justifies the search for axisymmetric states of the instability (i.e., integer n) at intermediate frequencies in the spectra. Figure 13 shows the result of this analysis for both NP and PR1 conditions.
Under NP, the asymmetric state is identified at 9.07 EO, with a length scale equivalent to 14.0 lobes. For PR1 conditions, two states are identified, corresponding to 12 (shown in Figure 13) and 11 lobes. These states are searched in the region of the spectra occupied by the strongest peaks (i.e., the most energetic states), which is expected to be linked to the most stable states of the instability.
For PR1 conditions, the wide band occupied by the instability determines the presence of two different states of instability. The effect of higher rotating speeds, combined with the shift towards lower frequency, is translated in structures with lower periodicity, rotating at speeds slightly higher than NP conditions.
For NP conditions, only one axisymmetric state is identified within the most energetic region of the spectra. Interestingly, the separation from the first peak in the spectra is equal to the speed of rotation of the structure (i.e., the relative velocity with respect to the stator reference frame), while the separation to the second peak is equal to the relative velocity in the rotor frame. This suggests a link with these two relative fields. However, further investigations on the mechanisms responsible for this modulation (i.e., interactions) will be necessary to connect this observation to a specific flow mechanism.

5. Conclusions

This study presents a comprehensive experimental analysis of cavity and rim-seal instabilities developed within an HPT stage, tested at engine-relevant flow conditions and subjected to a variety of purge conditions.
Fast-response pressure measurements are utilized to investigate the unsteady flow field. The measurements reveal asynchronous flow instabilities in the rim seal and cavity region connected to ingress–egress mechanisms. The intensity, length scale, and rotational speed of the asynchronous structures are strongly affected by the purge rates. These effects are carefully investigated with measurements at multiple radial and azimuthal cavity locations.
The pressure spectra reveal high repeatability for measurements at the same radial location. The rim-seal instability is identified in the frequency range between 5 EO and 14 EO, with spectra characterized by peaks separated by one EO. The same spectrum signature is found on sensors at different cavity radii, while the fluctuation energy varies. In contrast, the purge rate greatly affects the count of the spectrum peaks, as well as their intensity and location. At NP, the spectra show three peaks in the range of 8–11 EO. At lower purge rates, the number of peaks increases and the frequency range occupied is shifted toward lower values. At PR1, the spectra show five peaks in the range of 6–11 EO.
The maximum strength of the instability is detected on the upper lip and buffer cavity of the rim seal, decreasing in the sealed cavity region. Measurements at different purge rates show that the maximum intensity is reached for PR = 1.00%. Comparable intensities persist for higher rates in the upper lip and buffer cavity, showing minimal benefits in terms of a reduction in ingress–egress mechanisms. For PR = 1.74%, the intensity in the sealed cavity is significantly reduced, showing a suppression of ingress–egress mechanisms in that region. For lower PRs, the instability diminishes as the cavity becomes unsealed. These results emphasize that merely increasing the purge rate does not fully suppress rim-seal instabilities or ingress–egress processes. Instead, the rim seal design itself must be optimized to address the unsteady aspects of the flow, underscoring the need for methodologies that go beyond time-averaged evaluations.
The characteristics of the asynchronous structures are analyzed employing the cross-correlation methodology and a recently introduced technique based on the properties of the cross-power spectral density. The latter approach shows improvements in the accuracy of the measures (errors <1%), derived by the precision achieved in determining the phase delay for sensors separated by angles greater than 60 . The speed of the asynchronous structures exhibits minimal sensitivity to the PR, approximately 65% of the rotor speed. In contrast, the structures’ length scale shows considerable variation, ranging from 11–12 lobes at PR = 1.0% to 14 lobes for PR = 1.74%. The analysis of the phase of the CPSD, combined with the stable characteristics of the spectra, suggests that peaks in the spectra do not correspond to different states of instability but are the result of its modulation induced by other pressure fields. The low-engine-order fluctuations are hypothesized to be responsible for this behavior, but further investigations will be necessary to identify the flow mechanisms responsible for this modulation of the ingress–egress mechanisms.

Author Contributions

Conceptualization, L.D.V., B.C.C., and S.L.; methodology, L.D.V., B.C.C., and S.L.; formal analysis, L.D.V., B.C.C., and S.L.; investigation, L.D.V., B.C.C., and S.L.; data curation, L.D.V. and B.C.C.; writing—original draft preparation, L.D.V. and B.C.C.; writing—review and editing, L.D.V., B.C.C., and S.L. All authors have read and agreed to the published version of the manuscript.

Funding

This research was funded by the von Karman Institute for Fluid Dynamics and Safran Aircraft Engines.

Institutional Review Board Statement

Not applicable.

Informed Consent Statement

Not applicable.

Data Availability Statement

The datasets generated supporting the findings of this article can be obtained from the corresponding author upon reasonable request.

Acknowledgments

The authors acknowledge the support of Safran Aircraft Engines in enabling this research and thank Jorge Pinho and Mizuki Okada for their contributions to the test campaign. We thank Tony Arts for his help during the experimental phase, Sylvain Borrey for operating the high-speed turbine rig, and William Fraga for his work on the preliminary data processing. We also recognize Argiris Alexopoulos and Pierre Londers for their support in the commissioning phase, as well as Terence Boeyen and Oswald Divers for their work on the instrumentation.

Conflicts of Interest

The authors declare no conflicts of interest.

Abbreviations

Acronyms
HPTHigh-Pressure Turbine
PRPurge Rate
CPSDCross-Power Spectral Density
CMCavity Mode
RMSRoot Mean Square
VKIvon Karman Institute for Fluid Dynamics
NPNominal Purge Condition
PR1Off-Design at PR = 1.00%
OD-A,-B,-C,-DExtra Off-Design Conditions
LFSignal Low-Frequency Content
HFSignal High-Frequency Content
EOEngine Order
CIConfidence Interval
pdfProbability Density Function
H1(2,3,4)Hub Insert Designs
T1(2)Tip Insert Designs
L1, S1, S2ABS Inserts
Subscripts
rRotor
a x Axial
hHub
sStator
0Total quantities
1 , 2 , 3 Planes 1, 2, and 3
a v g Average
Variables
R e Reynolds number
MMach number
C r , a x Rotor axial chord
PPressure
TTemperature
R e θ Rotational Reynolds number
ω Rotational speed [rpm]
α Sensor angular distance
β Structures’ length scale
nNumber of lobes
v R Structures’ rotating speed
f R Structures’ rotating frequency
Δ t Time lag (delay)
τ Time lag unit
Δ p , p i j Phase lag (delay)
ϕ Cross-power spectral density phase
f P S D = n · f R (Definition of f P S D )
R x y Cross-correlation
S x x Power spectral density
G x y Cross-power spectral density

References

  1. Scobie, J.A.; Sangan, C.M.; Michael Owen, J.; Lock, G.D. Review of Ingress in Gas Turbines. J. Eng. Gas Turbines Power 2016, 138, 120801. [Google Scholar] [CrossRef]
  2. Paniagua, G.; Dénos, R.; Almeida, S. Effect of the Hub Endwall Cavity Flow on the Flow-Field of a Transonic High-Pressure Turbine. J. Turbomach. 2004, 126, 578–586. [Google Scholar] [CrossRef]
  3. Schuepbach, P.; Abhari, R.S.; Rose, M.G.; Germain, T.; Raab, I.; Gier, J. Effects of Suction and Injection Purge-Flow on the Secondary Flow Structures of a High-Work Turbine. J. Turbomach. 2010, 132, 021021. [Google Scholar] [CrossRef]
  4. Regina, K.; Kalfas, A.I.; Abhari, R.S. Experimental Investigation of Purge Flow Effects on a High Pressure Turbine Stage. J. Turbomach. 2015, 137, 041006. [Google Scholar] [CrossRef]
  5. Chew, J.W.; Gao, F.; Palermo, D.M. Flow mechanisms in axial turbine rim sealing. Proc. Inst. Mech. Eng. Part C J. Mech. Eng. Sci. 2019, 233, 7637–7657. [Google Scholar] [CrossRef]
  6. Horwood, J.; Hualca Tigsilema, F.P.; Wilson, M.; Scobie, J.; Sangan, C.; Lock, G.; Dahlqvist, J.; Fridh, J. Flow Instabilities in Gas Turbine Chute Seals. J. Eng. Gas Turbines Power 2020, 142, 021019. [Google Scholar] [CrossRef]
  7. Rozman, M.; DeShong, E.T.; Thole, K.A.; Berdanier, R.A.; Robak, C. Characterizing Flow Instabilities During Transient Events in the Turbine Rim Seal Cavity. J. Turbomach. 2022, 145, 031014. [Google Scholar] [CrossRef]
  8. Gao, F.; Chew, J.W.; Beard, P.F.; Amirante, D.; Hills, N.J. Large-eddy simulation of unsteady turbine rim sealing flows. Int. J. Heat Fluid Flow 2018, 70, 160–170. [Google Scholar] [CrossRef]
  9. Monge-Concepción, I.; Siroka, S.; Berdanier, R.A.; Barringer, M.D.; Thole, K.A.; Robak, C. Influence of Vane Trailing Edge Flow on the Formation of Cavity Cells and Rim Sealing. J. Turbomach. 2022, 144, 061014. [Google Scholar] [CrossRef]
  10. Vella, S.; Tang, H.; Carnevale, M.; Scobie, J.A.; Lock, G.D.; Salvatori, F.; Sangan, C.M. On the Relationship Between Swirl and Unsteadiness Within Turbine Rim Seals. J. Eng. Gas Turbines Power 2025, 147, 041031. [Google Scholar] [CrossRef]
  11. Beard, P.F.; Gao, F.; Chana, K.S.; Chew, J. Unsteady Flow Phenomena in Turbine Rim Seals. J. Eng. Gas Turbines Power 2017, 139, 032501. [Google Scholar] [CrossRef]
  12. Gao, F.; Chew, J.W.; Marxen, O. Inertial waves in turbine rim seal flows. Phys. Rev. Fluids 2020, 5, 024802. [Google Scholar] [CrossRef]
  13. Bru Revert, A.; Beard, P.F.; Chew, J.W. Measurement of Inertial and Acoustic Waves in a Turbine Chute Rim Seal Cavity. J. Eng. Gas Turbines Power 2023, 145, 061021. [Google Scholar] [CrossRef]
  14. Horwood, J.; Hualca, F.; Scobie, J.; Wilson, M.; Sangan, C.; Lock, G. Experimental and Computational Investigation of Flow Instabilities in Turbine Rim Seals. J. Eng. Gas Turbines Power 2019, 141, 011028. [Google Scholar] [CrossRef]
  15. Iranidokht, V.; Kalfas, A.; Abhari, R.; Senoo, S.; Momma, K. Sensitivity analysis on the impact of geometrical and operational variations on turbine hub cavity modes and practical methods to control them. J. Glob. Power Propuls. Soc. 2021, 5, 66–78. [Google Scholar] [CrossRef]
  16. Town, J.; Averbach, M.; Camci, C. Experimental and Numerical Investigation of Unsteady Structures Within the Rim Seal Cavity in the Presence of Purge Mass Flow. In Proceedings of the ASME Turbo Expo 2016: Turbomachinery Technical Conference and Exposition, Seoul, Republic of Korea, 13–17 June 2016. [Google Scholar] [CrossRef]
  17. Savov, S.S.; Atkins, N.R.; Uchida, S. A Comparison of Single and Double Lip Rim Seal Geometries. J. Eng. Gas Turbines Power 2017, 139, 112601. [Google Scholar] [CrossRef]
  18. Graikos, D.; Carnevale, M.; Sangan, C.M.; Lock, G.D.; Scobie, J.A. Influence of Flow Coefficient on Ingress Through Turbine Rim Seals. J. Eng. Gas Turbines Power 2021, 143, 111010. [Google Scholar] [CrossRef]
  19. Chilla, M.; Hodson, H.; Newman, D. Unsteady Interaction Between Annulus and Turbine Rim Seal Flows. J. Turbomach. 2013, 135, 051024. [Google Scholar] [CrossRef]
  20. Da Valle, L.; Torre, A.F.M.; Merli, F.; Cernat, B.C.; Lavagnoli, S. Cavity Instabilities in a High-Speed Low-Pressure Turbine Stage. Int. J. Turbomach. Propuls. Power 2025, 10, 4. [Google Scholar] [CrossRef]
  21. Da Valle, L.; Cernat, B.C.; Lavagnoli, S. Cavity Flow Instabilities in a Purged High-Pressure Turbine Stage. In Proceedings of the 16th European Turbomachinery Conference (ETC16): Turbomachinery Fluid Dynamics and Thermodynamics, Paper No. ETC16-291, Hannover, Germany, 24–28 March 2025; Available online: https://www.euroturbo.eu/publications/conference-proceedings-repository/ (accessed on 8 April 2025).
  22. Paniagua, G.; Sieverding, C.H.; Arts, T. Review of the von Karman Institute Compression Tube Facility for Turbine Research. In Proceedings of the ASME Turbo Expo 2013: Turbine Technical Conference and Exposition, San Antonio, TX, USA, 3–7 June 2013. [Google Scholar] [CrossRef]
  23. Cernat, B.C.; Pinho, J.; Okada, M.; Lavagnoli, S. Experimental Investigation of a High-Speed Turbine with Rainbow Rotor and Rim Seal Purge Flow. J. Turbomach. 2023, 145, 071014. [Google Scholar] [CrossRef]
  24. Burigana, M.; Verstraete, T.; Lavagnoli, S. Turbine Endwall Contouring Through Advanced Optimization Techniques. J. Turbomach. 2023, 145, 081011. [Google Scholar] [CrossRef]
  25. Dénos, R. Influence of temperature transients and centrifugal force on fast-response pressure transducers. Exp. Fluids 2002, 33, 256–264. [Google Scholar] [CrossRef]
  26. Wiener–Khinchin Theorem, Wikipedia. Available online: https://en.wikipedia.org/w/index.php?title=Wiener%E2%80%93Khinchin_theorem&oldid=1218075429 (accessed on 8 October 2024).
Figure 1. High-speed turbine test rig (CT3) and stage cross-section.
Ijtpp 10 00015 g001
Figure 2. Rainbow rotor configuration (a) and meridional view of the purge cavity (b).
Ijtpp 10 00015 g002
Figure 3. Radial and azimuthal location of the fast-response pressure measurements in the rim-seal region of the purged cavity.
Ijtpp 10 00015 g003
Figure 4. ABS inserts hosting the Kulite sensors employed in the analysis of the rim-seal instabilities.
Ijtpp 10 00015 g004
Figure 5. Schematic representation of the cavity modes (a) and synthetic example of ideal time lag plot (b).
Ijtpp 10 00015 g005
Figure 6. In the upper row, (a) shows the PSD of the synthetic signals x 1 and x 2 , while (b) depicts the modulus of their CPSD. In the lower row, (c) shows the phase of their CPSD, while (d) displays an example of a phase lag plot.
Ijtpp 10 00015 g006
Figure 7. Spectra measured at different locations of the rim seal under NP conditions.
Ijtpp 10 00015 g007
Figure 8. Spectra measured in different locations of the rim seal under all operating conditions.
Ijtpp 10 00015 g008
Figure 9. Radial profile of the rim-seal instability intensity under all operating conditions.
Ijtpp 10 00015 g009
Figure 10. Time lag plot for measurements under NP and PR1 conditions (cross-correlation method).
Ijtpp 10 00015 g010
Figure 11. Phase law application for the same pair of sensors under NP and PR1 conditions.
Ijtpp 10 00015 g011
Figure 12. Search of the rim-seal instability characteristics for f P S D corresponding to peaks in spectra. Phase lag plots obtained under NP and PR1 purge conditions (left to right) for the frequency indicated in the spectra below.
Ijtpp 10 00015 g012
Figure 13. Search of the rim-seal instability characteristics for f P S D corresponding to an integer number of lobes, n. Phase lag plots obtained under NP and PR1 purge conditions (left to right) for the frequency indicated in the spectra below.
Ijtpp 10 00015 g013
Table 1. Stage operating conditions.
NP ConditionsPR1 Conditions
ParameterMeanRep. 95%MeanRep. 95%
P 01 , m s [mbar]1037.90.7%1037.90.6%
T 01 , m s [K]439.41.3%434.51.3%
P 01 , m s / P s 3 , H u b 2.1950.6%2.1990.6%
P 01 , m s / P t 3 , H u b 2.2140.5%2.2190.5%
T 01 , m s / T 03 , m s 1.2471.5%1.2471.5%
Ω [rpm]59200.3%59200.3%
M 3 , r e l 0.78(-)0.78(-)
R e 3 , C R , a x [ × 10 5 ]2.76(-)2.76(-)
n of tests15571
Table 2. Purge rate conditions.
Purge ConditionPurge Rate (= m ˙ inj / m ˙ ) [%]n of Tests
Nominal, NP1.74%155
Off-Design, PR11.00%71
Off-Design, OD-A−0.19%2
Off-Design, OD-B0.15%2
Off-Design, OD-C0.53%2
Off-Design, OD-D1.38%2
Disclaimer/Publisher’s Note: The statements, opinions and data contained in all publications are solely those of the individual author(s) and contributor(s) and not of MDPI and/or the editor(s). MDPI and/or the editor(s) disclaim responsibility for any injury to people or property resulting from any ideas, methods, instructions or products referred to in the content.

