Article

A Quasi-Direct Numerical Simulation of a Compressor Blade with Separation Bubbles and Inflow Turbulence †

by
Guglielmo Vivarelli
1,*,
João Anderson Isler
1,
Chris D. Cantwell
1,
Francesco Montomoli
1,2,
Spencer J. Sherwin
1,
Yuri Frey-Marioni
3,
Marcus Meyer
4,
Iftekhar Naqavi
3 and
Raul Vazquez-Diaz
3
1
Department of Aeronautics, Imperial College London, Exhibition Rd, South Kensington, London SW7 2AZ, UK
2
Scuola Superiore Sant’Anna, Piazza Martiri della Libertà, 33, 56127 Pisa, Italy
3
Rolls-Royce PLC, Derby DE24 8ZF, UK
4
Rolls-Royce Deutschland Ltd., 15827 Dahlewitz, Germany
*
Author to whom correspondence should be addressed.
This manuscript is an extended version of the ETC2025-325 meeting paper published in the Proceedings of the 16th European Turbomachinery Conference, Hannover, Germany, 24–28 March 2025.
Int. J. Turbomach. Propuls. Power 2025, 10(2), 8; https://doi.org/10.3390/ijtpp10020008 (registering DOI)
Submission received: 6 May 2025 / Revised: 14 May 2025 / Accepted: 19 May 2025 / Published: 27 May 2025

Abstract

:
Within the turbomachinery industry, components are currently assessed deploying standard second-order steady solvers. These are unable to capture complicated unsteady phenomena that have a critical impact on component performance. In this work, the high-order spectral h/p solver Nektar++ will be applied to a compressor blade to study the turbulent transition mechanisms and assess the effect of incoming disturbances with quasi-DNS resolution. The case will be modelled at an angle of incidence of 53.5 ° to match the original experimental loading at 52.8 ° . At clean inflow conditions, Kelvin–Helmholtz instabilities appear on both sides of the blade due to a double separation, with the pressure side one not being reported in the experiments. The separation is gradually removed by the incoming turbulent structures but at different rates on the two sides of the blade. It will be shown that there is an optimal amount of turbulence intensity that minimises momentum thickness, which is strongly related to losses. Moreover, a discussion on the spanwise extrusion will be included, this being a major player in the modelling costs. Finally, the wall-clock time and the exact expenditure to run this case will be outlined, providing quantitative evidence of the feasibility of considering a quasi-DNS resolution in an industrial setting.

Graphical Abstract

1. Introduction

High-fidelity methods based on high-order discretisations are becoming of greater and greater interest to the turbomachinery community. Currently, Reynolds-Averaged Navier–Stokes (RANS) solvers constitute the bulk of the Computational Fluid Dynamics (CFD) studies due to their maturity and reduced cost. However, they do not provide the necessary detail or have difficulties converging in situations such as stall or to study tip–gap flow interaction, to name a few relevant examples. The lack of resolution of unsteady phenomena can pose a significant problem, as discussed by [1]. Without capturing these, it is impossible to account for the deterministic chaotic unsteadiness that is intrinsic to turbomachinery flows. Since small improvements in component efficiency are critical for reducing fuel burn and improving reliability [2], understanding these aspects becomes crucial. Additionally, a strength that unsteady CFD modelling has over experimental data is that it allows for a detailed understanding as to why certain events, such as turbulent transition mechanisms or the interaction of wakes with downstream components, occur [1]. This is not to say it will replace experiments, but rather, it can augment them to reach a detailed and verified understanding of their performance and aerodynamic behaviour. It is therefore expected that in the near future, more accurate unsteady Large Eddy Simulation (LES), and where possible, Direct Numerical Simulation (DNS) modelling will be carried out.
Another aspect that ought to be clarified relates to the shift from second-order Finite Volume (FV) discretisations to high-order Finite Element (FE) ones. While it is true that the former can produce results with the same level of accuracy as the latter, it would need a finer mesh. This increases the cost when compared to deploying a coarse grid with a variable polynomial order [3]. This explains why industrial settings, which require the fastest solution turn-around time possible, are increasingly interested in high-order methods.
Within the literature, there are many examples of the application of high-fidelity modelling to turbomachinery components, be it with either FV, FE, or Finite Difference (FD). As for compressors, ref. [4] carried out a 2.5 D DNS study of the NACA0065 at an angle of incidence of 42 ° and a Reynolds number (Re) of 138500, discussing the transition mechanisms on the suction and pressure side of the blade, with varied a degree of inflow disturbances. A series of publications [5,6,7] deployed an industrial FV solver to carry out a 2.5 D LES of compressor blades with experimental comparison, outlining recommendations for these types of studies. An important aspect demonstrating the accuracy improvements when shifting from RANS to LES was highlighted a while back by [8]; here, it was shown that the latter allow the improvement in tip–gap flow modelling of NASA Rotor 37. More recently, refs. [9,10] had a look at compressor losses in the following two different scenarios: first by assessing the differences with RANS models and then by varying the Reynolds number. In [11], the very same authors then assessed the effects of pressure waves travelling through the domain. Different off-design flow conditions were studied by [12] to understand clean inflow boundary layer transition mechanism. Another high-fidelity study on compressor blades was presented by [13], where DNS modelling was applied to riblets present on the aerofoil surface. Finally, ref. [14] looked into Machine Learning applications to conveniently extract flow features from high-fidelity CFD results.
In this paper a quasi-DNS 2.5 D study of a linear cascade compressor configuration [15] with R e = 320 , 000 will be carried out. A discussion of the aerodynamic behaviour on the pressure and suction side of the blade with a varying degree of inflow turbulence will be provided. It will be shown that there is an optimal amount of incoming turbulence that can be applied to reduce momentum thickness, a parameter linked to component losses. Additionally, an extrusion comparison at clean inflow conditions will be shown. Finally, the costs of running such simulations will be outlined, demonstrating the feasibility of these sort of studies.
The flow solver utilised for this study is the open-source spectral h/p element [16] code Nektar++ [17,18,19]. This has incompressible and compressible discretisations of the Navier–Stokes equations and their applications to turbomachinery components have been presented in [20,21].

2. Case Description

The case considered is a compressor linear cascade, with spanwise uniform extrusion [15]. The true chord is 0.125 [ m ] , while the pitch is 0.706 [ m ] . The Re (true chord-based c) is 320,000 , with a nominal angle of incidence of 52.8 ° . The inflow velocity magnitude is 39 [ m s ] . The experimental turbulence level was measured 0.25 c upstream of the blade and had an intensity of 2.4 ± 0.1 % and a length scale of 2.5 × 10 3 [ m ] ( 2 % c). In the remainder of the text, non-dimensional quantities will be used, except where clearly indicated. Reference values are reported in Table 1. The flow conditions are incompressible.

3. Numerical Setup

3.1. Meshing

The geometry was meshed in 2 D with GMSH [22], with 4 t h -order accuracy to ensure the surface curvature was properly represented. A fully quadrilateral strategy was deployed for the entire grid. This was to try and limit the amount of elements (in general, triangular meshes can result in a higher number for the same characteristic length). In the spanwise direction, given the periodicity of the case considered, the geometry was uniformly extruded using a Fourier Expansion [23,24], allowing a solver speed up through a modified parallelisation strategy. As mentioned, one of the goals of the study was to assess the cost of modelling this particular test case using either Wall-Resolved LES, if not DNS approaches. This is of critical importance for the industrial sector as it would provide accurate information to be able to understand the feasibility of such investigations on a broader scale with a Re that is within the lower range of those typically found in jet engine components [25]. After preliminary testing, it was decided to aim for DNS spatial resolution in the near-wall region, to minimise the numerical damping effect (Nektar++ does not have any small-scale models, any LES-range modelling is carried out by means of numerical/artificial diffusion. In the literature this is known as implicit LES or iLES). This with the aim of utilising the same grid could for the clean and turbulent inflow studies. To ensure either LES or DNS modelling [26], states that there are necessary ranges for the spatial resolution in the wall normal and both tangential directions. This is also true for the time step. Concerning the spatial counterpart, for high-order discretisations, such as those present in Nektar++, Δ x + and Δ y + should include the target polynomial order in their formulation, while Δ z + should not, due to the Fourier extrusion:
Δ x + = Δ x p τ w a l l ν Δ y + = Δ y p τ w a l l ν Δ z + = Δ z τ w a l l ν
where ( Δ x , Δ y , Δ z ) are the mesh spacing in the three directions, respectively, p is the solution polynomial order, τ w a l l is the wall-shear stress magnitude (its magnitude should be used, and not each component individually; this is sometimes the cause of confusion), and ν is the kinematic viscosity. Due to the incompressible nature of the flow, no density was included in the formulation. To speed up the mesh design process, it is possible to run the case using standard FV-RANS modelling and extract the approximate wall-shear stress magnitude to estimate the mesh sizing required if a certain polynomial order ought to be used for a target near-wall resolution. One may therefore write the following:
Δ x = ν p Δ x + τ w a l l Δ y = ν p Δ y + τ w a l l Δ z = ν Δ z + τ w a l l
where once again, no polynomial order has been considered for z. This generally provides a good starting point for the unsteady simulation meshing strategy, as the target values of Δ x + , Δ y + , and Δ z + are indicated within the literature.
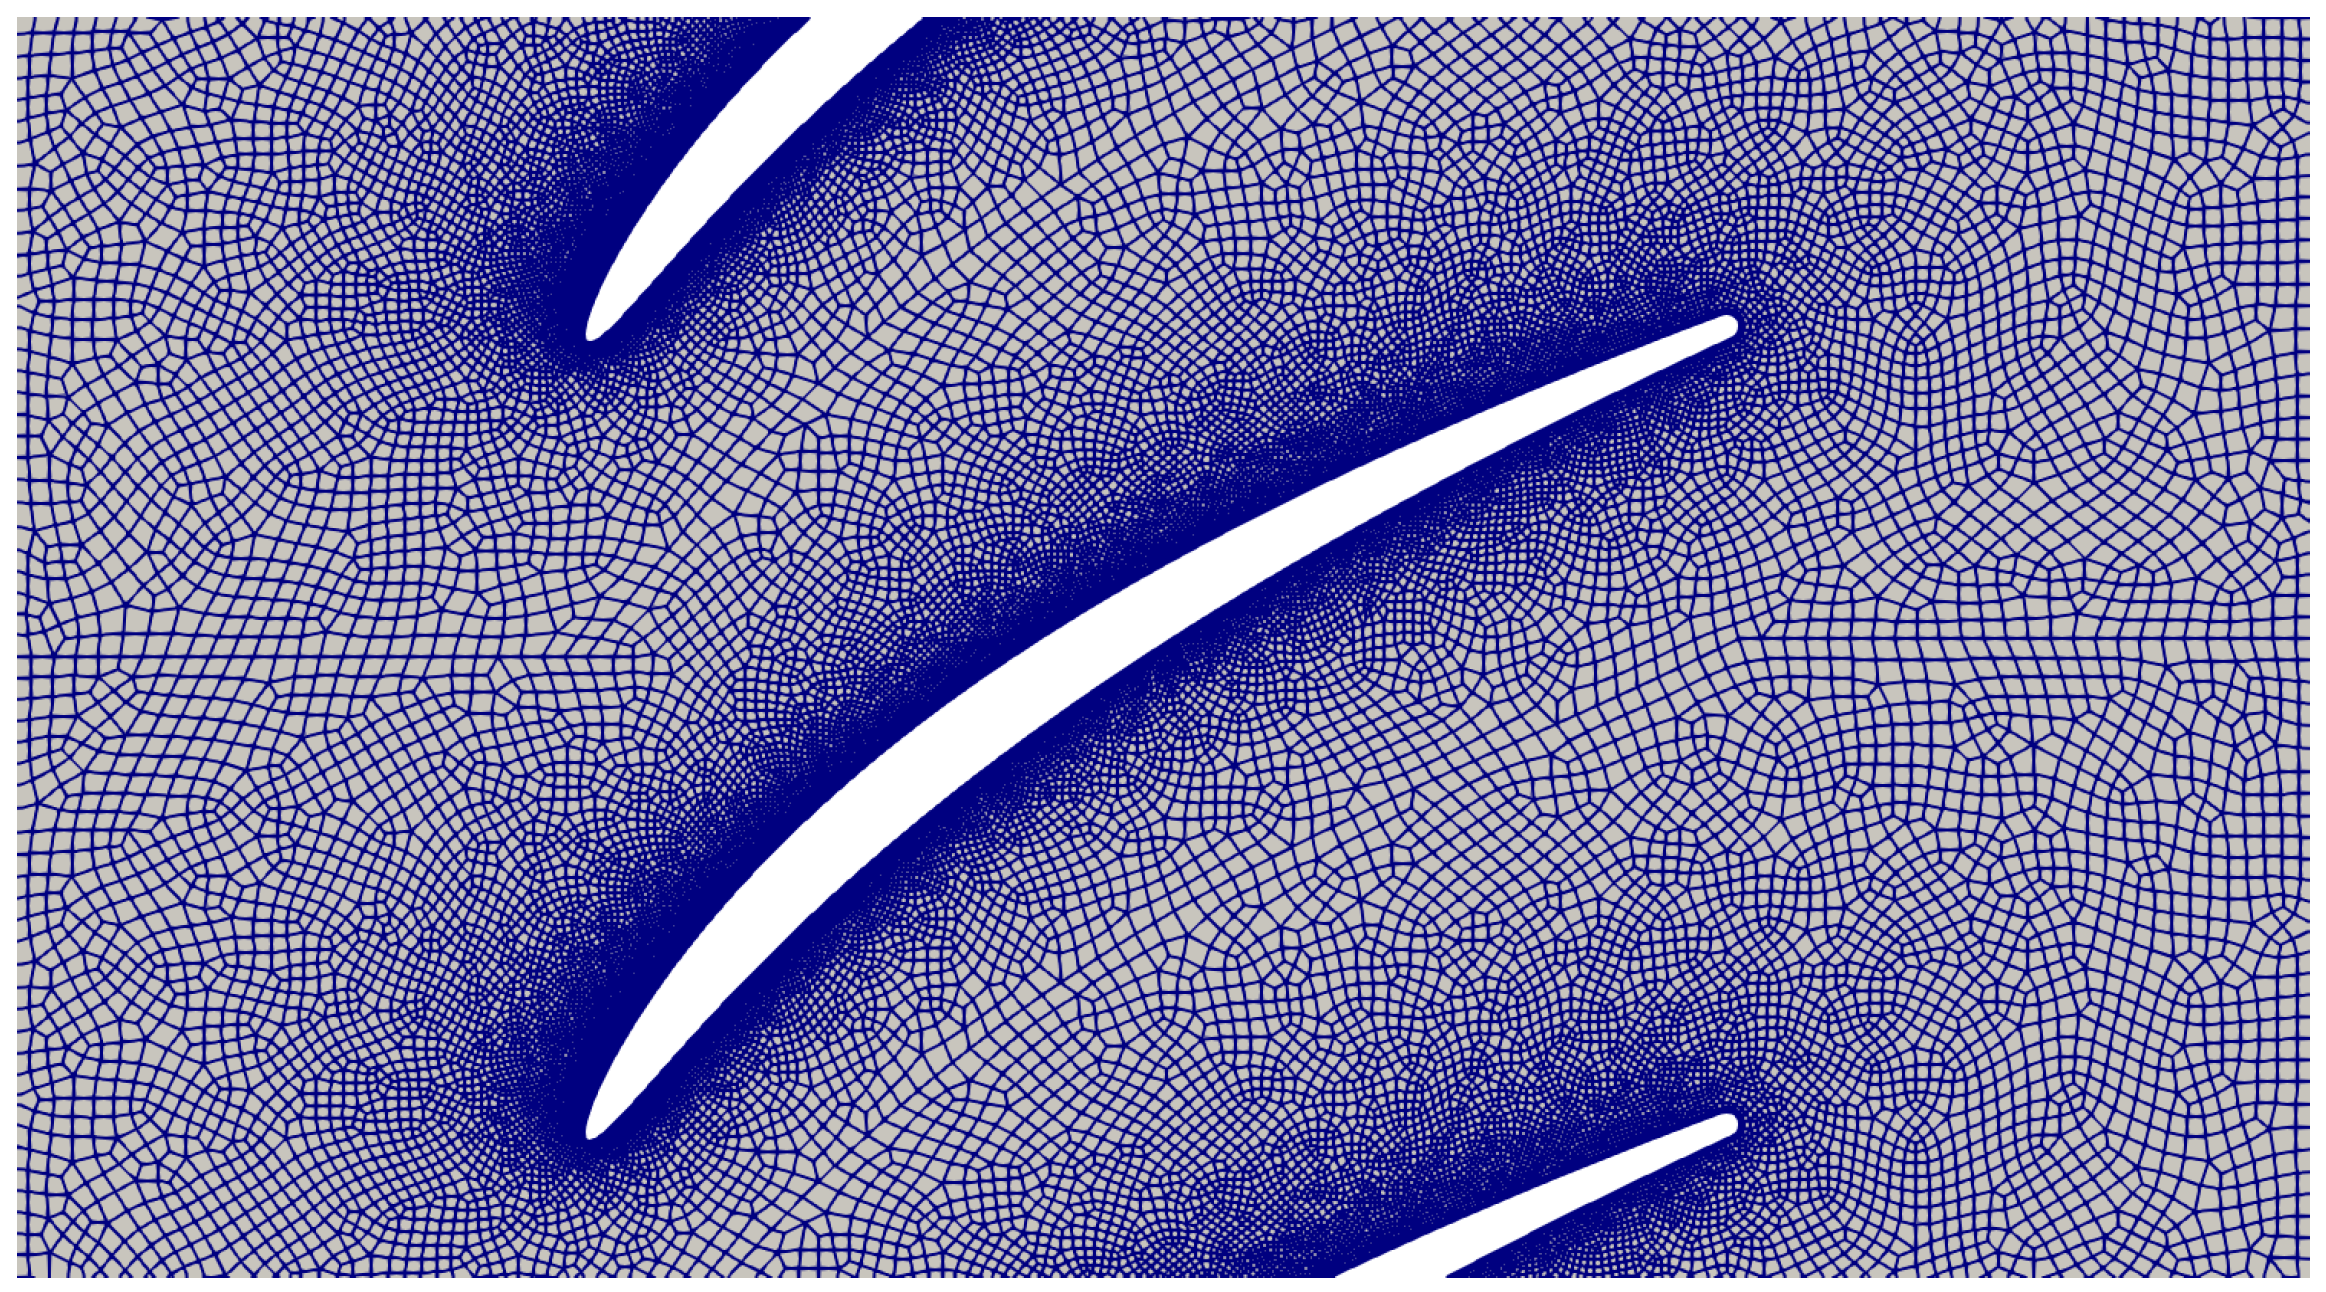
The final mesh resolution for polynomial order 5 is reported in Figure 1. Here, the clean inflow case wall-shear stresses were used as these were found to be larger than those of the turbulent inflow, and thus, they would be more stringent in terms of mesh sizing. The x y -plane linear grid is shown in Figure 2. In terms of true chord length, the largest high-order elements in the mesh had a size of 3.2 × 10 3 . Concerning the spanwise direction, an extrusion ( L z ) of 10 % of the true chord was carried out requiring 160 Fourier modes ( N z ) to reach DNS resolution.

3.2. Solver

This particular case was experimentally tested in incompressible conditions; therefore, the equivalent Nektar++ formulation was deployed. This consists of a velocity-correction scheme [27], whereby a sequential solution for the velocity and pressure terms is carried out. As mentioned, the spatial discretision had a polynomial order of 5: this is true only for the velocity terms, while pressure was reconstructed using a fourth order polynomial. This is called Taylor–Hood discretisation and is used to avoid any checkerboarding effects. The Continuous Galerkin formulation was employed in between elements; this effectively ensures that the C 0 continuity of the velocity vector and the pressure terms are achieved. To allow for a reasonable time step, a minimal dose of spectral-vanishing viscosity was employed [28]. This consists of a forcing term ( S v v ( u ) ) that is added to the momentum terms of the incompressible Navier–Stokes equations as follows [29]:
u t = ( u × ) u P + ν 2 u + S v v ( u )
Two variants were used as follows: in the x y -plane, the Discontinuous Galerkin-Kernel was deployed [30]. This automatically considers the time step and convective strength to filter out small scales. In the Fourier plane, instead, this formulation was not available, and thus, the Exponential Kernel [31] was used. It was set to 95 % , i.e., only the smallest 5 % of the scales would be cut off. Time stepping was carried out by means of the second-order accurate implicit–explicit scheme. In this case, the implicit part refers to the diffusive terms, while the explicit time discretisation was used for the convective quantities. After repeated testing, the largest time step possible was used. This differed between the clean and turbulent inflow: while the former required the more stringent non-dimensional value of 10 5 , the latter allowed a larger 2.5 × 10 5 . This was necessary when studying the case, as considerable tuning was required to match the experimental loading. Furthermore, the case exhibited low frequency behaviour, meaning that each test had to be run for a non-dimensional time of 10 units once any initialisation effects had been removed. This corresponded to 1 million and 0.4 million time steps for the clean and turbulent inflow cases, respectively.
Concerning the boundary conditions, this case has two sets of matching periodic surfaces in the pitchwise and spanwise directions, respectively. At the inflow, the velocity vector and the pressure were set through Dirchlet and von Neumann boundary conditions. The opposite was true at the outflow.
A final, important point relates to the inflow turbulence methodology. The technique of [29,32,33] was deployed in this particular case and consists of a synthetic turbulence generation method applied to the inflow plane. This allows for various parameters to be changed. In this work, the turbulence intensity ( T I ) was set to 1 % , 2 % , 4 % , 5 % , and 8 % . A more in-depth description of the turbulent inflow boundary condition is provided in Appendix A.

4. Clean Inflow

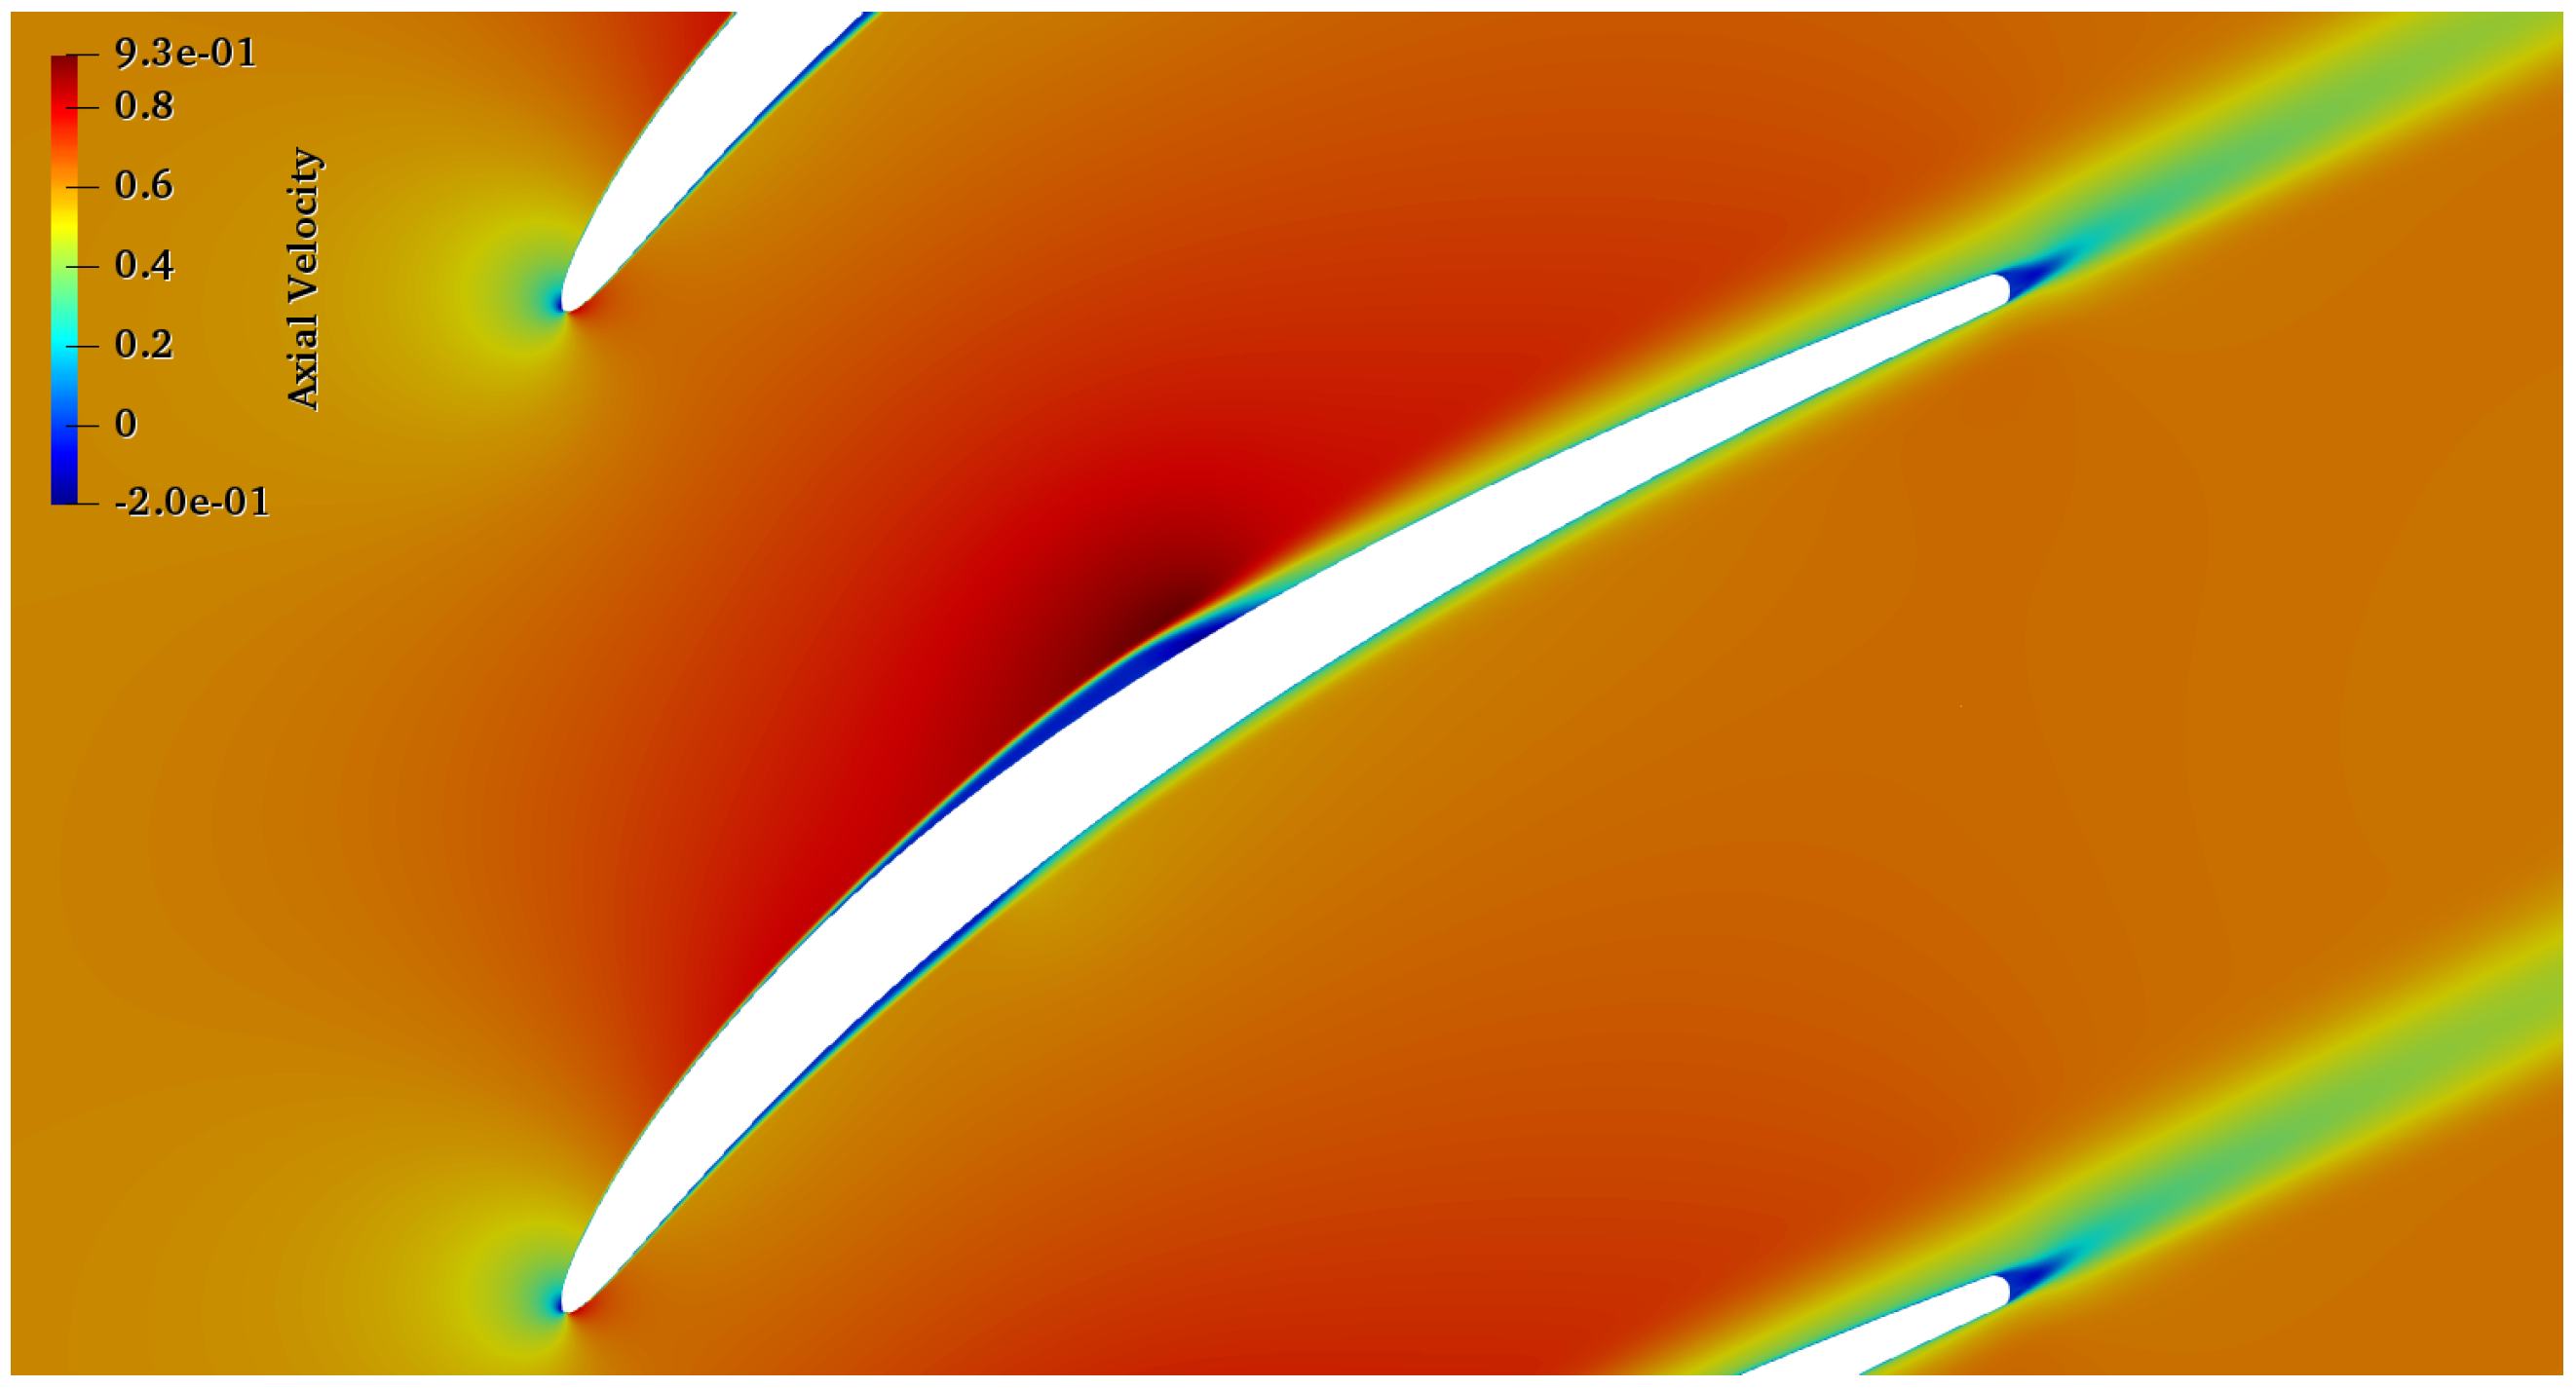
The time-averaged Fourier mean-mode flow field is shown in Figure 3. A large separation bubble is present on the suction side; this is consistent with the experimental data of [15]. The authors claimed it would then disappear by either increasing the inflow angle of incidence or by turbulence injection. However, the experiments did not show any bubble on the pressure side of the blade. Nonetheless, it is not the first time that simultaneous separation bubbles have been shown on either side of the blade; ref. [4] reported their presence on a NACA0065 at 42 ° incidence. The pressure loading is shown in Figure 4. The first point of note concerns the experimental data point (black crosses) discrepancies with the clean inflow CFD results; the latter shows a large difference in size between the suction and pressure side bubbles. The reason behind the second angle of incidence ( 53.5 ° ), other than the nominal one ( 52.8 ° ), relates to the load matching; when injecting turbulence, unless the angle is slightly varied, it will not align with the experimental distribution. From this point onwards, only results at the corrected angle of 53.5 ° will be presented.
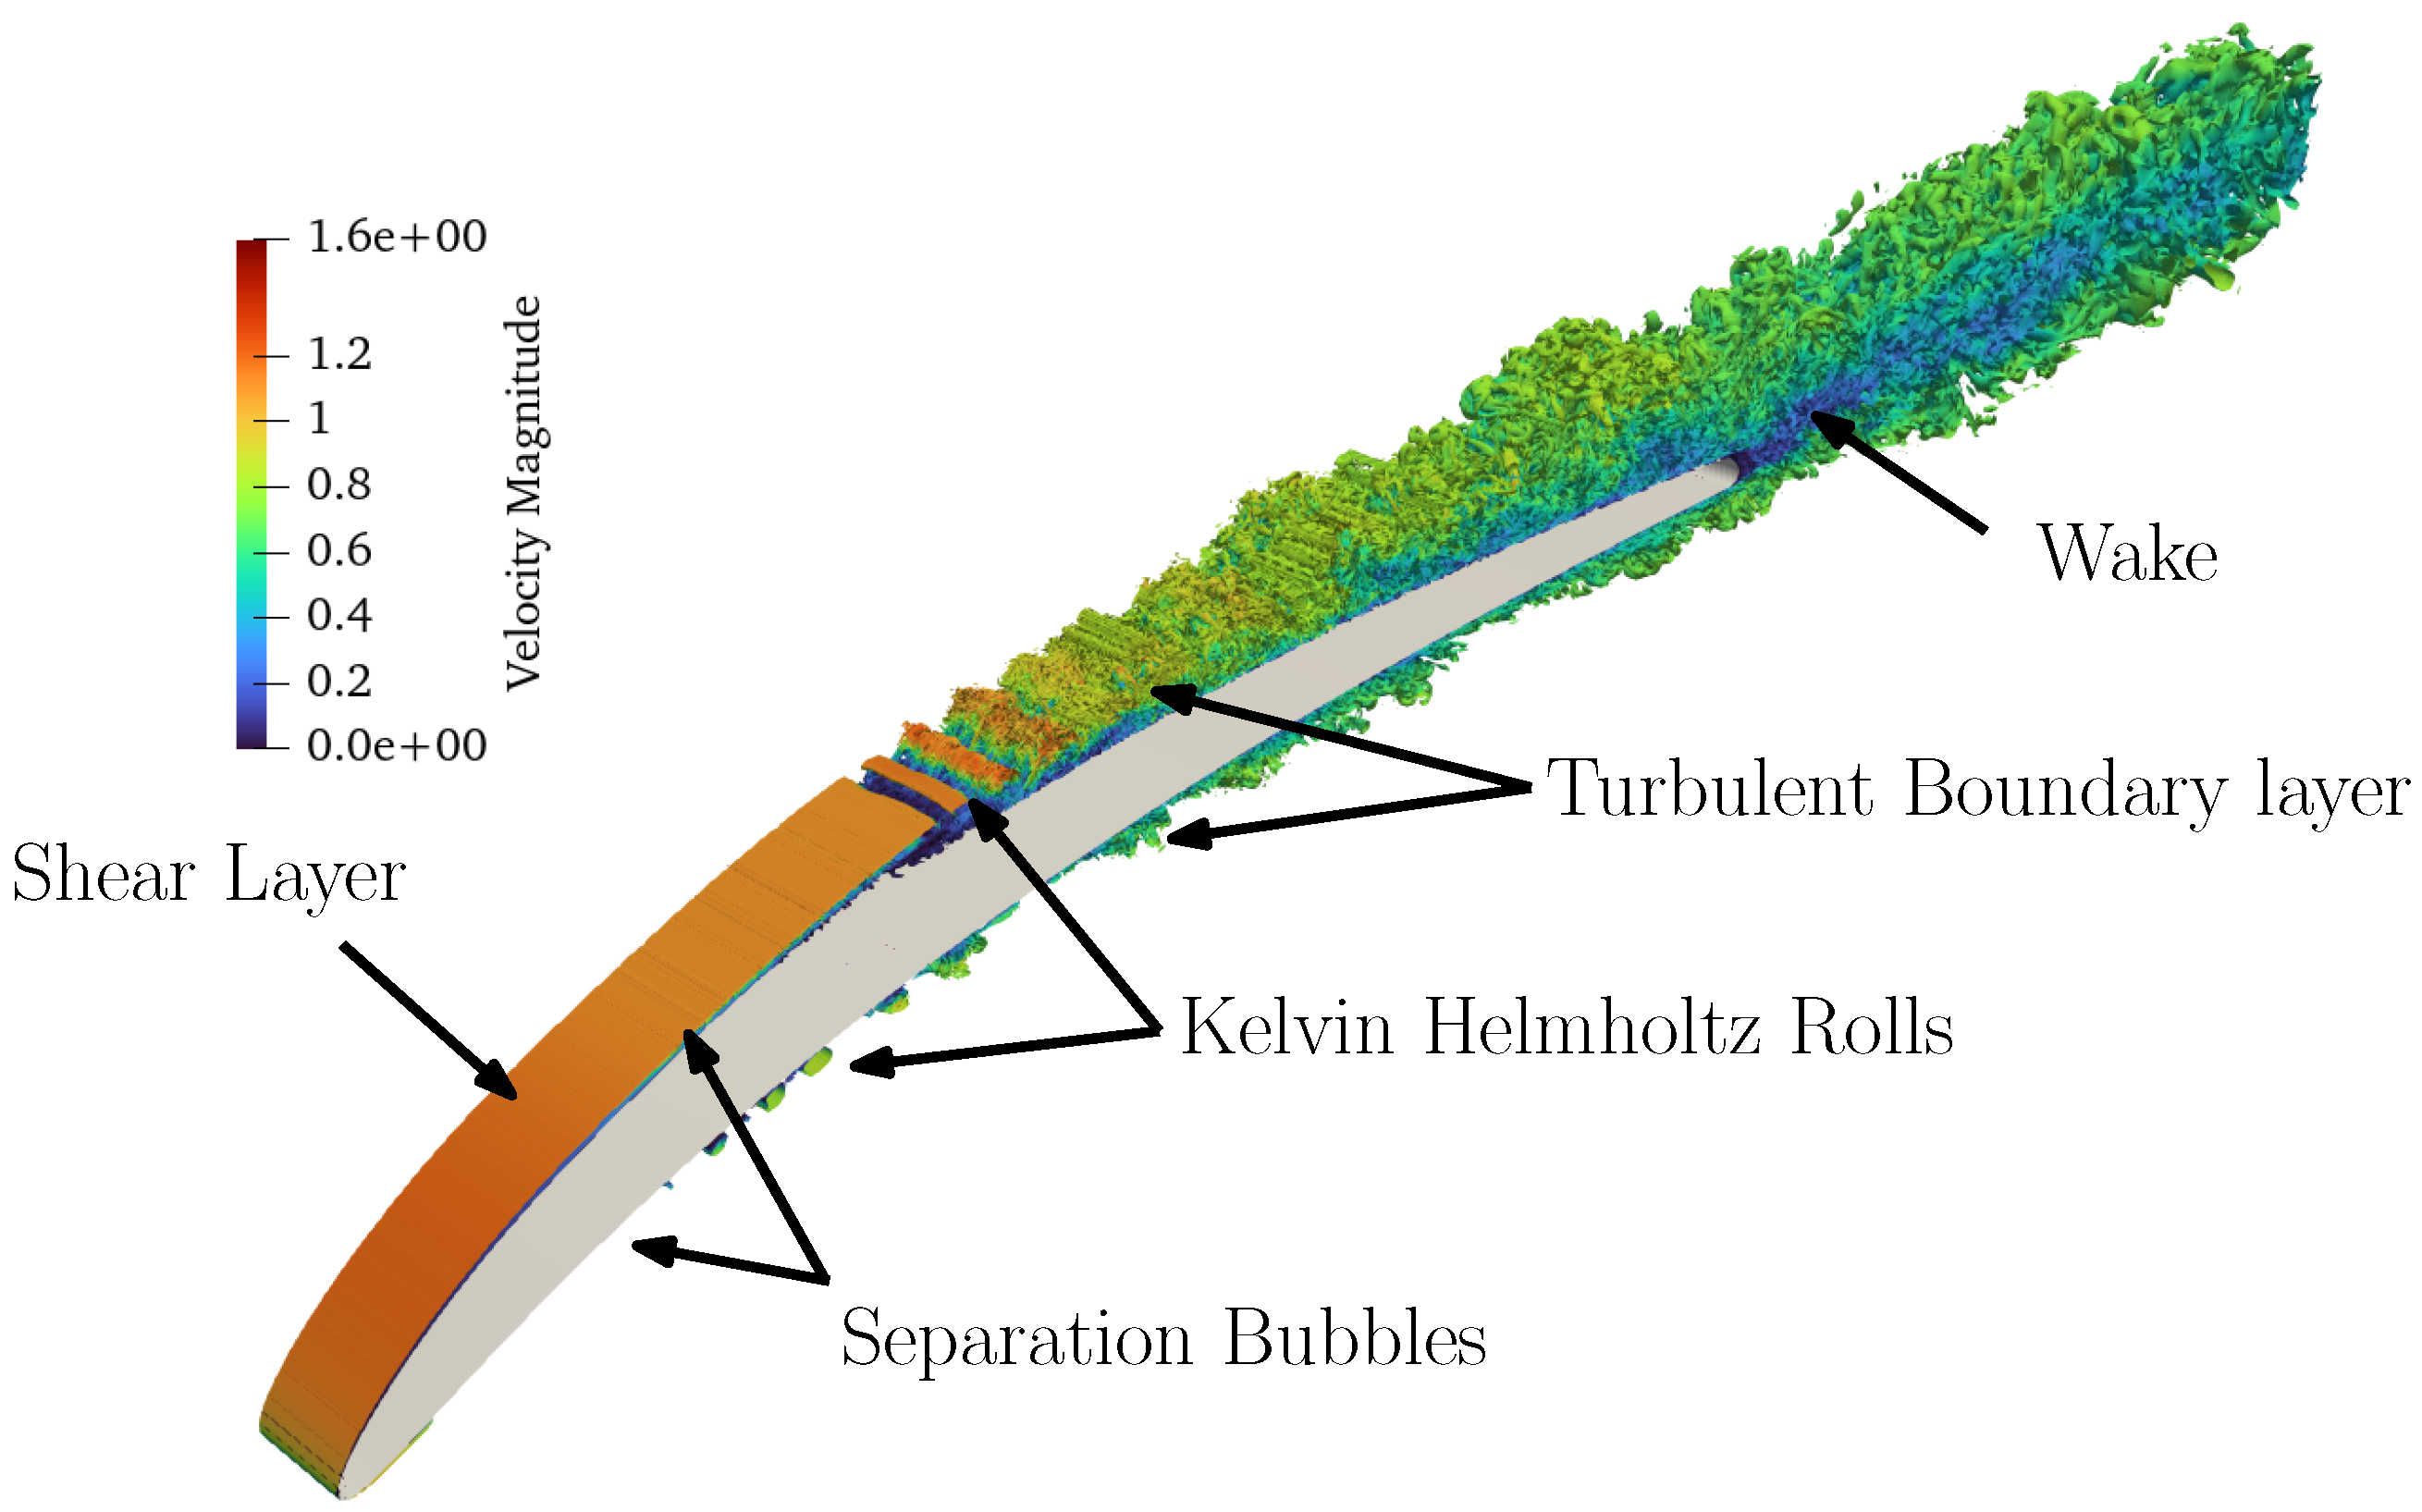
The instantaneous Q-criterion contours coloured by the velocity magnitude are shown in Figure 5. On both sides of the blade, Kelvin–Helmholtz (KH) rolls are formed with transition to turbulence thereafter. The separation occurs at different locations on the pressure and suction side of the blade as follows: x = 0.0963 and 0.1561 , respectively. Referring to the pressure coefficient in Figure 4, it is obvious that unlike the pressure side, the suction side undergoes a region of favourable pressure gradient upstream.
Considering the pressure side, Görtler vortices could be present. The related measure to assess whether they appear is as follows [34]:
G = u ¯ δ 99 θ ν θ R
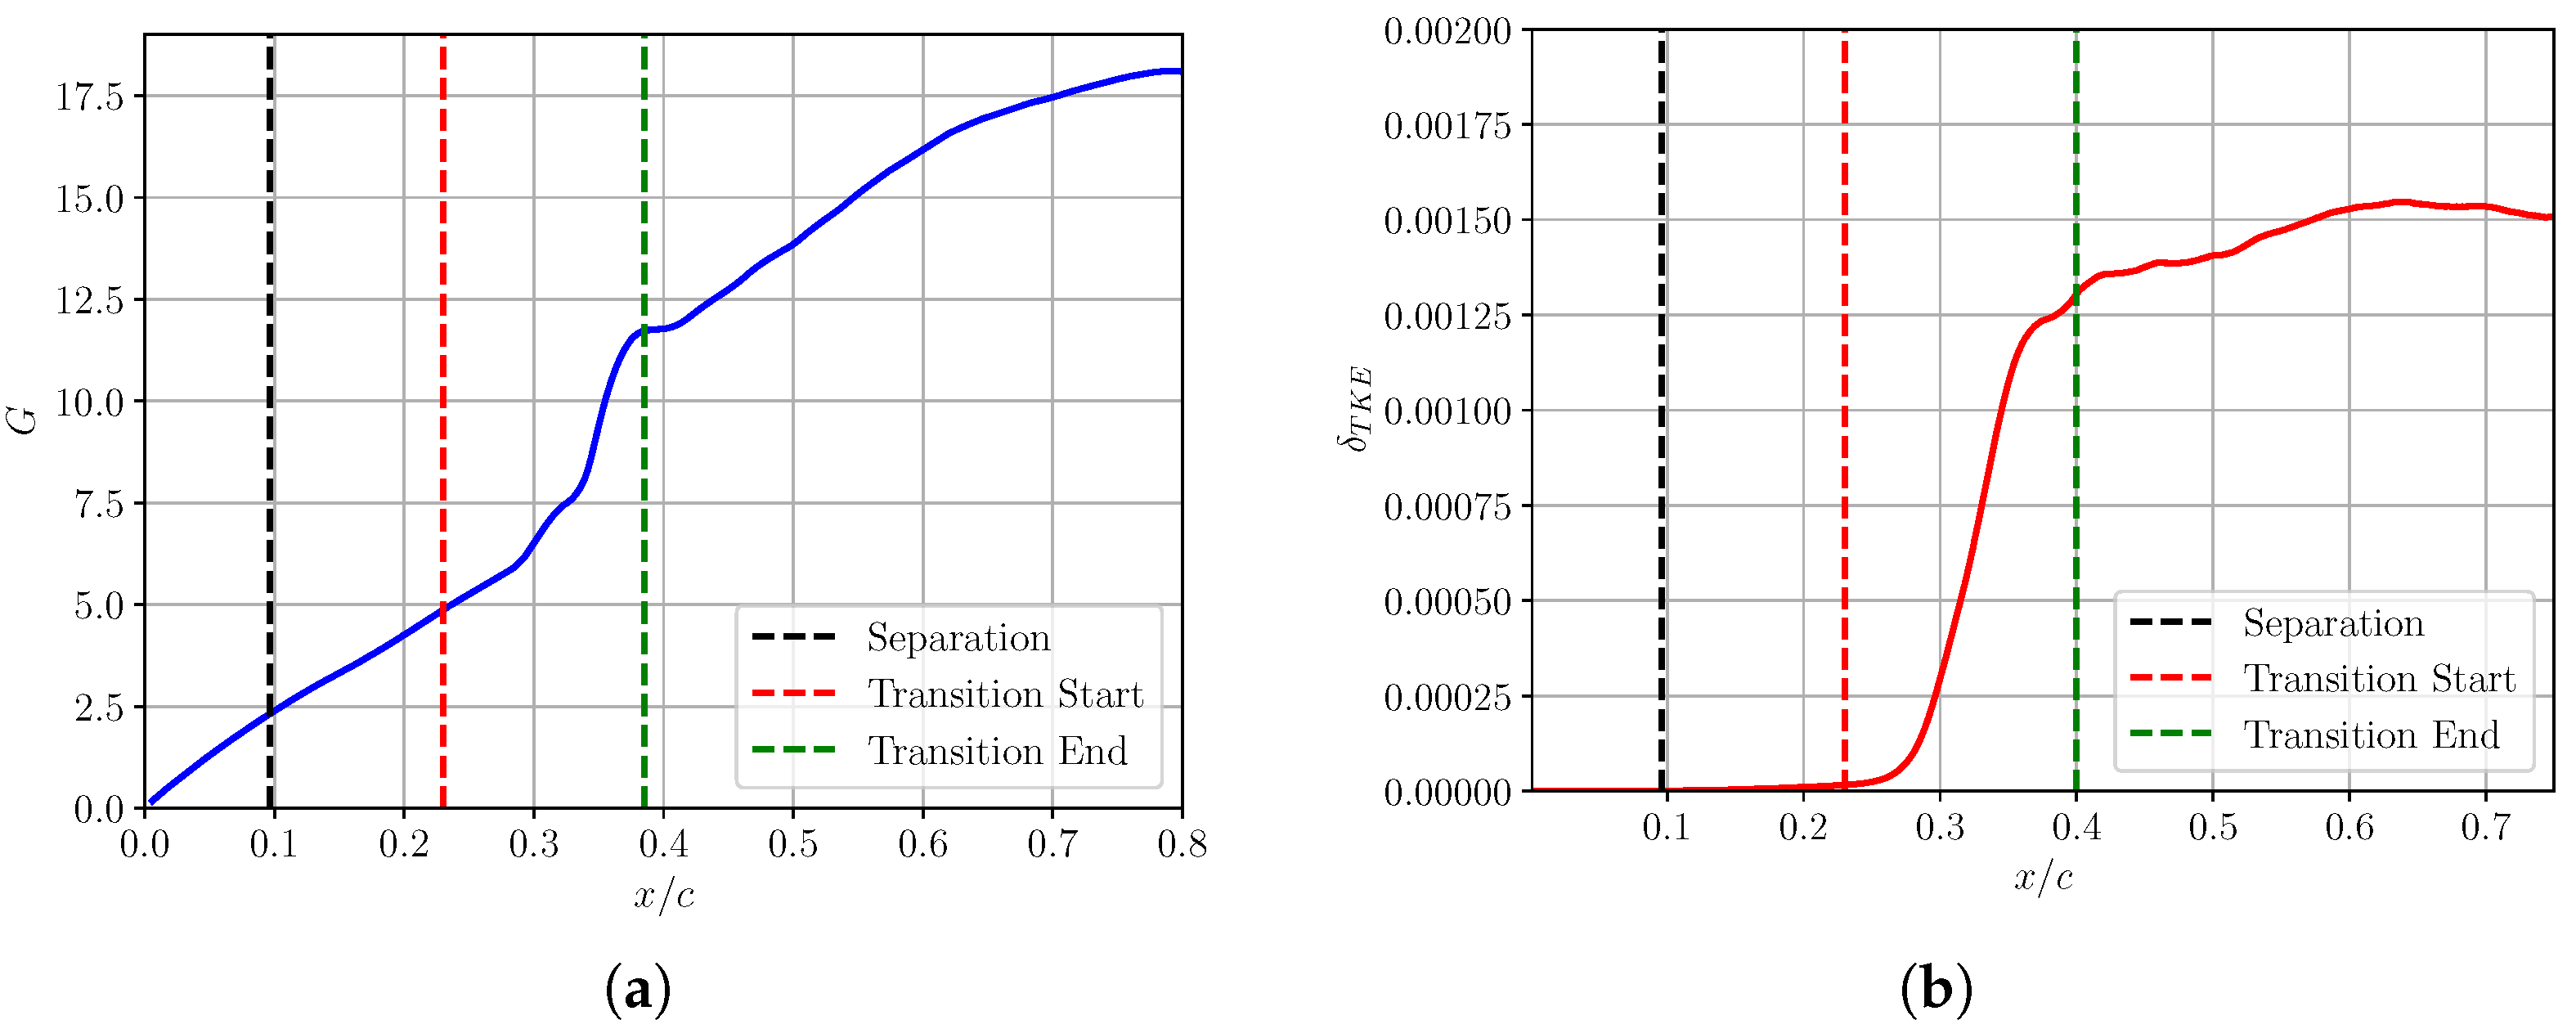
where u ¯ δ 99 is the time-averaged velocity at the boundary layer limit ( δ 99 ), θ is the momentum thickness, and R is the radius of curvature of the surface (in this particular work, the boundary layer height and reference velocity are computed using the methodology of [35]; a brief description is provided in Appendix B). When G = 0.3 , this type of instability can be triggered, while the vortices may be seen when G 5 6 [4]. A plot of this quantity is reported in Figure 6a; this clearly indicates that the disturbance could be present. Considering the Blackwelder number ( δ T K E ) defined as follows [36]:
δ T K E = 1 u ¯ δ 99 2 0 δ 99 u u ¯ + v v ¯ 2 d y
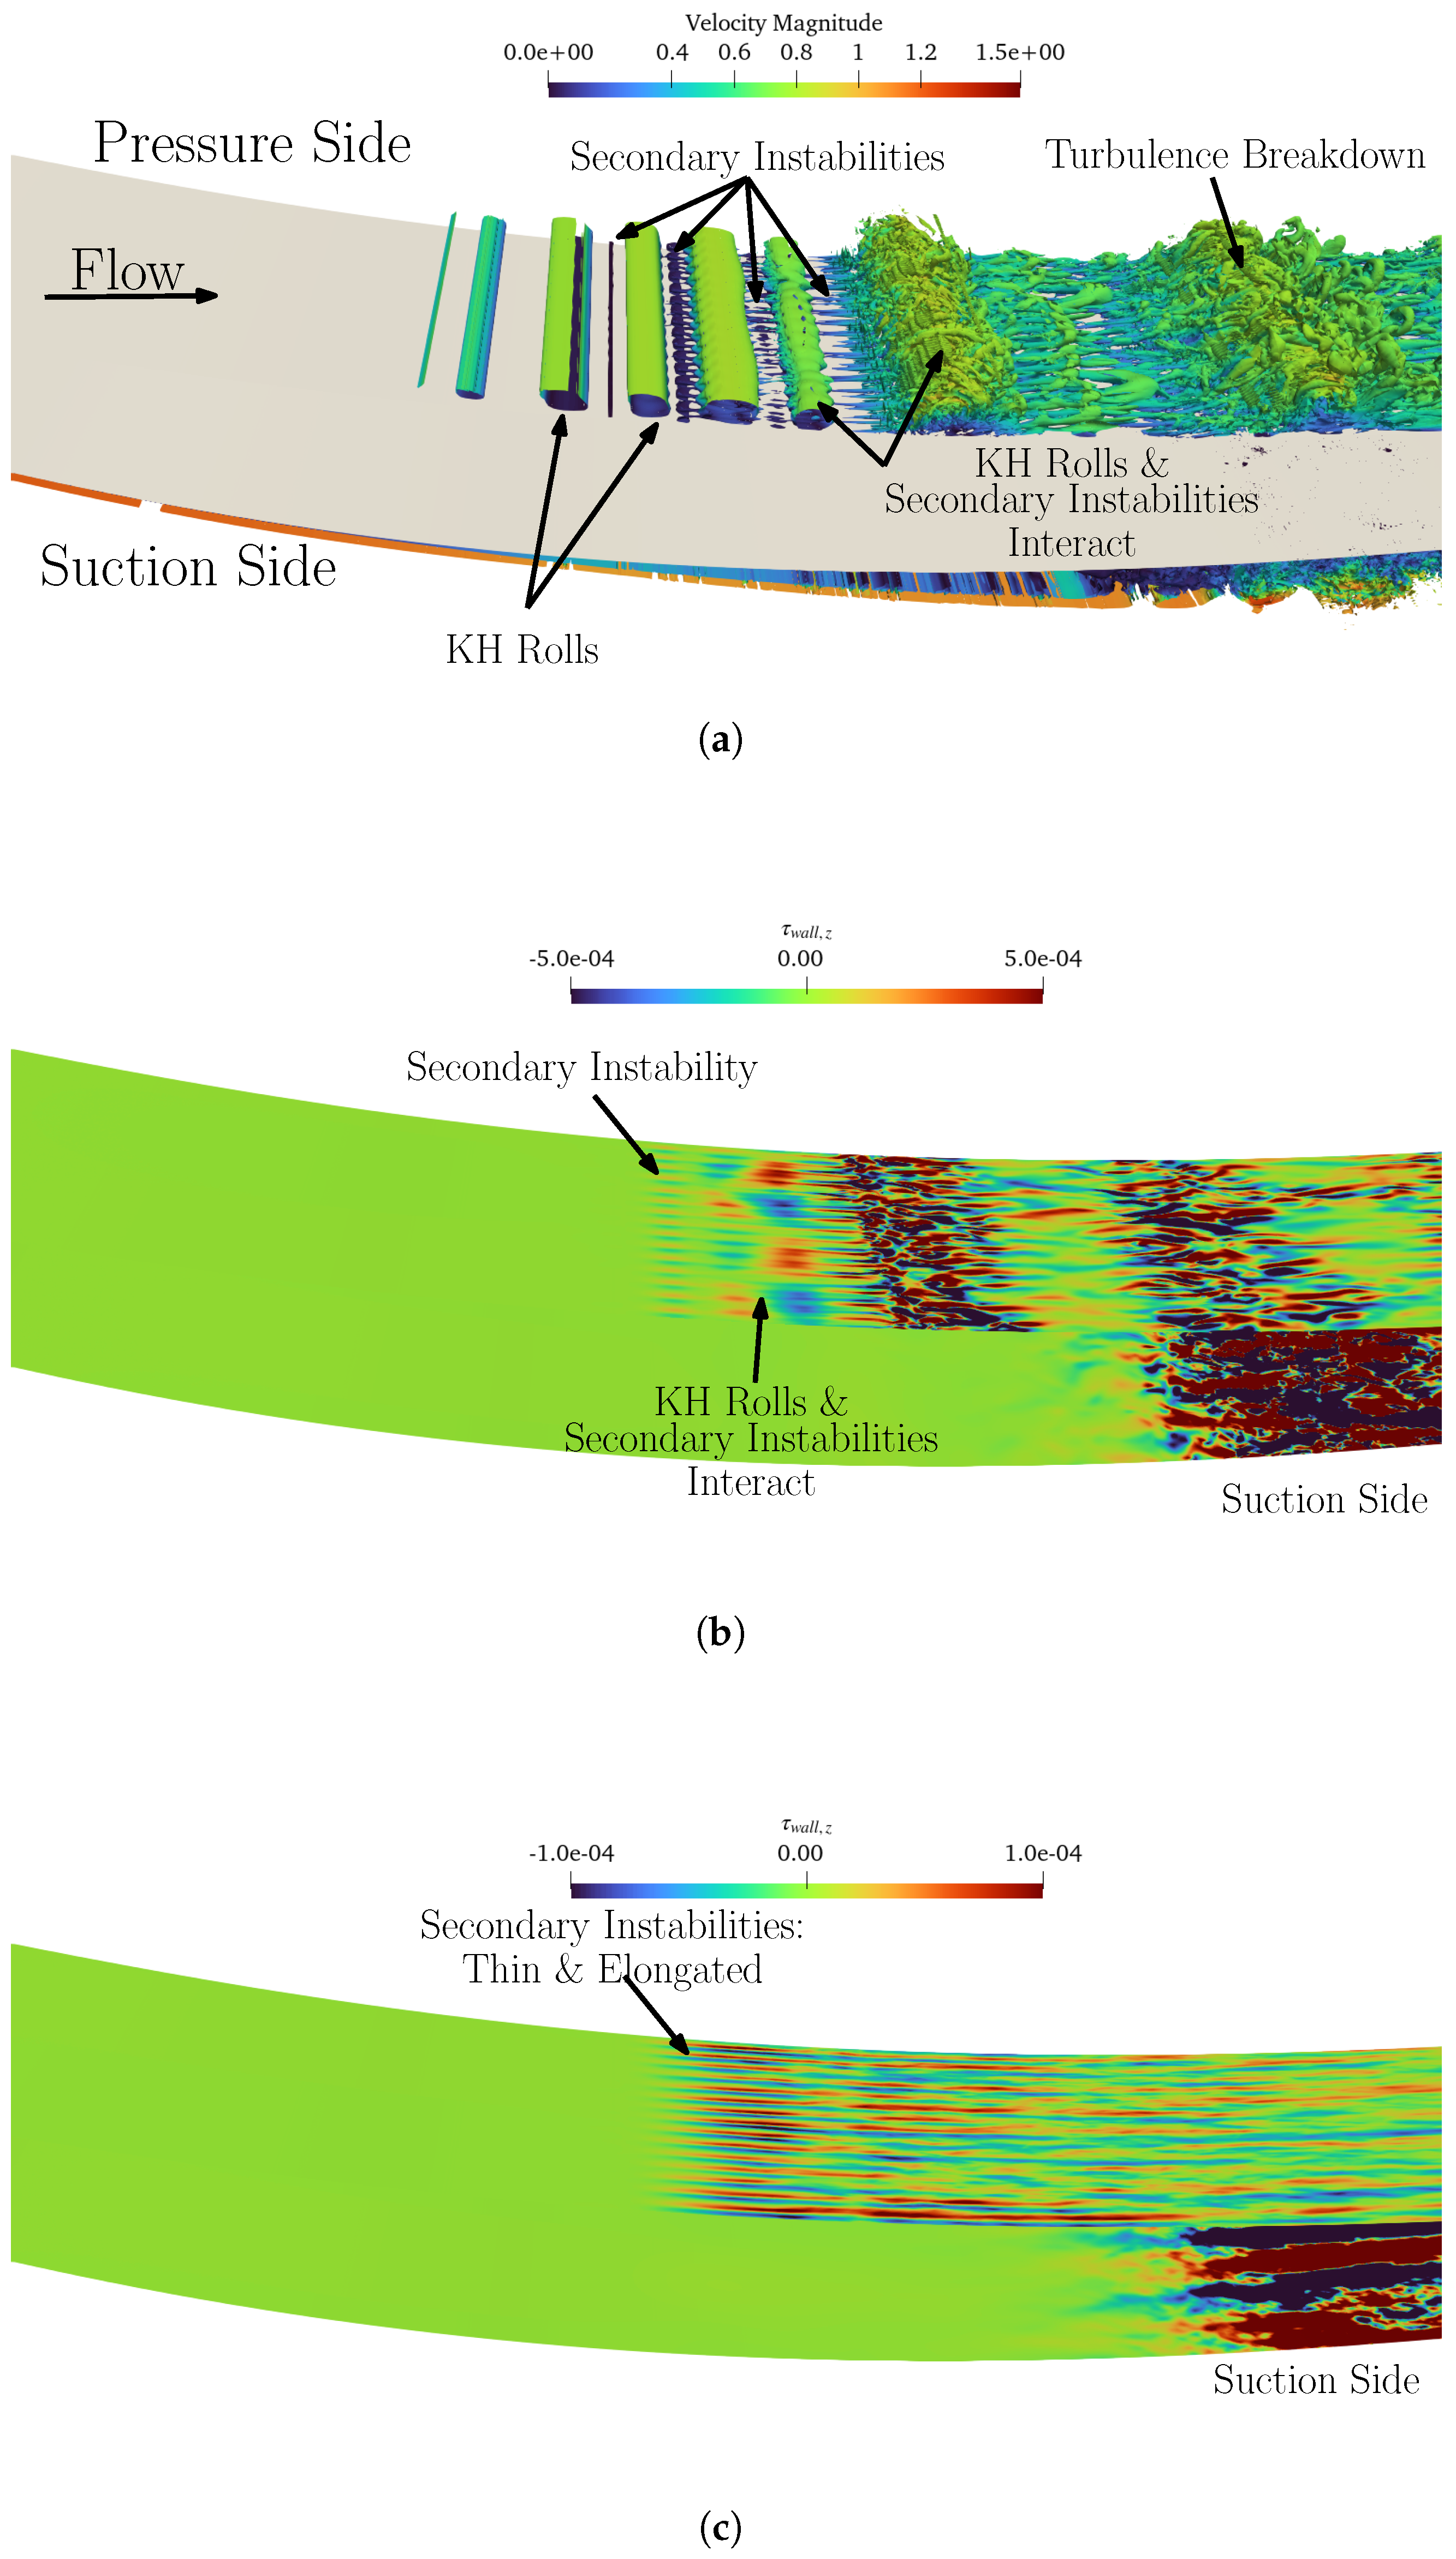
where u u ¯ and v v ¯ are two components of the Reynolds stresses, it is possible to determine an accurate transition start and end (Figure 6b). The estimated transition range contains the values whereby the Görtler vortices may be seen, hinting at the fact that they may be affecting the transition mechanism. Despite repeated attempts, these could not be seen in any of the Q-criterion contours. Figure 7a shows the blade pressure side, with the flow direction clearly indicated. The structures appearing are an interleaving of KH rolls and what appear to be secondary instabilities that assume a narrow and elongated shape, ultimately wrapping around the spanwise rolls. Figure 7b,c display the instantaneous and time-averaged wall-shear stresses, respectively. The transition mechanism is therefore a joint effort of the two; the secondary instability forms and is then picked up by the KH rolls.
Considering the Power Spectral Density (PSD) evaluated along the pressure side at locations A , B , C (Figure 8a), Figure 8b shows that clearly dominant frequencies can only be seen within the bubble at point B. This refers to the KH shedding rate and has a value of 13 (∼ 4056 [ Hz ] ). Significantly lower energy peaks can also be seen at ∼26 (∼ 8112 [ Hz ] ) and ∼39 (∼ 12 , 168 [ Hz ] ), these being harmonics of the base frequency. Careful inspection of the behaviour at point A does reveal very low energy peaks at 8 (∼ 2496 [ Hz ] ) and 13 (∼ 4056 [ Hz ] ). This is just upstream of separation ( x = 0.0866 ) and could therefore be a Tollmien–Schlichting (TS) wave. To this end, ref. [37] reported an analytical relation to estimate the frequency of the maximum amplification of these instabilities when pressure gradients are present. This is based on the work of [38]; the authors plotted the Falkner–Skan profiles for a series of cases showing a clear trend for this particular frequency (the interested reader is referred to Figure 8 in [37]). The maximum amplification frequency f M A may be estimated as follows:
f M A = 3.2 u ¯ δ 99 2 ν R e δ * 1.5
where R e δ * 1.5 is the displacement thickness ( δ * )-based Re. Using the values determined at point A, f M A was estimated to be ∼15 (∼ 4680 [ Hz ] ), very close to the parameter extracted from the PSD plot at that location and within the broadband peak at B. Therefore the presence of a very weak TS wave is a possibility. Nonetheless, Figure 7a points towards the KH structures as being the source of transition.
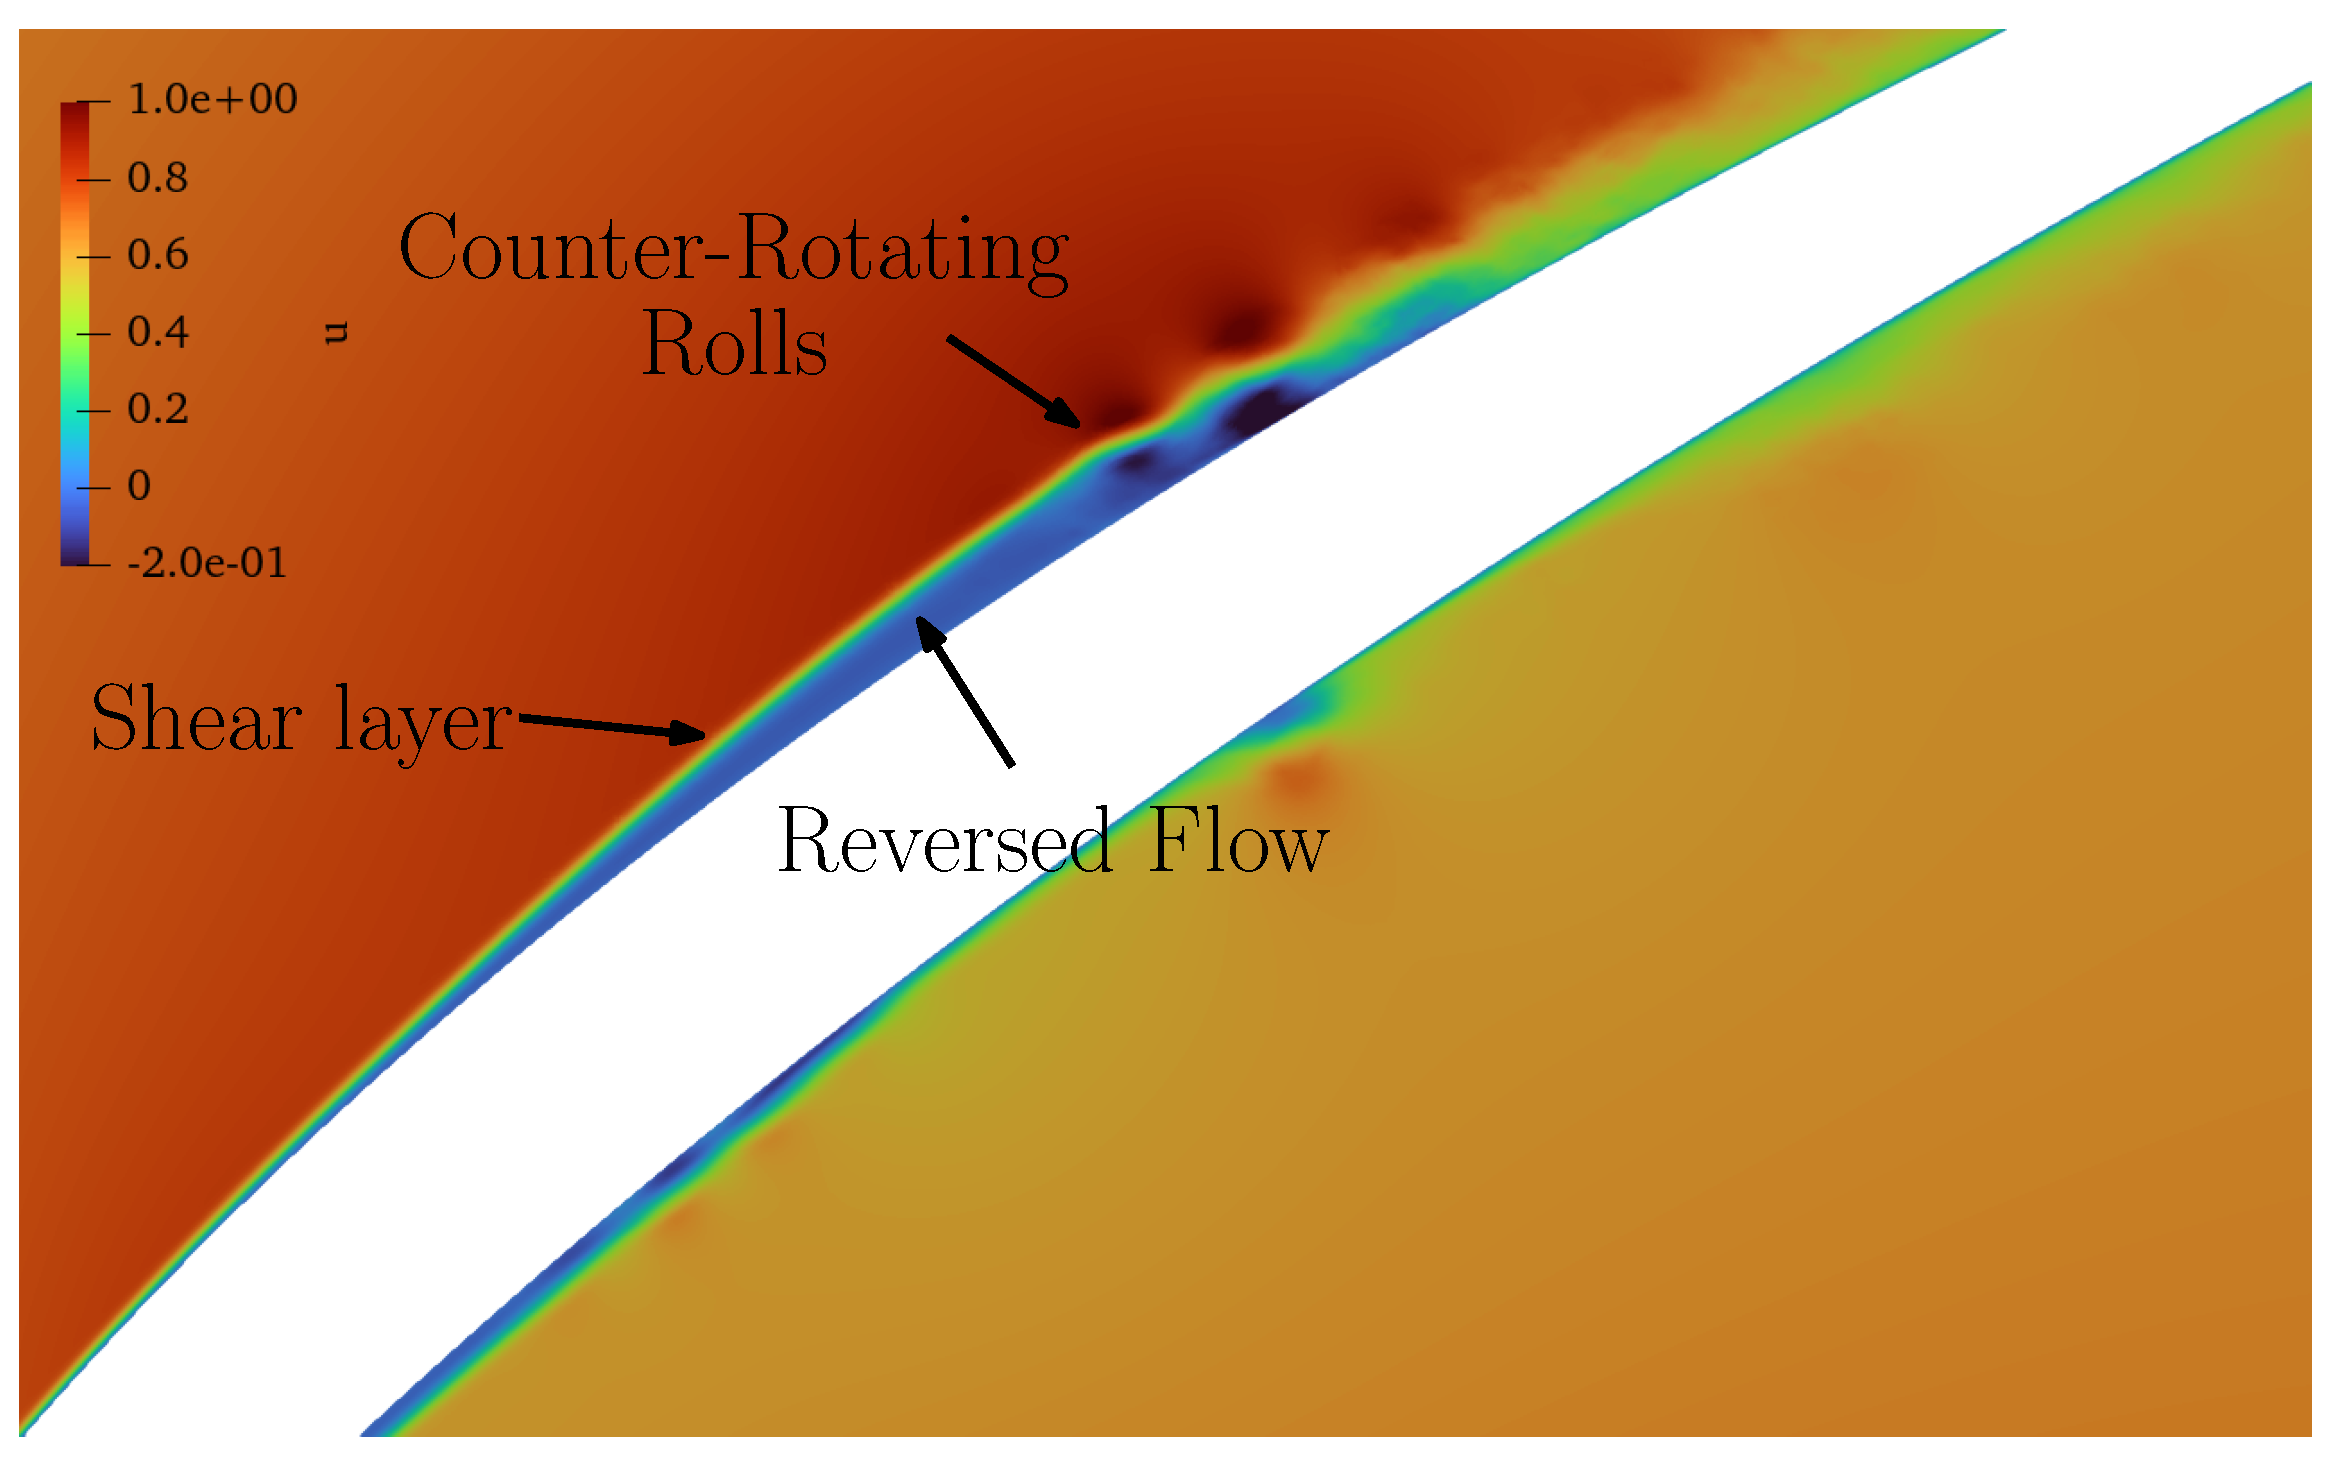
Regarding the blade suction side, the transition mechanism is believed to be in accordance with what [39] described for a flat plate with an adverse pressure gradient. Considering sampling points 1–5 (Figure 8a), Figure 8c clearly shows that a low frequency peak ( f 13 [ . ] -∼ 4096 [ Hz ] ) is formed very close to the blade leading edge, well within the acceleration region and consequently upstream of the separation point. This continues to grow in amplitude and is still present at point 4. This appears to be the same as that seen on the pressure side and is too is believed to be related to a TS wave. Figure 9 elucidates why the transition mechanism is that discussed by [39]: this image shows a very strong similarity with Figure 7 in their paper where they discuss how the turbulence initiation process is related to the vortices being ejected from the bubble interacting with the shear layer roll-up above. Therefore, even in this case, the transition mechanism relates to the KH instability. Moreover, as in their results, the KH rolls possessed the same frequency as that of the TS waves detected upstream (even though that was a flat plate with different Re and loading). In the literature, there are other examples relating the transition mechanism on compressor suction sides to KH rolls in the absence of inflow disturbances [4,12].
The estimated suction side transition region using the Blackwelder parameter is shown in Figure 10. Clearly, this occurs significantly downstream with regard to the pressure side (Figure 6b); this is in agreement with the findings of [4].

5. Extrusion Length-Clean Inflow

This part of the study was conducted to ensure that the largest structures that naturally appear in the flow are contained within the domain. In fact, refs. [4,5,6,7] argued that the extrusion should be multiple times the maximum boundary layer height. However, no real quantification or clear indication was given, with the only comparison being between 4 % and 20 % true chord spanwise lengths (moreover, these employed symmetry not periodic boundaries, with clear inaccuracies introduced in their vicinity). As mentioned in Section 3.1, the default case had a 10 % true chord extrusion with 160 Fourier modes to discretise it. As shown in Figure 11, the maximum boundary layer height appears on the suction side and is approximately 5 % chord. Therefore, the results in Section 4 were achieved with a spanwise extrusion double the maximum δ 99 . To assess whether this was sufficient and whether there were no structures larger than this extrusion amount, the domain was extended to 20 % true chord. To ensure that the comparison was as consistent as possible, the spanwise resolution had to be doubled to N z = 320 , keeping Δ t = 10 5 .
To quantify and systematically compare the two cases, the sampling lines extended in the spanwise direction used to compute the PSD (location in Figure 8a) were used to calculate the autocorrelation ( R i k ) defined as follows [29]:
R i k ( Δ z ) = 1 N z i = 1 N z u i ( z i ) u k ( z i + k × Δ z ) t u i 2 t
where i and k are the point locations along the sampling line in z, Δ z is the distance between the points, and . t is the time average of the fluctuating velocity components u .
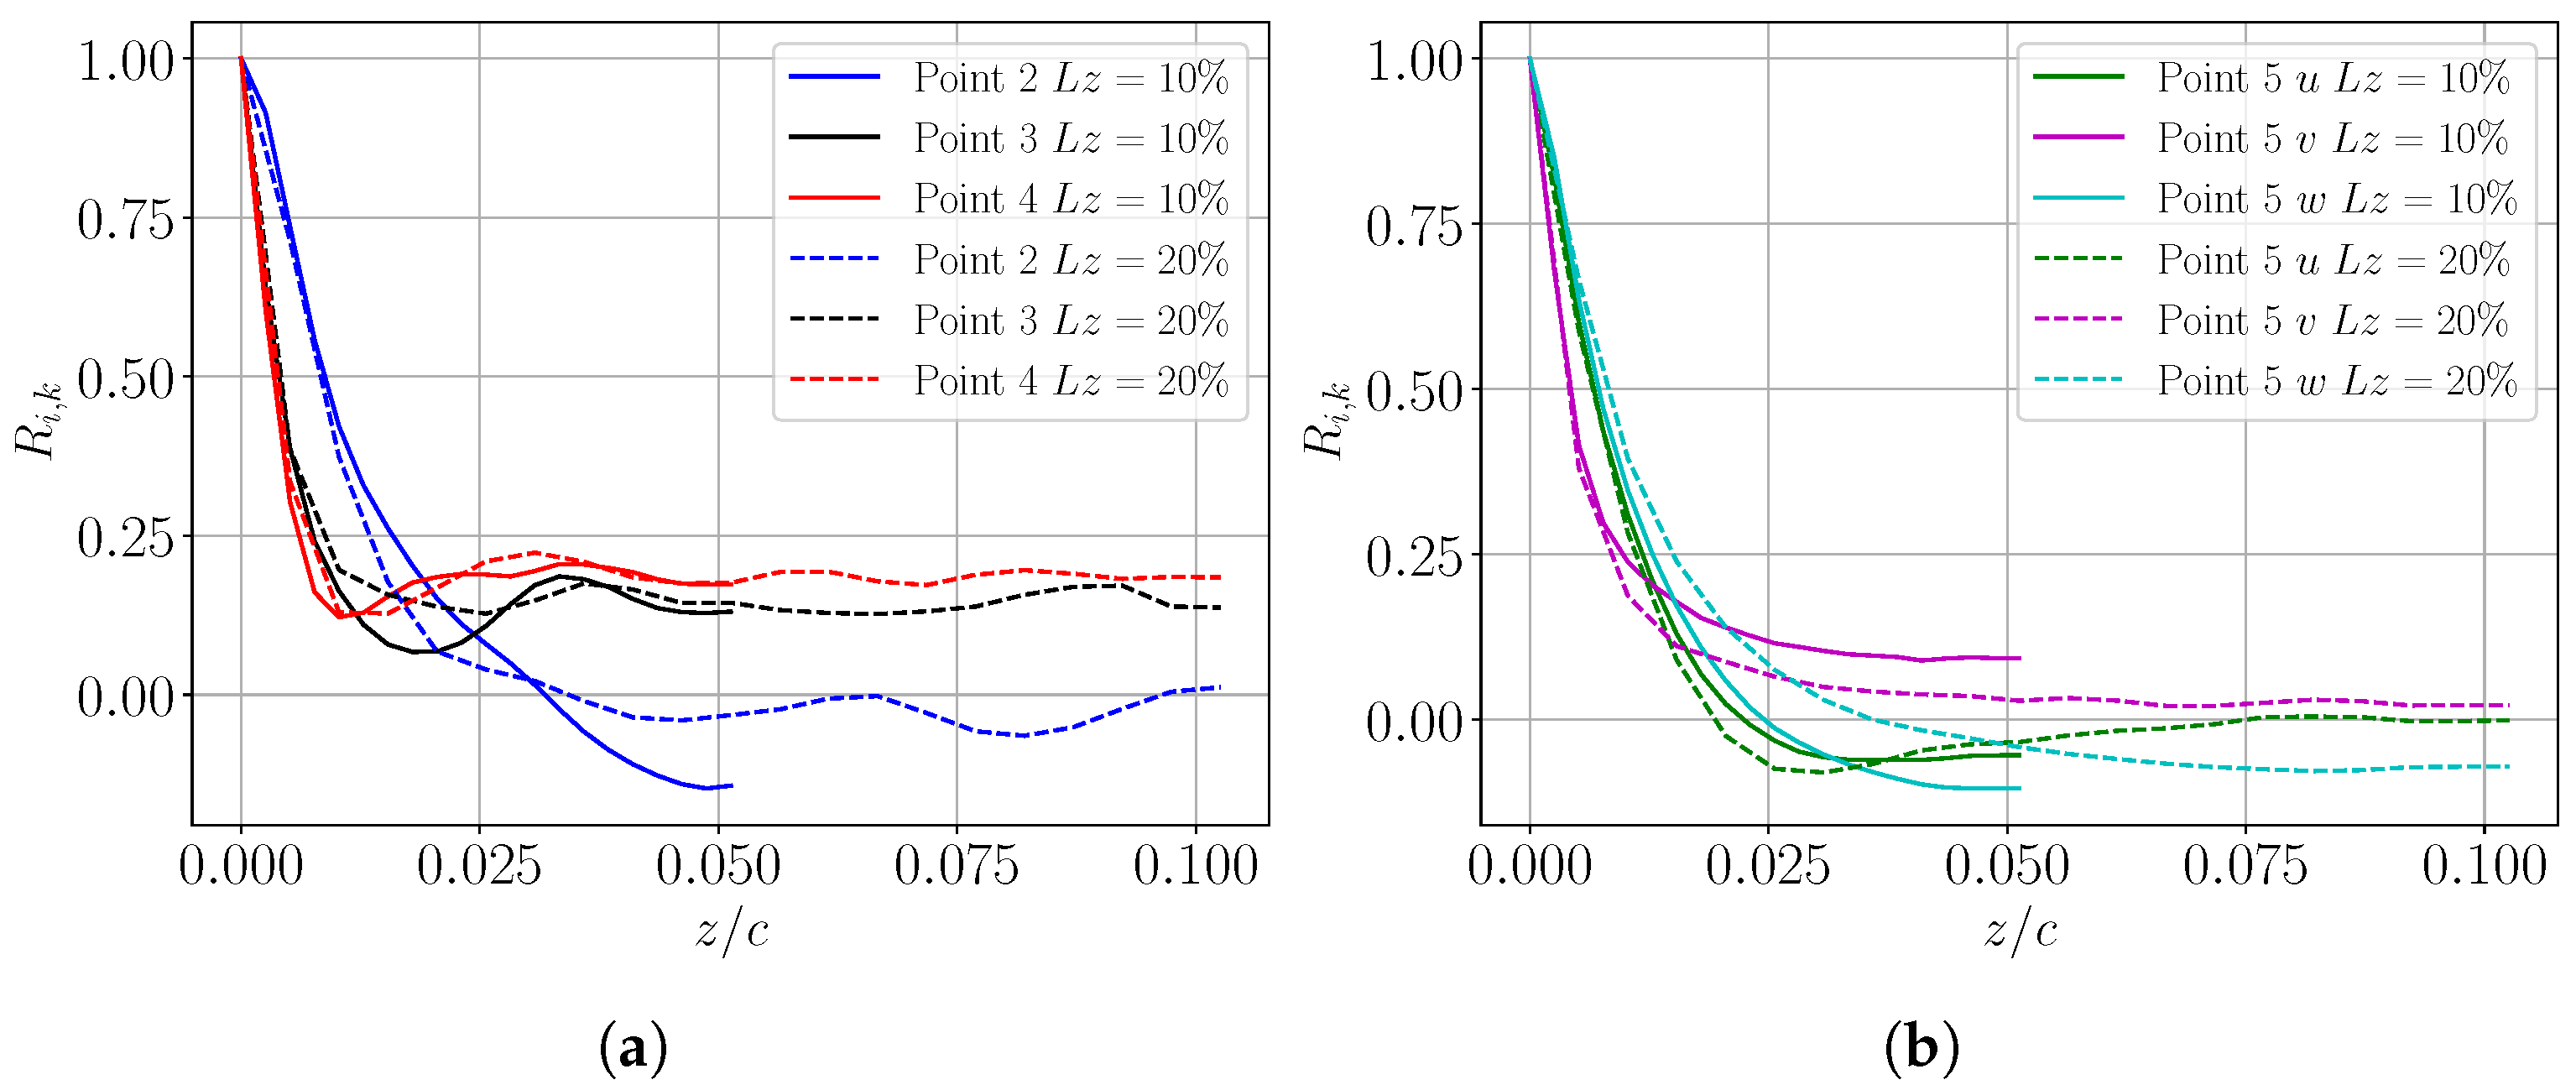
Points 0 , 1 showed perfect correlation in both cases as follows: the flow is still 2 D and has no spanwise variation regardless. The behaviour in the bubble region is reported in Figure 12a. As it may be seen, the two cases show a good degree of consistency; however, the first two points ( 2 , 3 ) inside the boundary layer very close to the wall, and thus it was natural for them to have a lower correlation. Point 4 is in the vicinity of the shear layer, where the KH rolls form; this too shows a good level of anti-correlation with either spanwise extension. This is confirmed by Figure 12b, where the same quantity of three velocity components at point 5 is shown. Nonetheless, there is a need to mention a minor increase in the trend at point 5 for the shorter spanwise extrusion (v component). To further quantify any discrepancies, the difference between the estimated separation and re-attachment axial locations of the L z = 10 % and 20 % was evaluated on both the pressure and suction side. The maximum discrepancy was found to be that of the suction side re-attachment and was of the order of 3.4 × c , corresponding to less than 0.5 [ mm ] . The remaining discrepancies were of the order of less than 1 5 [ mm ] . It may therefore be concluded that the L z = 10 % is a sufficient extrusion capable of capturing the natural transition mechanism correctly.

6. Turbulent Inflow

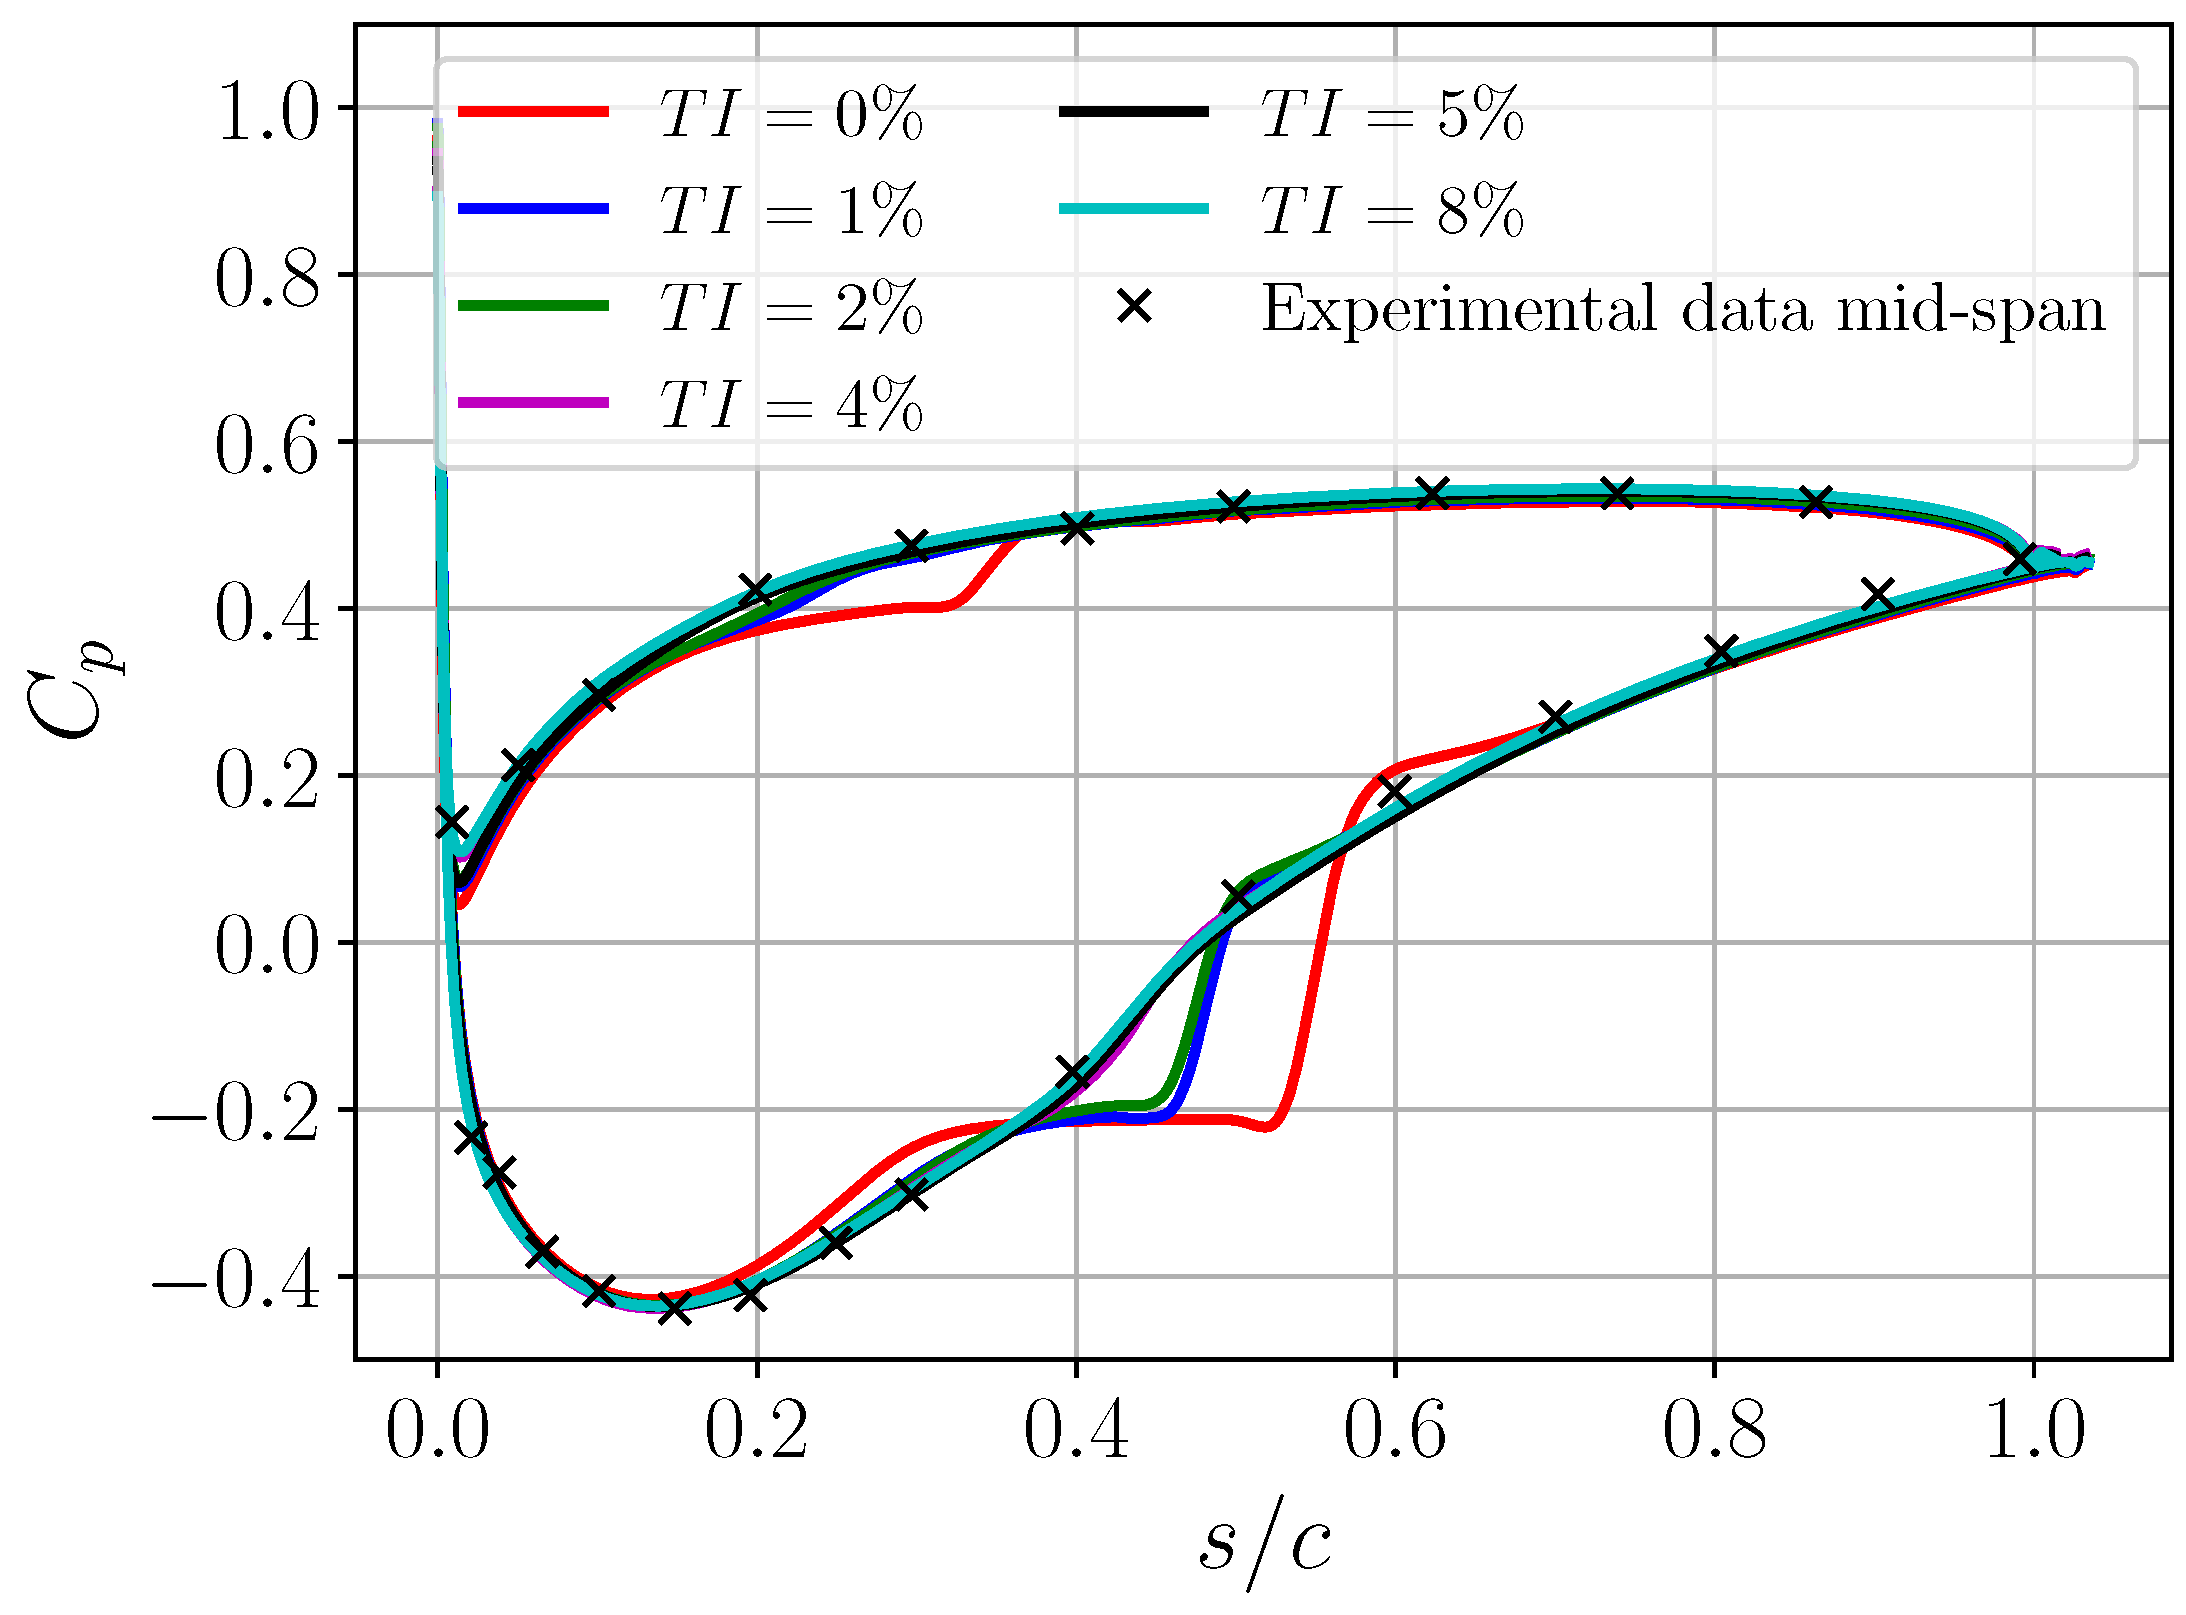
Tuning the angle of incidence and inflow turbulence to match the blade pressure distribution required a number of simulations: the results, achieved by varying the incoming disturbances, are shown in Figure 13. Overall, five different turbulence intensities were tested: 1 % , 2 % , 4 % , 5 % , and 8 % .
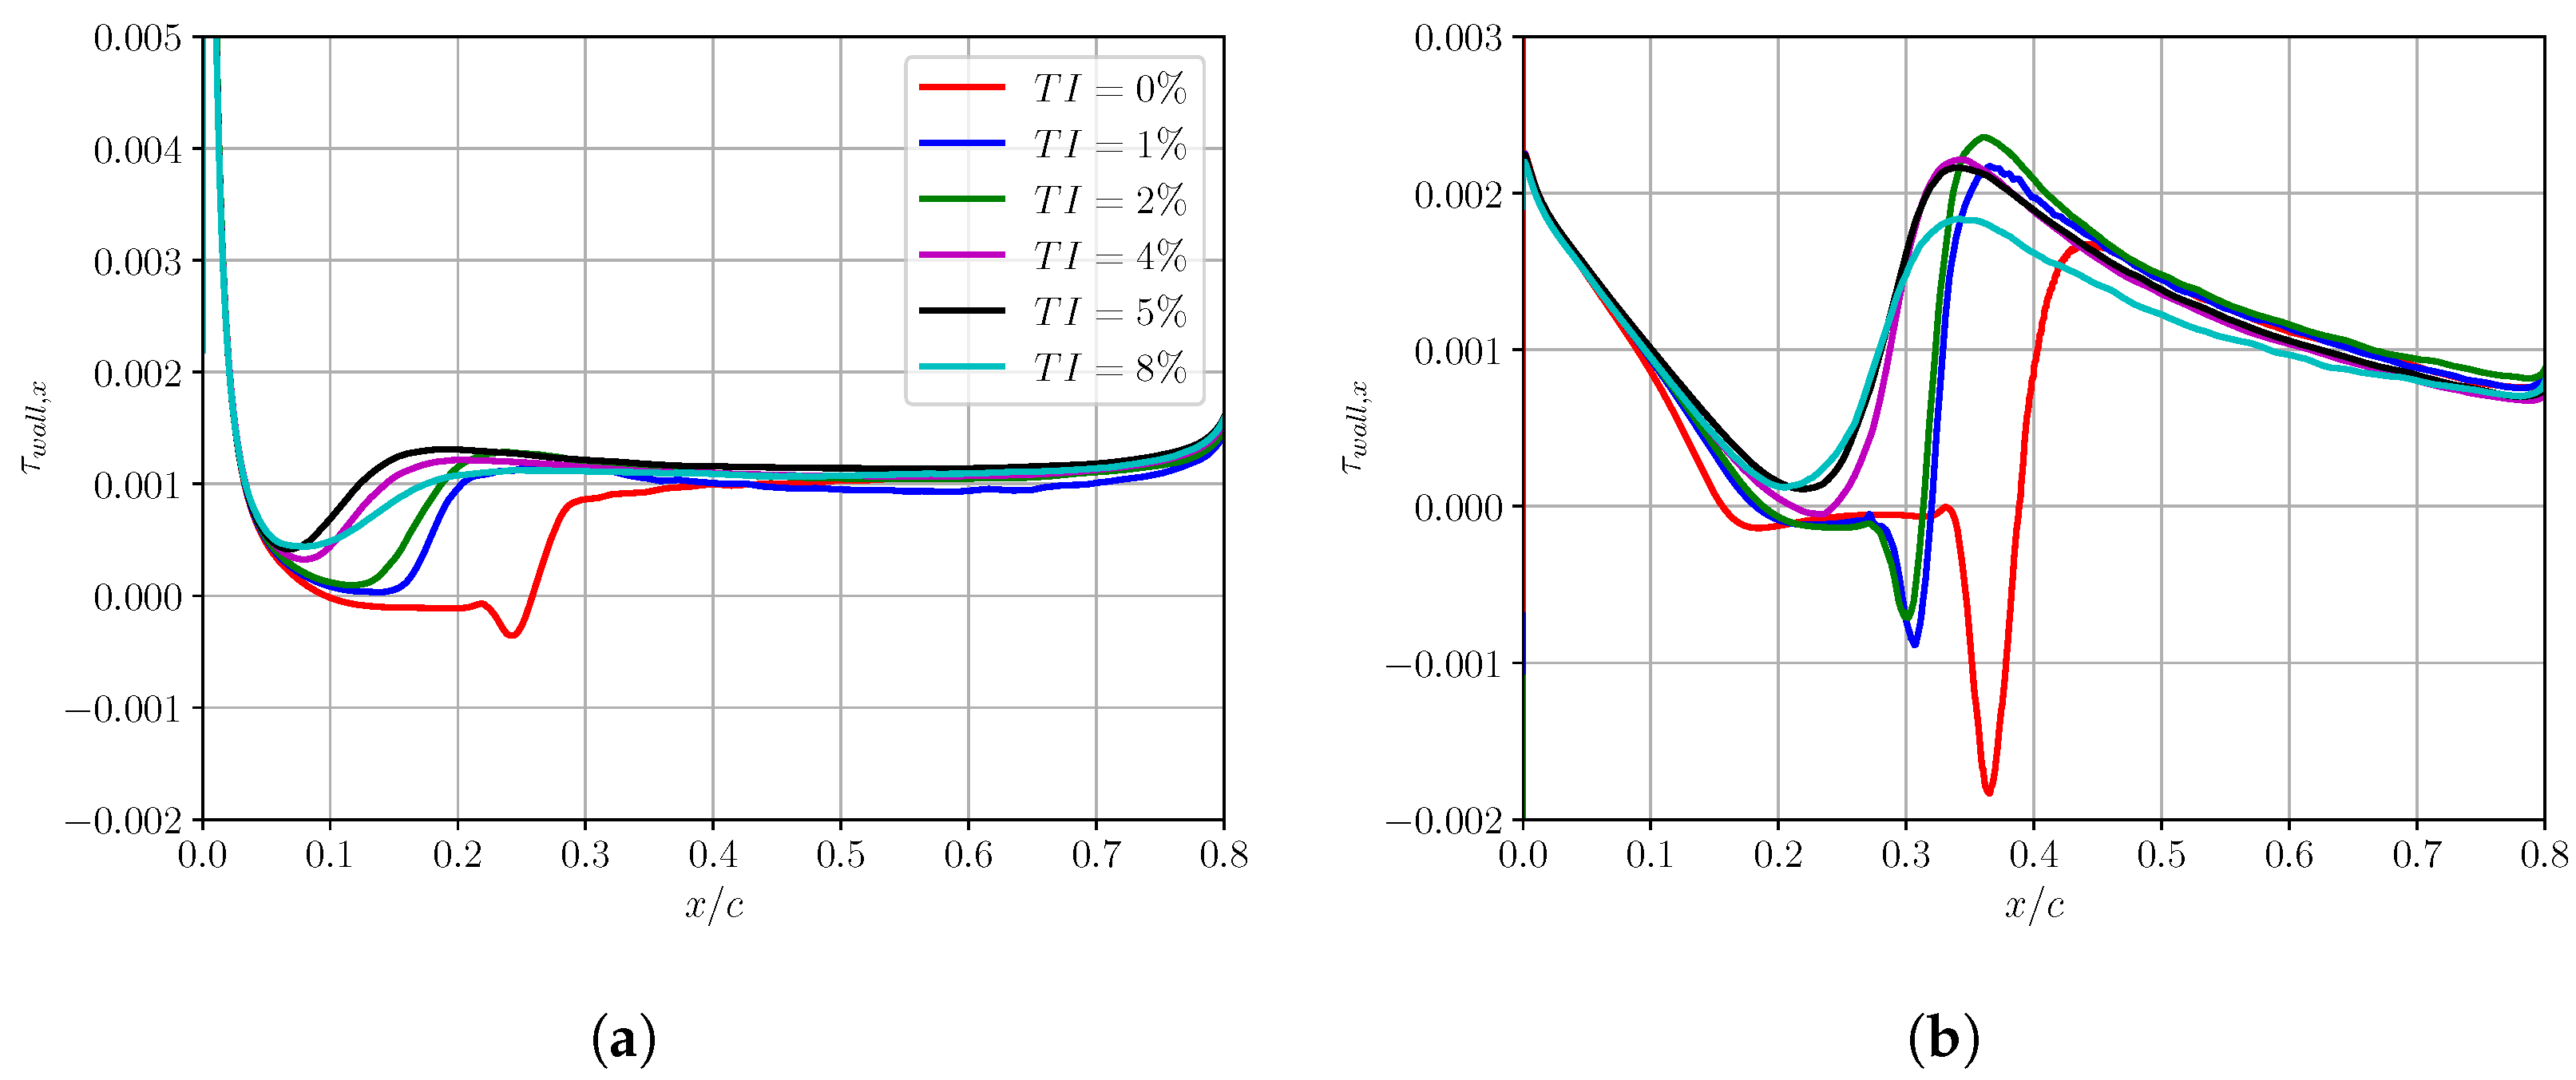
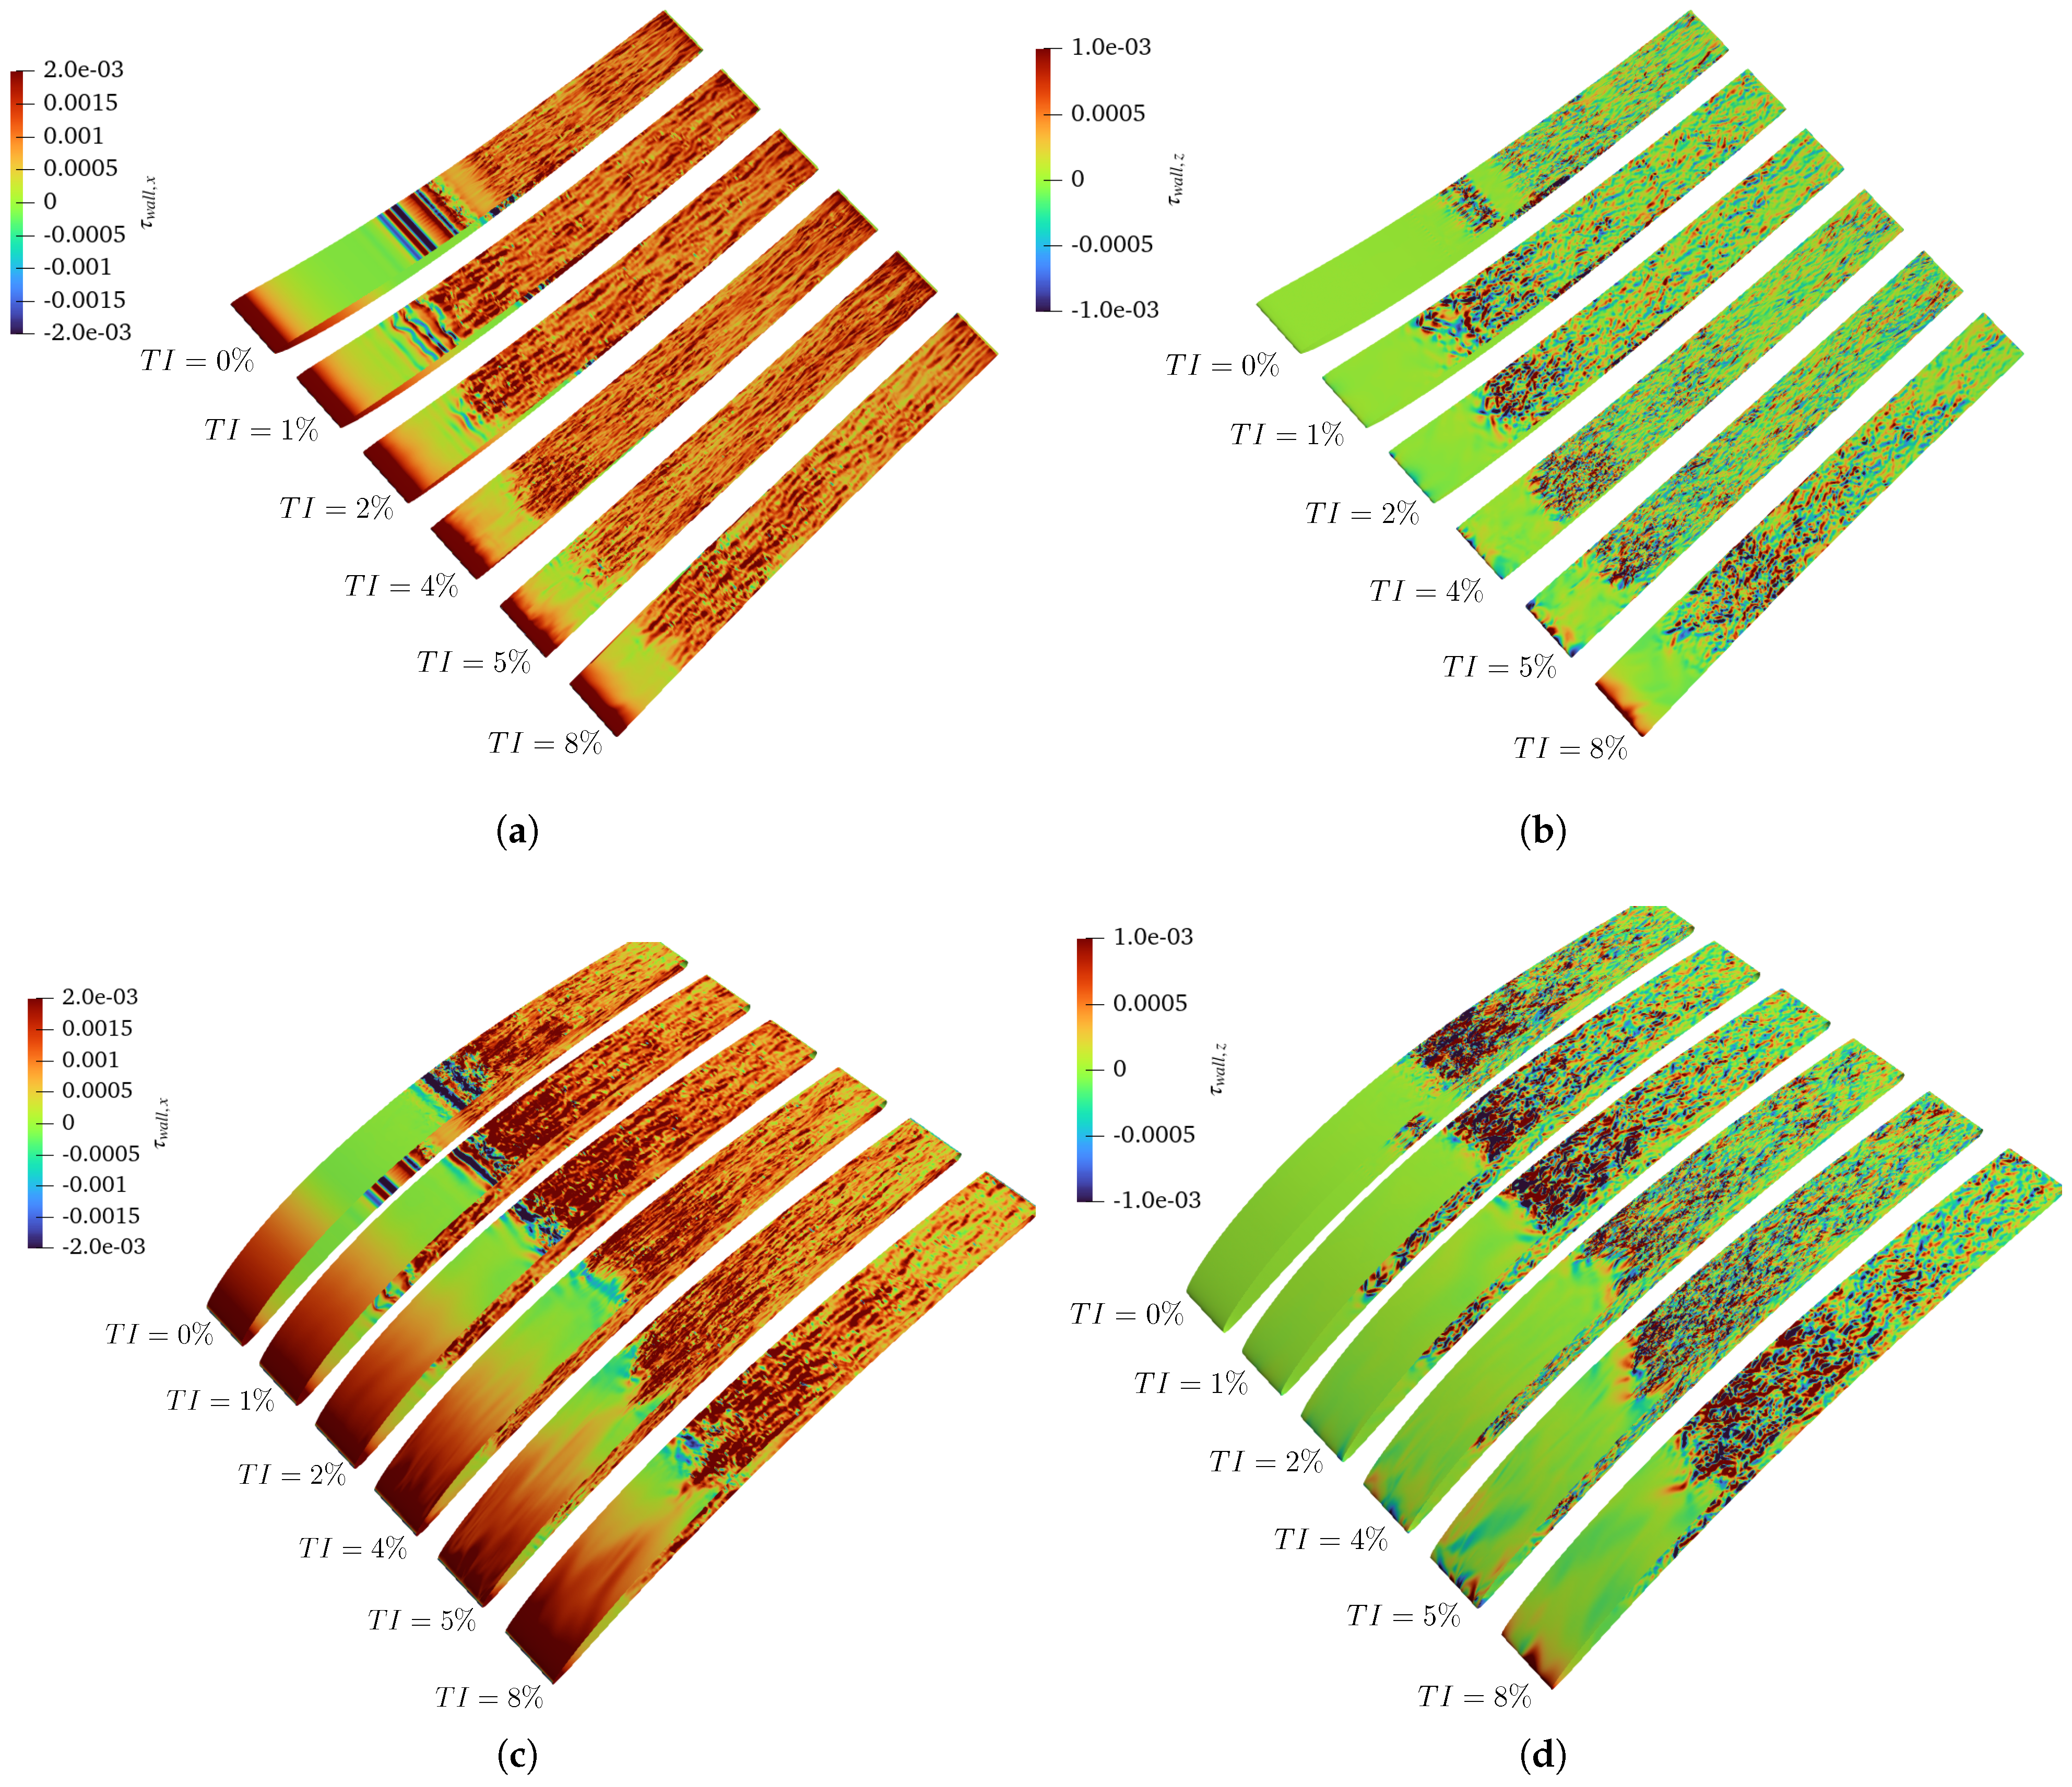
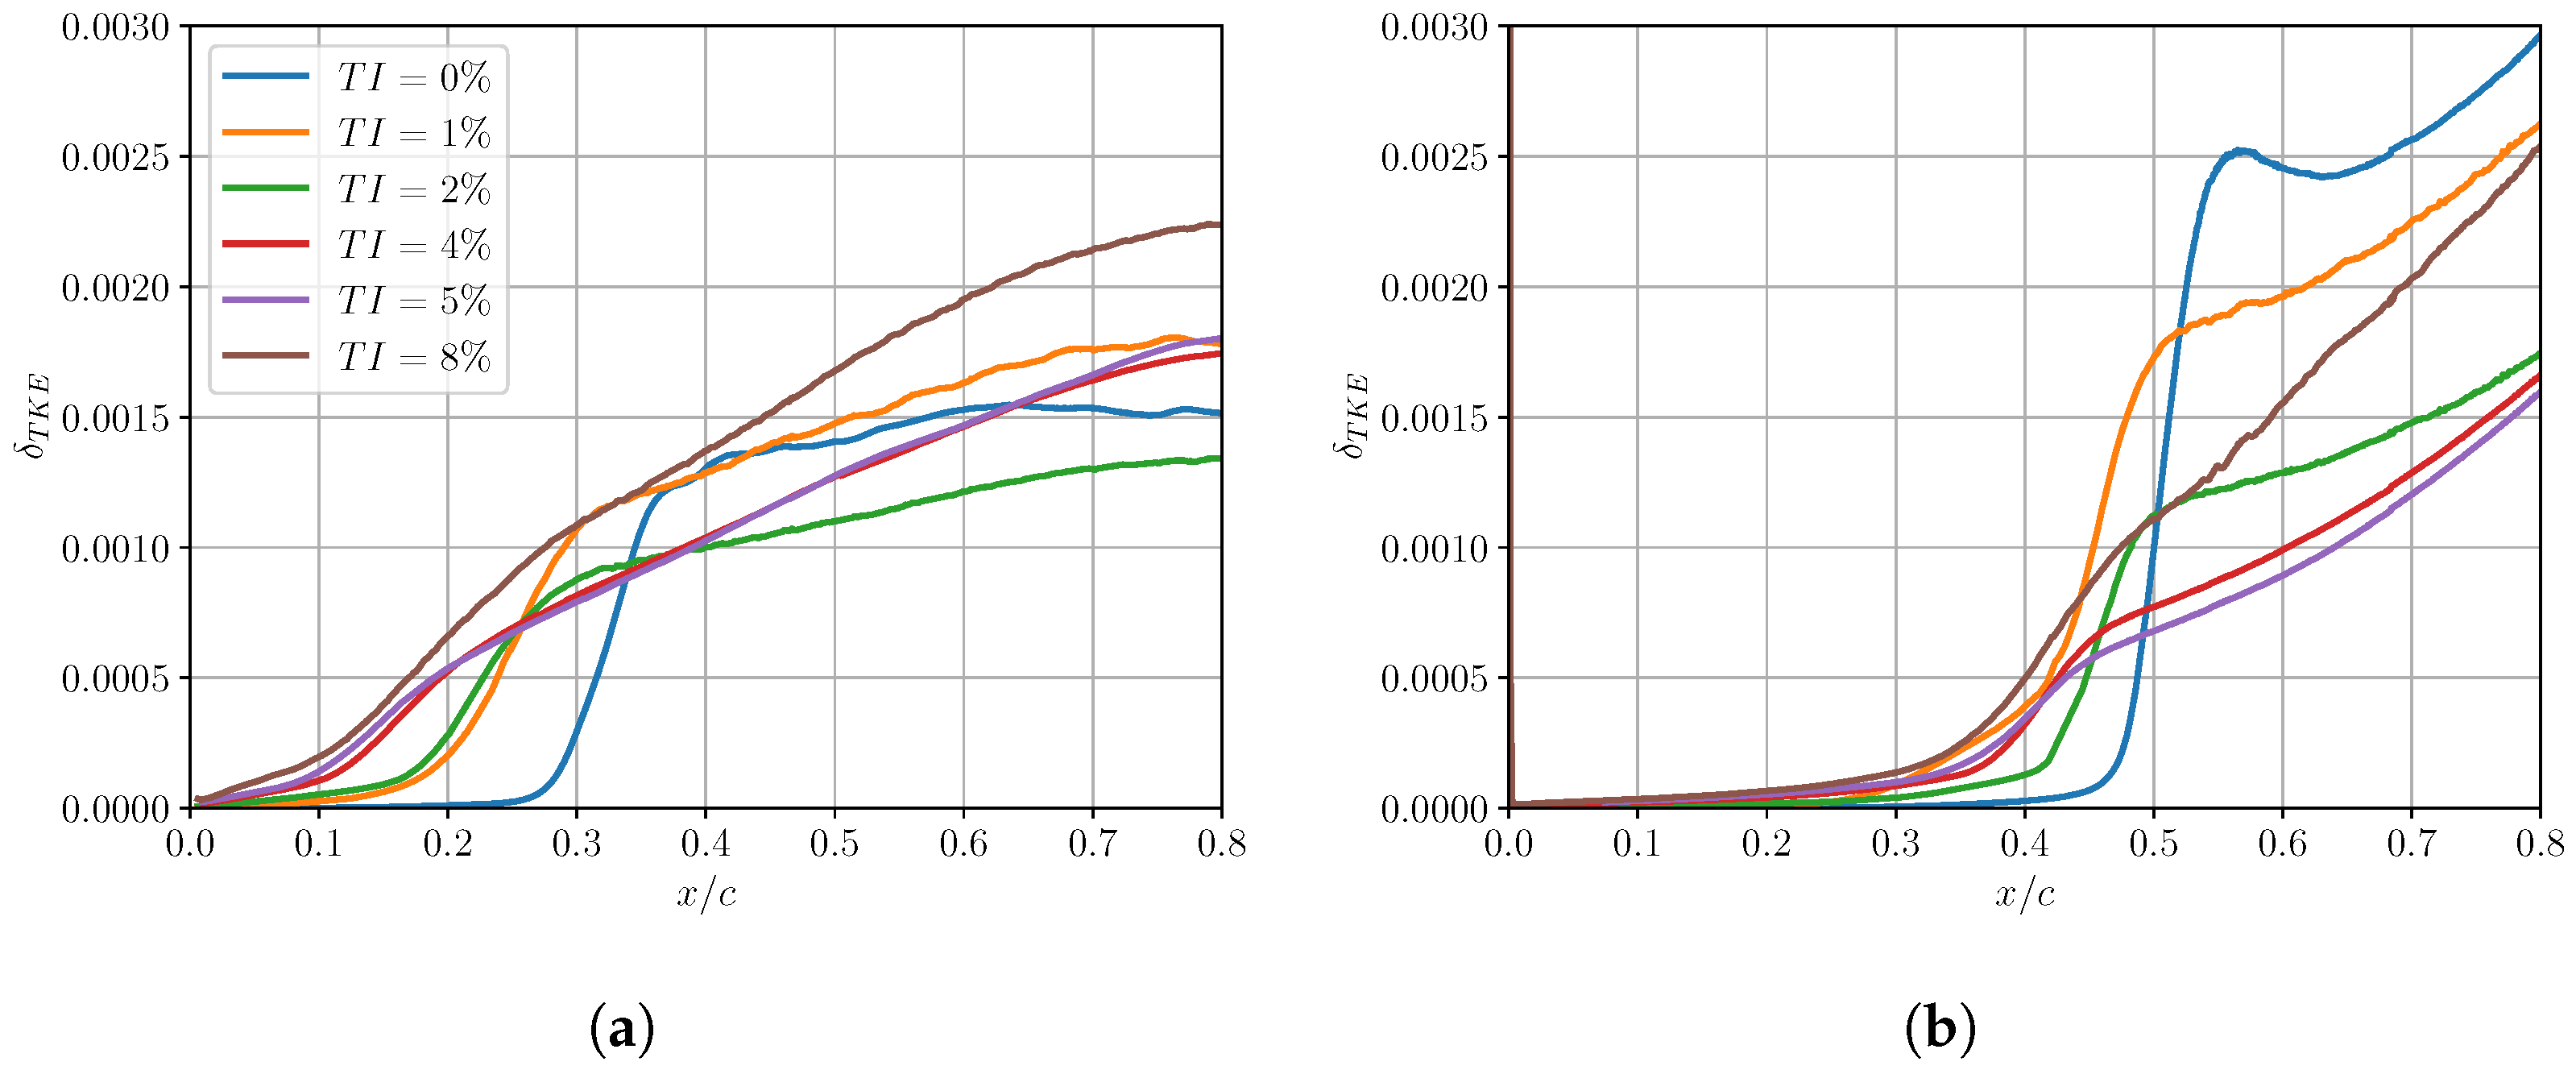
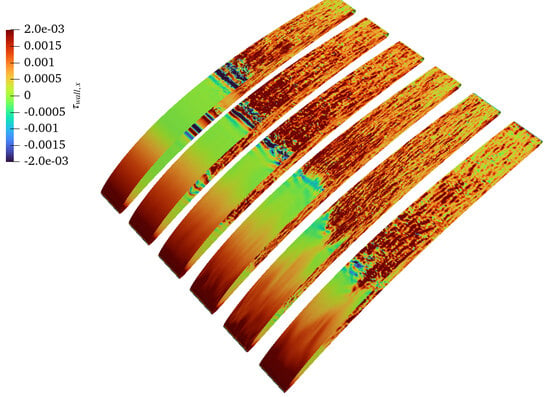
Various phenomena may be observed. Concerning the pressure surface, the separation is significantly affected, even with the lowest level of turbulence, with the trend almost collapsing onto the experimental crosses. Although in a time-averaged sense, no separation occurs (Figure 14a), there is no bypass transition, and the triggering mechanism is a combination of the incoming Klebanoff structures and the pre-existing ones. In fact, considering Figure 15a, the original KH structures are still present, albeit with a spanwise undulated trend. This is caused by their interaction with the incoming turbulence penetrating into the boundary layer. Full turbulent breakdown is achieved much sooner than in the clean case. This could be the reason why the experiments did not show any separation on the pressure side; small disturbances coupled with surface imperfections could have significantly limited its size. Moving to the 2 % trend, this shows a similar mechanism, with the transition being pulled further upstream, while at 4 % , complete bypass is achieved. As the disturbance strength is increased, transition is moved upstream, but has little variation when comparing the 4 % , 5 % , and 8 % cases. To provide a more clear quantification, the Blackwelder parameter has been included once again in Figure 16a. While these three ( 4 % , 5 % , and 8 % ) curves are close up to ∼20% axial location, further downstream, the largest intensity shows a much higher energy for the Reynolds stresses, which relates to the higher strength of the incoming turbulent structures. This is confirmed by Figure 15b, where the spanwise fluctuations are visibly stronger.
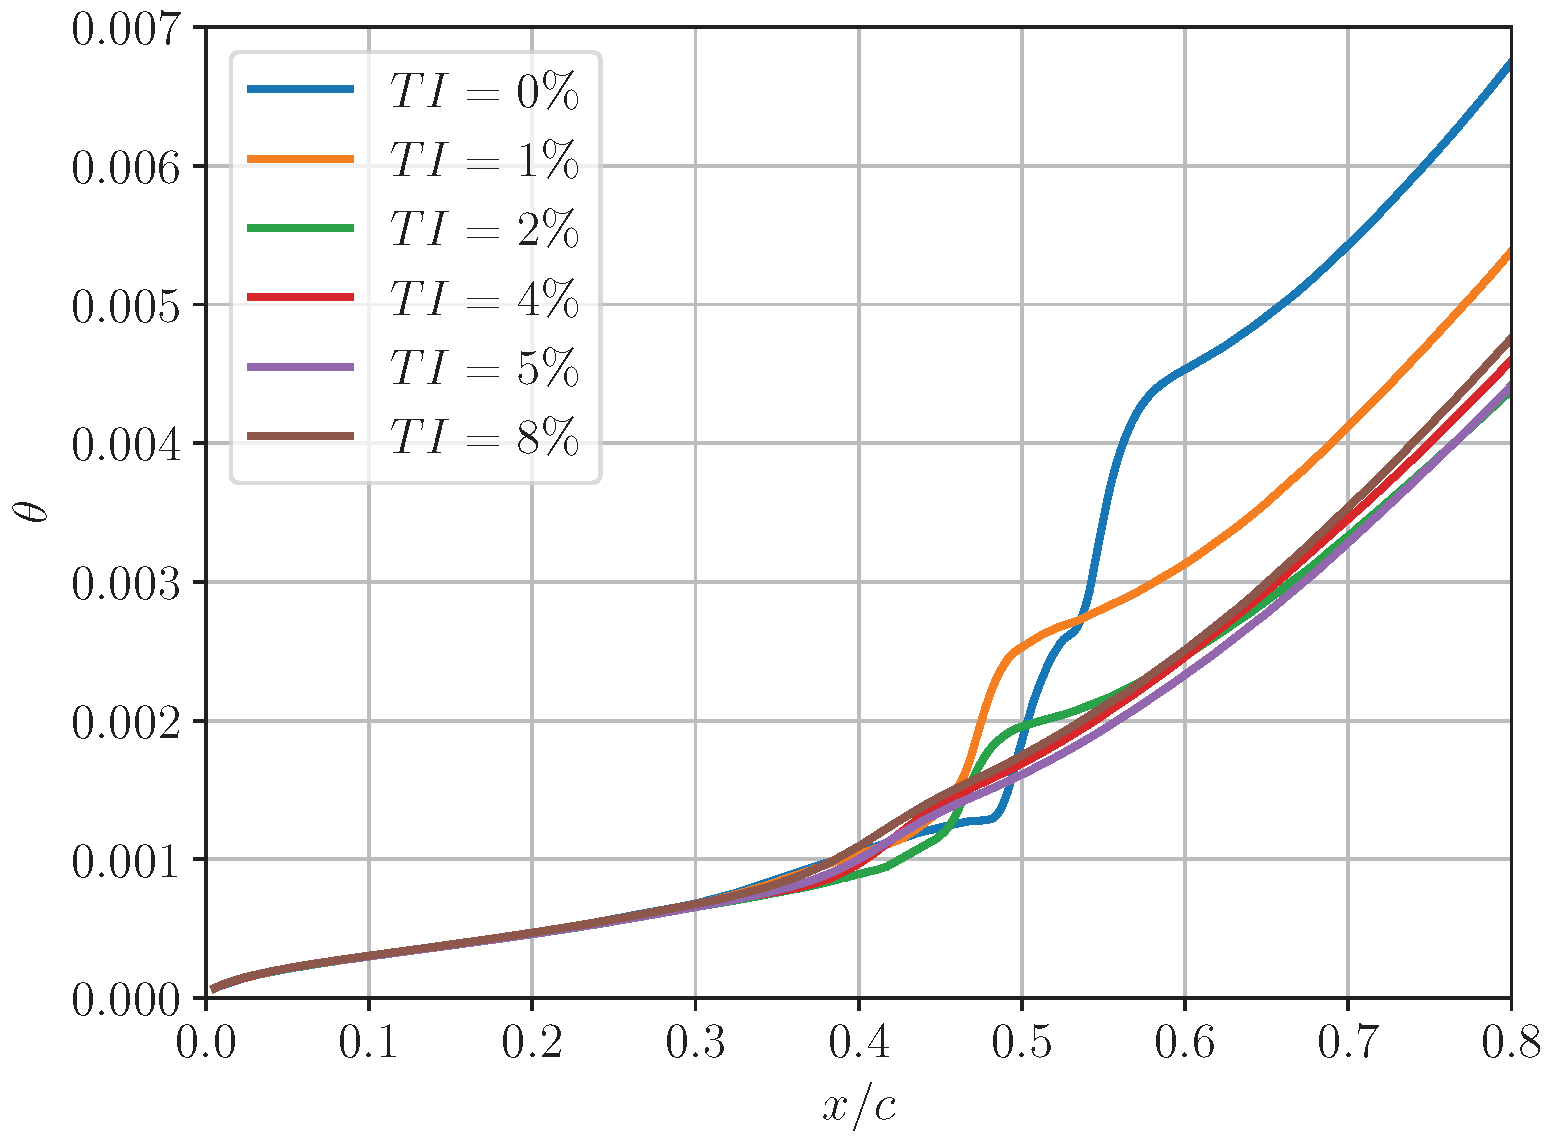
The suction side shows a similar sort of behaviour to its pressure counterpart; the lowest turbulence intensities ( 1 % and 2 % ) are not able to completely change the transition mechanism that continues to include a fully separated region with KH rolls. Nonetheless, separation is pushed further downstream while transition is pulled upstream, shrinking the recirculation as disturbances are injected (Figure 14b). The gradual change in the mechanism is better visualised in Figure 15c; shifting from T I = 0 % through to 2 % demonstrates how the spanwise rolls are pulled upstream and start to be affected by the increasingly stronger turbulence levels reaching the blade. Even at T I = 4 % , bypass has not been achieved; the time-averaged mean-mode axial wall-shear stress in Figure 14b shows a tiny negative spot, indicating that more localised unsteady separation is taking place. Once a level of 5 % and 8 % disturbances is reached, the flow does not separate. The Blackwelder parameter in Figure 16b shows an interesting trend as follows: as the inflow disturbances grow from T I = 0 % to T I = 5 % , the δ T K E decreases, indicating that the Reynolds stresses are weaker and/or the boundary layer height is lower. When T I = 8 % , however, the parameter starts to grow once again. To better quantify whether this aspect can have an effect on losses related to the boundary layer status, the suction side momentum thickness can be plotted. This is defined as follows (noting the incompressible status of the flow field):
θ = 0 δ 99 V ( x , y ) V δ 99 ( x ) 1 V ( x , y ) V δ 99 ( x ) d y
where V ( x , y ) is the time-averaged velocity magnitude inside the boundary layer and V δ 99 ( x ) is that at the boundary layer limit. The plot is shown in Figure 17. This clearly shows that there is an optimal amount of inflow disturbances to minimise losses and appears to occur when the minimum level of turbulent inflow to remove separation is injected. Nonetheless, it is also interesting to note how the clean inflow case ends up having significantly larger losses once turbulence transition has fully occurred.

7. Costs

Nowadays, the industrialisation of high-fidelity, high-order modelling is well underway. One aspect that ought to be considered is the cost of these sort of calculations. The results presented in this paper were all carried out on the ARCHER2 UK National Supercomputing Service (https://www.archer2.ac.uk, accessed on 1 May 2025). The hardware specifications are reported in Table 2. Regarding the modelling conducted in this paper, the settings, costs, and wall-clock time for each case are shown in Table 3. Of note is that this refers to the time-averaging process, assuming that any initialisation effects in the solution have been removed. As it may clearly be seen, the cost is within reach and significantly lower than that of experimental testing (∼ 2000 £ ). In terms of runtime, to achieve quasi-DNS or LES results, the hardware time requirements are between 1.25 and 2.5 days. Of course, it would not be possible to model all components and all operational conditions within an aircraft engine with high fidelity; however, a subset of the more crucial flow conditions may be considered to augment the RANS results and help understand what errors have been introduced by the time-averaged Navier–Stokes and the turbulence model.

8. Conclusions and Future Work

In this paper, a high-fidelity study of a compressor linear cascade has been presented. The methodology consisted of deploying the Nektar++ incompressible solver with a Fourier extrusion in the spanwise direction of the 2D aerofoil. The full details of the settings have been presented and consist of a 5 th-order representation of the flow field at an inflow angle 0.7 ° higher than the design one. This was found to be necessary to match the experimental loading when applying the inflow turbulence disturbances. Spatial DNS resolution was achieved in the near-wall region of the cases with 10 % true chord spanwise length. When assessing wider domains, the accuracy was maintained in order to be able to quantify discrepancies. The maximum time step possible when using the implicit–explicit time stepping scheme was deployed once again to control costs. This ended up being 10 5 for the clean inflow case for both L z = 0.1 × c and 0.2 × c . When turbulence at the inlet was included, Δ t = 2.5 × 10 5 .
Matching the experimental loading proved to be challenging and required tuning the inflow angle and a significant amount of inlet turbulence. Additionally, the CFD results presented a separation bubble on the pressure side that was not detected during the experimental campaign. This required a much lower amount of disturbances to be removed and was much smaller than its suction side counterpart. When studying the transition phenomena, the clean case showed KH rolls forming with consequent transition occurring thereafter. While TS waves could have been present, it is believed that these are not the primary source of transition. On the pressure side, the Görtler criterion did hint at the possibility of these structures being there, but they could not be seen when analysing the vorticity.
The extrusion length of 0.1 × c corresponds to double the maximum boundary layer height. When comparing the autocorrelations with those of the wider domain, a low value was generally found; nevertheless, a slightly higher trend for one of the L z = 0.1 × c values was seen. To be able to accurately assess whether the turbulent transition mechanism was affected by the change in spanwise length, the difference between the separation and transition locations of the L z = 10 % and 20 % were computed on both the pressure and suction sides. The maximum discrepancy was estimated to be 3.4 × 10 3 × c , less than half a [ mm ] (suction side re-attachment), with all the others being less than 1 5 [ mm ] . Therefore, the 10 % true chord extrusion was found to be sufficient to accurately assess the behaviour of both the pressure and suction side boundary layer.
Various levels of incoming turbulence were injected in a bid to match the experimental loading. As mentioned, the removal of the separation on the pressure side was a much easier task than on the opposite surface. As the T I is increased, the separation is pushed downstream and transition occurs sooner, shrinking the bubble. Only for relatively high values of 4–5% does it disappear in a time-averaged sense. An interesting finding relates to the losses trough momentum thickness. It was seen that there is an optimal amount of turbulence levels injected into the domain that can reduce its trend. In a time-averaged sense, these occur on the limit of the separation bubble removal.
Finally, as these sort of studies are becoming increasingly more interesting to the turbomachinery industrial community, the related costs have been presented. While these are orders of magnitude higher than their steady counterpart, they are low enough to be considered for a limited set of conditions to augment existing RANS and experimental measures to actually achieve a detailed understanding of the flow physics.

Author Contributions

Conceptualization, G.V., Y.F.-M. and R.V.-D.; methodology, G.V.; software, G.V., C.D.C., J.A.I. and S.J.S.; validation, G.V. and F.M.; formal analysis, G.V. and F.M.; investigation, G.V., F.M., Y.F.-M. and R.V.-D.; resources, G.V.; data curation, G.V.; writing—original draft preparation, G.V.; writing—review and editing, G.V., J.A.I., C.D.C., F.M., S.J.S., Y.F.-M., M.M., I.N. and R.V.-D.; visualization, G.V.; supervision, C.D.C., F.M., S.J.S., Y.F.-M., M.M., I.N. and R.V.-D.; project administration, C.D.C., F.M., S.J.S., Y.F.-M., M.M., I.N. and R.V.-D.; funding acquisition, C.D.C., F.M., S.J.S., Y.F.-M., M.M., I.N. and R.V.-D. All authors have read and agreed to the published version of the manuscript.

Funding

This research was funded by the Aircraft Technology Institute/Rolls-Royce grant FANFARE 113286. The computational study was carried out on Archer2 by means of resources acquired through the UK Turbulence Consortium and the UK Research & Innovation grant number Access to HPC APP38011.

Institutional Review Board Statement

Not applicable.

Informed Consent Statement

Not applicable.

Data Availability Statement

Restrictions apply to the datasets, Rolls-Royce proprietary data.

Acknowledgments

This work was funded by the Aircraft Technology Institute/Rolls-Royce grant FANFARE 113286. Initial calculations were carried out on the Imperial College London Research Computing Service (DOI: 10.14469/hpc/2232), while the highly resolved versions were carried out on the UK National Supercomputing facility ARCHER2 (https://www.archer2.ac.uk—DOI https://doi.org/10.5281/zenodo.14507040, accessed on 1 May 2025) through the UK Turbulence Consortium and UK Research & Innovation grant number Access to HPC APP38011. The authors gratefully acknowledge the support and permission of Rolls-Royce plc to analyse and publish the results.

Conflicts of Interest

Authors Yuri Frey-Marioni, Iftekhar Naqavi and Raul Vazquez-Diaz were employed by the company Rolls-Royce PLC, and author Marcus Meyer was employed by the company Rolls-Royce Deutschland Ltd. The remaining authors declare that the research was conducted in the absence of any commercial or financial relationships that could be construed as a potential conflict of interest.

Abbreviations

The following abbreviations and symbols are used in this manuscript:
Latin SymbolsGreek SymbolsAcronyms
c: True Chord ν : Dynamic ViscosityCFD: Computational Fluid Dynamics
C p : Pressure Coefficient Δ : DifferenceDNS: Direct Numerical Simulation
f: Frequency δ 99 : Boundary Layer HeightFD: Finite Difference
G: Görtler Number δ T K E : Blackwelder ParameterFE: Finite Element
L z : Spanwise Length δ * : Displacement ThicknessFV: Finite Volume
N z : Number of Fourier Modes τ : Shear StressesGB: Gigabyte
P: Pressure∇: Differential OperatorGHz: Gigahertz
p: Polynomial Order θ : Momentum ThicknessKH: Kelvin–Helmholtz
R: Radius of Curvature LES: Large Eddy Simulation
R i k : AutocorrelationSuperscripts and SubscriptsiLES: Implicit LES
R e : Reynolds Number+: Near-Wall DistancesPSD: Power Spectral Density
S v v : Spectral Vanishing Viscosity: Time-AverageTI: Turbulence Intensity
t: Time′: Fluctuating ComponentTS: Tollmien–Schlichting
V: Velocity Magnitude W a l l : No-Slip WallRANS: Reynolds-Averaged Navier–Stokes
u : Velocity Vector M A : Max Amplification
x: Axial Coordinate
y: Pitchwise Coordinate
z: Spanwise Coorinate

Appendix A. Inflow Turbulence Boundary Condition

The inflow turbulence capability utilised is described in [32,33] and was developed within the Nektar++ framework by [29]. It is a synthetic turbulence generator method allowing for a greater runtime efficiency and ease of implementation compared to others. It can be classified as a random Fourier method enforcing the incompressible divergence-free constraint. The latter is achieved by imposing the orthogonality of the wave number ( κ ) vector and its direction of travel ( σ ). The velocity fluctuation ( u i ( x j ) ) is then defined as follows:
u i ( x j ) = 2 n = 1 N t u r b u ^ n cos ( κ j n x j + ψ n ) σ i n
where ψ n is a random phase and the summation is carried out over the number of turbulent modes. The mode amplitude can be defined as follows:
u ^ n = E ( | κ n | ) Δ κ n
with Δ κ being the difference between consecutive wave numbers (the largest and smallest wavelengths are determined by the domain size and the mesh element characteristic length). E ( κ ) is a modified von Kármán spectrum, discretised into N t u r b modes as follows:
E ( κ ) = A U T I 2 κ e ( κ / κ e ) 2 [ 1 + ( κ / κ e ) 2 ] 17 / 6 e 2 ( κ / κ η ) 2
where U is the freestream velocity, T I the turbulence intensity, and κ η is the Kolmogorov scale. κ e represents the wave number with peak energy, and along with A is determined from the following:
0 E ( κ ) d κ = k
2 ν 0 κ 2 E ( κ ) d κ = ϵ
ν being the viscosity, ϵ and k the turbulent dissipation rate and kinetic energy, respectively. Satisfying these two relations ensures isotropic decaying turbulence. Finally, time correlation is introduced using physical space digital filtering as follows:
a = e Δ t / τ
b = ( 1 a 2 )
with τ being the turbulence time scale. At each time step, random phases are generated and the fluctuating velocity component is re-evaluated. Thus,
( u i , i n ) t = a ( u i , i n ) t Δ t + b u i
The fluctuating velocity term is then added to the inlet values.

Appendix B. Boundary Layer δ99 and uδ99 Calculation

An automated method developed by [35] was used to determine the boundary layer height and reference velocity ( δ 99 and u δ 99 , respectively). It is valid for incompressible solutions and involves taking normal wall samples and identifying the point at which the total pressure asymptotically converges. The local free-stream velocity is then recovered and the boundary layer height is defined as the location where the velocity reaches 99 % of the previously determined free-stream value. This is then repeated for a series of normal wall sampling lines covering the entire blade surface.

References

  1. Michelassi, V. Turbomachinery research and design: The role of DNS and LES in industry. In Proceedings of the Progress in Hybrid RANS-LES Modelling: Papers Contributed to the 7th Symposium on Hybrid RANS-LES Methods, Berlin, Germany, 17–19 September 2018; Springer: Berlin, Germany, 2020; pp. 55–69. [Google Scholar]
  2. Sandberg, R.D.; Michelassi, V. The current state of high-fidelity simulations for main gas path turbomachinery components and their industrial impact. Flow Turbul. Combust. 2019, 102, 797–848. [Google Scholar] [CrossRef]
  3. Wang, Z. High-order computational fluid dynamics tools for aircraft design. Philos. Trans. R. Soc. A Math. Phys. Eng. Sci. 2014, 372, 20130318. [Google Scholar] [CrossRef] [PubMed]
  4. Zaki, T.A.; Wissink, J.G.; Rodi, W.; Durbin, P.A. Direct numerical simulations of transition in a compressor cascade: The influence of free-stream turbulence. J. Fluid Mech. 2010, 665, 57–98. [Google Scholar] [CrossRef]
  5. McMullan, W.; Page, G.J. Large eddy simulation of a compressor cascade and the influence of spanwise domain. Proc. Inst. Mech. Eng. Part A J. Power Energy 2011, 225, 817–831. [Google Scholar] [CrossRef]
  6. McMullan, W.A.; Page, G.J. Large eddy simulation of a controlled diffusion compressor cascade. Flow Turbul. Combust. 2011, 86, 207–230. [Google Scholar] [CrossRef]
  7. McMullan, W.; Page, G. Towards large eddy simulation of gas turbine compressors. Prog. Aerosp. Sci. 2012, 52, 30–47. [Google Scholar] [CrossRef]
  8. Hah, C. Large eddy simulation of transonic flow field in NASA rotor 37. In Proceedings of the 47th AIAA Aerospace Sciences Meeting including The New Horizons Forum and Aerospace Exposition, Orlando, FL, USA, 5–8 January 2009; p. 1061. [Google Scholar]
  9. Leggett, J.; Priebe, S.; Shabbir, A.; Michelassi, V.; Sandberg, R.; Richardson, E. Loss prediction in an axial compressor cascade at off-design incidences with free stream disturbances using large eddy simulation. J. Turbomach. 2018, 140, 071005. [Google Scholar] [CrossRef]
  10. Leggett, J.; Sandberg, R.D. Highly Resolved Simulations of a CDA Compressor Cascade: Effect of Reynolds Number on Losses. In Proceedings of the Turbo Expo: Power for Land, Sea, and Air, Virtual, 7–11 June 2021; American Society of Mechanical Engineers: New York, NY, USA, 2021; Volume 84904, p. V02AT31A009. [Google Scholar]
  11. Leggett, J.; Sandberg, R. Exploring the Presence of Pressure Waves in Axial Compressor Cascades. In Proceedings of the Turbo Expo: Power for Land, Sea, and Air, Virtual, 21–25 September 2020; American Society of Mechanical Engineers: New York, NY, USA, 2020; Volume 84065, p. V02AT32A066. [Google Scholar]
  12. Wang, M.; Li, Z.; Yang, C.; Han, G.; Zhao, S.; Lu, X. Numerical investigations of the separated transitional flow over compressor blades with different loading distributions. Aerosp. Sci. Technol. 2020, 106, 106113. [Google Scholar] [CrossRef]
  13. Kozul, M.; Nardini, M.; Przytarski, P.J.; Solomon, W.; Shabbir, A.; Sandberg, R.D. Direct Numerical Simulation of Riblets Applied to Gas Turbine Compressor Blades at On-and Off-Design Incidences. In Proceedings of the Turbo Expo: Power for Land, Sea, and Air. American Society of Mechanical Engineers, Boston, MA, USA, 26–30 June 2023; Volume 87080, p. V13AT29A006. [Google Scholar]
  14. Przytarski, P.J.; Wheeler, A.P.S.; Lengani, D.; Simoni, D. Data-Driven Analysis of High Fidelity Simulation of Multi-Stage Compressor. In Proceedings of the 14th European Turbomachinery Conference, Gdansk, Poland, 24–28 April 2021; p. ETC2021-628. [Google Scholar]
  15. Dawkins, I.; Taylor, J.; Ottavy, X.; Miller, R. The Unsteady Topology of Corner Separations. J. Turbomach. 2022, 144, 111001. [Google Scholar] [CrossRef]
  16. Karniadakis, G.; Sherwin, S.J. Spectral/hp Element Methods for Computational Fluid Dynamics; Oxford University Press: Oxford, MS, USA, 2005. [Google Scholar]
  17. Nektar++ Spectral/hp Element Framework Project. Available online: https://www.nektar.info/ (accessed on 10 July 2024).
  18. Cantwell, C.D.; Moxey, D.; Comerford, A.; Bolis, A.; Rocco, G.; Mengaldo, G.; De Grazia, D.; Yakovlev, S.; Lombard, J.E.; Ekelschot, D.; et al. Nektar++: An open-source spectral/hp element framework. Comput. Phys. Commun. 2015, 192, 205–219. [Google Scholar] [CrossRef]
  19. Moxey, D.; Cantwell, C.D.; Bao, Y.; Cassinelli, A.; Castiglioni, G.; Chun, S.; Juda, E.; Kazemi, E.; Lackhove, K.; Marcon, J.; et al. Nektar++: Enhancing the capability and application of high-fidelity spectral/hp element methods. Comput. Phys. Commun. 2020, 249, 107110. [Google Scholar] [CrossRef]
  20. Vivarelli, G.; Isler, J.A.; Montomoli, F.; Cantwell, C.; Sherwin, S.J.; Frey-Marioni, Y.; Vazquez-Diaz, R. Applications and Recent Developments of the Open-Source Computational Fluid Dynamics High-Fidelity Spectral/Hp Element Framework Nektar++ for Turbomachinery Configurations. In Proceedings of the Turbo Expo Power Land Sea Air, London, UK, 24–28 June 2024; Volume 88070, p. V12CT32A022. [Google Scholar]
  21. Vivarelli, G.; Isler, J.A.; Cantwell, C.D.; Montomoli, F.; Sherwin, S.J.; Frey-Marioni, Y.; Meyer, M.; Naqavi, I.; Vazquez-Diaz, R. A Quasi-Direct Numerical Simulation of a Compressor Blade with Separation Bubbles and Inflow Turbulence. In Proceedings of the 16th European Turbomachinery Conference, Hannover, Germany, 24–28 March 2025; p. ETC2025-325. Available online: https://www.euroturbo.eu/publications/conference-proceedings-repository/ (accessed on 5 May 2025).
  22. Geuzaine, C.; Remacle, J.F. Gmsh: A 3-D finite element mesh generator with built-in pre-and post-processing facilities. Int. J. Numer. Methods Eng. 2009, 79, 1309–1331. [Google Scholar] [CrossRef]
  23. Karniadakis, G. Spectral element-Fourier methods for incompressible turbulent flows. Comput. Methods Appl. Mech. Eng. 1990, 80, 367–380. [Google Scholar] [CrossRef]
  24. Bolis, A.; Cantwell, C.D.; Moxey, D.; Serson, D.; Sherwin, S.J. An adaptable parallel algorithm for the direct numerical simulation of incompressible turbulent flows using a Fourier spectral/hp element method and MPI virtual topologies. Comput. Phys. Commun. 2016, 206, 17–25. [Google Scholar] [CrossRef]
  25. Mayle, R.E. The 1991 IGTI Scholar Lecture: The Role of Laminar-Turbulent Transition in Gas Turbine Engines. J. Turbomach. 1991, 113, 509–536. [Google Scholar] [CrossRef]
  26. Georgiadis, N.J.; Rizzetta, D.P.; Fureby, C. Large-eddy simulation: Current capabilities, recommended practices, and future research. AIAA J. 2010, 48, 1772–1784. [Google Scholar] [CrossRef]
  27. Karniadakis, G.E.; Israeli, M.; Orszag, S.A. High-order splitting methods for the incompressible Navier-Stokes equations. J. Comput. Phys. 1991, 97, 414–443. [Google Scholar] [CrossRef]
  28. Tadmor, E. Convergence of spectral methods for nonlinear conservation laws. SIAM J. Numer. Anal. 1989, 26, 30–44. [Google Scholar] [CrossRef]
  29. Cassinelli, A. A Spectral/hp Element DNS Tudy of Flow Past Low-Pressure Turbine Cascades and the Effects of Inflow Conditions. Ph.D. Thesis, Imperial College London, London, UK, 2020. [Google Scholar]
  30. Moura, R.C.; Sherwin, S.J.; Peiró, J. Eigensolution analysis of spectral/hp continuous Galerkin approximations to advection–diffusion problems: Insights into spectral vanishing viscosity. J. Comput. Phys. 2016, 307, 401–422. [Google Scholar] [CrossRef]
  31. Kirby, R.M.; Sherwin, S.J. Stabilisation of spectral/hp element methods through spectral vanishing viscosity: Application to fluid mechanics modelling. Comput. Methods Appl. Mech. Eng. 2006, 195, 3128–3144. [Google Scholar] [CrossRef]
  32. Davidson, L.; Billson, M. Hybrid LES-RANS using synthesized turbulent fluctuations for forcing in the interface region. Int. J. Heat Fluid Flow 2006, 27, 1028–1042. [Google Scholar] [CrossRef]
  33. Davidson, L. Using isotropic synthetic fluctuations as inlet boundary conditions for unsteady simulations. Adv. Appl. Fluid Mech. 2007, 1, 1–35. [Google Scholar]
  34. Schlichting, H.; Gersten, K. Boundary-Layer Theory; Springer: Berlin/Heidelberg, Germany, 2016. [Google Scholar]
  35. Griffin, K.P.; Fu, L.; Moin, P. General method for determining the boundary layer thickness in nonequilibrium flows. Phys. Rev. Fluids 2021, 6, 024608. [Google Scholar] [CrossRef]
  36. Montomoli, F.; Hodson, H.; Haselbach, F. Effect of roughness and unsteadiness on the performance of a new low pressure turbine blade at low Reynolds numbers. J. Turbomach. 2010, 132, 031018. [Google Scholar] [CrossRef]
  37. Walker, G. Transitional flow on axial turbomachine blading. AIAA J. 1989, 27, 595–602. [Google Scholar] [CrossRef]
  38. Obremski, H.; Morkovin, M.V.; Landahl, M.; Wazzan, A. A Portfolio of Stability Characteristics of Incompressible Boundary Layers; Fluid Dynamics Panel of Advisory Group For Aerospace Research & Development (AGARD) of Northern Atlantic Treaty Organisation (NATO): Neuilly sur Seine, France, 1969. [Google Scholar]
  39. Roberts, S.K.; Yaras, M.I. Large-eddy simulation of transition in a separation bubble. J. Fluids Eng. 2006, 128, 232–238. [Google Scholar] [CrossRef]
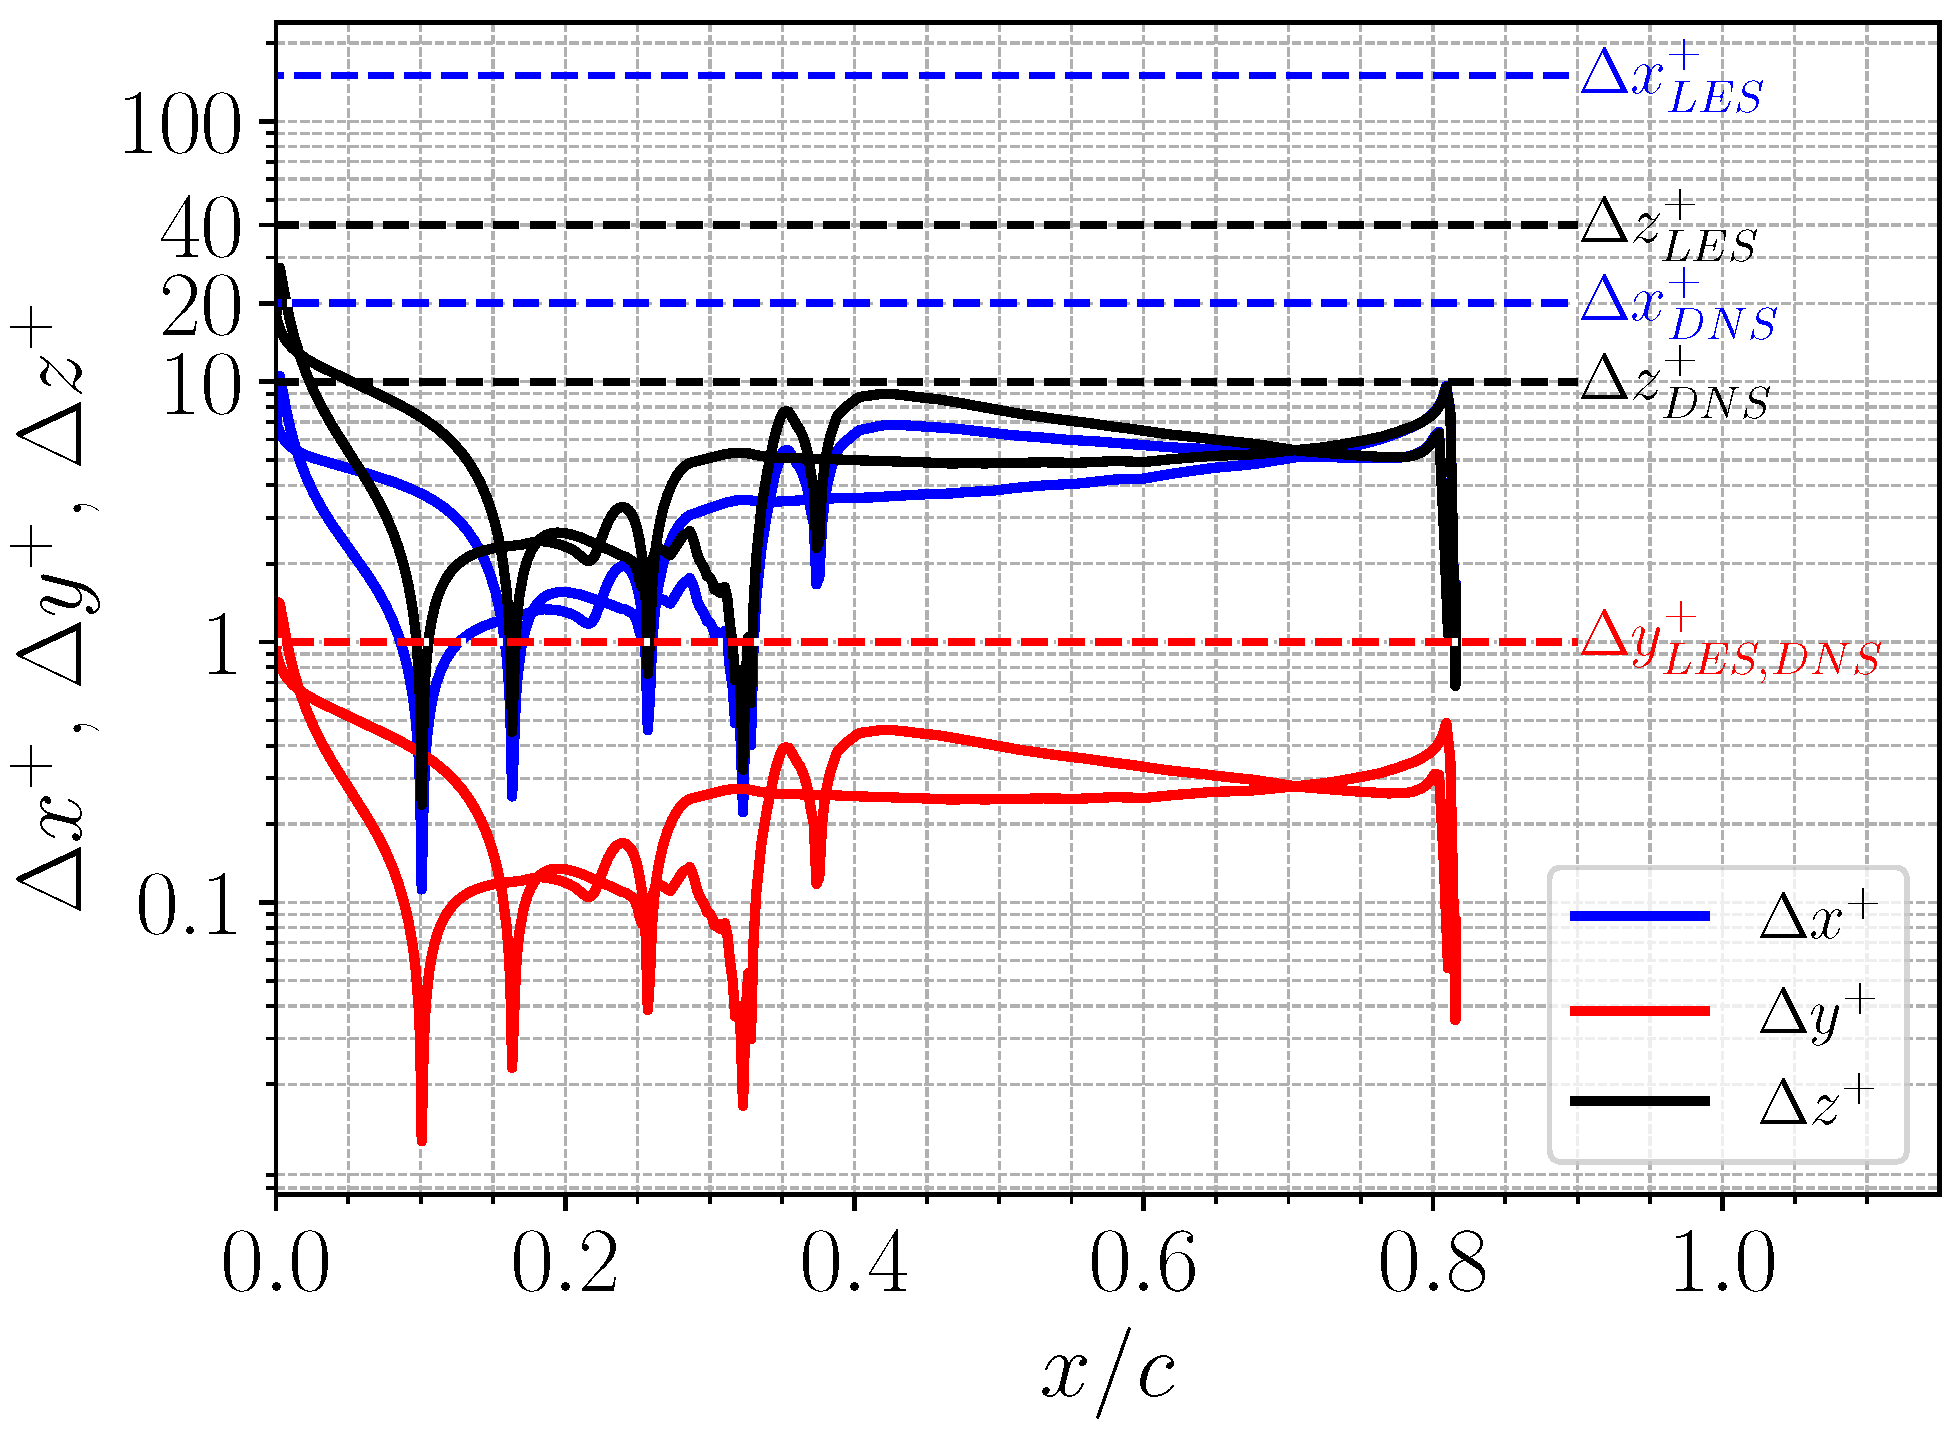
Figure 1. Near-wall mesh resolution for the 5 th-order polynomial (noting that in z, the polynomial order is not relevant).
Ijtpp 10 00008 g001
Figure 2. Linear x y -plane fully quadrilateral mesh; this had 26,827 elements.
Ijtpp 10 00008 g002
Figure 3. Fourier mean-mode of the time-averaged solution at a 53.5 ° angle of incidence.
Ijtpp 10 00008 g003
Figure 4. Pressure distribution at the nominal ( 52.8 ° ) and corrected ( 53.5 ° ) angles of incidence with experimental comparisons.
Ijtpp 10 00008 g004
Figure 5. Instantaneous solution Q-criterion contours (values of 10, 25, 50, and 100) at the 53.5 ° angle of incidence, coloured by velocity magnitude.
Ijtpp 10 00008 g005
Figure 6. Pressure side (a) Görtler number and (b) Blackwelder parameter.
Ijtpp 10 00008 g006
Figure 7. Pressure side behaviour. (a) Q-criterion contour coloured by velocity magnitude. (b) Instantaneous spanwise wall-shear stress. (c) Time-averaged spanwise wall-shear stress.
Ijtpp 10 00008 g007
Figure 8. Power spectral density of the sampling points within the pressure and suction side boundary layers. (a) Sampling point location; numbers are points on the suction side and letters on the pressure side. (b) Pressure side. (c) Suction side.
Ijtpp 10 00008 g008
Figure 9. Instantaneous axial velocity field.
Ijtpp 10 00008 g009
Figure 10. Suction-side Blackwelder parameter.
Ijtpp 10 00008 g010
Figure 11. Predicted boundary layer height when L z = 0.1 chord.
Ijtpp 10 00008 g011
Figure 12. Spanwise autocorrelation for the clean inflow case with 10 % and 20 %   L z . (a) Points 2–4. (b) Point 5.
Ijtpp 10 00008 g012
Figure 13. Pressure distribution at the 53.5 ° angle of incidence, with and without incoming turbulence, against the experimental data.
Ijtpp 10 00008 g013
Figure 14. Time-averaged mean-mode components of axial wall-shear stress. (a) Pressure side. (b) Suction side.
Ijtpp 10 00008 g014
Figure 15. Comparison of instantaneous wall-shear stresses for T I = 0 % through to 8 % . (a) Axial—Pressure side. (b) Spanwise—Pressure side. (c) Axial—Suction side. (d) Spanwise—Suction side.
Ijtpp 10 00008 g015
Figure 16. Blackwelder parameters for all turbulence intensities ( 0 % to 8 % ). (a) Pressure side. (b) Suction side.
Ijtpp 10 00008 g016
Figure 17. Suction side momentum thickness for all turbulence intensities ( 0 % to 8 % ).
Ijtpp 10 00008 g017
Table 1. Dimensional reference quantities.
SymbolNameValue
VInflow Velocity 39 [ m s ]
cTrue Chord 0.125 [ m ]
ν Dynamic Viscosity 1.5234 × 10 5 [ m 2 s ]
tReference Time 3.205 × 10 3 [ s ]
fReference Frequency 312 [ Hz ]
T I Turbulence Intensity 2.4 ± 0.1 %
lTurbulent Length Scale 2.5 × 10 3 [ m ]
Table 2. Archer2 hardware specifications.
Nodes5860 (5276 standard/584 high-memory)
Processor2 × AMD EPYCTM 7742, 2.25 GHz, 64-core
Memory per node256 GB (standard), 512 GB (high-memory)
Memory per core2 GB (standard), 4 GB (high memory)
Table 3. High-fidelity modelling cost.
Case L z / N z SVV Δ t tNodesHoursCost (£)
Clean inflow 0.1 / 160 95 % 10 5 1040582320
Clean inflow 0.2 / 320 95 % 10 5 1080614880
T I 0.1 / 160 95 % 2.5 × 10 5 1040301200
Disclaimer/Publisher’s Note: The statements, opinions and data contained in all publications are solely those of the individual author(s) and contributor(s) and not of MDPI and/or the editor(s). MDPI and/or the editor(s) disclaim responsibility for any injury to people or property resulting from any ideas, methods, instructions or products referred to in the content.