Article

Body Force Modelling of a Multi-Stage High-Pressure Compressor Under Inlet Distortion †

1
Safran Aircraft Engines, 77550 Moissy Cramayel, France
2
DAAA, ONERA, Institut Polytechnique de Paris, 92190 Meudon, France
3
ISAE-SUPAERO, Université de Toulouse, 31055 Toulouse, France
*
Author to whom correspondence should be addressed.
This manuscript is an extended version of the ETC2025-159 meeting paper published in the Proceedings of the 16th European Turbomachinery Conference, Hannover, Germany, 24–28 March 2025.
Int. J. Turbomach. Propuls. Power 2025, 10(2), 12; https://doi.org/10.3390/ijtpp10020012
Submission received: 6 May 2025 / Revised: 28 May 2025 / Accepted: 6 June 2025 / Published: 17 June 2025

Abstract

:
The present work aims to propose a new calibration strategy of the Hall–Thollet Body Force (BF) model to simulate the flow in multi-stage compressors and to capture inlet distortion effects within the machine. Both global (0D) and radial (1D) correction terms are introduced and calibrated to improve predictions in multi-stage compressors, accounting for highly interacting, highly loaded blades, falling outside the validity range of the model’s original coefficients. The modified model has been tested on the 3.5-stage high-pressure compressor CREATE, for which experimental data are available. The modified model is then employed to study different patterns of inlet distortion. The results show a very good agreement between Unsteady Reynolds-Averaged Navier–Stokes (URANS) simulations and Body Force calculations in terms of performance, key quantities along the radial and circumferential directions and distortion transfer across the compressor.

1. Introduction

Inlet distortion in compressors can strongly impact their operation, reducing the performance of the entire engine, narrowing its stability limits and consequently the operability range of the machine. It is very common for compressors to ingest distorted flows, and the occurrence of these phenomena increases as new disruptive technologies are developed in the aeronautical industry. Some widespread examples are Boundary Layer Ingestion (BLI) [1], S-ducts upstream of the compressor [2], crosswind [3] or inter-stage pipes in multi-stage radial compressors [4]. It is therefore critical to be able to accurately assess the effects of inlet distortion on these turbomachines at different stages of the design process, where simulation results are needed promptly.
Different types of distortion may occur upstream of a compressor. In general, distortions can be divided into steady or unsteady distortions. For both of them, total pressure and total temperature distortions are those who occur more frequently [5], as well as swirl distortion [2]. Inlet distortion always impacts the engine performance, affecting, for example, the flow velocity, the flow relative angle at the blades, and increasing the loading to which blades are subjected, thus reducing their stability [6]. In the present work, different patterns of steady total pressure distortion will be investigated to study their impact on the machine.
Some of the current available methods to investigate inlet distortion in multi-stage compressors are the Parallel Compressor method [7,8], the Actuator Disk method [9,10], full-annulus URANS simulations [11,12,13], and Body Force models [14,15,16]. In particular, the Parallel Compressor method simplifies the compressor as a series of parallel stages, providing quick estimates and low-resolution simulations, but lacks accuracy in capturing flow distortions. The Actuator Disk method approximates the interaction surfaces as a force-distributing disk, useful for global performance analysis but not for detailed flow distortions. Full-annulus URANS simulations are highly accurate, capturing turbulence and transient phenomena, but are computationally expensive [17]. Body Force models have proven to predict the topology and properties of the time-averaged flow quite accurately compared to URANS simulations, while maintaining a reasonable computational cost [18,19,20]. When properly adapted to the study of turbomachinery, they can be a very effective tool and the best trade-off option for capturing flow distortions at a reduced computational cost.
In Body Force models, the flow governing equations, i.e., Euler or Navier–Stokes equations, are modified to add source terms accounting for the influence of the blades on the flow, since the blades themselves are not meshed in the computational domain. One key advantage of these models thus lies in the simplification of the mesh derived from the absence of blades in the computational domain and consequently the absence of the refined mesh layers in the blade boundary layers. This advantage comes at the expense of the difficulty in correctly modelling the source terms. Body Force models can be formulated in different ways: the blade forces derive either (1) from the flow around an isolated blade or (2) from the circumferentially averaged flow. In the first category lie for example the Actuator Line, the Actuator Disk and the Blade Element Theory models [21,22] possibly combined with CFD simulations. The second category, comprising distributed source terms formulations, includes the Body Force models, Throughflow methods [23,24,25] and Immersed Boundary Method with Smeared Geometry models (IBMSG) [26,27]. These formulations present a second key advantage when studying distortion: as the forces come from a conceptual circumferential average, the time-averaged flow is represented and steady computations can be used even in the presence of non-uniform inlet flow, whereas unsteady simulations are required when blades are meshed.
In the present work, the Hall–Thollet model [28] is adopted to investigate different patterns and intensities of inlet total pressure distortion in a multi-stage high-pressure compressor, with bladed URANS calculations as reference. The Hall–Thollet model is a viscous 3D Body Force model whose source terms are based on the parallel and normal force representation. It accounts for compressibility effects, metal blockage and off-design behaviour through different correction terms. Analogous models have been traditionally applied to simpler configurations, such as Fan-OGV and Fan-Airframe applications [19,28,29] or single stage compressors [29,30]. To the authors’ knowledge, there are no previous studies on multi-stage high-pressure compressors that disposed of multi-stage bladed URANS calculations as reference for the Body Force methodology validation, and which studied, at the same time, various patterns and intensities of distortion. Both Hill et al. [30] and Guo et al. [31] validated their models on a single rotor, the NASA Rotor 67, before employing it to study more complex configurations.
The present work takes its place in this context and aims to propose a new calibration strategy of the Hall–Thollet Body Force model to adapt its formulation to highly complex flows, such as in multi-stage high-pressure compressors, to predict with the modified model inlet distortion effects across the compressor, and to assess the solution accuracy with respect to reference bladed URANS calculations.
The following sections are divided as follows. Section 2 presents the chosen Body Force model and the implemented modifications for its exploitation in the study of multi-stage high-pressure compressors. In Section 3, the studied compressor is introduced, as well as the distortion patterns injected at the inlet of the machine. Section 4 presents the numerical set-up for both the bladed and the Body Force simulations, as well as an overview of the computational cost of each one of them. Finally, Section 5 details the results of the work in terms of calibration and distortion investigation. In particular, the distortion study analyses both the impact of inlet distortion on the machine and the accuracy of the modified Body Force model to reproduce these phenomena, with respect to reference URANS bladed calculations. Section 6 presents the conclusions and perspectives related to this work. The present work complements the findings of Crea et al. [32], as reported in the proceedings of the 16th European Turbomachinery Conference.

2. Methods

2.1. The Body Force Model

The chosen model for this study is the Hall–Thollet Model. The underlying force formulation was firstly proposed in 1964 by Marble [14], who represented the blade rows through an infinite distribution of blades and took into account their effect on the flow by adding the body force terms in the equations of motion. Following his idea, the first force modelling approach was proposed by Gong [15], later improved by Peters [33].
Here, we use the force model proposed by Hall [16], with Thollet’s improvements [28]. The model relies on a normal force formulated by analogy with the lift of a flat plate, using a local 3D flow deviation angle δ . It was then enriched by the work of Thollet in 2017 [28], who added the metal blockage and a compressibility correction to Hall’s normal force, and proposed a formulation for a parallel force to generate losses in the flow. The model is based on an explicit formulation, using the camber surface of the blade as the input, in the form of the normal vector distribution n ( x , r ) . In its complete formulation from 2017, it also presents a quadratic off-design loss term. It is based on the flow deviation at the best efficiency point, as specified by a blade calculation. This reference deviation δ η m a x ( x , r ) is calculated from a preliminary Body Force simulation where the quadratic term is omitted. The formulation of the parallel and normal forces introduced in this model is presented in Equation (1).
f n = W 2 2 s b | n θ | 2 π δ K m a c h f p = W 2 2 s b | n θ | 2 C f + 2 π K m a c h ( δ δ η m a x ) 2
where W is the relative flow velocity, s is the local blade pitch, b is the metal blockage, K m a c h is the compressibility correction term and C f is the friction coefficient of a flat plate in turbulent regime [28].

2.2. Model Calibration for Complex Configurations

As mentioned before, modelling the normal and parallel force is the most challenging aspect of these models. In the Hall–Thollet model, the parallel force f p and the normal force f n have been created by analogy with simple flows, and their formulation tend to lose reliability as far as highly interacting, highly loaded blades are concerned. It is for this reason that the model is here enriched with corrections that are calibrated using single passage bladed RANS steady simulations, with the goal to improve the model accuracy for clean and distorted inflow conditions.
More precisely, it can be observed that both the normal and parallel forces of the model, accounting for work and losses generation in the flow, contain coefficients issued from the theoretical behaviour of the flow around a flat plate ( 2 π δ and C f ) or an isolated 2D profile (second term of the parallel force). For this reason, in this work, the coefficients are modified by additional calibrated coefficients that allow to tune the response of the model. Moreover, it is also found that the choice of the operating point at which the reference deviation is defined for the off-design correction term can be leveraged to improve the overall prediction of the off-design loss behaviour. The new proposed model formulation is given in Equation (2).
f n = W 2 2 s b | n θ | 2 π δ K n K m a c h f p = W 2 2 s b | n θ | 2 K f C f + 2 π K m a c h ( δ δ p i v o t ) 2 K D
The coefficients here introduced are K n in the normal force, K f in the first term of the parallel force and K D at the exponent of the off-design term in the parallel force. Moreover, the reference value for the deviation in the off-design term, originally calculated at the maximal efficiency point and indicated as δ η m a x , is replaced by the deviation calculated at a pivot point δ p i v o t . All the coefficients are specific to each row, as detailed below.
Calibration is performed for each row sequentially, from the upstream to the downstream rows, in the complete configuration, with no need to isolate each row for its tuning. The calibration process first relies on the choice of K n and K f . K n modifies the ideal lift coefficient of a flat plate present in the original formulation: C L = 2 π δ 2 π δ K n . Hence, an increase in this parameter causes a shift in the stage characteristic towards its upper right side. On the other hand, K f pilots the losses via the friction coefficient of a flat plate in turbulent regime: C f = 0.0592 R e x 0.2 0.0592 K f R e x 0.2 . Therefore, its increase causes a shift in the stage characteristic towards its lower left side. More specifically, K n will impact the turning of the flow, and therefore the total temperature in rotors, and the total-to-static pressure ratio π s t in stators. K f will impact the loss, and therefore the efficiency and the total-to-total pressure ratio π t t in both the rotors and stators. Coupling interactions are found to be low. This is summarised in Table 1. The tuning of K n and K f allows to bring the Body Force characteristic closer to the desired one and find a tangency point for the efficiency–massflow isospeed line, which will be useful for the calibration of the off-design term, as explained in the following.
Regarding the off-design term of the parallel force, two modifications have been applied. On one hand, K d allows to adjust the level of off-design losses on the blade, modifying the quadratic law of the drag coefficient of a 2D profile: C D = C D , m i n + K ( C L C L , i d e a l ) 2 , present in the Body Force model with 2 π δ η m a x = C L , i d e a l . On the other hand, the reference 3D flow deviation angle at best efficiency δ η m a x is replaced by δ p i v o t . At the pivot point, the quadratic off-design term is zero. For every other operating point, the off-design term will be activated, and the row characteristic will pivot downwards. The Thollet’s auto-tuning is thus logically centered in the maximal efficient point in the case of a single-stage compressor or a fan stage. However, for multi-stage compressors, each stage can have a different maximal efficiency point, based on its operating conditions, and choosing the overall best efficiency point would not ensure that each stage has the correct loss behaviour. In particular, the implicit dependence of the losses on the massflow, as imposed by the parallel force formulation, allows to choose the point from which losses are activated in the model. The chosen pivot point is the above-mentioned tangency point found between the reference and the Body Force characteristics once K n and K f are calibrated, to allow the row characteristic to pivot around the found intersection. The results of the calibration for this work are presented in Section 5.1.
A calibration done by hand can require up to two iterations per coefficient, starting from the non-calibrated case. The shifts in the characteristic are in fact proportional to the coefficient applied and the correct value is easily interpolated after the first calibration iteration. Nevertheless, an automatic calibration could be implemented in future works, allowing for an even more efficient process.
The objective characteristic for each row can derive from CFD bladed simulations, experimental data, meridional calculations and so on. In this work, single-blade-passage (SBP) bladed RANS calculations have been used as reference for the calibration process. Despite the need of pre-established data for the model calibration, this process easily allows to tune a simplified model for simulating an extremely complex and highly interacting configuration. Moreover, once the model calibrated, its full potential resides in the ability to capture and transfer inlet distortion across the full compressor with no need for a new calibration and at a significantly reduced cost and a good reliability with respect to URANS bladed simulations, as shown in Section 5.

2.3. Endwall Corrections

Multi-stage high-pressure compressors also present significant near-wall phenomena. Compressors’ low aspect ratio blades are more sensible to their influence than fan blades because of the increased relative amplitude of the phenomena to the channel height and because of the more critical environment due to high pressure and temperature in the compressor annulus. It is thus necessary to introduce endwall corrections capable of improving the model’s predictions in those critical regions.
In particular, Equation (2) show that when the relative flow velocity W becomes zero, as it occurs at the stator hub and shroud walls and at the rotor hub wall, the work and losses generated by the model also become zero, which can cause numerical separation and other non-physical shifts from the intended result. To reproduce the correct turning of the flow at the end-walls of the bladed regions, following past contributions [25,34], the knowledge of the slow variation in static pressure in the boundary layer is used to suppose that a constant value of the normal force near the walls would be more appropriate. With this technique, here called “Clipping”, the normal force is constrained to remain constant from a certain distance up to the hub and shroud walls. This distance has been chosen as the displacement thickness of the boundary layer at the domain inlet for both the hub ( δ 1 , h u b ) and shroud ( δ 1 , s h r o u d ), obtained from a Body Force calculation at design point. The distance imposed for the correction is kept constant throughout the whole compressor to avoid excessive thickening of the boundary layer.
Finally, in the current methodology, the source terms are uniformly applied to the Body Force mesh blocks replacing the blades; however, no work should be done in the rotor gaps. For this reason, the normal force is set to zero at each rotor gap to avoid over-prediction of the work done by the bladed row in these regions.
Figure 1 shows the field of normal force f n before and after the modifications described above. In particular, in the upper part of the figure, the zero value of f n at the rotor gaps can be highlighted, while the lower part of the figure shows the f n field before (left) and after (right) modifications in a particularly critical spot at a stator hub wall. Overall, the intended clipping effect is observed, and the magnitude of the force is maintained close to the hub wall. It is also observed that, close to the leading edge, the clipping prevents a non-physical high value of the force, due to an excessively high value of the deviation in this area.
Non-physical, excessively high values of deviation δ , and thus of normal force f n , are thus limited and also at the proximity of the hub and shroud walls, since the model is now capable to correct the radial evolution of the forces and to avoid non-physical detachment due to a significantly low level of work with respect to the flow velocity.

2.4. Workflow of the Proposed Model

The workflow of the newly proposed model is summarized below and schematised in the flowchart in Figure 2. The process begins by determining the wall boundary conditions. If viscous walls are present, the boundary layer height is extracted to apply the clipping correction. Simultaneously, the second endwall correction, related to the rotor gaps, is activated. This step is skipped if no viscous walls are present.
Then, the calibration process begins. Each row, from first to last, is calibrated sequentially, as illustrated in Figure 2. The first two parameters to be calibrated are K n and K f , with target values provided in Table 1. The δ p i v o t value for each row is then extracted at the pivot point and applied to all other operating points. Finally, the K D parameter is calibrated based on the target off-design losses.
Once this process is completed, the model is ready to be employed to study the machine under various inlet conditions, without requiring any further adjustments to its coefficients.

3. Configuration and Distortion Cases

3.1. Compressor Geometry

The multi-stage high-pressure compressor studied in this work is CREATE, “Compresseur de Recherche pour l’Etude des effets Aérodynamiques et TEchnologiques”, a 3.5-stage compressor that has been designed and constructed by Safran Aircraft Engines and tested in the LMFA laboratory at École Centrale de Lyon [35,36,37]. CREATE presents a spatial periodicity, due to the number of blades in each row, which allows to reduce the computational domain from the complete annulus ( 2 π ) to a sixteenth of the annulus ( 2 π / 16 ). Experimental data are available for this configuration and in particular, pneumatic measures of total pressure, total temperature, and flow angle have been exploited in this work. To reduce the computational domain, the Inlet Guide Vane (IGV) is not simulated. Instead, the injected flow at inlet is modified and thus non-uniform, to replicate the behaviour of the flow downstream of the IGV, according to experimental data. Altough it is non-uniform, this case will still be called “Clean Inlet” or CLN in the following, as it replicates the behaviour of the machine under nominal conditions and to contrast with the inflow distortion cases. The meridional view of the compressor, including the experimental planes positions and names is shown in Figure 3. Planes 25A and 300 are the inlet and outlet, respectively, of the computational domain in this work. The main figures of the compressor at design point are in Table 2 and Table 3. In particular, Table 3 shows the reduced number of blade for each row when the periodic circumferential sector 2 π / 16 is adopted.

3.2. Inlet Distortion Cases

To demonstrate the capabilities of the model under inlet distortion, two different cases of total pressure distortion have been generated: a radial distortion case and a circumferential distortion case. To keep a reasonable computational cost, and given that the full-annulus simulation of CREATE would have required extensive resources, two different numerical approaches have been adopted for the simulation of the distortion studies, as detailed in Section 4.
A summary of the studied configurations is provided in Table 4, along with the ID of each case, which will be useful in the following sections and gives, when combined with the data of Table 5, a full overview of the studied cases.

3.2.1. Radial Distortion

For the radial distortion case, a typical total pressure radial profile downstream of an S-duct, which usually precedes high-pressure compressors, is implemented. The desired total pressure deficit is gradual, with a peak of ( 1 P t / P t , m a x ) = 6 % towards the endwalls. The injected radial profile is presented in Figure 4, scaled by the mean total pressure value at “Clean Inlet” conditions. The distortion has been applied to the nominal operating point of the compressor.

3.2.2. Circumferential Distortion

Two circumferential distortion patterns are considered. In both cases, the azimuthal extent of the distorted area, in terms of minimum pressure, covers 120 . The total pressure deficit is 4 % in the first case, and 10 % in the second one. The injected total pressure distortions along the azimuthal direction P t ( θ ) are presented in Figure 5, scaled by the total pressure at “Clean Inlet”. The distortion has been applied to the nominal operating point and to a near-stall operating point.

4. Computational Methodology

4.1. Bladed Simulations

The CFD computations were carried out with the finite-volume solver elsA developed by ONERA and co-owned by ONERA and Safran [39].
The Reynolds-Averaged Navier Stokes equations are solved either in a steady (RANS) or unsteady (URANS) formulation, depending on the case. An extensive work has been done to adapt the numerical setup to better reproduce the experimental data at hand. The chosen turbulence model is the k l Smith model [40], following previous works on similar applications [19,38,41]. The spacial discretisation scheme is the second-order Roe upwind scheme [42], stabilised with the Van Albada slope limiter [43]. With respect to the unsteady calculations, the Gear implicit second order upwind scheme [44] is employed for the time integration, with 6720 iterations per revolution and 12 Newton sub-iterations.
The configurations for each case are summarised in Table 5. First, with the ID 1A, is the steady RANS single-blade-passage configuration employed for the calibration and validation of the model. It is issued from a grid sensitivity study and is adapted for steady calculations with mixing planes.
Then, with the ID 1B, is the Unsteady-RANS calculation for the radial distortion study. The radial distortion profile being uniform in the azimuthal direction, the 2 π / 16 periodic sector configuration has been chosen for this case, since it allows to reduce the computational cost with respect to full-annulus simulations while enclosing all the required information for the radial distortion study. The mesh is directly generated from a duplication of the single-blade-passage case, with a further refinement at the blocks interfaces for a better discretisation of the wakes of each row throughout the unsteady simulations.
Finally, identified with the ID 1C, is the Unsteady-RANS calculation for the circumferential distortion study. Since simulating a circumferential distortion necessarily requires a full-annulus simulation, and given the prohibitive calculation cost of the present compressor case in the event of a 360° full-annulus simulation, a pseudo-2D case has been created, named P2D in the following. The idea is to extract two streamlines at around 50 % of the annulus height and thus simulate the 360° full-annulus in this significantly reduced portion of the compressor’s height. The endwalls have a slip boundary condition and it will thus not be necessary to apply the endwall corrections to this case. The mesh presents the same parameters as case 1B but is limited to the P2D geometry.

Assessment of Mesh 1A

An overview of case 1A is presented here for completeness.
As previously mentioned, a grid sensitivity study was conducted to find the best balance between solution accuracy and computational cost. Three structured grids with a O4H topology were tested: COARSE, MEDIUM, and FINE, as detailed in Table 6. The FINE grid features double the mesh points of the COARSE grid in each blade-to-blade (B2B) direction, with an accordingly increased number of radial points to maintain mesh quality. Table 6 specifies the grid points along the radial ( N r ) , axial ( N x ) and tangential ( N θ ) direction for each grid. The COARSE and MEDIUM grids have similar configurations, with a slight refinement at the first rotor for the MEDIUM grid and more radial points in each of its rotors. The FINE grid is more refined in each direction. Moreover, the O-block contains 37 points for the COARSE and MEDIUM cases and 47 for the FINE grid.
The grids were tested at the nominal operating point, and the results were compared in Table 7. The error is defined relative to the FINE grid, for instance, e r r C O A R S E = ( g F I N E g C O A R S E ) / g F I N E . The performance for the MEDIUM grid closely matches that of the FINE grid, with errors for the corrected massflow rate ( Q c o r r ) and the total-to-total pressure ratio ( π t t ) below 0.1 % and errors below 0.3 % for the isentropic efficiency ( η i s ). In contrast, the COARSE grid shows more significant deviations. Thus, the MEDIUM grid was selected for further analysis. This grid, depicted in Figure 6, has optimal mesh quality with minimal skewness (angle > 35 ), a maximum expansion ratio of 2 (locally higher than standard due to rotor tip gaps and blade fillet radii), a span-wise angular deviation < 40 , and y + 1 .
Finally, the boundary conditions for cases ID 1A and 1B (full-height) and ID 1C (P2D) are shown in Figure 7. The inflow condition is in red, outflow in blue, row interfaces (where mixing plane or sliding mesh conditions are applied) in green, viscous walls in gray, and inviscid walls in orange. The boundary conditions for Body Force cases 2A and 2C are identical, with the only difference being the absence of blades viscous walls and of the interface condition between rows.

4.2. Body Force Simulations

As regards the Body Force simulations, the same numerical setup as the bladed steady-RANS is employed in terms of spatial discretisation scheme and turbulence model.
The Body Force configurations employed in this work are presented in Table 8. In general, in each Body Force mesh, the blades are replaced by axisymmetric blocks defining the volume swept by the blades. In these blocks, the source terms are imposed and the blade walls are neither present nor meshed, considerably reducing the required mesh size.
In particular, mesh 2A is a 2° sector of the compressor, employed for both the calibration/validation phase and the radial distortion study, corresponding to the bladed calculations performed with meshes 1A and 1B, respectively. In a preliminary phase, a grid sensitivity study was performed.
Mesh 2C has been generated with the same parameters as mesh 2A, but for the P2D geometry. It corresponds to the bladed calculation identified by the ID 1C. The P2D geometry of both the Body Force mesh 2C and the bladed mesh 1C are represented on the left and right hand sides of Figure 8, respectively, to better explain visually the P2D geometry.

4.3. Computational Cost

For each one of the presented cases, Table 9 reports the CPU time required for the numerical simulations to reach convergence at the nominal operating point.
In particular, the table first specifies the CPU time per processor and per number of jobs executed T C P U / ( N p r o c s N j o b s ) , in terms of elapsed time between the reading of the initial file and the writing of the final solution, scaled by its value for case 1A. This CPU time mainly depends on the amount of cells charged on each processor and on the balancing error between processor, which is itself prescribed by the mesh block sizes. It is similar for each case because the processors were always loaded with more or less 200,000 cells. The discrepancies between cases for this value are mainly due to the time required to handle, divide, and allocate the mesh blocks, which also depends on the total mesh size, and also to the differences in numerical set-up between steady and unsteady calculations for the bladed URANS distortion study (second order temporal scheme and unsteady boundary condition between bladed rows). Then, on the following columns of the table, the number of needed processors (second column), based on the mesh size, and jobs (third column), based on the iterations to reach convergence, are expressed. And finally, the multiplication of these three parameters gives the total CPU time (last column).
The two main advantages of employing a Body Force model can be highlighted through the required number of processors and jobs, respectively. On one hand, the number of employed processors is highly reduced in the Body Force calculations and reflects the advantage in reducing the mesh size when blades are not meshed. This gain impacts the final CPU time, but it does not highly affect the time spent for completing the simulation, since parallel calculations are performed. On the other hand, the number of jobs required for convergence shows the important gain in time obtained with Body Force steady calculations compared to Unsteady RANS bladed calculations required for the distortion study. More specifically, the time required for the radial and circumferential distortion study is ten times the time required by the Body Force calculation to perform the same task, based on the needed jobs. In terms of CPU time, the Body Force calculation in the calibration and validation case requires almost 65 times less time than the RANS single-blade-passage simulation. The circumferential and radial distortion cases require approximately 235 and 3300 times less CPU time when choosing the Body Force modelling.

5. Results

5.1. Calibration and Validation of the Body Force Model

The Hall–Thollet model has been first employed in its original formulation to simulate the compressor CREATE. Then, since non-negligible shifts were noticed with respect to the bladed simulations, the calibration process, as explained in Section 2.2, has been applied with the endwall correction presented in Section 2.3. For CREATE, 2 % of the height at hub and 6 % of the height at shroud have been clipped. Once the correct heights imposed, the calibration process is performed. Table 10 reports the final values of the calibration coefficients for the compressor CREATE.

5.1.1. Global Performance

Figure 9 and Figure 10 show the global performance predictions in terms of total pressure ratio and isentropic efficiency characteristics. In each of these figures, the experimental data of a nominal and a stable near-stall operating point are depicted. Moreover, the curves issued from the single-blade passage RANS calculations and the Body Force calculations with the initial and calibrated models are depicted. The iso- π t t / Q c o r r line, indicating the reference value for the experimental nominal point is also presented with a dashed red line, establishing the criterion for the choice of the nominal point in CFD simulations, labeled as “NP”. As regards the near-stall point at lower massflow rate, the equivalent CFD point could not be selected with the same criterion because it would have ended up in the unstable region of the compressor map. Therefore, a point at a slightly higher massflow rate has been chosen, labeled as “NS” in the figure.
In particular, as it can be seen in Figure 9, the original Body Force characteristic, issued from the unmodified Hall–Thollet model and named “BF initial”, does not accurately reproduce the bladed RANS predictions, neither in terms of choke massflow nor in terms of overall properties. It can also be noticed that the “BF initial” characteristic does not reach, on the left hand side of the graph, the same values of massflow as the bladed RANS (named RANS SBP) and BF-calibrated case (named BF-calibrated). This is due to the lack of robustness of the original model with respect to strong secondary flow effects, which are avoided thanks to the endwall corrections, allowing to have a better behaviour of the model when approaching the surge limit.
In Table 11, the relative errors for the “BF initial” and “BF-calibrated” formulations are reported, with respect to the RANS bladed simulations. In particular, the error is presented for two stable operating points, a nominal point NP and a near stall point NS, as showed in Figure 9. The performance metrics are compared at iso-massflow rate, with respect to the RANS bladed results. It can be observed that the calibration allows to remarkably reduce the prediction errors, decreasing by two orders of magnitude the errors in terms of π t t , π s t , η i s and Π t t at NP.

5.1.2. 1D Radial Evolutions

The analysis of the 1D evolution of quantities along the compressor radius at different stations, corresponding to the experimental planes of Figure 3, allows to appreciate the improvements of the model in terms of prediction of the near-wall flow behaviour. In Figure 11, in the upper part, the absolute flow angle α at the exit of each rotor is displayed, scaled by a reference value α 0 . In the lower part, the entropy S of the flow is shown, scaled by a reference value S 0 .
Figure 11 clearly highlights the effect of the clipping technique applied to the normal force of the model. The work done by the blades on the fluid is increased near-wall and it results in a better alignment of the flow, which is particularly evident near the shroud wall, where the calibrated model is capable of better predicting the flow turning even when secondary effects become more preponderant towards the rear stages of the machine. As regards the lower part of Figure 11, the entropy level are significantly increased at the shroud proximity, with respect to the initial model predictions, thanks to the greater work input. These better predictions also positively affect the total pressure and the total temperature, which both benefit from the higher work produced by the blade, thus increasing the total temperature and pressure output.

5.2. Radial Distortion Study

In Section 3.2.1, the radial distortion case has been presented. Both the URANS bladed simulation with a 2 π / 16 computational domain, and the calibrated steady Body Force calculations with a 2 sector computational domain have been run with the radial distortion cartography plotted in Figure 4. Results are presented in Figure 12, in terms of relative difference between the distorted and clean inlet cases, expressed as: Δ g [ % ] = ( g d i s t g C L N ) / g ¯ C L N , b l a d e d × 100 , where g ¯ C L N , b l a d e d is the averaged value of the radial profile for the clean case with the bladed simulations.
As regards solution accuracy, Figure 12 depicts the total pressure and total temperature radial profiles downstream of each rotor. As it can be observed, the calibrated Body Force model is capable of predicting the trend and magnitude order of these quantities in presence of distortion quite accurately, with some minor discrepancies in the first stages. In particular, the maximal total error, | Δ g | U R A N S Δ g | B F | , encountered between the bladed URANS and the BF curves in terms of total pressure is of 1 point at plan 26A, with a lower mean error across the whole compressor. On the lower part of Figure 12, the total temperature profiles are showed. Here, the maximal error is 1 point at the shroud proximity of plane 26A, with a lower mean error for all the other stations. In particular, a deviation from the URANS predictions can be noticed at the shroud proximity, but the absolute values of temperature variations are small so that, as said, the maximal error of prediction between the two formulations is low. For both the total pressure and total temperature, the most critical regions in terms of solution accuracy are localised near wall because of the complexity and richness of the phenomena involved, but the solution proves to be in excellent agreement with the desired results.
The effects of radial inlet distortion on the nominal point of the compressor can also be highlighted from Figure 12. First, it can be noticed that the total pressure deficit, which has a peak-to-peak amplitude of around 7 % at the compressor inlet (Figure 4), decays along the compressor. For both the BF and bladed URANS calculations, downstream of the first rotor, the maximal deficit is reduced to around 4 % with respect to the “Clean Inlet” case. At the outlet of the last row, the difference between the minimum and maximum values due to distortion has narrowed, settling at 1 % around its mean. Total pressure fluctuates around an average value of 3 % deflection along the entire height, for the stations downstream of each row. Total temperature fluctuations do not vary much across the compressor, maintaining values of deviation between 1 % and 1 % at each station. The total temperature distortion is induced by the imposed total pressure distortion decay across the compressor. In particular, lower pressure zones are associated with lower flow coefficients and thus higher incidence angles on the blades, which will thus impart more work and entail higher temperatures. It can, in fact, be seen that the regions where the quantity Δ T t is positive correspond to the regions where a stronger total pressure deficit was imposed. The strong incidence angles in these regions also explain the difficulties of the Body Force model to accurately predict the behaviour of the flow, since higher angles bring the model closer to its limitations. Despite these difficulties, the model is indeed capable of giving an accurate picture of the flow behaviour under radial inlet distortion, with very contained errors and an accurate distortion pattern at each station along the compressor.

5.3. Circumferential Distortion Study

5.3.1. Impact of Total Pressure Distortion

The imposed circumferential total pressure distortion has been presented in Section 3.2.2. In particular, a 4 % total pressure distortion and a 10 % total pressure distortion have been investigated. This allowed to evaluate the performance of the Body Force model to capture and transfer distortion across the compressor, but also to study the influence of the distortion intensity on the model’s accuracy.
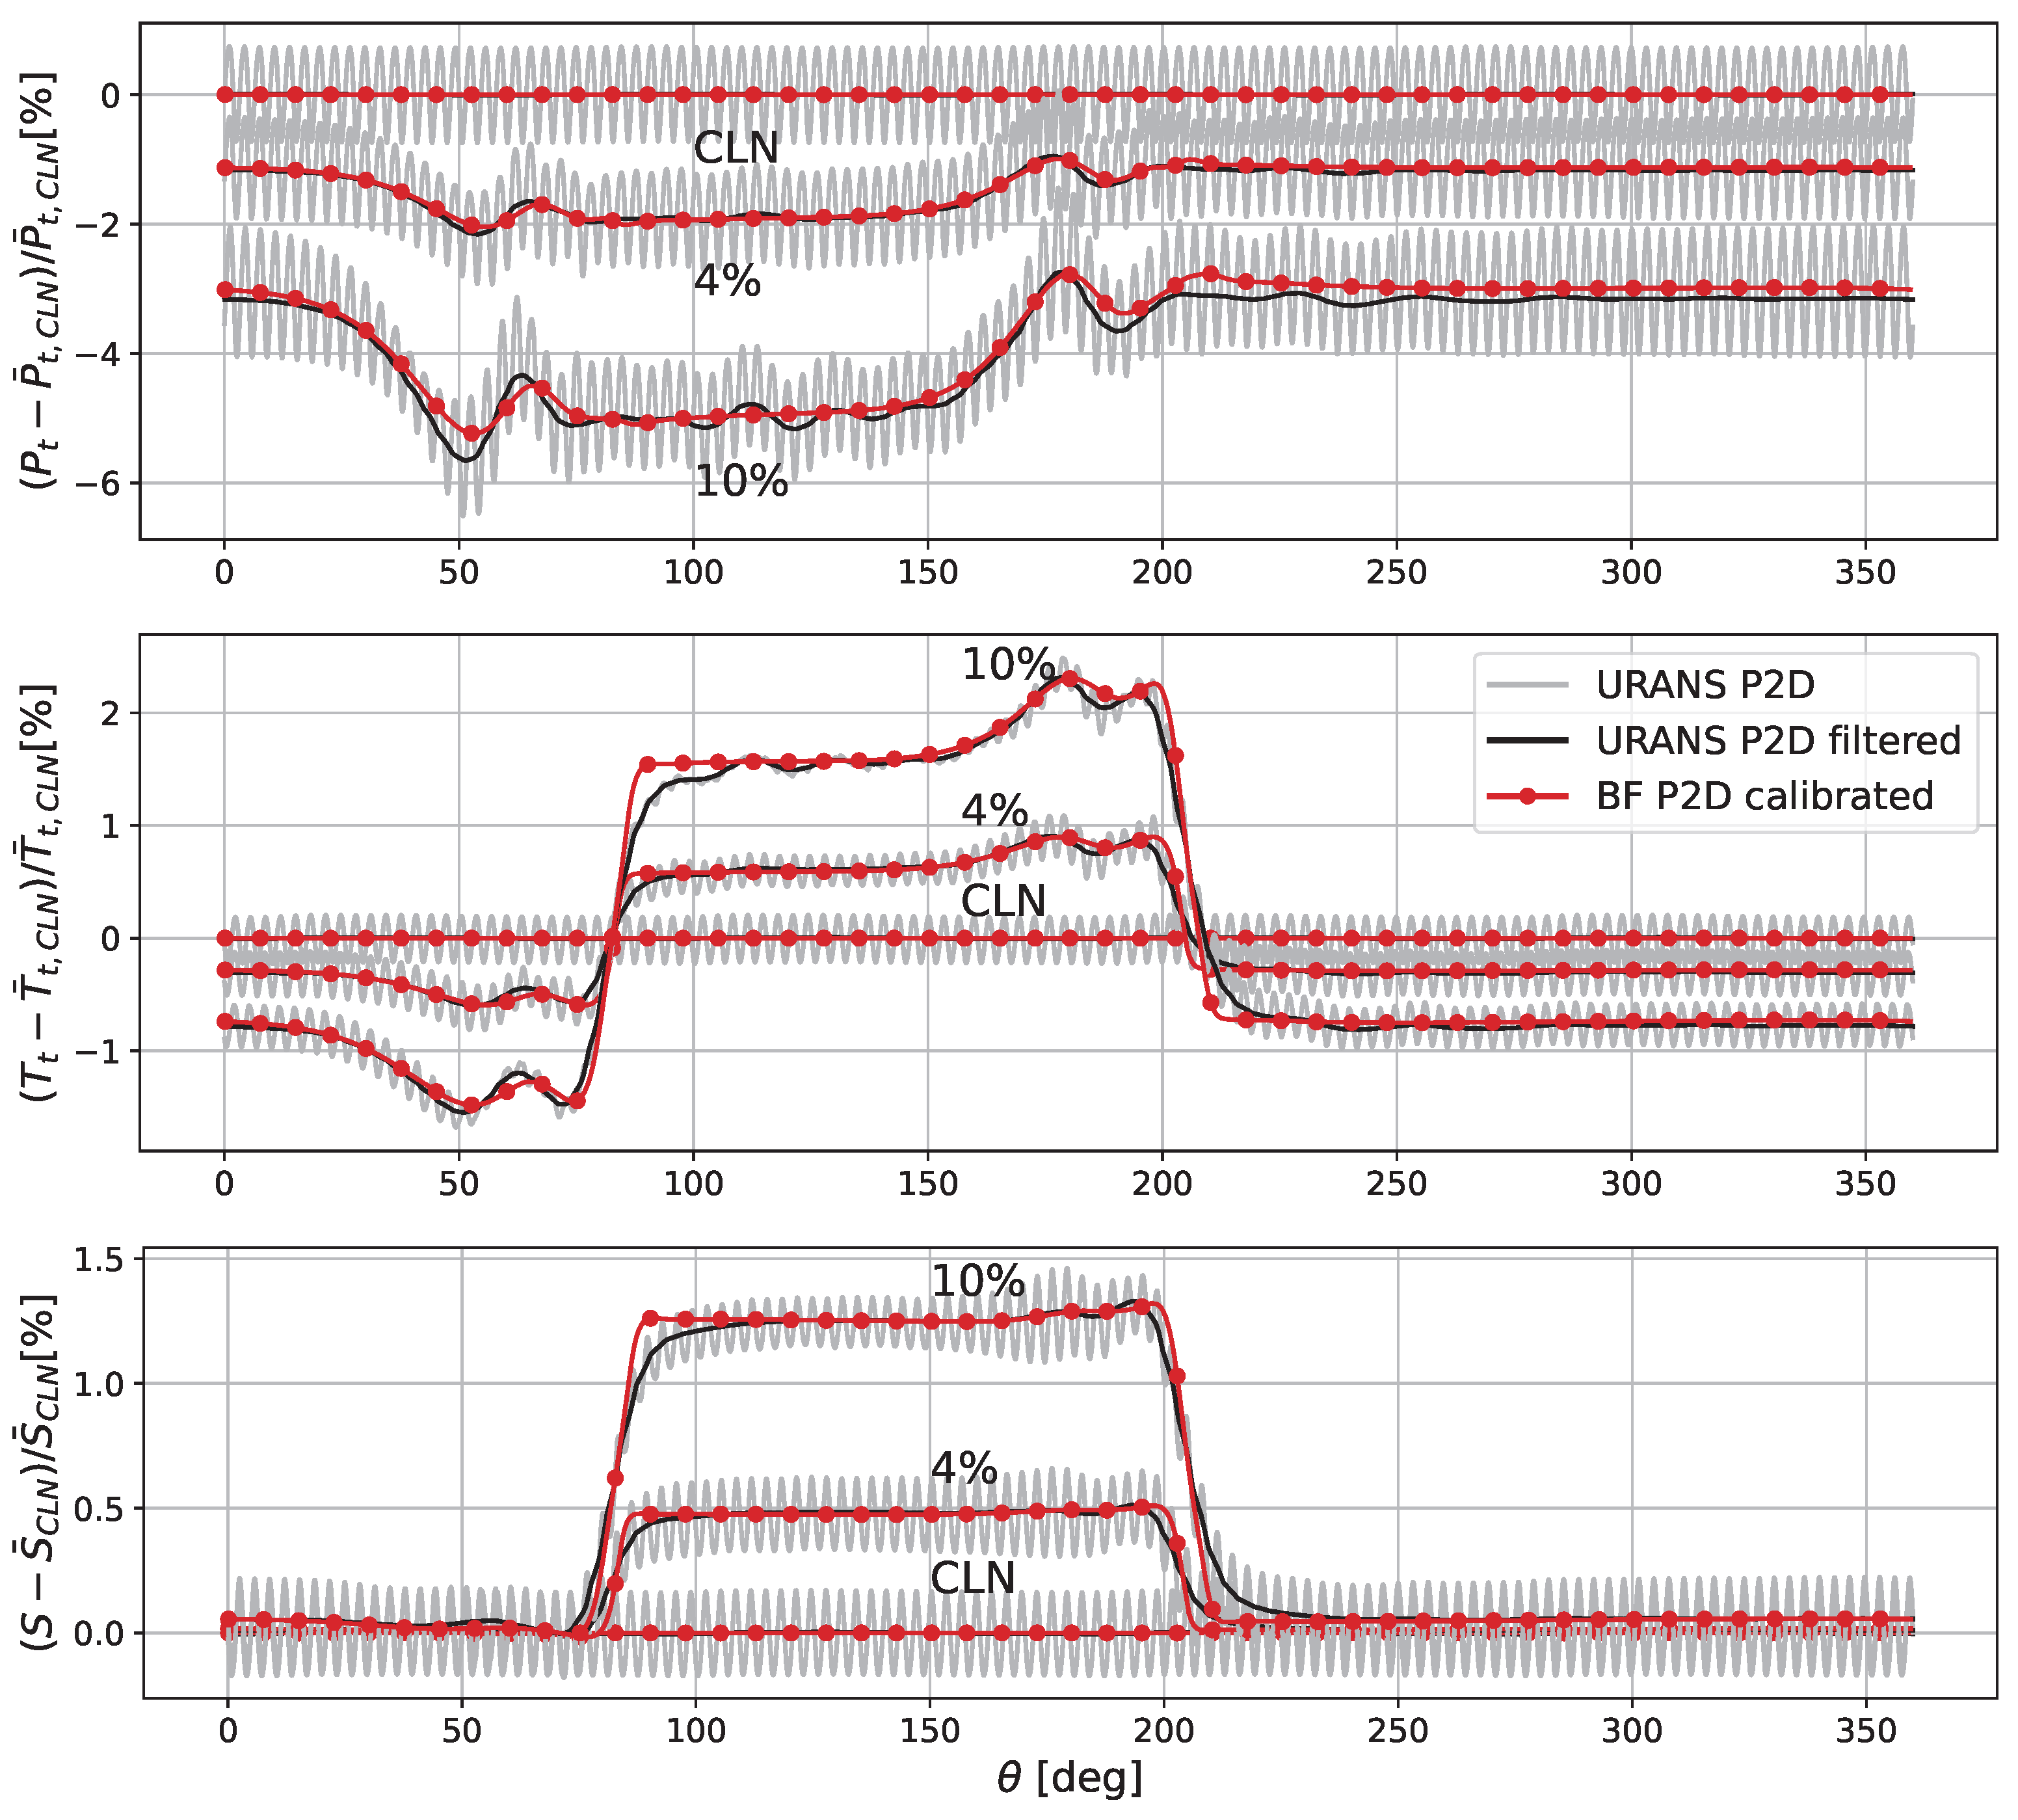
Figure 13 shows the results of this study in terms of relative difference between the distorted and “Clean Inlet” case ( g g ¯ C L N ) / g ¯ C L N , where g ¯ C L N is the averaged value of the azimuthal profile for the clean case. It is plotted at the outlet of the machine, for both the modified Body Force model, in red, and the URANS bladed configuration, represented in grey in its original form, which oscillates because of the presence of the stators’ wakes, and in black in its filtered form, which is the result of the application of a low-pass filter to the original signal.
The “Clean Inlet” case is represented for reference, and both the 4 % and 10 % total pressure distortion cases are plotted in the image. From the top to the bottom, the total pressure, total temperature and entropy azimuthal distributions are presented. The figure allows to showcase the level of deficit caused by the inlet distortion at the compressor outlet, as well as the precision of the Body Force solution with respect to the URANS solution. The BF solution follows with a very good agreement the URANS prediction for each of the displayed curves. Minor errors can be observed in the regions were the curves change their slope, which is probably due to the lower diffusion present in the Body Force flow field because of the absence of the modelling of many secondary flows.
For both the 4 % and 10 % cases, the modified Body Force model shows very good agreement with the URANS simulations, as reported in Table 12. The error is expressed as the maximum of the absolute value of relative difference between the Body Force and the bladed URANS solution, i.e., the maximum relative distance between the red and black curves of Figure 13 along the azimuthal direction. The results are very satisfying. Overall, the errors committed by the modified model are very low, and prove its adequacy and the benefits of employing this model for the study of non-uniform inlet conditions even for highly complex configurations.
In the following, the 10 % distortion case is employed to give more insights on the distortion effects on the compressor. Figure 14 shows the total pressure and total temperature across the compressor, in particular at the inlet of the machine and downstream of each stator, for both the BF (in red) and the bladed URANS simulations (filtered curve, in black). The total pressure and total temperature values have been scaled by a reference total pressure P t , 0 and total temperature T t , 0 , respectively.
As it can be expected, and analogously to previous work [31,45], the total pressure deficit is reduced across each stage. Total temperature, on the other hand, shows an increased deficit, i.e., the difference of the temperature level inside and outside of the distorted region increases from the inlet across the compressor. This can be explained through a redistribution of the flow caused by the inlet total pressure distortion, as shown in Figure 15.
First, the absolute swirl angle at the domain inlet, depicted at the top of Figure 15, clearly shows that the total pressure distortion induces two opposite swirls at the edge of the distorted region, causing a redistribution of the flow, which is moved by the static pressure differential created on both sides, greatly affecting the flow direction. As depicted in the middle and lower part of Figure 15, respectively, the flow coefficient V x / ( ω r ) is reduced in the distorted region, forcing a higher relative angle arctan [ ( ω r V θ ) / V x ] on the blades immersed in this region, which is also a direct consequence of the swirl regions formerly highlighted. The compression work done by the blades is thus higher, and it results in elevated temperature and entropy levels in the distorted region, as in Figure 13. Additionally, it can be noticed that the relative angle in Figure 15 deviates from the URANS calculations in the downstream stages. This deviation occurs due to the calibration limitations at each row, which cause its output to not perfectly match the URANS results. Thus, each subsequent row is influenced by the altered inflow conditions from the previous row and its own calibration accuracy. This effect, however small, accumulates as the flow progresses downstream. Despite this, the Body Force calculation at the downstream station of the last stator shows a relative flow angle error of less than 1.5 % compared to the URANS reference case. It can also be observed, from the total temperature plot of Figure 14, that the distorted sector shifts along the direction imposed by the rotation of the machine [46], which is oriented from 0 to 360 
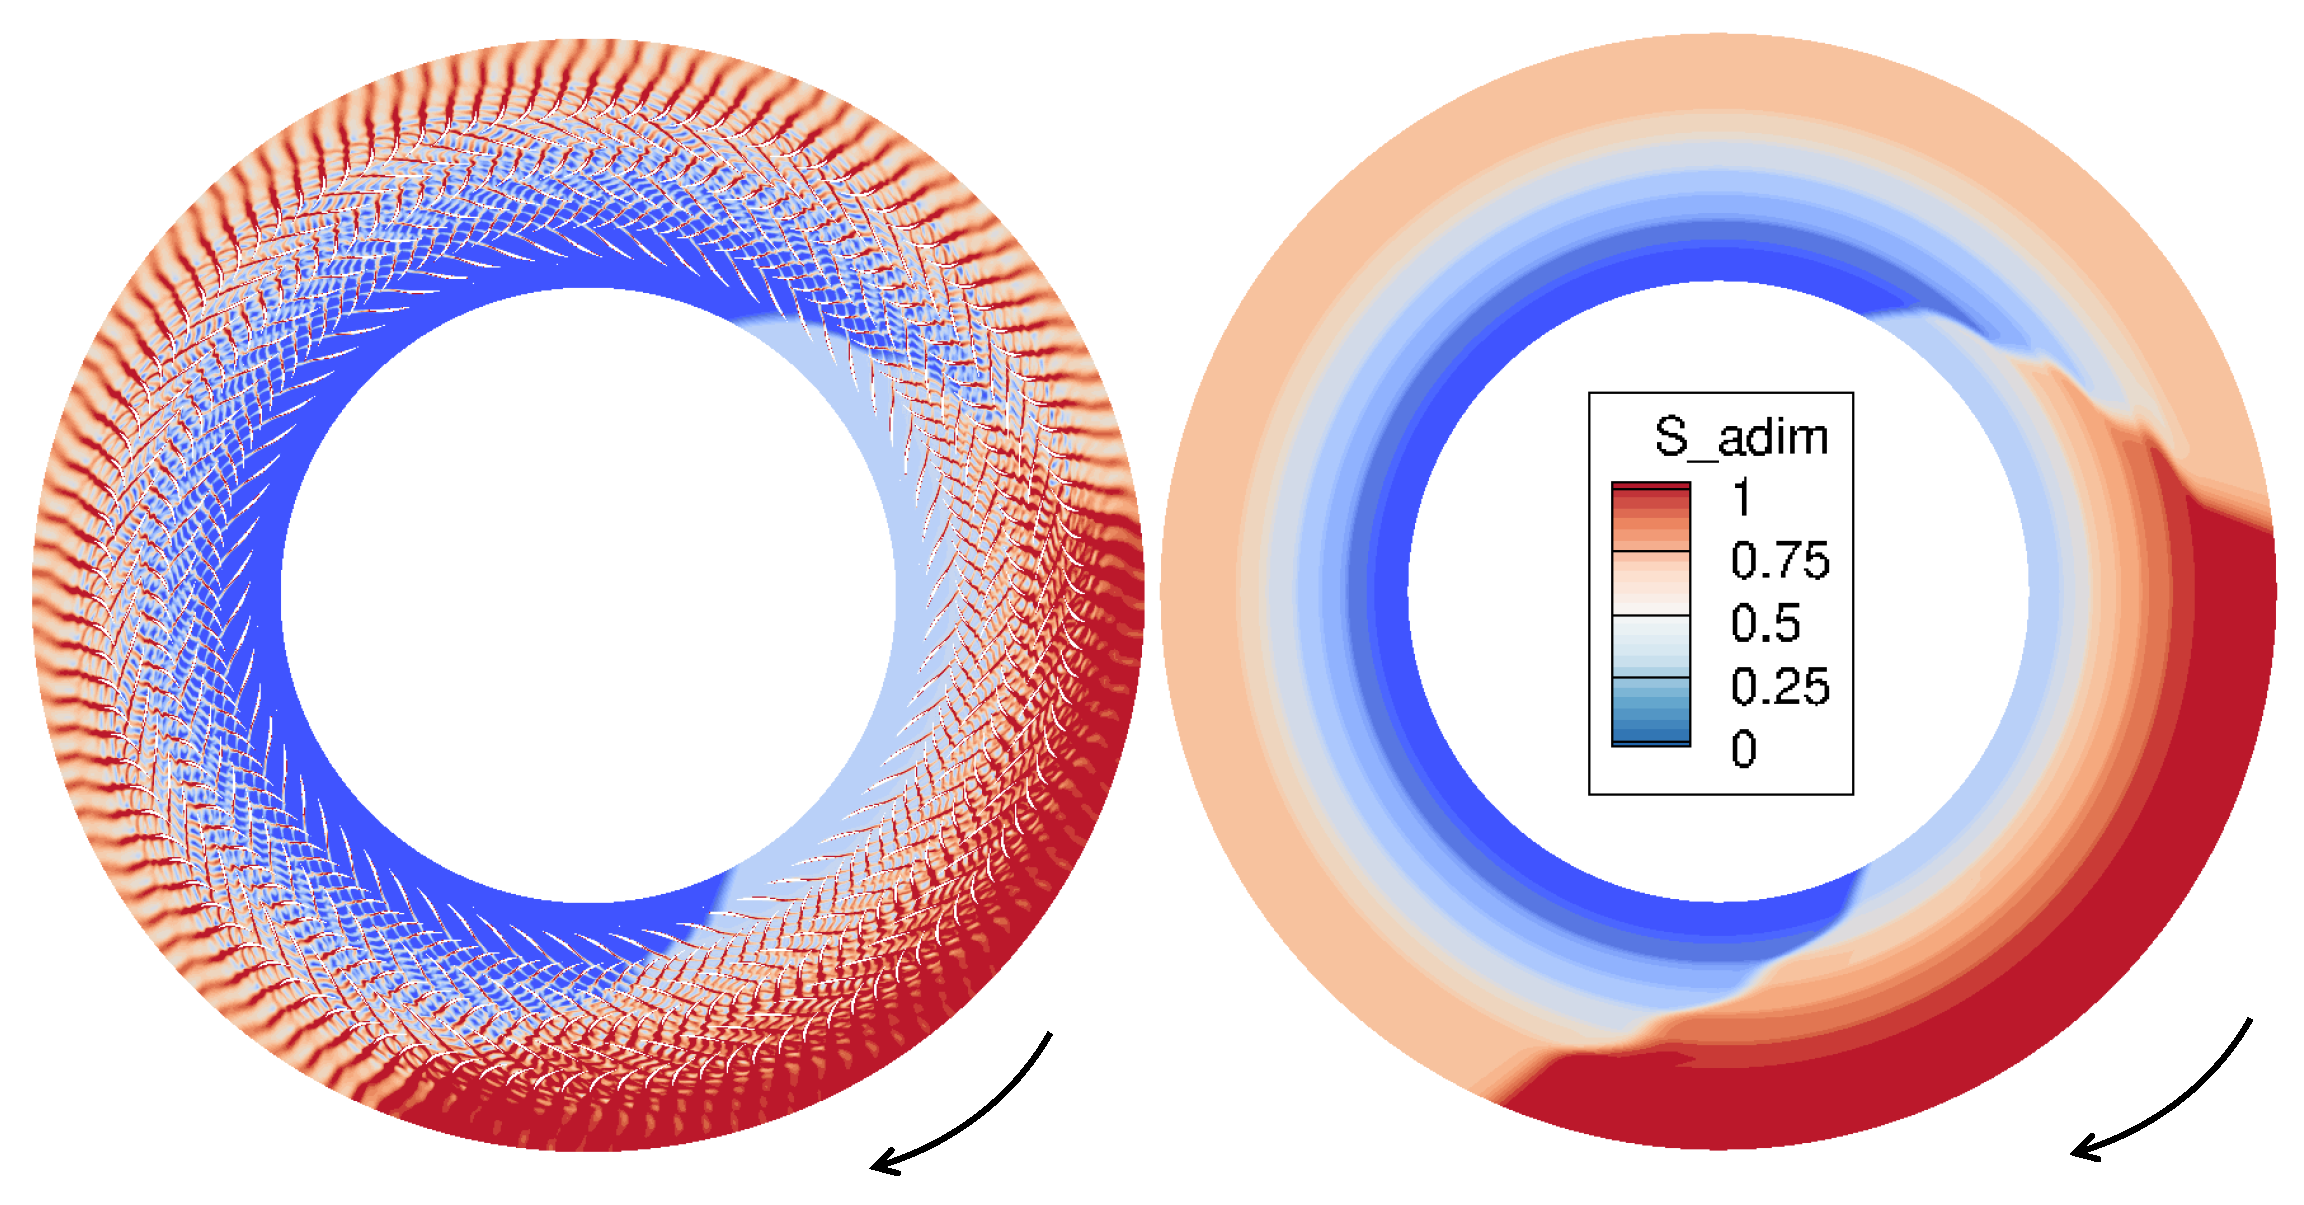
in this case. This can be clearly visualised in Figure 16 too, where a visualisation of the entropy flow field, from the outlet to the inlet of the machine (the axial direction coming out of the page), allows to appreciate this phenomenon. The figure allows to visualise the shift of the distortion window in the machine along the direction of the shaft speed, as well as the comparable order of magnitudes of the bladed URANS solution and the BF solution, both inside and outside the distorted region.
Again, results prove to be in very good agreement with the bladed URANS simulations performed as reference.

5.3.2. Stability Study Under Circumferential Distortion

An evaluation of the stability of the compressor under circumferential inlet distortion is here undertaken for both the nominal (NP) and near stall (NS) operating point. Two stability criteria are employed to evaluate how the injected distortion affects the compressor stability margins and whether or not the studied cases reach critical conditions.
The first parameter is the De Haller number [47], defined in Equation (3).
D H = W 2 W 1
W 1 and W 2 are the velocities at the inlet and outlet of each row, in its reference frame. This parameter is a simple measure of diffusion through a compressor blade row, such that if D H < 0.72 the row is more prone to instability [48].
The second parameter is the Lieblein diffusion factor [49], which can be calculated as shown in Equation (4).
D L I = 1 W 2 W 1 + Δ W θ 2 σ W 1
It includes W 1 and W 2 as in D H , as well as the difference of inlet and outlet tangential velocities in the row reference frame ( Δ W θ ) and the row solidity, expressed as the blade chord divided by the pitch, ( σ = c / ( 2 π R / N ) ). The tangential velocity term introduces an additional information, imposing a limit on the effort made by the row to modify the flow tangential velocity, in order to maintain a stable flow. Lieblein suggests that losses increase rapidly for D L I > 0.6 [48].
Given that the appropriate limits for D H and D L I can be case-dependent [50], the stability criteria for those two diffusion parameters are here derived from the full-height single-blade passage case, at the near stall operating point with clean inlet: the limit values for D H and D L I are extracted from the critical row ( S 3 ), in the central region of the flow (i.e., excluding near-wall effects). Thus, the limit values obtained are D H l i m = 0.52 and D L I l i m = 0.64 . For the P2D configuration, values below D H l i m or above D L I l i m will be considered as zones of operation where stability issues can occur.
The values of D H and D L I have been investigated for the rotors (R) and stators (S) of each compressor stage (1, 2, or 3). 
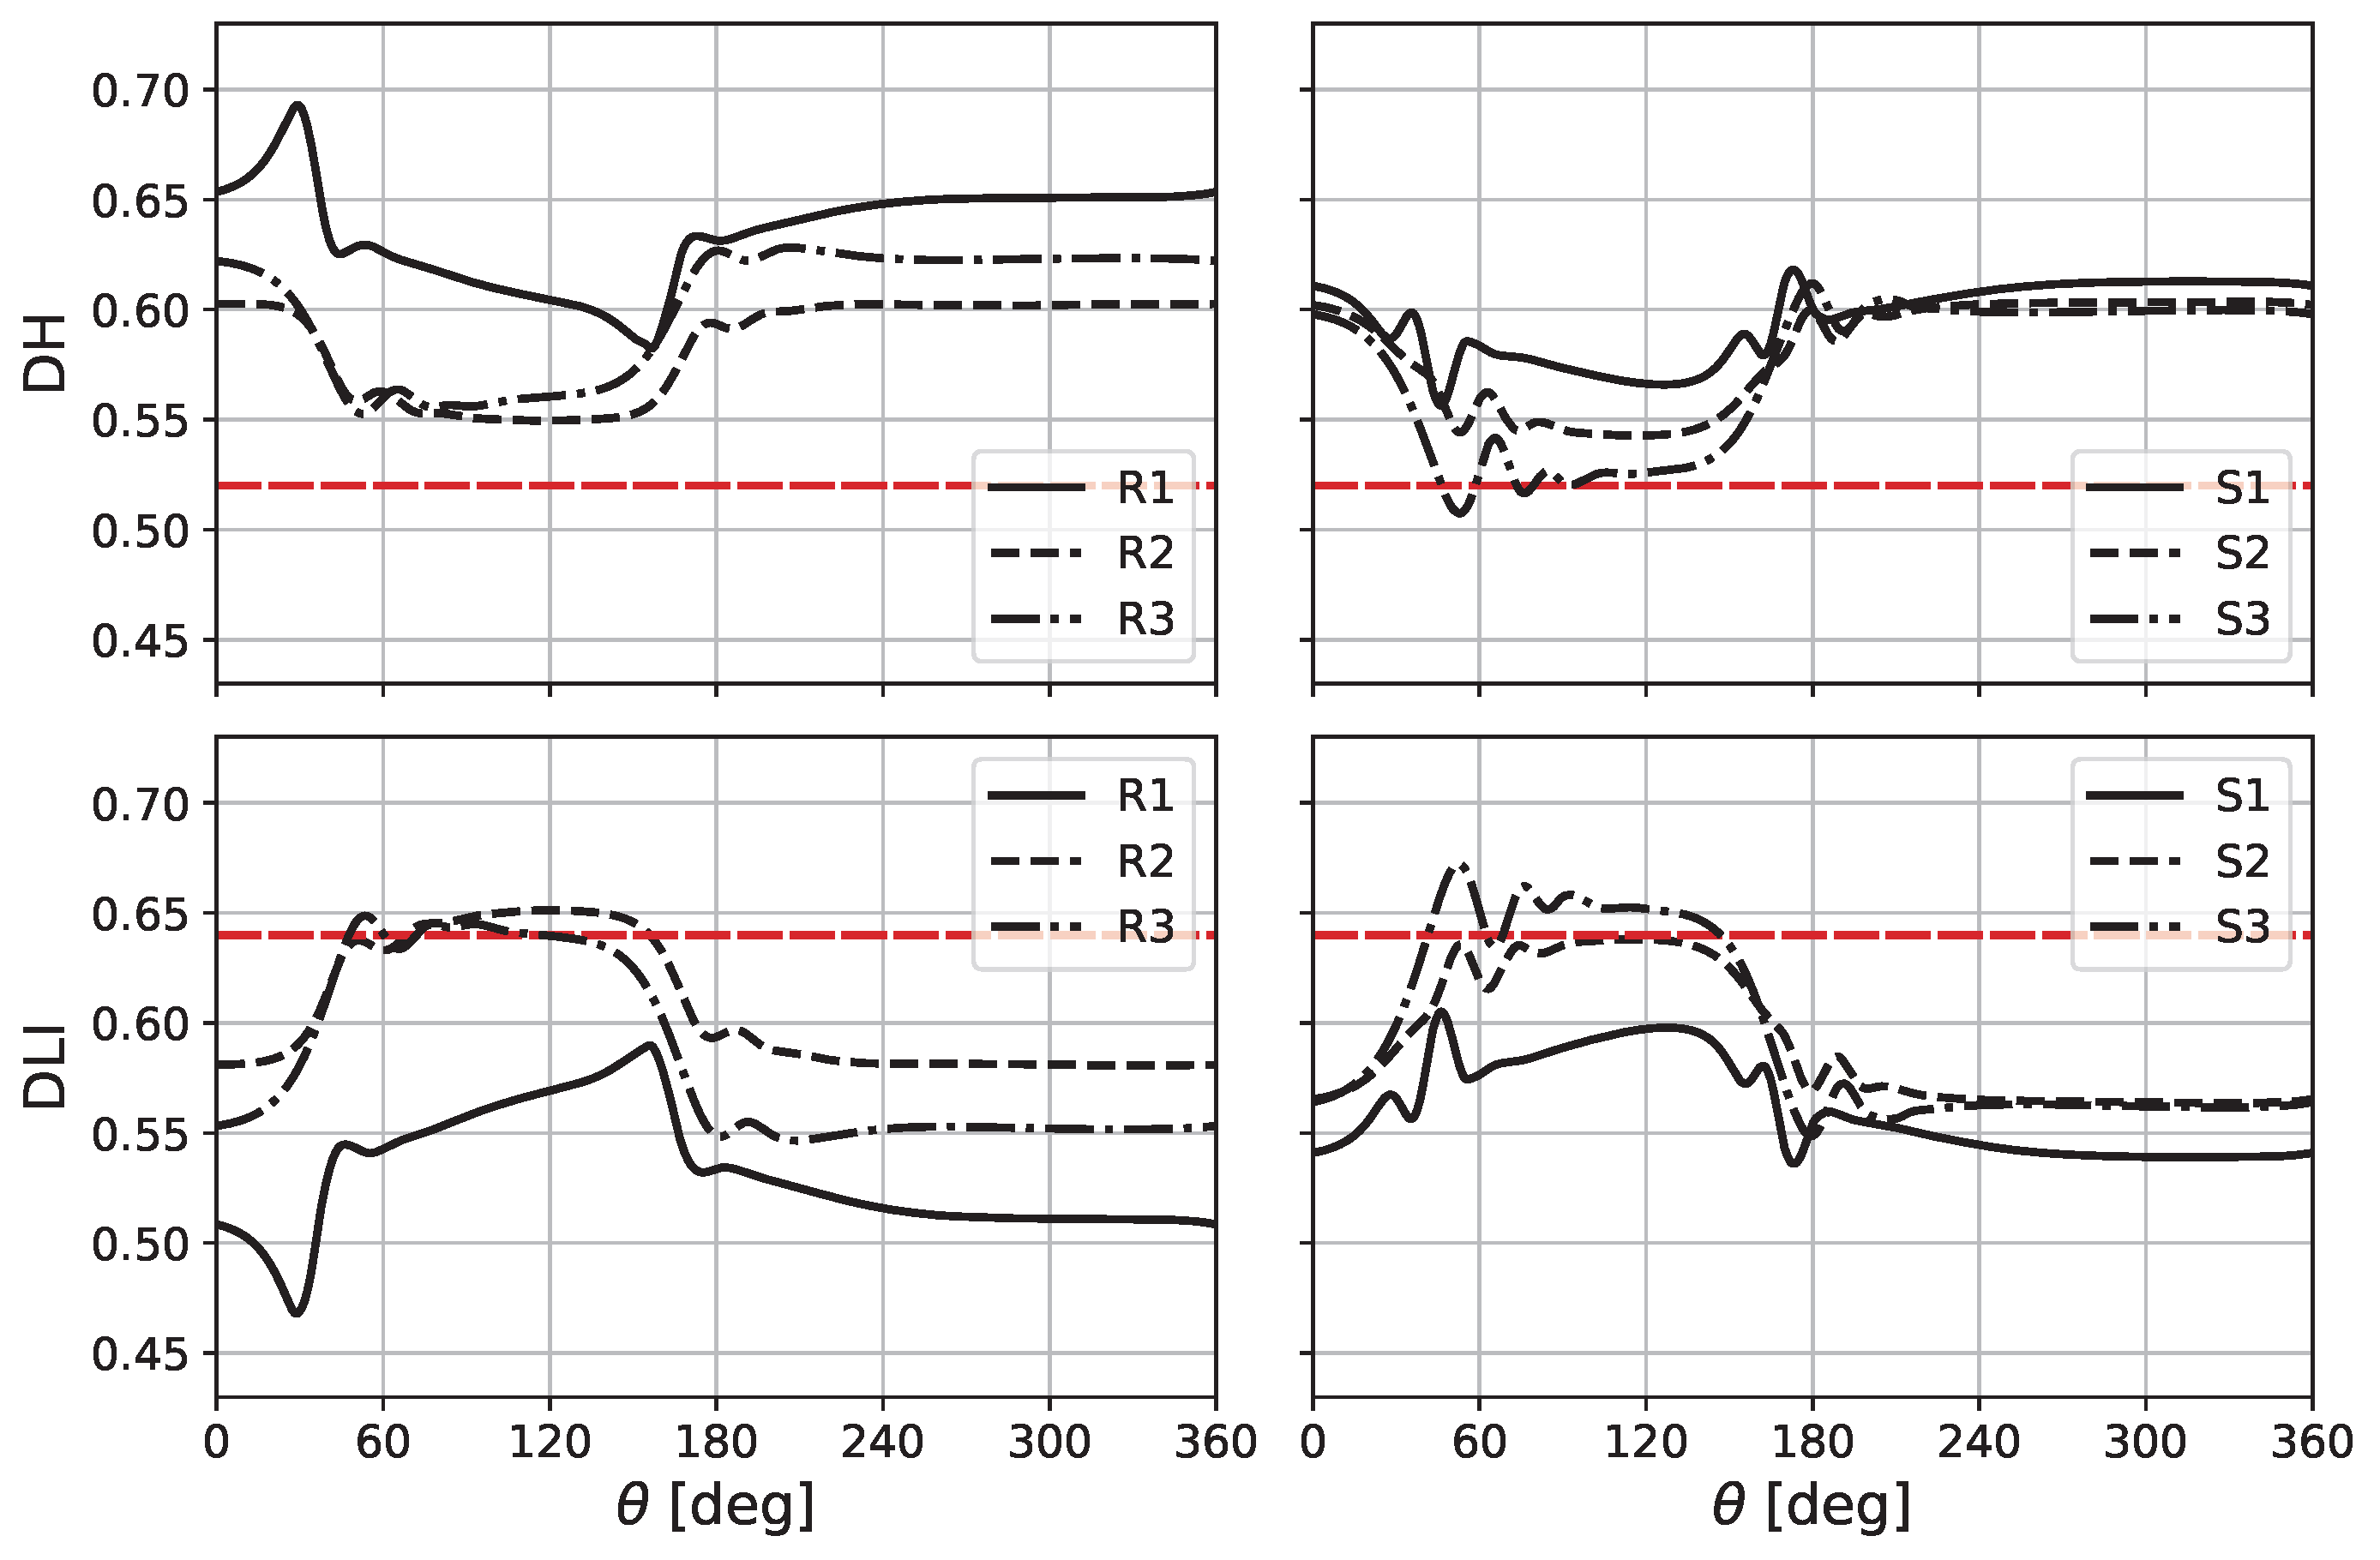
Figure 17 depicts these results for the most critical conditions, 10 % distortion at the near stall operating point, with the Body Force approach. The data clearly show that for both the D H and D L I stability criteria, the last stator ( S 3 ) is the row that is most critical under distortion in terms of stability margins. This row is thus analysed in more detail in 
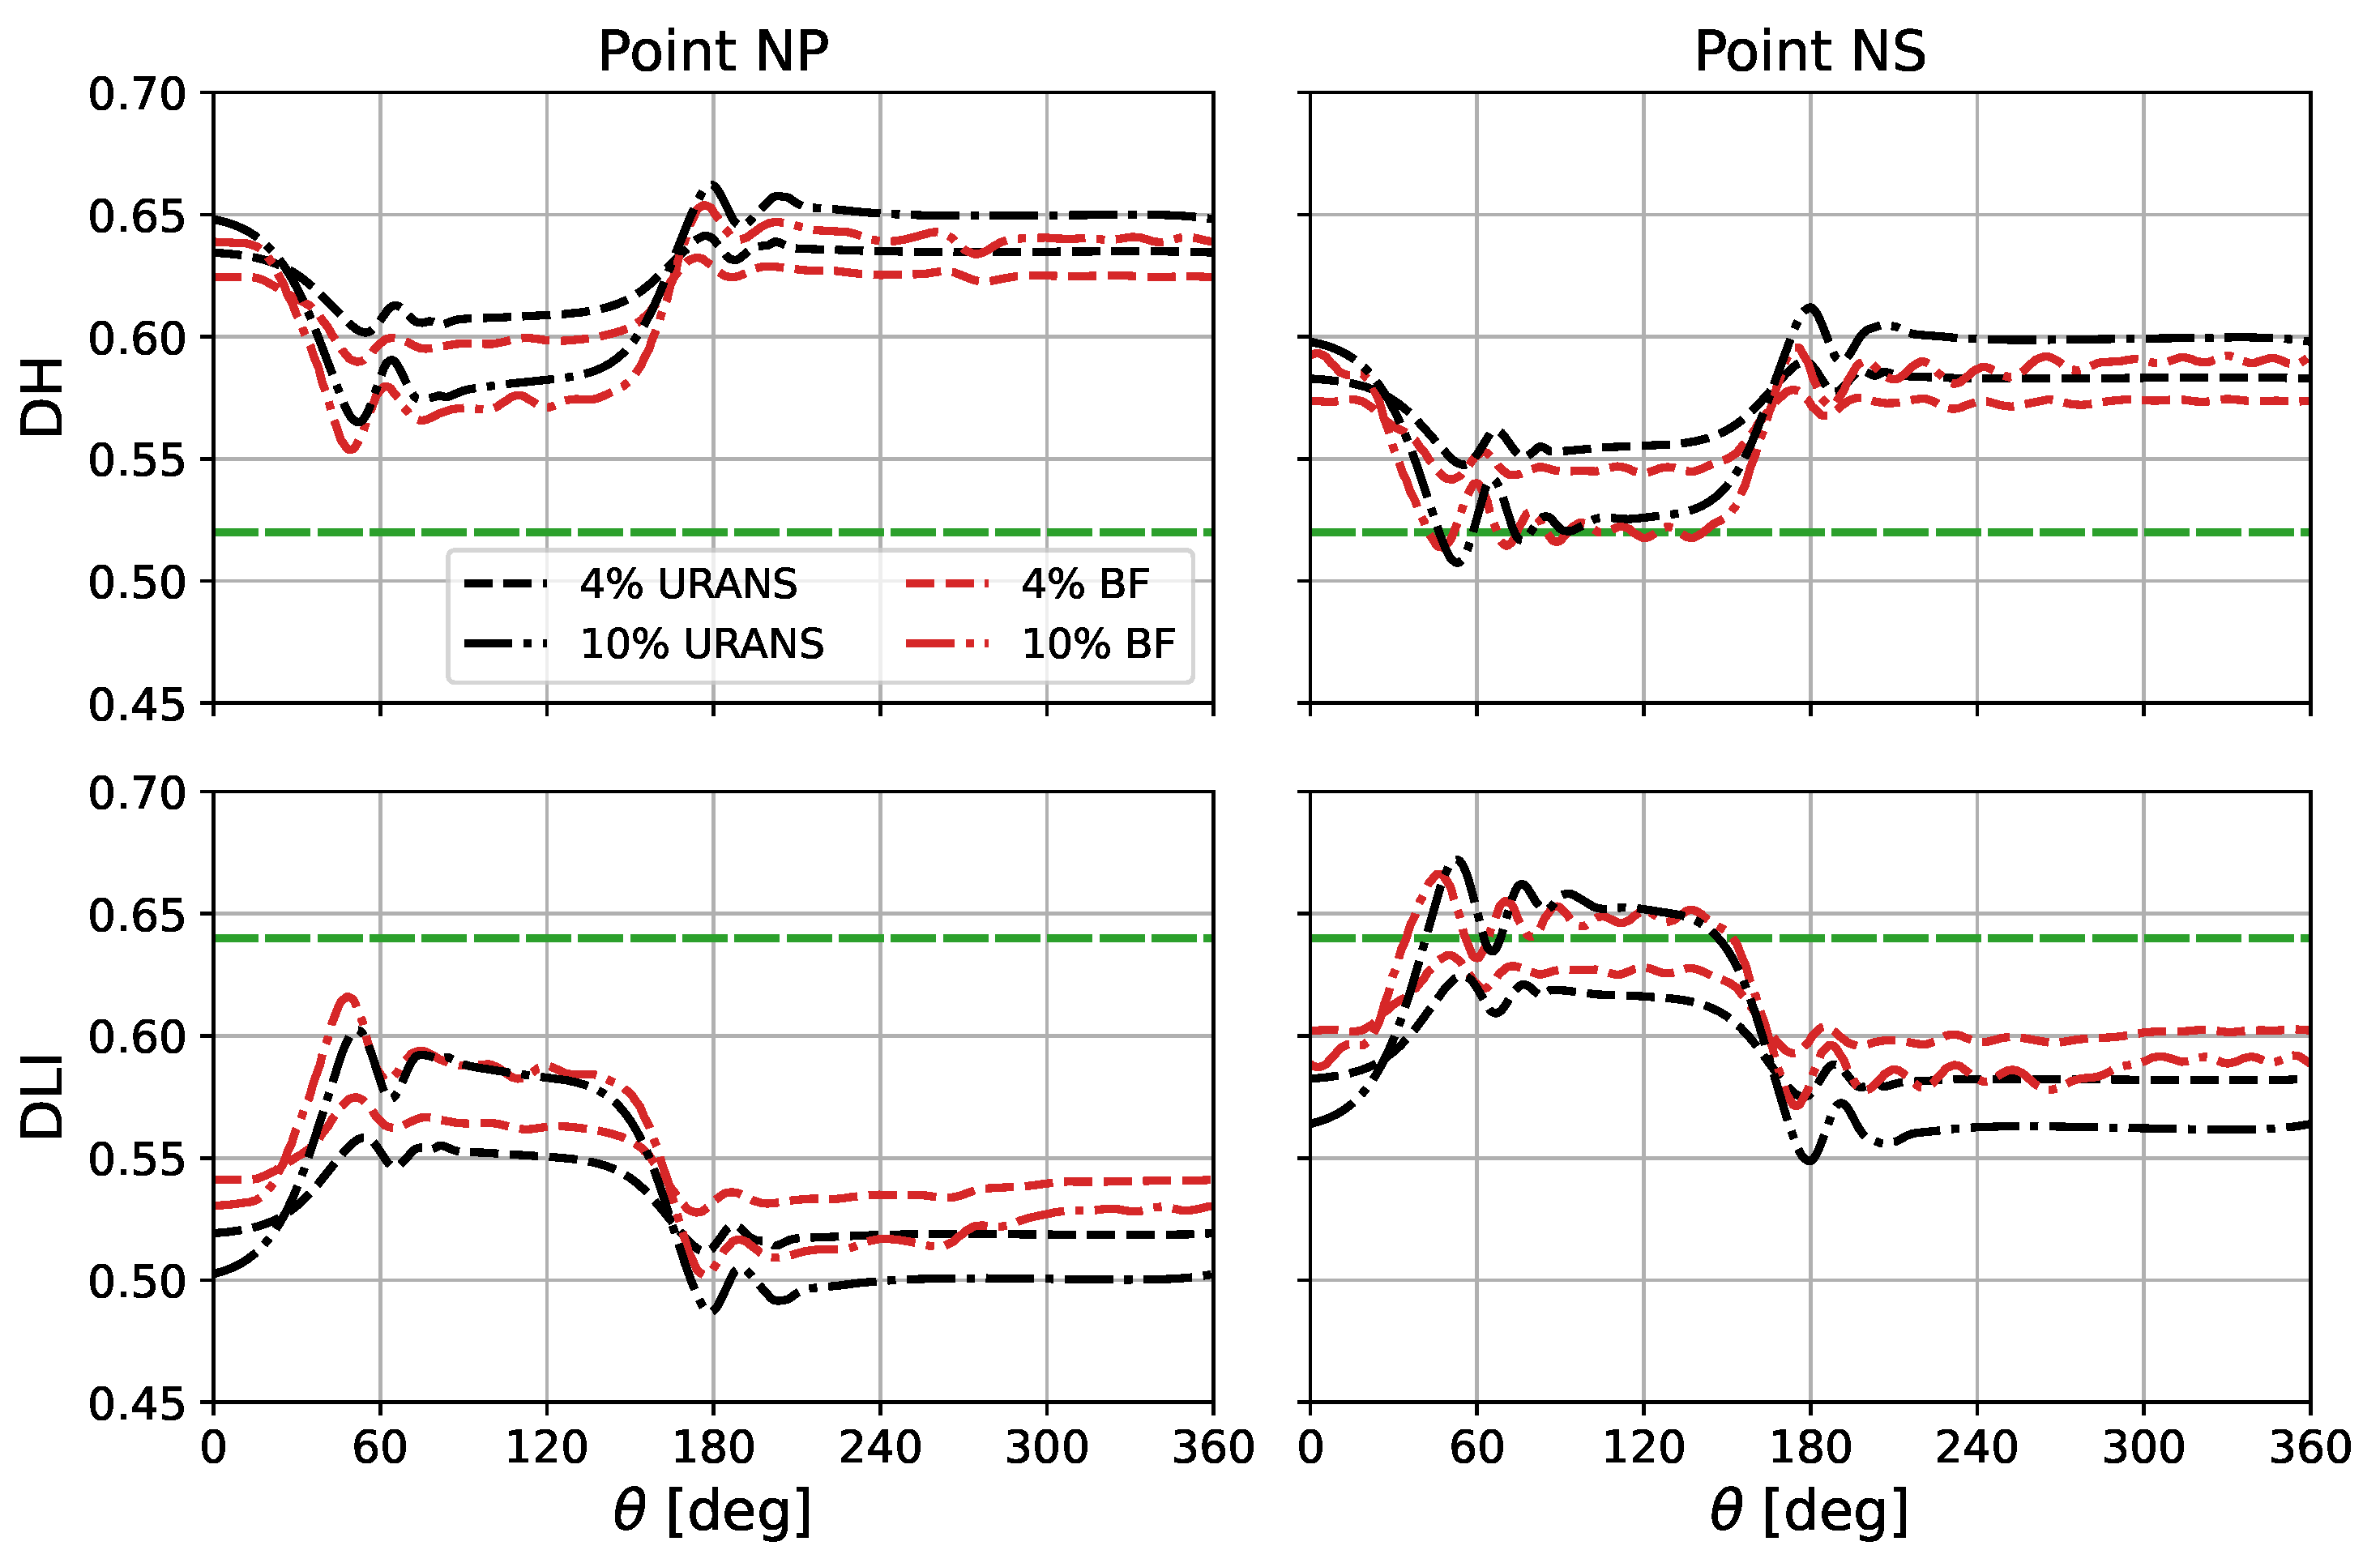
Figure 18 where the values of D H and D L I are depicted for the two distortion cases, for both the URANS and the Body Force approaches at the nominal and near stall operating points.
In Figure 18, it is shown that imposing a total pressure distortion directly impacts the stability of the compressor, degrading the stability margin of the machine. Moreover, as the distortion intensity increases, D H further decreases, reflecting higher diffusion in the stator and thus a higher risk of flow separation and instabilities. Simultaneously, D L I rises, indicating that the stator is required to exert more effort in correcting the flow, further exacerbating the instability risk.
In the distorted region, it is found that D H and D L I degrade by 3–5% for the 4 % distortion case, and by 9–11% for the 10 % distortion case, with respect to the clean inlet condition. Furthermore, the region with reduced stability margins extends to 120 , creating a large region of possible instability, that could eventually cause the failure of the compressor.
This degradation in stability margin does not prove to be critical at the nominal operating point where row S 3 , and consequently the other rows, never reach the D H and D L I limits, showing a stable behaviour even in presence of distortion. However, at the near-stall operating point, both D H and D L I highlight a critical flow region at row S 3 for the 10 % distortion case, indicating the possible onset of instabilities.
The predictions of the Body Force and the URANS approaches show good agreement, with a slight tendency of the first to underestimate the stall margin. For instance, at the nominal operating point, it predicts D H and D L I with, respectively, 0.81 and 0.50 percentage points of difference with respect to the URANS approach for the 4 % distortion case. The differences are of 1.46 and 0.97 percentage points for the 10 % distortion case.
This agreement in the results allows to draw reliable conclusion from the exclusive analysis of the Body Force results, such as the selection of the most critical row from Figure 17. Moreover, the model’s conservative tendency to predict instability slightly earlier than the URANS approach makes it a valuable tool for preliminary design, helping to exclude unsuitable operating points for the compressor.
Globally, both approaches effectively assess the degradation of stability margins, with the Body Force model providing results that are qualitatively and quantitatively comparable to those obtained from URANS simulations.

6. Conclusions

In this work, a 3D body force model, based on the parallel and normal force representation, is adopted and modified for multi-stage high-pressure compressors modelling. In particular, a new calibration of the model coefficients is developed, based on the idea of adjusting the aerodynamic response of the model through simple lift, drag, and friction coefficients. Then, a local radial correction of the normal force is implemented, in order to maintain a physically consistent behaviour of the model in the endwalls region. The model is applied to the 3-stage compressor CREATE for three study cases: a first one to calibrate and validate the model, a second and a third one to study a radial and a circumferential inlet distortion, respectively. It has been found that:
(1)
The calibration of the model’s coefficients allows to improve the prediction of the losses on complex configuration, such as a multi-stage high-pressure compressor. With few calibration iterations, it allows to remarkably reduce errors on the machine performance, e.g., total pressure ratio error at nominal point is reduced from 10 % to 0.5 % with respect to bladed simulations.
(2)
Endwall corrections, using force clipping near the walls, allow to better reproduce the flow behaviour near the shroud and hub walls, while making the model more robust towards numerical separations, that would otherwise occur when approaching the surge limit.
(3)
The complete modified model, without any additional modifications to the calibrated coefficients, reacts in very good agreement with the bladed simulations in the presence of radial distortion. It provides the correct trend and order of magnitude of the distortion transfer for both the total pressure and total temperature. The model is also capable of reproducing local flow properties.
(4)
Circumferential distortion impact on performance is also very well predicted, without any additional modifications to the calibrated coefficients between the clean and distorted case. Again, the model is capable of reproducing local flow properties for different intensities of distortion. A 10 % total pressure deficit results in a maximal error of 0.5 % among the total pressure, total temperature and entropy predictions, with respect to bladed simulations.
(5)
The gain in computation cost when employing the current Body Force model is considerable. In terms of CPU time, the radial distortion case requires almost 3300 times more to be run with the bladed URANS modelling, compared to the Body Force modelling.
(6)
Two criteria have been employed to study the stability of the compressor under circumferential distortion at the nominal and near stall operating points. The Body Force results are in good agreement with the URANS calculations and predict the degradation of stability margin both qualitatively and quantitatively.
Overall, the presented model proves to be of great interest for the study of inlet distortion in multi-stage compressors.
Future developments would focus on three subjects: the calibration of the corrective coefficients in the model, the evaluation of the operability of the machine under inlet distortion and the addition of physical effects in the model. As regards the calibration, an automatised process would ease the preparatory work required for its use and allow for its exploitation at an industrial level. Moreover, it would be useful to identify physical-based correlations allowing to adapt the corrective coefficients. In terms of operability, an investigation of the behaviour of the machine under inlet distortion for operating points that are closer to the stability limit, as well as the study of the onset of instability effects with the current model, would be of interest. Finally, to enrich the physical representativeness of the model, future work will focus on the inclusion of transsonic effects in the model.

Author Contributions

Conceptualization, C.C., J.M., R.B., S.C. and G.D.; methodology, C.C., J.M., R.B. and G.D.; validation, C.C.; formal analysis, C.C.; investigation, C.C.; writing—original draft preparation, C.C.; writing—review and editing, C.C., J.M., R.B., S.C. and G.D.; supervision, J.M., R.B., S.C. and G.D. All authors have read and agreed to the published version of the manuscript.

Funding

This research was funded by Safran Aircraft Engines and ANRT (Associtation Nationale de la Recherche et de la Technologie) through the CIFRE PhD thesis n.2022/1832.

Data Availability Statement

The original contributions presented in this study are included in the article. Further inquiries can be directed to the corresponding author(s).

Acknowledgments

The authors wish to acknowledge Thomas Bontemps for providing the base code for Body Force calculations, which served as a valuable resource for this work, and for the assistance in its adaptation for the purposes of this study.

Conflicts of Interest

Chiara Crea and Sébastien Cochon were employed by the company Safran Aircraft Engines. The remaining authors declare that the research was conducted in the absence of any commercial or financial relationships that could be construed as a potential conflict of interest.

Abbreviations

Acronyms
BFBody Force
CFDComputational Fluid Dynamics
DHDe Haller number
DLILieblein diffusion factor
IBMSGImmersed Boundary Method with Smeared Geometry
NPNominal operating point
NSNear Stall operating point
P2DPseudo-2D configuration
RANSReynolds-Averaged Navier–Stokes
SBPSingle Blade Passage configuration
URANS          Unsteady Reynolds-Averaged Navier–Stokes
Variables
α Absolute flow angle
δ Local deviation angle
η i s Isentropic efficiency
ω Rotational speed
Π t t Total temperature ratio
π t t Total-to-total pressure ratio
π s t Total-to-static pressure ratio
bMetal blockage
C L , C D , C f Lift, drag, and friction coefficient
f n , f p Normal and parallel force
gGeneric quantity
K D Calibration coefficient in the off-design term of the parallel force
K f Calibration coefficient in the first term of the parallel force
K m a c h Compressibility correction
K n Calibration coefficient in the normal force
nNormal direction
P t , P T Total pressure
Q c o r r Massflow corrected by row/stage inlet conditions
rRadius
R e x Local Reynolds number
SEntropy
sLocal blade pitch
T C P U Computational CPU time
T t , T T Total temperature
VAbsolute flow velocity
WRelative flow velocity
Subscripts
0Relative to inlet conditions or a scalar reference value
a d i m Non-dimensionalised
d i s t Relative to the distorted inlet case
x , r , θ Cylindrical coordinates
Superscripts
η m a x Maximal efficiency point
p i v o t Pivot point

References

  1. Lucas, J.R.; O’Brien, W.F.; Ferrar, A.M. Effect of BLI–Type Inlet Distortion on Turbofan Engine Performance. In Proceedings of the ASME Turbo Expo 2014: Turbine Technical Conference and Exposition, Volume 1A: Aircraft Engine; Fans and Blowers, Düsseldorf, Germany, 16–20 June 2014. [Google Scholar]
  2. Marty, J.; Barrier, R.; Garnier, E. Impact of distortions due to separation in S-duct inlet on compressor stage behavior and performances. In Proceedings of the 23rd AIAA Computational Fluid Dynamics Conference, Denver, CO, USA, 5–9 June 2017. [Google Scholar] [CrossRef]
  3. Harjes, L.; Bode, C.; Grubert, J.; Frantzheld, P.; Koch, P.; Friedrichs, J. Investigation of jet engine intake distortions caused by crosswind conditions. J. Glob. Power Propuls. Soc. 2020, 4, 48–62. [Google Scholar] [CrossRef]
  4. Cravero, C.; Marsano, D.; Sishtla, V.; Halbe, C.; Cousins, W.T. Numerical investigations of near surge operating conditions in a two-stage radial compressor with refrigerant gas. J. Eng. Gas Turbines Power 2024, 146. [Google Scholar] [CrossRef]
  5. Dong, X.; Sun, D.; Li, F.; Sun, X. Stall margin enhancement of a novel casing treatment subjected to circumferential pressure distortion. Aerosp. Sci. Technol. 2018, 73, 239–255. [Google Scholar] [CrossRef]
  6. Xu, D.; He, C.; Sun, D.; Sun, X. Stall inception prediction of axial compressors with radial inlet distortions. Aerosp. Sci. Technol. 2021, 109, 106433. [Google Scholar] [CrossRef]
  7. Mazzawy, R.S. Multiple Segment Parallel Compressor Model for Circumferential Flow Distortion. J. Eng. Power 1977, 99, 288–296. [Google Scholar] [CrossRef]
  8. Davis, M.W.; Cousins, W.T. Evaluating Complex Inlet Distortion with a Parallel Compressor Model: Part 2—Applications to Complex Patterns. In Proceedings of the ASME 2011 Turbo Expo: Turbine Technical Conference and Exposition, Volume 1: Aircraft Engine; Ceramics; Coal, Biomass and Alternative Fuels; Wind Turbine Technology, Vancouver, BC, Canada, 6–10 June 2011; pp. 13–23. [Google Scholar] [CrossRef]
  9. Joo, W.G.; Hynes, T.P. The Simulation of Turbomachinery Blade Rows in Asymmetric Flow Using Actuator Disks. J. Turbomach. 1997, 119, 723–732. [Google Scholar] [CrossRef]
  10. Hawthorne, W.R.; Mitchell, N.A.; McCune, J.E.; Tan, C.S. Nonaxisymmetric Flow through Annular Actuator Disks: Inlet Distortion Problem. J. Eng. Power 1978, 100, 604–617. [Google Scholar] [CrossRef]
  11. Liu, A.; Ju, Y.; Zhang, C.; Dai, R. Parallel steady/unsteady flow simulations of an 8.5-stage axial compressor. Aerosp. Sci. Technol. 2024, 145, 108853. [Google Scholar] [CrossRef]
  12. Burberi, C.; Michelassi, V.; Scotti Del Greco, A.; Lorusso, S.; Tapinassi, L.; Marconcini, M.; Pacciani, R. Validation of steady and unsteady CFD strategies in the design of axial compressors for gas turbine engines. Aerosp. Sci. Technol. 2020, 107, 106307. [Google Scholar] [CrossRef]
  13. Cozzi, L.; Rubechini, F.; Giovannini, M.; Marconcini, M.; Arnone, A.; Schneider, A.; Astrua, P. Capturing Radial Mixing in Axial Compressors With Computational Fluid Dynamics. J. Turbomach. 2019, 141, 031012. [Google Scholar] [CrossRef]
  14. Marble, F.E. Three-Dimensional Flow in Turbomachines. In Aerodynamics of Turbines and Compressors; Princeton University Press: Princeton, NJ, USA, 1964; Volume 10, pp. 83–166. [Google Scholar]
  15. Gong, Y. A Computational Model for Rotating Stall and Inlet Distortions in Multistage Compressors. Ph.D. Thesis, Massachusetts Institute of Technology, Cambridge, MA, USA, 1999. [Google Scholar]
  16. Hall, D.K. Analysis of Civil Aircraft Propulsors with Boundary Layer Ingestion. Ph.D. Thesis, Massachusetts Institute of Technology, Cambridge, MA, USA, 2015. [Google Scholar]
  17. Li, Z.; Sun, D.; Dong, X.; Sun, X. A review on aero-engine inlet-compressor integration and inlet flow distortion in axial compressors. Fundam. Res. 2024; In Press. [Google Scholar] [CrossRef]
  18. Thollet, W.; Dufour, G.; Carbonneau, X.; Blanc, F. Assessment of Body Force Methodologies for the Analysis of Intake-Fan Aerodynamic Interactions. In Proceedings of the ASME Turbo Expo 2016: Turbomachinery Technical Conference and Exposition, Volume 2C: Turbomachinery, Seoul, South Korea, 13–17 June 2016. [Google Scholar] [CrossRef]
  19. Awes, A.; Dufour, G.; Daon, R.; Marty, J.; Barrier, R.; Carbonneau, X. Unsteady Body Force Methodology for Fan Operability Assessment under Clean and Distorted Inflow Conditions. In Proceedings of the AIAA Scitech 2021 Forum, Virtual Event, 11–15 and 19–21 January 2021. [Google Scholar] [CrossRef]
  20. Godard, B.; Ben Nasr, N.; Barrier, R.; Marty, J.; Gourdain, N.; De Jaeghere, E. Methodologies for Turbofan Inlet Aerodynamics Prediction. In Proceedings of the 35th AIAA Applied Aerodynamics Conference, Denver, CO, USA, 5–9 June 2017. [Google Scholar] [CrossRef]
  21. Martinez, L.; Leonardi, S.; Churchfield, M.; Moriarty, P. A comparison of actuator disk and actuator line wind turbine models and best practices for their use. In Proceedings of the 50th AIAA Aerospace Sciences Meeting including the New Horizons Forum and Aerospace Exposition, Nashville, TN, USA, 9–12 January 2012; p. 900. [Google Scholar]
  22. Pantel, H.; Falissard, F.; Dufour, G. Assessment of Reynolds-Averaged Navier–Stokes/Blade Element Theory Body Force Method for Propeller Modeling. AIAA J. 2024, 62, 758–775. [Google Scholar] [CrossRef]
  23. Spurr, A. The prediction of 3D transonic flow in turbomachinery using a combined throughflow and blade-to-blade time marching method. Int. J. Heat Fluid Flow 1980, 2, 189–199. [Google Scholar] [CrossRef]
  24. Baralon, S.; Hall, U.; Eriksson, L.E. Viscous throughflow modelling of transonic compressors using a time-marching finite volume solver. In Proceedings of the ISABE-13th International Symposium on Air Breathing Engines, Chattanooga, TN, USA, 7–12 September 1997; pp. 502–510. [Google Scholar]
  25. Simon, J.F. Contribution to Throughflow Modelling for Axial Flow Turbomachines. Ph.D. Thesis, Université de Liege, Liège, Belgium, 2007. [Google Scholar]
  26. Cao, T.; Hield, P.; Tucker, P.G. Hierarchical immersed boundary method with smeared geometry. J. Propuls. Power 2017, 33, 1151–1163. [Google Scholar] [CrossRef]
  27. Watson, R.; Cui, J.; Ma, Y.; Tyacke, J.; Vadlamani, N.R.; Alam, M.F.; Dai, Y.; Tucker, P.G.; Cao, T.; Hield, P.; et al. Improved hierarchical modelling for aerodynamically coupled systems. In Proceedings of the Turbo Expo: Power for Land, Sea, and Air, Charlotte, NC, USA, 26–30 June 2017; American Society of Mechanical Engineers: New York, NY, USA, 2017; Volume 50794. [Google Scholar]
  28. Thollet, W. Body Force Modeling of Fan-Airframe Interactions. Ph.D. Thesis, ISAE-SUPAERO, Toulouse, France, 2017. [Google Scholar]
  29. Magrini, A. Body Force Model Implementation of Transonic Rotor for Fan/Airframe Simulations. Aerospace 2022, 9, 725. [Google Scholar] [CrossRef]
  30. Hill, D.J.; Defoe, J.J. Innovations in Body Force Modeling of Transonic Compressor Blade Rows. Int. J. Rotating Mach. 2018, 2018, 6398501. [Google Scholar] [CrossRef]
  31. Guo, J.; Hu, J. A three-dimensional computational model for inlet distortion in fan and compressor. Proc. Inst. Mech. Eng. Part A J. Power Energy 2018, 232, 144–156. [Google Scholar] [CrossRef]
  32. Crea, C.; Marty, J.; Barrier, R.; Cochon, S.; Dufour, G. Body Force Modelling of a Multi-Stage High-Pressure Compressor Under Inlet Distortion. In Proceedings of the 16th European Turbomachinery Conference, Hannover, Germany, 24–28 March 2025; European Turbomachinery Society: Hannover, Germany, 2025. [Google Scholar]
  33. Peters, A. Ultra-Short Nacelles for Low Fan Pressure Ratio Propulsors. Ph.D. Thesis, Massachusetts Institute of Technology, Cambridge, MA, USA, 2014. [Google Scholar]
  34. Gallimore, S.J. Viscous Throughflow Modeling of Axial Compressor Bladerows Using a Tangential Blade Force Hypothesis. J. Turbomach. 1998, 120, 662–670. [Google Scholar] [CrossRef]
  35. Ottavy, X.; Courtiade, N.; Gourdain, N. Experimental and computational methods for flow investigation in high-speed multistage compressor. J. Propuls. Power 2012, 28, 1141–1155. [Google Scholar] [CrossRef]
  36. Courtiade, N.; Ottavy, X. Experimental study of surge precursors in a high-speed multistage compressor. In Proceedings of the Turbo Expo: Power for Land, Sea, and Air, Copenhagen, Denmark, 11–15 June 2012; American Society of Mechanical Engineers: New York, NY, USA, 2012; Volume 44748, pp. 2417–2426. [Google Scholar]
  37. Gourdain, N.; Ottavy, X.; Vouillarmet, A. Experimental and numerical investigation of unsteady flows in a high speed three stages compressor. In Proceedings of the 8th European Turbomachinery Conference, Graz, Austria, 23–27 March 2009. [Google Scholar]
  38. Schreiber, J. Investigation of Experimental and Numerical Methods, and Analysis of Stator Clocking and Instabilities in a High-Speed Multistage Compressor. Ph.D. Thesis, Université de Lyon, Lyon, France, 2016. [Google Scholar]
  39. Cambier, L.; Heib, S.; Plot, S. The Onera elsA CFD Software: Input from Research and Feedback from Industry. Mech. Ind. 2013, 14, 159–174. [Google Scholar] [CrossRef]
  40. Smith, B. A near wall model for the k - l two equation turbulence model. In Proceedings of the Fluid Dynamics Conference, Colorado Springs, CO, USA, 20–23 June 1994. [Google Scholar] [CrossRef]
  41. Kravtsoff, F.; Schvallinger, M.; Ottavy, X. A CFD-Based Throughflow Solver Using Cascade Potential Theory for Axial Compressor Flow Modeling. In Proceedings of the Volume 13C: Turbomachinery—Deposition, Erosion, Fouling, and Icing; Design Methods and CFD Modeling for Turbomachinery; Ducts, Noise, and Component Interactions, Boston, MA, USA, 26–30 June 2023. [Google Scholar] [CrossRef]
  42. Roe, P. Approximate Riemann solvers, parameter vectors, and difference schemes. J. Comput. Phys. 1981, 43, 357–372. [Google Scholar] [CrossRef]
  43. van Albada, G.D.; Van Leer, B.; Roberts, W., Jr. A comparative study of computational methods in cosmic gas dynamics. Astron. Astrophys. 1982, 108, 76–84. [Google Scholar]
  44. Gear, C.W. The numerical integration of ordinary differential equations. Math. Comput. 1967, 21, 146–156. [Google Scholar] [CrossRef]
  45. Longley, J.P. Measured and Predicted Effects of Inlet Distortion on Axial Compressors; Turbomachinery; American Society of Mechanical Engineers: New York, NY, USA, 1990; Volume 1. [Google Scholar] [CrossRef]
  46. Guo, J.; Hu, J. Development of body force model for steady inlet distortions in high-speed multistage compressor. Proc. Inst. Mech. Eng. Part G J. Aerosp. Eng. 2017, 231, 1650–1659. [Google Scholar] [CrossRef]
  47. De Haller, P. Das verhalten von tragflügelgittern in axialverdichtern und im windkanal. Brennstoff-Wärme-Kraft (BWK) 1953, 5, 24. [Google Scholar]
  48. Dixon, S.L.; Hall, C. Fluid Mechanics and Thermodynamics of Turbomachinery; Butterworth-Heinemann: Oxford, UK, 2013. [Google Scholar]
  49. Lieblein, S.; Johnsen, I.; Bullock, R. Experimental flow in two-dimensional cascades. NACA Res. Memo. 1965, 36, 183. [Google Scholar]
  50. Li, J.; Teng, J.; Ferlauto, M.; Zhu, M.; Qiang, X. An improved stall prediction model for axial compressor stage based on diffuser analogy. Aerosp. Sci. Technol. 2022, 127, 107692. [Google Scholar] [CrossRef]
Figure 1. Normal force field before (lower left) and after (up and lower right) applying endwall corrections.
Ijtpp 10 00012 g001
Figure 2. Flowchart of model establishment and calibration.
Ijtpp 10 00012 g002
Figure 3. Meridional view and planes’ labels for CREATE.
Ijtpp 10 00012 g003
Figure 4. Inlet radial profile of radial total pressure distortion, scaled by the mean total pressure at “Clean Inlet”.
Ijtpp 10 00012 g004
Figure 5. Inlet azimuthal profiles of circumferential total pressure distortion, scaled by the total pressure at “Clean Inlet”.
Ijtpp 10 00012 g005
Figure 6. Mesh details. (Top): meridional view of rows. (Bottom): B2B view of first rotor (left) and first stator (right) at shroud.
Ijtpp 10 00012 g006
Figure 7. Boundary conditions of the full-height (up) and P2D (down) bladed cases. Red: inflow; blue: outflow; green: row interfaces; gray: viscous walls; orange: inviscid walls.
Ijtpp 10 00012 g007
Figure 8. P2D geometry of the BF mesh 2C (left) and the bladed mesh 1C (right).
Ijtpp 10 00012 g008
Figure 9. Total pressure ratio characteristic of the compressor, scaled by the values at RANS SBP point NP.
Ijtpp 10 00012 g009
Figure 10. Isentropic efficiency characteristic of the compressor, scaled by the values at RANS SBP point NP.
Ijtpp 10 00012 g010
Figure 11. 1D Radial evolution of the absolute flow angle α / α 0 (up) and the flow entropy S / S 0 (down) downstream of each rotor.
Ijtpp 10 00012 g011
Figure 12. Total pressure (up) and temperature (down) radial profiles downstream of each rotor, expressed as the deviation from the CLN case, for the BF and bladed URANS cases.
Ijtpp 10 00012 g012
Figure 13. Total pressure (up), total temperature (middle) and entropy (down) along the azimuthal position at the compressor outlet, expressed as the deviation from the CLN case.
Ijtpp 10 00012 g013
Figure 14. Scaled total pressure (up) and temperature (down) along the azimuth at inlet and downstream of each stator, for the 10 % distortion with the BF and bladed URANS approach.
Ijtpp 10 00012 g014
Figure 15. Swirl angle (up), flow coefficient (middle) and relative angle (down) along the azimuth at different stations, for the 10 % distortion with the BF and bladed URANS approach.
Ijtpp 10 00012 g015
Figure 16. Scaled entropy field for the bladed URANS (left) and Body Force (right) cases at 4 % inlet distortion.
Ijtpp 10 00012 g016
Figure 17. D H (top) and D L I (bottom) values of each row for the 10 % distortion at point NS. Body Force approach. In red: stability limit.
Ijtpp 10 00012 g017
Figure 18. D H (top) and D L I (bottom) values of row S 3 at 4 % and 10 % inlet distortion for the NP (left) and NS (right) operating points. URANS (black) and Body Force (red) approaches. In green: stability limit.
Ijtpp 10 00012 g018
Table 1. Table of dominant impact of the calibration coefficients on the row’s integral quantities.
CoefficientRotorStator
K n Π t t π s t
K f η i s or π t t π t t
Table 2. CREATE data at design point [38].
QuantityValue
Shroud external diameter0.52 m
Shaft speed11,543 rpm
Blade speed at Rotor 1 tip313 m/s
Relative Mach number at Rotor 1 tip0.92
Massflow rate12.7 kg/s
Table 3. Number of blades in the CREATE compressor.
SectorIGVR1S1R2S2R3S3
2 π 32641128011280112
2 π / 16 2475757
Table 4. Summary table of the studied configurations.
StudyInlet
B.C.
ID of Bladed
Simulation
ID of BF
Simulation
CalibrationCLN1A2A
Radial DistortionCLN1B2A
DIST
Circumferential DistortionCLN1C2C
DIST
Table 5. Mesh information for the bladed simulations.
IDApproachConfigurationSectorCells [ × 10 6 ]
1ARANSFull-heightSBP 8.82
1BURANSFull-height 2 π / 16 64.27
1CURANSP2D 2 π 53.99
Table 6. Characteristics of mesh grids for sensitivity study.
GridCells
[ × 10 6 ]
N r N x N θ
COARSE 6.96 85 (R)8159
85 (S)
MEDIUM 8.82 101 (R)81 101 (R1)59 79 (R1)
85 (S)
FINE 14.61 125 (R)10274
117 (S)
Table 7. Grid sensitivity study on compressor performance.
Variable err COARSE err MEDIUM
Q c o r r 0.46 % 0.09 %
π t t 0.44 % 0.07 %
η i s 0.38 % 0.27 %
Table 8. Mesh information for the Body Force simulations.
IDConfigurationSectorCells [ × 10 6 ]
2AFull-height 2 0.38
2CP2D 2 π 2.76
Table 9. Computational cost at convergence for each case.
ID T CPU N procs N jobs N procs N jobs T CPU
1A 1.00 482 9.60 × 10 1
1B 1.73 28810 4.98 × 10 3
1C 1.17 24010 2.81 × 10 3
2A 0.75 21 1.50 × 10 0
2C 1.19 101 1.19 × 10 1
Table 10. Calibration coefficients for each row of CREATE.
CoefficientR1S1R2S2R3S3
K n 1.100.750.851.250.700.75
K f 0.801.151.050.701.201.00
K d 1.211.301.171.151.121.03
Table 11. Relative errors of the Body Force model with respect to the bladed RANS simulations.
PointCase BF π tt π st η is Π tt
NPInitial 10 % 11.16 % 10.28 % 2.08 %
Calibrated 0.50 % 0.70 % 0.16 % 0.01 %
NSInitial----
Calibrated 1.05 % 1.12 % 0.86 % 0.60 %
Table 12. Absolute relative error of the Body Force model, with respect to the bladed URANS calculations, at varying distortion intensity.
P t Deficit P t , err T t , err S err
4 % 0.31 % 0.29 % 0.12 %
10 % 0.47 % 0.50 % 0.20 %
Disclaimer/Publisher’s Note: The statements, opinions and data contained in all publications are solely those of the individual author(s) and contributor(s) and not of MDPI and/or the editor(s). MDPI and/or the editor(s) disclaim responsibility for any injury to people or property resulting from any ideas, methods, instructions or products referred to in the content.

