Next Article in Journal
A Review on Klotho: FGF23 Mediated Pathway Integration and Aging
Previous Article in Journal
The Relationship Between Fall Anxiety and Fall Behaviors in Geriatric Patients Undergoing Orthopedic Surgery with a History of Falling
 
 
Journal of Gerontology and Geriatrics is published by MDPI from Volume 74 Issue 1 (2026). Previous articles were published by another publisher in Open Access under a CC-BY (or CC-BY-NC-ND) licence, and they are hosted by MDPI on mdpi.com as a courtesy and upon agreement with Pacini Editore.
Article

Association of Waist-Calf Circumference Ratio with Frailty by Fried Frailty Phenotype Questionnaire in Older Adults from Japan

by
Yuki Niida
1,
Hidenori Onishi
2,*,
Ryouko Ikeda
1,
Yasutaka Mizukami
2,
Masafumi Kubota
3,
Tomoko Okamoto
4,
Hiromasa Tsubouchi
5,
Taisei Inoue
6,
Hiraku Watanabe
6,
Daiki Hasegawa
6,
Fumie Maeda
7,
Yuya Nakajima
8,
Kousuke Murayama
9,
Hirohiko Ohama
10,
Tokuharu Tanaka
10,
Naohiro Konoshita
11,
Masamichi Ikawa
11 and
Osamu Yamamura
2
1
Department of Health and Nutrition, Faculty of Human Life, Jin-ai University, Echizen, Fukui, Japan
2
Department of Community Medicine, Faculty of Medical Sciences, University of Fukui, Fukui, Japan
3
Department of Physical Therapy, Graduate Course of Rehabilitation Science, School of Health Sciences, College of Medical, Pharmaceutical, and Health Sciences, Kanazawa University, Kanazawa, Ishikawa, Japan
4
Division of Nursing, Faculty of Medical Sciences, University of Fukui, Fukui, Japan
5
Department of Radiotechnology, Fukui Ken Saiseikai Hospital, Fukui, Japan
6
Division of Physical Therapy and Rehabilitation Medicine, University of Fukui Hospital, Fukui, Japan
7
Department of Clinical Laboratory, University of Fukui Hospital, Fukui, Japan
8
Department of Rehabilitation, Faculty of Health Science, Fukui Health Science University, Fukui, Japan
9
Department of Primary Health Care, Faculty of Medicine, University of Fukui, Fukui, Japan
10
10 Department of Family Medicine, University of Fukui Hospital, Fukui, Japan
11
11 Department of Community Health Science, Faculty of Medical Sciences, University of Fukui, Fukui, Japan
*
Author to whom correspondence should be addressed.
J. Gerontol. Geriatr. 2025, 73(3), 85-91; https://doi.org/10.36150/2499-6564-N826

Submission received: 18 January 2025 / Accepted: 26 September 2025 / Published: 29 September 2025

Objective

The waist circumference (WC) to calf circumference (CC) ratio (WCR), a measure of visceral fat, was calculated from WC and CC, measures of abdominal obesity and skeletal muscle mass, respectively. In this study, we investigated the relationship of WCR with pre-frailty and frailty using the Fried Frailty Phenotype Questionnaire (FFPQ).

Methods

A total of 175 community-dwelling older adults in Wakasa-cho, Kaminaka-Mikata-gun, Fukui Prefecture, Japan were included in this study. Frailty was determined by the FFPQ scores, with those who scored 0, 1-2, and ≥ 3 on the FFPQ being considered robust, pre-frailty, and frailty, respectively.

Results

Pre-frailty and frailty were diagnosed in 90 (51.4%) and 18 (10.3%) patients, respectively, using the FFPQ (p < 0.001). CC was not significantly different between the groups (p = 0.415). WCR was significantly higher in the pre-frailty and frailty groups than in the robust group (p < 0.001). The FFPQ scores were significantly positively correlated with WCR (r = 0.364, p < 0.001). Pre-frailty and frailty diagnosed by FFPQ were analysed in relation to WCR, WC, and CC by ordinal logistic regression analysis, which showed that WCR and CC were associated with pre-frailty and frailty after adjustment (WCR: odds ratio (OR) 5.72, 95% confidence interval (CI) 1.43-23.70, p = 0.015; CC: OR 0.81, 95% CI 0.69-0.94, p = 0.006).

Conclusions

This study investigated the association of WCR with prefrailty and frailty diagnosed using the FFPQ in community-dwelling older adults. High abdominal fat and low lower leg muscle mass were significantly associated with frailty and WCR during the pre-frailty stage.

INTRODUCTION

Frailty is a condition characterised by the breakdown of homeostasis and physiological reserve functions in response to various stresses. The prevalence of frailty among community-dwelling older adults in Japan was 7.4% 1. Frailty is considered a risk factor for increased mortality, falls, and functional disability 2,3. Identifying risk factors for frailty is therefore crucial in developing effective interventions aimed at preventing and treating frailty.
Weight loss due to malnutrition is a risk for frailty 4,5. On the contrary, obesity with weight gain is another risk factor for frailty, and Jayanama et al. have reported that frailty is more common with ≥ 25 kg/m2 body mass index (BMI) 6. However, body composition changes in older adults as they age, and they lose muscle mass and lean body mass and gain body fat mass 7. Therefore, the diagnosis of frailty may be missed based on BMI alone, which is the ratio of weight to height, as weight changes in older adults with reduced muscle mass and increased body fat mass are subtle 7. In addition, the waist circumference (WC) in frailty is an indicator of abdominal obesity, and increased WC is associated with frailty onset 8. Calf circumference (CC) is also used as a measure of skeletal muscle mass and an indicator of sarcopenia by the Asian Working Group for Sarcopenia 2019, with a significantly lower Frailty Index (FI) with increasing CC in community-dwelling older adults aged ≥ 80 years 9,10.
The WC/CC ratio (WCR), calculated by dividing the WC, a measure of abdominal obesity, by the CC, a measure of muscle mass, is an emerging indicator of the imbalance between body fat mass and skeletal muscle mass 11. WCR is associated with carotid atherosclerosis and health-related quality of life 12,13. However, studies focusing on frailty and WCR are scarce.
Frailty has many measures, with Fried Frailty Phenotype (FFP) and FI being the most widely used 14. Diagnosis is not easy, as FFP requires objective measures of grip strength and walking speed, while FI requires information from the Comprehensive Geriatric Assessment. Therefore, the FFP Questionnaire (FFPQ) was developed, which consists of five components: fatigue, resistance, gait, inactivity, and weight loss. It assesses frailty using only questions without measuring physical functions, such as walking speed. The FFPQ is valid, reliable, and has a high diagnostic accuracy 15. However, the link between the FFPQ and WCR is unclear.
This study investigated whether WCR was associated with pre-frailty and frailty diagnosed using the FFPQ in community-dwelling older adults in Japan.

METHODS

Older adults in Wakasa-cho, Mikata-Kaminaka-gun, Fukui Prefecture, Japan were examined between July 2022 and December 2023. A total of 184 older adults living in the area who participated in screening were included in this study. The analysis included 175 participants after excluding three candidates who did not complete the FFPQ, one candidate whose grip strength was not measured, three candidates whose WC was not measured, and two candidates whose CC was not measured.
After written informed consent was obtained from the participants, a medical examination consisting of basic interviews, blood pressure measurements, and physical function measurements (grip strength, height, weight, 5 times chair stand test, upper arm circumference, lower leg circumference, and waist circumference) was performed. The test results were then explained to the participants. Basic interviews were conducted to ascertain age, sex, medical history (diabetes mellitus, hypertension, dyslipidaemia, chronic kidney disease, heart disease, osteoporosis, and stroke), and lifestyle (smoking, drinking alcohol, and living alone).
Upper arm circumference was measured while the participant was seated. A mark was placed at the midpoint of the upper arm (between the acromion and elbow head) when the elbow was bent to 90°. The measurer then wrapped the tape measure around the marked midpoint, with the participant’s arms hanging naturally. CC was measured with the participant seated with the knees and ankles bent at 90°. The measurer moved up and down to maximise the horizontal distance between the calves. The upper arm circumference and CC were measured in centimetres to one decimal place on the non-dominant hand side. The WC was measured at the lower navel using a measuring tape. The WCR was calculated by dividing WC (cm) by CC (cm).
The FFPQ consists of five questions on fatigue, resistance, gait, inactivity, weight loss, and frailty, and pre-frailty is determined by scores on a 5-point scale. The participants were classified as robust, pre-frailty, or frailty according to their FFPQ scores 15. Those with scores of 0, 1-2, and ≥ 3 on the FFPQ were considered robust, pre-frailty, and frailty, respectively.
All statistical data were analysed using EZR ver. 1.68 (Saitama Medical Center, Jichi Medical University, Japan 16. Continuous variables were expressed as mean ± standard deviation. Categorical variables were expressed as total numbers (%). Fisher’s exact test was used for categorical variables, the Kruskal-Wallis test for continuous variables, and Bonferroni’s multiple comparisons for post-hoc tests. Significance of the test was determined at < 5% risk rate. Spearman’s rank-order correlation was used to obtain correlation coefficients. To examine the association between frailty using the FFPQ and WCR, ordinal logistic regression analysis of prefrailty and frailty using the FFPQ was performed as the objective variable. Odds ratios (ORs) and 95% confidence intervals (CIs) were calculated using age, sex, BMI, smoking status, drinking alcohol, and living alone as adjustment factors. The proportional odds assumption in the ordinal logistic regression model was evaluated using the Brant’s test. The coefficient estimates for each predictor were compared across ordinal thresholds. The results of the Brant’s test indicated no significant violations of the proportional odds assumption for any covariate (p > 0.05), thereby confirming the appropriateness of applying the ordinal logistic regression model in this analysis.

RESULTS

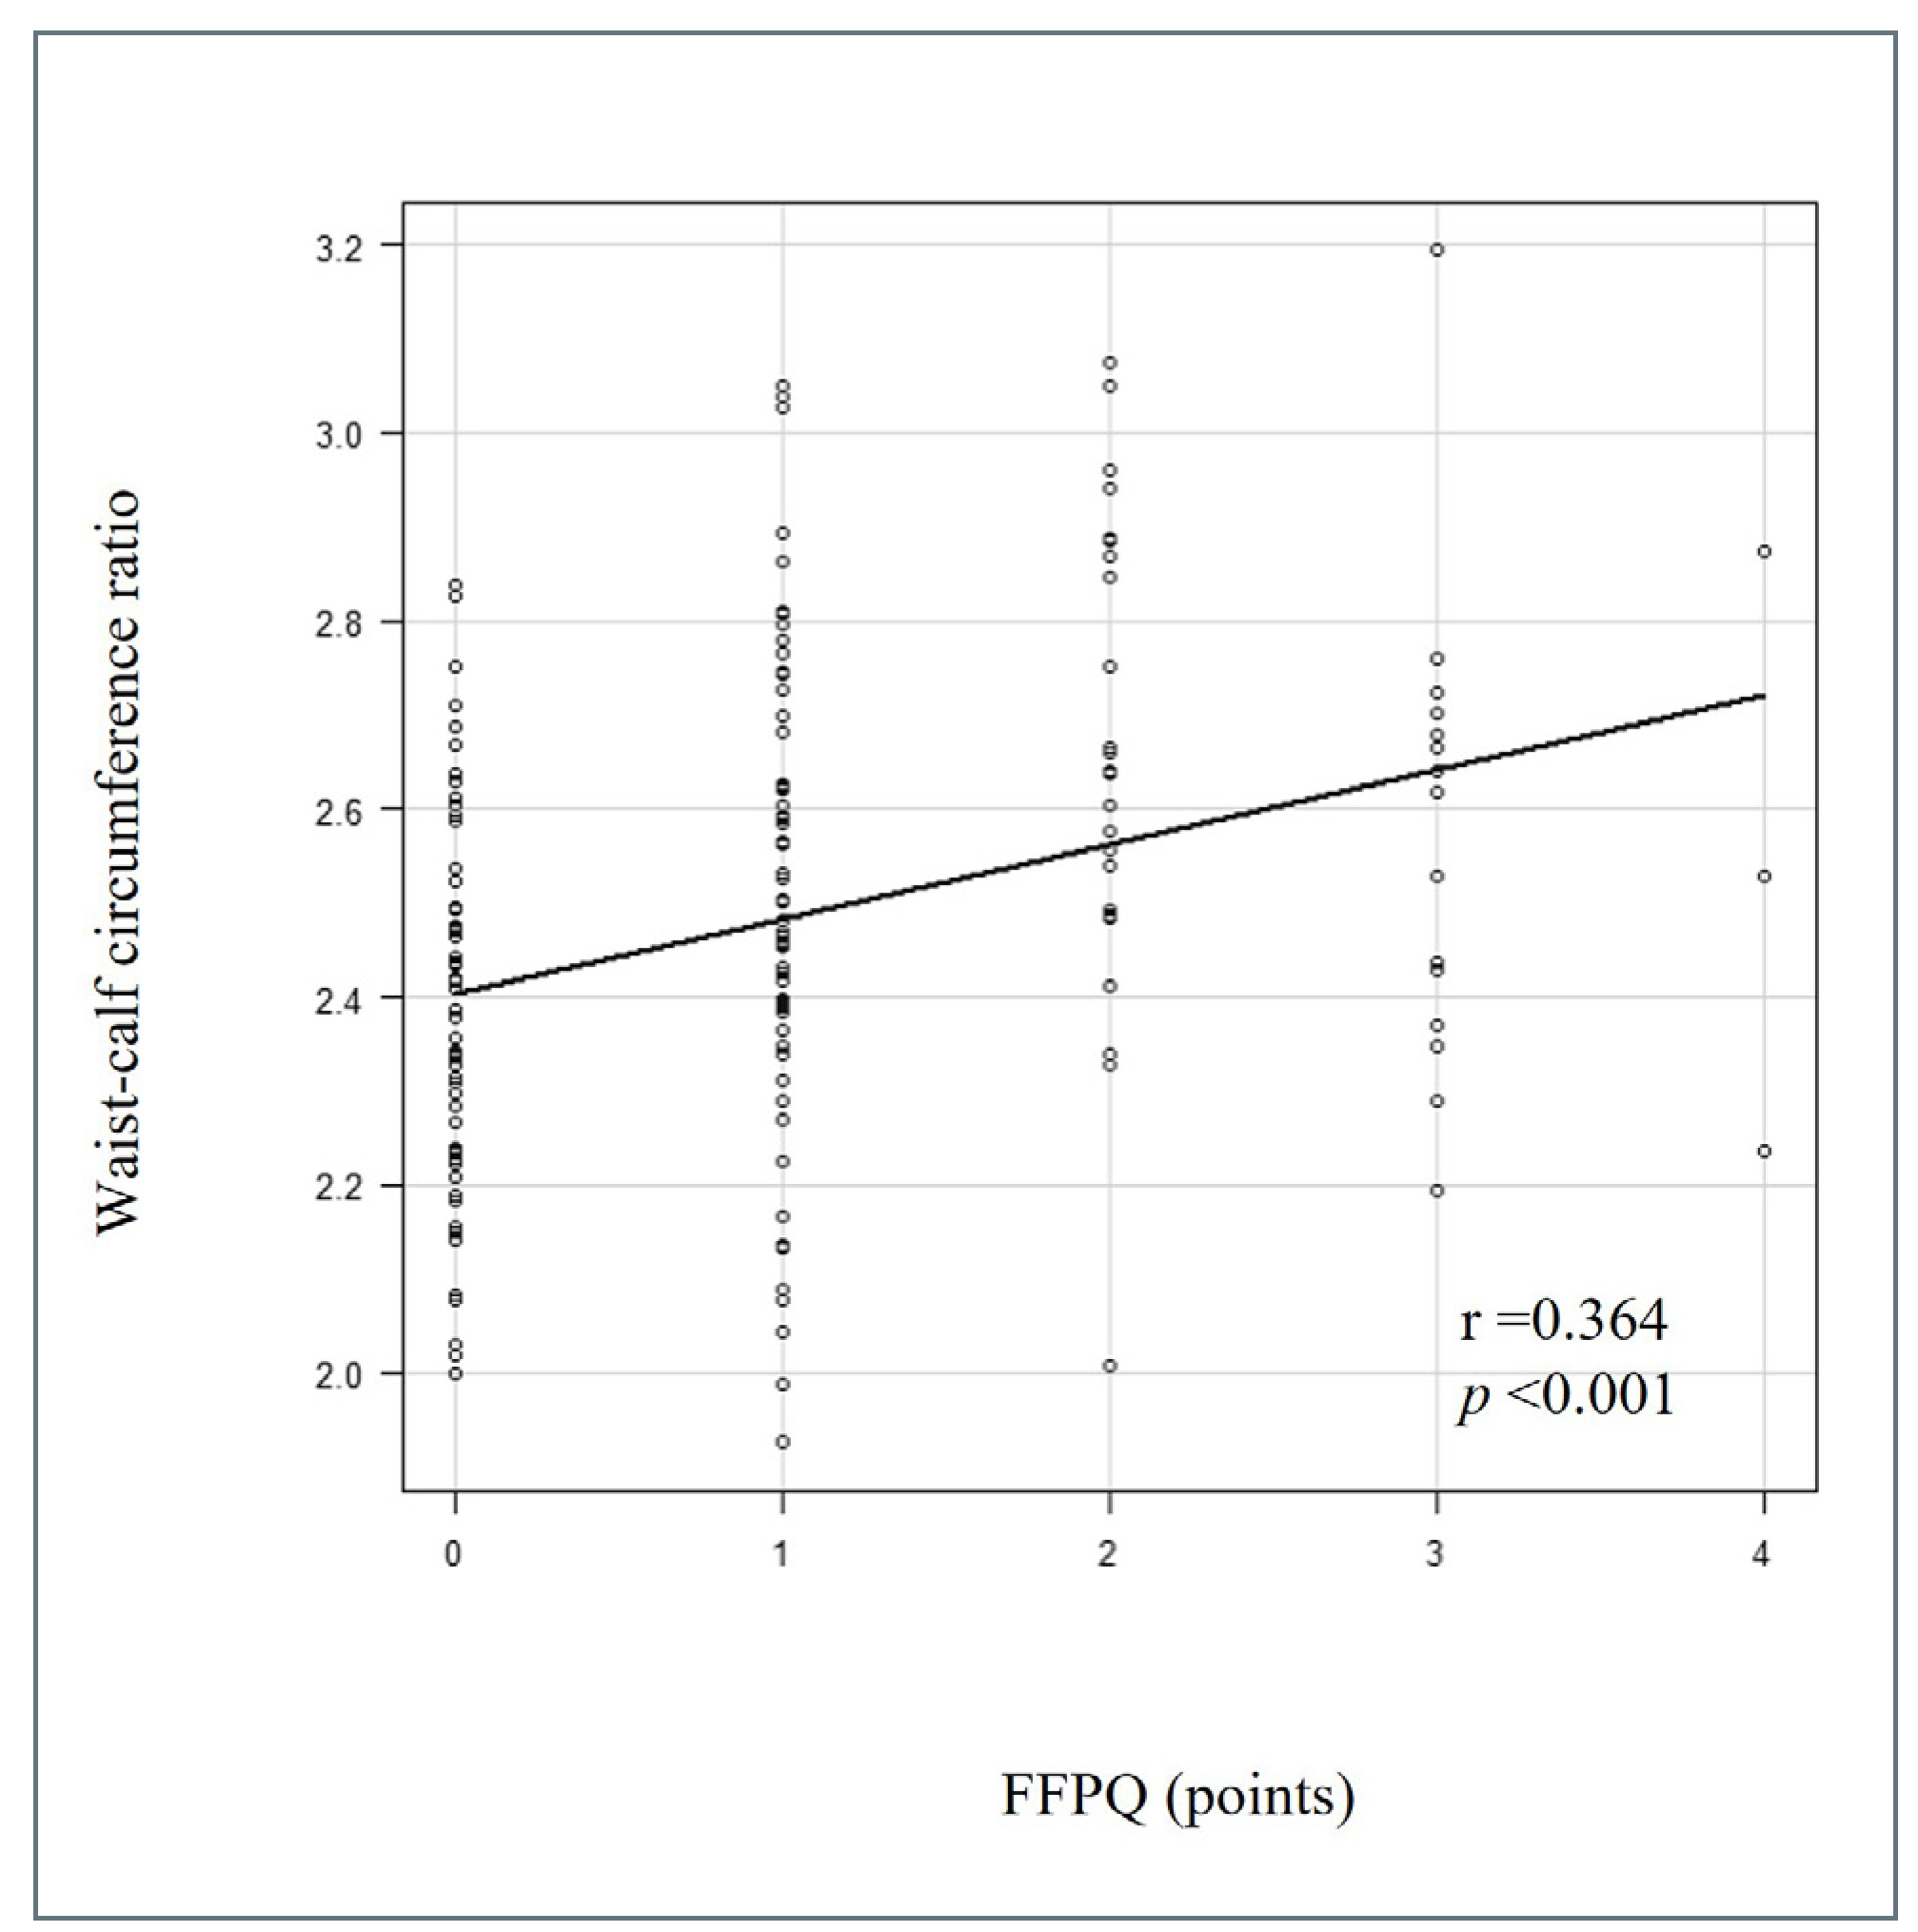
The target population consisted of 175 community-dwelling older adults living in Wakasa-cho, Mikata-Kaminaka-gun, Fukui Prefecture, Japan. Among them, 90 (51.4%) and 18 (10.3%) were diagnosed with pre-frailty and frailty by FFPQ, respectively (Tab. I). The WC in the participants with pre-frailty was significantly higher than in the robust participants (p = 0.001); however, the CC was not different between the groups (p = 0.415). Moreover, the WCR in the participants with pre-frailty and frailty was significantly higher than in the robust participants (p < 0.001) (Tab. II). The FFPQ scores and WCR were significantly positively correlated (r = 0.364, p < 0.001) (Tab. III). Pre-frailty and frailty diagnosed using the FFPQ were analysed for associations with WCR, WC, and CC using ordinal logistic regression analysis. Ordinal logistic regression analysis showed that WCR and CC were associated with pre-frailty and frailty after adjusting for various factors (WCR: ORs 5.72, 95% CIs 1.43-23.70, p = 0.015; CC: ORs 0.81, 95% CIs 0.69-0.94, p = 0.006) (Tab. IV).

DISCUSSION

In this study, we investigated the association of WCR with pre-frailty and frailty diagnosed using the FFPQ in community-dwelling older adults. Our study found that WCR was significantly associated with prefrailty. In addition, the results of the ordinal logistic regression analysis showed that WCR and CC were associated with prefrailty and frailty after factor adjustment.
This study confirmed that WCR was associated with the pre-frailty stage than WC alone. Previous reports have also shown that people with high BMI and normal WC were not associated with the risk of pre-frailty or frailty, but those with normal BMI and high WC were associated with pre-frailty and frailty 8. Body composition of older inpatients with frailty is characterised by low skeletal muscle mass and body weight, high body fat mass, and long WC 17. Thus, measuring body composition such as fat mass and lean body mass with a body composition analyser, rather than body weight or BMI, may be useful in detecting frailty in older adults, but incorporating this method into the field is difficult as it is expensive. The WCR reflects visceral fat in the abdominal circumference and muscle mass around the lower legs and can be measured using only a tape measure; its use in the diagnosis of frailty may contribute to the spread of frailty.
Older adults with increased body fat and decreased muscle mass may develop skeletal muscle disorders owing to the presence of ectopic fat. Increased visceral fat increases fat within the skeletal muscles, which is strongly inversely correlated with walking speed, Short Physical Performance Battery score, and grip strength 18,19. WC is an indicator of visceral fat, and inflammation due to increased visceral fat may induce insulin resistance, leading to decreased muscle mass and strength 20.
Visceral fat accumulation induces a state of chronic inflammation by promoting the secretion of pro-inflammatory cytokines such as interleukin-6 and tumour necrosis factor-alpha, which in turn exacerbates insulin resistance and enhances muscle protein catabolism, ultimately leading to muscle atrophy 21. Calf muscle mass is a critical indicator directly linked to lower limb support and walking ability, and age-related muscle loss significantly reduces physical reserve capacity 22. Consequently, functional impairments in daily living activities become pronounced, increasing physical frailty 23. These factors provide a physiological rationale supporting the utility of the WCR as an early indicator of frailty. As WCR may increase with increased WC, increased visceral fat may contribute to frailty, leading to skeletal muscle damage via inflammation and increased skeletal muscle fat.
In this study, the adjusted ordinal logistic regression analysis showed that WCR and CC, but not WC, were associated with prefrailty and frailty. CC is a measure of skeletal muscle mass and often used to diagnose sarcopenia 9. Xu et al. reported that frailty by FI was associated with CC, with the best cut-off values being 29.5 cm for males and 28.5 cm for females 24. CC was also associated with pre-frailty and frailty in this study, as reported in previous studies. WC is associated with frailty; however, in this study, it was significantly associated in unadjusted ordinal logistic regression analysis, but not significantly after adjustment 8. The use of different diagnostic methods in this study compared to previous reports may explain the discrepancies in our findings 8,25,26. In addition, the sample size of this study was small (175 participants), and future prospective large-scale studies are needed.
Obesity is a known risk factor for frailty. In a Japanese study of 3,958,708 participants, obesity and metabolic syndrome were independent risk factors for frailty among middle-aged and older Japanese adults 27. Overweight and obesity were also associated with frailty in a study of 599 older females in the United States of America 28. Since muscle weakness is also a risk factor for frailty, WCR, which combines WC as an indicator of abdominal obesity and CC as an indicator of skeletal muscle mass, is effective in detecting frailty in individuals who are obese or overweight. In addition, the WCR may be a useful screening tool for frailty, especially in countries with a high prevalence of obesity and overweight 29.
This study has several limitations. It employed a cross-sectional design, and therefore cannot establish a causal relationship between WCR and frailty. Specifically, two possibilities must be considered: frailty progression may lead to muscle atrophy, reducing CC and subsequently increasing WCR; conversely, a high WCR may promote muscle mass loss and a decline in physical function, thereby accelerating frailty. To elucidate these bidirectional effects, longitudinal studies that track changes in body composition and physical function over time are essential. Future research should aim to verify the causal relationship between WCR dynamics and frailty through prospective cohort studies incorporating regular anthropometric measurements and frailty assessments. Second, frailty can only be diagnosed using the FFPQ and whether other methods of frailty assessment would yield similar results is unclear. In future, the usefulness of WCR should be examined using a comprehensive frailty assessment method. A study by Chen et al. on the FFPQ in Japanese older adults have reported that it has 33.3% sensitivity, 99.2% specificity, and 0.42 kappa coefficient using a cut-off score of 3 points compared with the Fried Frailty Phenotype, indicating moderate agreement and high specificity 15. However, the FFPQ is a self-reported questionnaire, and items such as weight loss and difficulty walking may be subject to bias owing to subjective judgment and recall inaccuracies. In older adults, cognitive decline and differences in health awareness affect the accuracy of self-reported data. The FFPQ includes an item for responding to weight loss; since weight gain is associated with increased WC, those who responded to the weight loss item may be a confounding factor for WCR and frailty. In this study, WC and CC were measured by multiple assessors, which may have introduced inter-rater variability. Anthropometric measurements are particularly susceptible to differences in technical proficiency and measurement conditions, and discrepancies between evaluators may have influenced the results. Furthermore, the prevalence of diabetes differed significantly between the groups (p = 0.028). Diabetes is closely associated with sarcopenia and visceral fat accumulation, and may act as a confounding factor in the relationship between WCR and frailty 30,31. Sensitivity analysis using a multivariate model including diabetes eliminated the statistical significance of WCR. This suggests that diabetes may function as a confounding variable affecting both WCR and frailty and highlights the need to consider WCR as a potential indicator of the influence of metabolic disorders. Future studies should construct models that systematically adjust for major comorbidities including diabetes to validate the independent predictive value of WCR. Sensitivity analysis including physical performance indicators such as handgrip strength and chair stand test was also conducted. In this model, the association between WCR and frailty was no longer statistically significant (WCR: ORs 2.83, 95% CIs 0.67-12.3, p = 0.16). This result suggests that muscle strength and physical function are strongly associated with both WCR and frailty, and that the effect of WCR may be indirectly mediated through these physical function indicators. In other words, WCR may function not as an independent determinant, but rather as a proxy reflecting declines in muscle strength and physical performance. Future studies should explore the mediating and interaction effects between WCR and physical function indicators to elucidate a more refined causal structure. This study targeted older adults residing in the rural areas of Fukui Prefecture, comprising a geographically and ethnically homogeneous population. Therefore, the cut-off values for WCR and its association with frailty derived from this cohort may have limited generalisability to populations living in urban settings or under different lifestyle conditions. A study by Bhat et al. reported significant differences in muscle mass, grip strength, and physical function between urban and rural populations in Western India, with the prevalence of sarcopenia being more than twice as high in rural areas 32. These findings suggest that regional differences in nutritional status, physical activity, and access to healthcare may influence body composition and frailty risk. Future research should aim to validate the utility and generalisability of WCR through multicentre collaborative studies involving older adults from both urban and areas of diverse geographic regions.

CONCLUSIONS

In this study, we investigated the association of WCR with pre-frailty and frailty diagnosed using the FFPQ in community-dwelling older adults. Our study found that WCR was significantly associated with pre-frailty. Frailty is difficult to detect in older adults using BMI or weight because their body composition changes in a different way compared to younger adults.

Acknowledgements

We thank all the medical staff (doctors, nurses, public health nurses, dietitians, occupational therapists, physical therapists, clinical technologists, and radiology technologists), office staff, and students for their cooperation in this study. We thank Kazue Fujita, Kumiko Ito, Yuka Nakamura, Noriko Sadakane, and Satoko Hirose for their administrative, preparatory, and technical support. We thank Editage (www.editage) for English language editing.

Conflict of interest statement

Osamu Yamamura receives remuneration from Xenera Corporation. Hidenori Onishi has signed nondisclosure agreements with Nice Metz Corporation, Macnica Corporation, and Xenera Corporation. The other authors declare that they have no conflicts of interest to disclose.

Funding

This research was supported by the University of Fukui Reinan Community Co-creation Project “RCCP” Fund for FY2022-2024.

Author contributions

YN, HO, OY: contributed significantly to study conceptualisation, contributed significantly to data analysis, contributed to manuscript preparation; YN, HO, RI, YM, MK, TO, HT, TI, HW, DH, FM, YN, KM, HO, TT, NK, MI, OY: contributed significantly to interpretation. All authors critically reviewed and revised the manuscript, and approved and submitted the final version.

Ethical consideration

This study was approved by the University of Fukui Medical Research Ethics Review Committee (Approval No. 20220046). All researchers involved in this study complied with the “Ethical Guidelines for Medical and Biological Research Involving Human Subjects” (Ministry of Education, Culture, Sports, Science and Technology; Ministry of Health, Labour and Welfare; and Ministry of Economy, Trade and Industry Notification No. 23, 1 March 2021). All participants were provided with verbal and written explanations regarding the purpose and methodology of the study as well as the handling of personal information. Written informed consent was obtained after ensuring that the participants had sufficient understanding of the study.

History

Received: January 18, 2025
Accepted: September 26, 2025

Figures and tables

Figure 1. Correlation between Fried frailty phenotype questionnaire (FFPQ) and waist-calf circumference (n = 175).
Jgg 73 00085 g001
Table I. Basic characteristics.
RobustPre-frailtyFrailty
679018P-value
Age (year)73.73 ± 5.9776.09 ± 6.2078.33 ± 5.90*0.006
Sex (%)
Female44 (65.7)51 (56.7)10 (55.6)0.481
Male23 (34.3)39 (43.3)8 (44.4)
Body mass index (kg/m2)21.51 ± 2.7523.00 ± 2.95*23.36 ± 4.370.004
Smoking (%)3 (4.5)6 (6.7)3 (16.7)0.191
Drinking alcohol (%)19 (28.4)26 (28.9)5 (27.8)0.994
Living alone (%)5 (7.8)15 (16.7)4 (22.2)0.166
Disease (%)
Diabetes mellitus4(6.0)19 (21.3)*3 (16.7)0.028
Hypertension31 (46.3)56 (62.2)10 (55.6)0.138
Dyslipidaemia17 (25.4)25 (28.1)5 (27.8)0.928
Heart disease3 (4.5)12 (13.3)2 (11.1)0.176
Chronic kidney disease1 (1.5)0 (0.0)1 (5.6)0.124
Stroke1 (1.5)5 (5.6)0 (0.0)0.263
FFPQ (points)0.00 ± 0.001.30 ± 0.46*3.17 ± 0.38*¶< 0.001
FFPQ: Fried frailty phenotype questionnaire p < 0.05 *vs Robust vs pre-frailty.
Table II. Anthropometric measurements and physical performance.
RobustPre-frailtyFrailtyPost-hoc
679018Robust vs pre-frailty p valueRobust vs frailty p valuePre-frailty vs frailty p valuep value
Arm circumference (cm)26.56 ± 2.6927.60 ± 2.8327.08 ± 3.150.0640.7261.0000.060
Waist circumference (cm)80.69 ± 9.8285.76 ± 9.07*85.62 ± 12.800.0010.6061.0000.001
Calf circumference (cm)33.87 ± 2.8533.88 ± 3.2733.29 ± 3.241.0000.6300.6300.415
Waist-calf circumference ratio2.38 ± 0.202.54 ± 0.25*2.57 ± 0.25*< 0.0010.0121.000< 0.001
Maximum handgrip strength (kg)31.30 ± 8.7730.21 ± 8.1625.68 ± 6.44*1.0000.0280.0820.036
5 times chair stand test (second)7.49 ± 1.667.93 ± 2.209.02 ± 3.401.0000.4301.0000.359
p < 0.05 *vs robust.
Table III. Ordinal logistic regression analysis of anthropometric measures with robustness, pre-frailty, and frailty.
Unadjusted modelAdjusted model
95% CI95% CI
Odds ratioUnderUpperp valueOdds ratioUnderUpperp value
Waist-calf circumference ratio12.703.7844.90< 0.0015.721.4323.700.015
Waist circumference1.051.021.080.0021.020.961.080.485
Calf circumference0.980.891.070.6690.810.690.940.006
CI confidence interval
The multivariate model was adjusted for age, sex, body mass index, smoking status, drinking alcohol, and living alone.

References

  1. Kojima G, Iliffe S, Taniguchi Y, et al. Prevalence of frailty in Japan: a systematic review and meta-analysis. J Epidemiol 2017;27:347-353. https://doi.org/10.1016/j.je.2016.09.008 10.1016/j.je.2016.09.008
  2. Peng Y, Zhong GC, Zhou X, et al. Frailty and risks of all-cause and cause-specific death in community-dwelling adults: a systematic review and meta-analysis. BMC Geriatr 2022;22:725. https://doi.org/10.1186/s12877-022-03404-w 10.1186/s12877-022-03404-w
  3. Makizako H, Shimada H, Doi T, et al. Impact of physical frailty on disability in community-dwelling older adults: a prospective cohort study. BMJ Open 2015;5:E008462. https://doi.org/10.1136/bmjopen-2015-008462 10.1136/bmjopen-2015-008462
  4. Fried LP, Tangen CM, Walston J, et al. Frailty in older adults: evidence for a phenotype. J Gerontol A Biol Sci Med Sci 2001;56:M146-M156. https://doi.org/10.1093/gerona/56.3.m146 10.1093/gerona/56.3.m146
  5. Liang H, Li X, Lin X, et al. The correlation between nutrition and frailty and the receiver operating characteristic curve of different nutritional indexes for frailty. BMC Geriatr 2021;21:619. https://doi.org/10.1186/s12877-021-02580-5 10.1186/s12877-021-02580-5
  6. Jayanama K, Theou O, Godin J, et al. Relationship of body mass index with frailty and all-cause mortality among middle-aged and older adults. BMC Med 2022;20:404. https://doi.org/10.1186/s12916-022-02596-7 10.1186/s12916-022-02596-7
  7. Genton L, Karsegard VL, Chevalley T, et al. Body composition changes over 9 years in healthy elderly subjects and impact of physical activity. Clin Nutr 2011;30:436-442. https://doi.org/10.1016/j.clnu.2011.01.009 10.1016/j.clnu.2011.01.009
  8. Uchai S, Andersen LF, Hopstock LA, et al. Body mass index, waist circumference and pre-frailty/frailty: the Tromsø study 1994-2016. BMJ Open 2023;13:E065707. https://doi.org/10.1136/bmjopen-2022-065707 10.1136/bmjopen-2022-065707
  9. Chen LK, Woo J, Assantachai P, et al. Asian Working Group for Sarcopenia: 2019 consensus update on sarcopenia diagnosis and treatment. J Am Med Dir Assoc 2020;21:300-307.e2. https://doi.org/10.1016/j.jamda.2019.12.012 10.1016/j.jamda.2019.12.012
  10. Landi F, Onder G, Russo A, et al. Calf circumference, frailty and physical performance among older adults living in the community. Clin Nutr 2014;33:539-544. https://doi.org/10.1016/j.clnu.2013.07.013 10.1016/j.clnu.2013.07.013
  11. Güner M, Öztürk Y, Ceylan S, et al. Evaluation of waist-to-calf ratio as a diagnostic tool for sarcopenic obesity: a cross-sectional study from a geriatric outpatient clinic. Eur Geriatr Med 2024;15:1469-1475. https://doi.org/10.1007/s41999-024-01024-8 10.1007/s41999-024-01024-8
  12. Rao HA, Harischandra P, Yadav S. Correlation of waist to calf circumference ratio and carotid intima-media thickness in diabetes mellitus. Curr Diabetes Rev 2021;17:387-393. https://doi.org/10.2174/1573399816999200729124903 10.2174/1573399816999200729124903
  13. Yang S, Liu M, Wang S, et al. Waist-calf circumference ratio is an independent risk factor of HRQoL in centenarians. Diabetes Metab Syndr Obes 2020;13:277-287. https://doi.org/10.2147/DMSO.S231435 10.2147/DMSO.S231435
  14. Deng Y, Sato N. Global frailty screening tools: Review and application of frailty screening tools from 2001 to 2023. Intractable Rare Dis Res 2024;13:1-11. https://doi.org/10.5582/irdr.2023.01113 10.5582/irdr.2023.01113
  15. Chen S, Chen T, Kishimoto H, et al. Development of a fried frailty phenotype questionnaire for use in screening community-dwelling older adults. J Am Med Dir Assoc 2020;21:272-276.e1. https://doi.org/10.1016/j.jamda.2019.07.015 10.1016/j.jamda.2019.07.015
  16. Kanda Y. Investigation of the freely available easy-to-use software ‘EZR’ for medical statistics. Bone Marrow Transplant 2013;48:452-458. https://doi.org/10.1038/bmt.2012.244 10.1038/bmt.2012.244
  17. Xu L, Zhang J, Shen S, et al. Association between body composition and frailty in elder inpatients. Clin Interv Aging 2020;15:313-320. https://doi.org/10.2147/CIA.S243211 10.2147/CIA.S243211
  18. Idoate F, Cadore EL, Casas-Herrero A, et al. Adipose tissue compartments, muscle mass, muscle fat infiltration, and coronary calcium in institutionalized frail nonagenarians. Eur Radiol 2015;25:2163-2175. https://doi.org/10.1007/s00330-014-3555-5 10.1007/s00330-014-3555-5
  19. Justice JN, Gregory H, Tchkonia T, et al. Cellular senescence biomarker p16INK4a+ cell burden in thigh adipose is associated with poor physical function in older women. J Gerontol A Biol Sci Med Sci 2018;73:939-945. https://doi.org/10.1093/gerona/glx134 10.1093/gerona/glx134
  20. Buchmann N, Fielitz J, Spira D, et al. Muscle mass and inflammation in older adults: impact of the metabolic syndrome. Gerontology 2022;68:989-998. https://doi/10.1159/000520096 10.1159/000520096
  21. Wu H, Ballantyne CM. Skeletal muscle inflammation and insulin resistance in obesity. J Clin Invest 2017;127:43-54. https://doi.org/10.1172/JCI88880 10.1172/JCI88880
  22. Díaz Villegas GM, Runzer Colmenares F. Relación entre circunferencia de la pantorrilla y velocidad de la marcha en pacientes adultos mayores en Lima, Perú [Calf circumference and its association with gait speed in elderly participants at Peruvian Naval Medical Center]. Rev Esp Geriatr Gerontol 2015;50:22-25. https://doi.org/10.1016/j.regg.2014.06.002 10.1016/j.regg.2014.06.002
  23. Bolaji OF, Santos LP, Gonzalez MC, et al. Longitudinal changes in calf circumference and health outcomes among community-dwelling older adults in southern Brazil. Nutrition 2025;139:112849. https://doi.org/10.1016/j.nut.2025.112849 10.1016/j.nut.2025.112849
  24. Xu KY, Wang JJ, Chen J, et al. Calf circumference predicts frailty in older adults: the Chinese longitudinal healthy longevity survey. BMC Geriatr 2022;22:936. https://doi.org/10.1186/s12877-022-03644-w 10.1186/s12877-022-03644-w
  25. Liao Q, Zheng Z, Xiu S, et al. Waist circumference is a better predictor of risk for frailty than BMI in the community-dwelling elderly in Beijing. Aging Clin Exp Res 2018;30:1319-1325. https://doi.org/10.1007/s40520-018-0933-x 10.1007/s40520-018-0933-x
  26. Afonso C, Sousa-Santos AR, Santos A, et al. Frailty status is related to general and abdominal obesity in older adults. Nutr Res 2021;85:21-30. https://doi.org/10.1016/j.nutres.2020.10.009 10.1016/j.nutres.2020.10.009
  27. Nishida Y, Yamada Y, Sasaki S, et al. Effect of overweight/obesity and metabolic syndrome on frailty in middle-aged and older Japanese adults. Obes Sci Pract 2023;10:E714. https://doi.org/10.1002/osp4.714 10.1002/osp4.714
  28. Blaum CS, Xue QL, Michelon E, et al. The association between obesity and the frailty syndrome in older women: the Women’s Health and Aging Studies. J Am Geriatr Soc 2005;53:927-934. https://doi.org/10.1111/j.1532-5415.2005.53300.x 10.1111/j.1532-5415.2005.53300.x
  29. Stevens GA, Singh GM, Lu Y, et al. National, regional, and global trends in adult overweight and obesity prevalences. Popul Health Metr 2012;10:22. https://doi.org/10.1186/1478-7954-10-22 10.1186/1478-7954-10-22
  30. Li B, Li Y, Zhang Y, et al. Visceral fat obesity correlates with frailty in middle-aged and older adults. Diabetes Metab Syndr Obes 2022;15:2877-2884. https://doi.org/10.2147/DMSO.S383597 10.2147/DMSO.S383597
  31. Sato M, Tamura Y, Murao Y, et al. Coexistence of high visceral fat area and sarcopenia is associated with atherosclerotic markers in old-old patients with diabetes: a cross-sectional study. J Diabetes Investig 2024;15:1510-1518. https://doi.org/10.1111/jdi.14274 10.1111/jdi.14274
  32. Bhat G, Ireland A, Shah N, et al. Prevalence and factors associated with sarcopenia among urban and rural Indian adults in middle age: a cross-sectional study from Western India. PLOS Glob Public Health 2024;4:E0003553. https://doi.org/10.1371/journal.pgph.0003553 10.1371/journal.pgph.0003553