Next Article in Journal
Sexual Differences Regarding Alzheimer’s Disease: A Narrative Review
Previous Article in Journal
Prevalence of Frailty in Surgical Older Patients and Its Impact on Assisted Discharge
 
 
Journal of Gerontology and Geriatrics is published by MDPI from Volume 74 Issue 1 (2026). Previous articles were published by another publisher in Open Access under a CC-BY (or CC-BY-NC-ND) licence, and they are hosted by MDPI on mdpi.com as a courtesy and upon agreement with Pacini Editore.
Article

Sarcopenia Prevalence and Its Correlations with Age-Related Disorders Among Community-Dwelling Palestinian Older Adults

by
Manal Badrasawi
1,*,
Alaa Jarradat
2,
Zaheera Khodour
2,
Razan Lahaleh
2 and
Alma Irshaied
1
1
Nutrition and Food Technology, Faculty of Agriculture and Veterinary Medicine, An-Najah National University, Nablus, Palestine
2
Nutrition and health research group, healthy and therapeutic nutrition program, Faculty of Applied Sciences, Palestine Polytechnic University, Hebron, Palestine
*
Author to whom correspondence should be addressed.
J. Gerontol. Geriatr. 2020, 68(3), 126-135; https://doi.org/10.36150/2499-6564-377

Submission received: 5 August 2019 / Accepted: 10 October 2019 / Published: 15 July 2020

Background & aims

Sarcopenia is an age-related disorder characterized by gradual loss of muscle mass and strength. It has considerable prevalence and health implications among older adults. This study aims to determine the prevalence of Sarcopenia and its correlation with age-related disorders among community-dwelling older adults in two rural areas in Hebron city, Palestine.

Methods

A cross-sectional survey design was utilized to analyze data collected from 145 participants (72 males and 78 females) aged ≥ 60 years old. The EWGSOP criteria were used to define Sarcopenia, and the anthropometric measurements, body composition and Mini-Nutritional Assessment were used to assess participants’ nutrition status. The functional status assessment was done based on daily living activities and instrumental activity of daily living; the cognitive function was assessed using the validated Arabic version of MoCA-B; and screening for depressive symptoms was done using the Arabic version of GDS-15.

Results

Sarcopenia prevalence was 26.9%, significantly higher among men 35.7% compared to women 18.7%. Sarcopenia was associated with higher BMI, lower cognitive function, lower functional status, and a higher score of depressive symptoms (p < 0.05).

Conclusions

Sarcopenia has a considerable prevalence among the study sample, and it is associated with nutritional status, impaired functional status and cognitive status. The study recommends further research utilizing different study designs (quantitative and qualitative) to determine the prevalence of Sarcopenia, causes and risk factors in other areas of Palestine.
Key words:
sarcopenia; prevalence; Palestinian older adults; age-related disorders

INTRODUCTION

Age demographic shift is a current global challenge. The world population is aging in both developed and developing countries at different rates. The global projections indicate an expected increase in ≥ 65 year older adults from 9% in 2018 to 16% by 2050 1. Hussein and Ismail (2017) have reported an inverted demographic pyramid with a rate growing faster in developing regions including Middle East and North Africa (MENA) than developed regions; with an expectation that some of MENA countries will have more older people than children by the end of 2050 2. This change in age structure has important implications of age-related disorders such as frailty, Sarcopenia and cognitive impairment, which are associated with serious health ramifications including a higher risk of falls, increased morbidities and dependencies due to disabilities and an increased in mortality rate 3.
Sarcopenia is one of the main age-related conditions characterized by involuntary loss of skeletal muscle mass, strength and physical performance 4, and often accompanied by other changes in body composition like increase in body fat. It is also linked to increased risk of falls, morbidity and low physical activity leading to lower quality of life in addition to other adverse health outcomes such as disability, a longer stay in hospitals and mortality 5. In other words, Sarcopenia has primary and secondary risk factors. The former affect muscle protein turnover, physiological changes affecting the number of muscle satellite cells and motor neurons, decreased secretion of hormones like (human growth hormone, testosterone and ghrelin), reduced appetite leading to anorexia and increased production of inflammatory markers 6. The secondary risk factors are predominantly nutrition and lifestyle-related like physical inactivity leading to muscle hypotrophy, vitamin D deficiency and low intake of branched-chain amino acids that affect the muscle function 7.
The geriatric literature has reported physical frailty and Sarcopenia as geriatric syndromes which both of them are defined by the decline in muscle mass and muscle performance and fatigue 8. While cognitive frailty which is the cognitive decline among older adults can be a reason or complication of physical frailty, as both of them can be a cause for each other 8. Another important age-related syndrome is described as Sarcopenic-obesity, which is the presence of Sarcopenia in combination with obesity due to biological changes favoring fat deposition and loss of muscle mass 9. Other links between Sarcopenia and age-related disorders (cancer, COPD, Sarco-osteoporosis and Alzheimer disease) were found. These interrelationships could be due to their similar risk factors (i.e. increased inflammation state, hormonal and metabolic changes, physical inactivity and malnutrition 10.
It is worth to highlight that global prevalence rates of Sarcopenia greatly vary due to many factors including different population characteristics, assessment methods, different definitions and different cut-off points used in the diagnosis process 4. In recent meta-analysis, the overall Sarcopenia prevalence was 10% in both men and women 11. Using two different definitions of Sarcopenia in same population, the prevalence rates were different and ranged from 1 to 29% 12. In another study among community older adults the prevalence of Sarcopenia was 17.4%, but the prevalence was 32.8% among institutionalized persons from the same country, which means the sample characteristics affect the prevalence rate 13.
Though Palestine is considered as a young population in general, aging rates are increasing, with the current elderly population reaching 3.2% of which 3.6% are living in West Bank and 2.8% in Gaza strip 14. Furthermore, research in the field of geriatrics is a deficit in the Middle East in general and especially in Palestine. This shows the need to study the determinants of health for this age group to find the basis for future interventional studies that help reduce the co-morbidities. Therefore, this study aims to determine the Sarcopenia prevalence and its correlation with age-related disorders among community-dwelling older adults in two rural areas in Hebron city, Palestine.

MATERIALS AND METHODS

STUDY DESIGN

This cross-sectional study was carried out in two villages: Se’ar and Bani Na’em, Hebron governance, in the south of the West Bank, Palestine. It was conducted between February and April 2019. The random sampling procedure was used to recruit 130 participants using Cochran’s (1963) equation for prevalence studies. The prevalence of Sarcopenia was taken from similar previous study 15 who found Sarcopenia prevalence (15.5%). The sample size was increased to 150 participants considering the possible drop out. However, 5 were excluded due to missing data, and finally 145 participants (72 men and 78 women) were included in the final analysis with a 96% response rate.
The inclusion criteria were individuals aged 60 or above, living in the selected areas and agreed to take part in the study. Whereas the exclusion criteria were the presence of acute illness on the days of data collection, current fractures of extremities, having medical conditions that may limit their ability to perform the tests (such as patients with cachexia, sever edema or ascites) and dementia. The researcher verbally informed all the participants about the objectives of the study and gave them written informed consents. Only the participants who signed the consent form included in the study.

COLLECTED DATA AND STUDY INSTRUMENTS

The research team used a pretested, structured questionnaire to collect the data from the participants face to face. The collected data included participants’ sociodemographic (i.e. gender, marital status, educational level, monthly income, working status, living status, medical history included the self-reported presence of 15 chronic diseases in addition to previous surgery and fall history, nutritional status assessment, functional status assessment, cognitive function, and mental health.
Sarcopenia was defined using the revised EWGSOP (European Working Group on Sarcopenia in Older People), where Sarcopenia diagnosis depends on low muscle mass and either low muscle strength or low physical performance. The cut-off points of skeletal muscle index, handgrip and gate speed were used as reported by Cruz-Jentoft and his collegues (2018) 16. The nutritional status assessment was done using anthropometric measurements, body composition, diet intake and screening for malnutrition risk. Anthropometric indices including (weight, height, mid-upper arm circumference (MUAC), waist circumference (WC), hip circumference (HC) and calf circumference (CC) were used to examine the nutritional status of the subjects according to the standard anthropometric procedures described by Lee & Nieman (2007) 17. The height measure was performed using a measuring tape. Body weight was measured using a calibrated electronic sensor scale. Body mass index was calculated as (body in kilogram divided by height squared in meter (kg/m2).
Waist and hip circumferences were measured using a flexible, non-extensible measuring tape. Mid upper arm circumference (MUAC) was measured on the right hand and used to identify subjects with muscle wasting due to malnutrition according to the following cut-off points: < 23 cm for men, and < 22 cm for women. Calf circumference was measured using a measuring tape; and muscle wasting was defined using the following cut-off points: < 30.1 cm for men, and < 27.3 cm for women 17. Body composition analysis was performed using full-body sensor BIA (OMRON HBF-514C) to obtain fat mass, fat percentage, fat-free mass, soft lean mass, skeletal muscle mass, and basal metabolic rate.
Physical function assessment was performed by functional status assessment using ADL and IADL. Physical fitness was done using senior fitness tests. The senior fitness test is one of the tools being used in standard fitness assessment for older adults. It is a comprehensive assessment instrument that provides continuous scale measures. In this study the following tests were chosen for physical fitness assessment of the participants: handgrip for upper body strength; 30 seconds chair stand test for lower body strength; back scratch test for upper body flexibility; set and reach for lower body flexibility; 8-ft time up and go for balance; 2-minute step test to assess cardiovascular fitness and endurance; and gait speed. The activity of daily living was assessed using the Katz index scale; and instrumental activity of daily living was assessed using the Lawton scale.
To assess depressive symptoms, a 15-item Geriatric Scale for Depression (GDS-15) was used. This scale was validated with 84% sensitivity and 95% specificity 18. The Arabic version of Montreal Cognitive Assessment – Basic (MoCA-B) developed to facilitate the detection of mild cognitive impairment in illiterate and lower educated subjects was used. The MoCA-B assesses similar cognitive domains as the original MoCA including executive functions, language, orientation, calculations, conceptual thinking, memory, visual-perception, attention, and concentration. It is a 30-point score scale where a score below 24 suggests mild cognitive impairment.

STATISTICAL ANALYSIS

The Statistical Package for the Social Sciences SPSS TM, version 21 was used to analyze the collected data, 5% alpha level and 80% power were considered in all of the statistical tests. Descriptive analysis including the means and the standard deviations were used to analyze the continuous data. The categorical data were described by percentages. The Independent Samples t-test was used to determine the significant differences in the mean scores of nutritional status, cognitive function and physical function variables between males and females. The prevalence of Sarcopenia was presented in percentages. The association between Sarcopenia and independent categorical variables (i.e. gender, marital status, educational level and medical history) was carried out using the Chi-square test. The independent samples t-test was conducted to examine the relationship between participants with Sarcopenia with normal participants in the following variables: body mass index, body composition indices and physical function tests. Further analysis was done using hierarchal binary logistic regression between Sarcopenia as the dependent variable and socio demographic variables (medical history and nutritional status) to determine if these variables are significant predictors of Sarcopenia. The variables with significant p value (i.e. age, gender and malnutrition) were included in multivariate analysis using binary logistic regression.

RESULTS

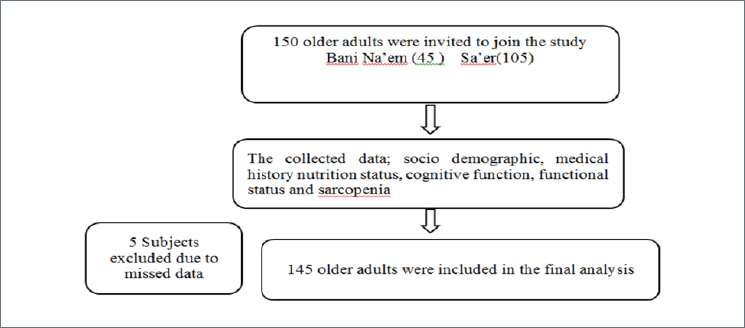
The study participants were selected from two villages in Hebron district, namely Sa’er and Bani Na’em. One hundred and forty five (145) participants out of 150 were included in the final analysis. Five 5 were excluded due to missing of primary data as shown in Figure 1. The mean age was 69.5 ± 5.7 years, ranged from 60-90 years old.
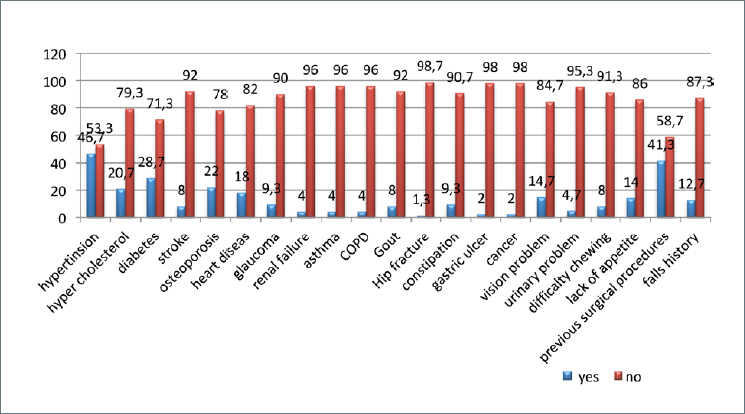
Table I shows the participants’ demographic information presented in numbers and percentages. The females composed the majority of the study sample (78%). The majority were married (70.3%); primary educated (64%); does not work (84%); and non-smoker (66%); and living with family (96.6%). Around half of the participants (57.7%) were able to read; (51.2%) to write and (51%) able to calculate. The results of the medical history revealed a considerable prevalence of cardiovascular diseases among the participants (46.5% with Hypertension and 28.7% with diabetes) as shown in Figure 2.
The nutritional status, physical and cognitive function profile based on gender is presented in Table II and Table III. Generally, (32.3%) had normal weight; (34.7%) were overweight; whilst (37.3%) were obese. According to Mini nutrition assessment MNA, (2%) were malnourished; (17.3%) were at risk of malnutrition; whilst the majority (80%) were well-nourished.
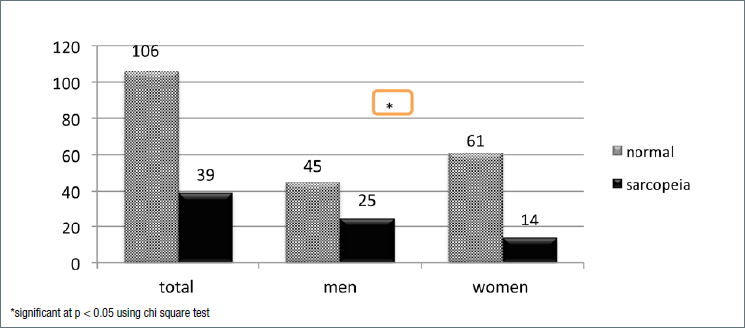
Overall, Sarcopenia prevalence was (26.9%), with a significantly higher prevalence among men (35.7%) compared to women (18.7%). Among the sociodemographic variables, only male gender was associated with Sarcopenia [OR = 1.91 (95%, CI= 1.1-3.3, p < 0.05)] (Fig. 3). The mean age of Sarcopenic participants (70.8 ± 6.4) which was significantly higher compared with the mean age of normal participants (68.3 ± 5.3), p < 0.05 using the independent samples t-test.

NUTRITIONAL STATUS AND SARCOPENIA

The results of the nutritional status profile based on Sarcopenia are presented in Table IV. The means of BMI and PBF were significantly higher in participants with Sarcopenia compared to normal ones (p < 0.05). These values were different according to gender; only females with Sarcopenia showed significant higher means of BMI and PBF. On the other hand, BMR showed a significant difference among the groups. The participants with Sarcopenia scored BMR lower means compared to normal males only. Table V also showed Sarcopenia risk factors using multivariate analysis (binary logistic regression). The results revealed that male gender, being obese, being malnourished and older age (> 70 years) were non-significant risk factor of Sarcopenia using binary logistic regression.

PHYSICAL AND COGNITIVE FUNCTIONAL PERFORMANCE BASED ON SARCOPENIA STATUS

As shown in Table IV, all the physical function tests had significant relationships (p < 0.05) based on Sarcopenia status. Participants with Sarcopenia had a lower physical function performance compared to normal ones. With respect to ADL and IADL scores, the significant lower score was reported only among participants in IADL. Whereas the cognitive function, MOCA scores were higher in normal participants compared to participants with Sarcopenia; however, the difference reached a significant level among male participants (p < 0.05). Finally, the male participants with Sarcopenia recorded significant higher score of depressive symptoms compared to normal ones (p < 0.05); whilst the difference was not significant among female participants.

DISCUSSION

Literature on Sarcopenia has reported different prevalence of Sarcopenia due to certain reasons; among them are using different cut-off points, samples’ mean age and sampling methods. In the current study, Sarcopenia prevalence is 26.9%, with a significant higher prevalence for men than women (35.7 and 17.3% respectively). This is consistent with other studies where prevalence ranged from 20 to 30%. For instance, Yamada et al. (2013) reported a prevalence of 21.8% in men and 22.1% in women, with men showing higher prevalence with increasing age in Japan 19. A prevalence of 18.6% in elderly women and 23.6% in elderly men was reported in Taiwan 20, and 24.3% in Berlin, Germany 21.
In order to compare the prevalence of Sarcopenia across countries, participants’ age is a considerable covariant because each country has different life expectancy (older participants). Similarly, the definition of older adults may vary from country to country. In Western countries, for instance, 65 years old and above consider as older adults 22, while in other Eastern countries it is 60 years old 23. Therefore, Sarcopenia prevalence is expected to have higher prevalence in European countries as they have longer life expectancy 22.
The current study evaluated participants’ nutritional status with Sarcopenia using different means including Anthropometric measurements, body composition analysis, and MNA-SF. The analyses showed, first, only 2% were malnourished according to the MNA-SF. Second, Sarcopenia was significantly associated with higher BMI and PBF only in female participants indicating the possible presence of Sarcopenic obesity. Third, Sarcopenic males were more likely to have lower BMR levels. The prevalence of malnutrition among elderlies varies in different research papers due to many factors including using different cut-off points, assessment malnutrition tools, study population and setting 24. A study conducted in Lebanon reported malnutrition rates 2.8% and risk of malnutrition 45.5% 6; whereas in Iran level of malnutrition 9.2% was reported 25 though both studies used the same assessment tool (MNA-SF). The globally malnutrition prevalence among older adults ranged from 2-38% 24.
Age is associated with changes in body composition for both males and females. These changes affect fat mass (FM) and fat-free mass (FFM) 5, and lead to reduction in height that may affect the results of BMI 26. In the current study, Sarcopenia was significantly associated with higher BMI and PBF levels in female participants suggesting Sarcopenic obesity, which is linked to numerous health and physical disabilities 27. He et al. (2018) reported the same finding. Another finding documented in this study is the significant association between Sarcopenia and lower BMR rates in male participants. This could be explained by the physiological changes resulting in lower FFM in addition to other metabolic changes (Henry, 2000), accompanied with changes in lifestyle activities 28.
The ability to carry out daily activities and live independently are important factors to improve the quality of life for older adults and can predict adverse health outcomes and mortality 29. Both physical and cognitive impairment were studied in the light of their relationship with low muscle mass and low muscle function. A self-reporting American study in 2011 indicated that 2.6 million older adults reported dual impairment in both cognitive and physical function 30.
This study reported lower scores of Sarcopenic participants in physical function performance; however; only IADL showed a significant relationship with Sarcopenia (p < 0.05). This finding is not in accordance with previous studies. Tanimoto et al. (2013) reported in a two-year cohort study that Sarcopenia was significantly associated with physical disabilities and higher dependency in ADL in both men and women 31. While in Turkey almost different findings were reported, they found no correlation between Sarcopenia and ADL or IADL; however, there was a weak correlation between IADL and FFM in male participants 32. These inconsistent results may be explained by the findings from a study conducted by Alexandre et al. (2014) who studied comprehensively the relationship between Sarcopenia and functional status. They reported that Sarcopenia is a risk factor of dependency. From physiological point of view, loss of muscle mass and function lead to a decrease in functional status, which will lead to some level of dependency according to the degree of muscle loss. Meaning that, the non-significant relationship between Sarcopenia and ADL or IADl may indicate presence of level of functional impairment without reaching the significant level. The type of statistical analysis and the cut-off points used define the dependency are also different in studies 33. This study reported the mean difference between Sarcopenia with ADL and IADL total score. The result might differ if another cut-off point was used; and if the ADL and IADL were treated as categorical variables and different analyses were used.
The results of this study also showed a significant relationship between Sarcopenia and cognitive function, evidenced by lower MoCA score among Sarcopenic male participants compared to normal ones. It was reported that sarcopenic subjects were found six times more likely to have cognitive and physical impartment 34. On the other hand, a study conducted in France found no clear association between Sarcopenia and cognitive impairment in women 35. The significant relationship between Sarcopenia and impaired cognitive function can be extrapolated from the relationship between cognitive function and low fitness level. It was reported that low gait speed is associated with cognitive impairment and the decrease in the physical function is parallel to the decrease in cognitive function in aging 36. Considering Sarcopenia definition as muscle function loss indicated by low gait speed and low hand grip, it is expected that Sarcopenia is associated with cognitive impairment.
Gender disparities with cognitive decline in advanced age were documented in different studies. Some showed that females had a significantly better cognitive performance 37 while others showed absence of gender differences 38. To better understand these results, it is stressed to use the same inclusion criteria and standardized assessment methods. The different results between males and females in the present study may be explained by the small sample size of participating males, and the mean age for males older than the females’.
Depression is a wide spectrum disorder that ranges in severity and duration. Globally recognized as a single largest contributor to non-fatal health loss according to WHO. It is characterized by signs and symptoms like poor appetite, sadness, loss of interest, low self-satisfaction and disrupted sleep 37. Our findings revealed a significant relationship between male Sarcopenic participants and a higher score of depressive symptoms. This result is similar to previous cross-sectional studies in China 37 and Turkey 39 using the same assessment tools. These consistent results suggest a similar underlying mechanism; however, the causal relationship has not yet fully understood. Different theories are proposed to explain the relationship between depressive symptoms and sarcopenia; like the presence of pro-inflammatory markers like cytokines, interleukin-6 and tumor necrosis-alpha which were associated with increased depressive symptoms, decreased muscle mass and strength 40. Previous studies have not highlighted gender differences with depressive symptoms in Sarcopenic populations; nonetheless, our results showed only males to have a significant association between depressive symptoms and Sarcopenia. This may be attributed to the small sample size, or other confounding factors affecting males in particular like higher smoking levels.

CONCLUSIONS AND RECOMMENDATIONS

The present study reported 26.9” Sarcopenia prevalence in community-dwelling older adults, with significant association with male gender. Sarcopenia is also associated with reduced physical function and increase in the percentage of body fat. This study recommends enhancing the physical function of the older adults through life style educational programs that promote exercise habits and healthy body weight. Similar research could be carried out on larger sample size, and other researches utilizing the longitudinal design to determine cause and effect relationship between sarcopenia, nutrition and other age related disorders. There is a need to validate local cut-off points for Sarcopenia definition among the Palestinian population.

LIMITATIONS

The findings of this study should be seen in light of its limitations that could be addressed in future research. First, the cross-sectional survey design is often used to determine relationships, not to determine cause and effect. The sample size is not balanced between males and females and is limited to one geographical area in Palestine (i.e. two villages in Hebron City). Therefore, results cannot be generalized. In addition, using of the European cut-off points (skeletal muscle, hand grip and gait speed) may over or under estimate the prevalence of Sarcopenia.

Figures and tables

Figure 1. Subjects recruitment flow-chart.
Jgg 68 00126 g001
Figure 2. Medical history of the participants.
Jgg 68 00126 g002
Figure 3. Sarcopenia prevalence.
Jgg 68 00126 g003
Table I. Subjects characteristics presented in numbers and percentages.
Demographic characteristicsValueTotal number (n)Percentage (%)
GenderMale
Female
70
75
48.3
51.7
Age< 70 years
> 70 years
95
50
65.5
34.5
Marital statusSingle
Married
Widow
22
102
21
15.2
70.3
14.5
Level of educationPrimary
Secondary
Diploma
University
Others
65
25
3
9
43
44.8
17.2
2.1
6.2
29.7
Living statusLive with family
Live alone
140
5
96.6
3.4
Work statusWorking full time
Working part time
Not working
Retired
30
28
80
7
20.7
19.3
55.2
4.8
Income500-1500
1501-3000
3001-5000
55
79
16
35.9
51.6
10.5
Table II. Participants nutritional status, cognitive and physical function profile according to gender.
Male
(n = 70)
Female
(n = 75)
P-value
Nutritional statusBMI27.5 ± 4.430.6 ± 7.520.004
MUAC34.5 ± 3.434.8 ± 3.40.123
W: Hip ratio1.1 ± 1.030.98 ± 0.10.234
Calf circumference33.1 ± 5.333.6 ± 6.70.324
No of meals/day4.2 ± 1.043.8 ± 1.240.073
Body compositionPercentage of body fat39.8 ± 7.341.5 ± 5.100.78
Skeletal muscle mass17.4 ± 5.414.5 ± 2.90.001*
BMR1700 ± 2001600 ± 2200.047*
MNA---
Cognitive functionMOCA17.7 ± 3.514.5 ± 2.60.001*
Depression symptomsGDS5 ± 3.145 ± 2.570.865
Functional statusADL2.1 ± 2.691.8 ± 2.510.521
IADL5.4 + 1.375.5 + 2.090.774
Physical fitness2 min step test126.4+38.798.1+50.60.001*
TUG15.2 + 5.920 + 18.80.044*
Hand grip24.7 + 10.718.6 + 7.020.001*
Back scratch test26.6 + 17.533.5 + 19.10.034*
Set and reach3.3 + 3.93.7 + 4.90.549
Chair stand test17.5 + 11.619.6 + 15.060.365
Gate speed7.06 + 5.138.76 + 6.90.097
Rapid gate7.7 + 3.78.5 + 6.10.331
*significant p < 0.05 using independent t-test; BMI: body mass index; MUAC: mid upper arm circumference; WC: waist circumference; HC: hip circumference; CC: calf circumference; PBF: percentage of body fat; BMR: basal metabolic rate; MOCA: Montreal cognitive assessment; ADL: activity of daily living; IADL: instrumental activity of daily living; GDS: Geriatric depression scale; 2 min.st: 2 minutes step test; TUG: time up and go; BST: back scratch test; CSR: chair set and reach test; CST: chair stand test, RP: rapid pace.
Table III. Differences in anthropometric measurements, body composition and basal metabolic rate according to sarcopenia status and gender (mean ± SD).
WomenMenTotal
NormalSarcopeniaNormalSarcopeniaNormalSarcopenia
BMI29.64 ± 7.29*35.03 ± 7.1827.03 ± 3.6928.56 ± 5.39* 28.5 ± 6.830.8 ± 6.77 *
MUAC35.19 ± 10.1034.85 ± 2.7133.44 ± 2.9335.28 ± 3.3735.1± 3.1234.2 ± 3.8
WC117.82 ± 17.04118.86 ± 11.37128.71 ± 183.43135.80 ± 14.67121.99 ± 119.73125.6 ± 13.73
HC121.64 ± 18.11120.50 ± 25.87113.51 ± 16.85117.88 ± 15.37118.18 ± 17.96118.82 ± 19.49
CC36.98 ± 7.0732.29 ± 4.2133.91 ± 5.1931.48 ± 5.4333.37 ± 6.3333.20 ± 5.49
W: H ratio0.98 ± 0.0951.002 ± 0.141.05 ± 1.291.15 ± 0.0901.03 ± 0.841.05 ± 0.113
PBF38.88 ± 10.66 **48.72 ± 6.0438.77 ± 46.2040.18 ± 8.7440.25 ± 30.9841.96 ± 9.33
BMR1631.58 ± 245.751618.64 ± 150.551763.86 ± 144.10 *1630.12 ± 182.091695.36 ± 208.211706.10 ± 182.09
*p < 0.05 using Mann-Whitney test
**p < 0.01 using Mann-Whitney test; BMI: body mass index; MUAC: mid upper arm circumference; WC: waist circumference; HC: hip circumference; CC: calf circumference; PBF: percentage of body fat; BMR: basal metabolic rate.
Table IV. Physical and cognitive function characteristics according to sarcopenia status and gender (mean ± SD).
WomenMenTotal
NormalSarcopeniaNormalSarcopeniaNormalSarcopenia
MOCA18.75 ± 4.3917.64 ± 4.4120.31 ± 5.07 *17.52 ± 5.57 *18.26 ± 4.9917.56 ± 5.12
ADL1.07 ± 2.662.07±1.641.62 ±2.593.17 ± 2.641.87 ±2.622.39 ± 2.52
IADL5.76 ± 1.924.46 ± 2.57 *5.49 ± 1.125.36 ±1.755.64 ± 1.635.05 ± 2.08
GDS5.1 ± 2.74.8 ± 1.74.4 ± 3.2 *6.1 ± 2.74.8 ± 2.95.6 ± 2.4
2 min.st108.57 ± 45.5752.57 ± 47.79 **136.04 ± 35.51109.12 ± 38.89 **120.23 ± 43.6088.82 ± 49.91 **
TUG20.87 ± 16.0919.79 ± 28.8316.71 ± 4.3614.20 ± 8.0017.67 ± 12.7417.84 ± 18.15
BST31.13 ± 18.8043.23 ± 17.87 *21.74 ± 13.2935.25 ± 20.89 **26.97 ± 17.1638.05 ± 20.09 **
CSR3.54 ± 4.874.71 ± 5.122.84 ± 3.624.31741 4.160 ±3.24 ± 4.374.35 ± 4.56
CST9.82 ± 16.458.64 ± 6.407.91 ± 13.266.92 ± 8.1909.09 ± 15.14 *7.53 ± 7.55
RP9.16 ± 6.65*6.07 ± 1.387.88 ± 3.717.50 ± 3.818.62 ± 5.60 *6.97 ± 3.19
*p < 0.05 using Mann-Whitney test
**p < 0.01 using Mann-Whitney test; MOCA: Montreal cognitive assessment; ADL: activity of daily living; IADL: instrumental activity of daily living; GDS: Geriatric depression scale; 2 min.st: 2 minutes step test; TUG: time up and go; BST: back scratch test; CSR: chair set and reach test; CST: chair stand test; RP: rapid pace.
Table V. Sarcopenia risk factor - multivariate analysis.
FactorsP-valueExp (B)CIP-value
Male gender0.0281.1(1.09-7.19)0.227
Age > 700.0651.2(0.85-1.19)
Being obese (BMI > 30)0.0731.001(1.22-3.84)
Malnourished0.171.98(0.27-1.89)
Not significant using binary logistic regression analysis.

ACKNOWLEDGMENT

We would like to acknowledge the students who helped the researchers in the data collection. We would like to express our gratitude to the Palestinian older adults who agreed to participate in this study. Thanks are also to all co-researchers and fieldworkers involved in this study.
AVAILABILITY OF DATA AND MATERIALS
The dataset used and analyzed in this study is available from corresponding author on reasonable request.
AUTHOR CONTRIBUTIONS
The authors have contributed in the manuscript as follows; Manal Badrasawi, the principle investigator, has written the study proposal and protocol and drafted the research paper. Alma Irshaid has the responsibility for the research data management and final manuscript writing. Alaa Zaheera and Razan have helped in the proposal writing, data collection, data entry, data analysis and written the literature review. All authors have read and approved the final manuscript.
ETHICS APPROVAL AND CONSENT TO PARTICIPATE
This project acquired an ethical approval from the Deanship of Scientific Research Ethical Committee in Palestine Polytechnic University. Informed written and verbal consents have been collected from all participants prior to data collection.

References

  1. WHO. World population data sheet with focus on changing age structures – population reference Bureau WHO 2019.
  2. Hussein S, Ismail M. Ageing and elderly care in the Arab region: policy challenges and opportunities. Ageing Int 2017;42:274-89. https://doi.org/10.1007/s12126-016-9244-8. 10.1007/s12126-016-9244-8
  3. Muscaritoli M, Anker S, Argiles J, et al. Consensus definition of sarcopenia, cachexia and pre-cachexia: joint document elaborated by Special Interest Groups (SIG)”cachexia-anorexia in chronic wasting diseases” and “nutrition in geriatrics”. Clinical Nutr 2010;29:154-9. https://doi.org/10.1016/j.clnu.2009.12.004. 10.1016/j.clnu.2009.12.004
  4. Morley JE, Baumgartner RN, Roubenoff R, et al. Sarcopenia. J Lab Clin Med 2001;137:231-43. https://doi.org/10.1067/mlc.2001.113504. 10.1067/mlc.2001.113504
  5. Ribeiro SM, Kehayias JJ. Sarcopenia and the analysis of body composition. Adv Nutr 2014;5:260-7. https://doi.org/10.3945/an.113.005256. 10.3945/an.113.005256
  6. Mitri R, Boulos C, Adib SM. Determinants of the nutritional status of older adults in urban Lebanon. Geriatr Geront Int 2017;17:424-32. https://doi.org/10.1111/ggi.12732. 10.1111/ggi.12732
  7. Cuervo M, García A, Ansorena D, et al. Nutritional assessment interpretation on 22 007 Spanish community-dwelling elders through the Mini Nutritional Assessment test. Public Health Nutr 2009;12:82-90. https://doi.org/10.1017/S136898000800195X. 10.1017/S136898000800195X
  8. Cesari M, Landi F, Calvani R, et al. Rationale for a preliminary operational definition of physical frailty and sarcopenia in the SPRINTT trial. Aging Clin Experiment Res 2017;29:81-8. https://doi.org/10.1007/s40520-016-0716-1. 10.1007/s40520-016-0716-1
  9. Henry C. Mechanisms of changes in basal metabolism during ageing. Eur J Clin Nutr 2000;54:S77. https://doi.org/10.1038/sj.ejcn.1601029. 10.1038/sj.ejcn.1601029
  10. Beaudart C, Rizzoli R, Bruyère O, et al. Sarcopenia: burden and challenges for public health. Arch Public Health 2014;72:45. https://doi.org/10.1186/2049-3258-72-45. 10.1186/2049-3258-72-45
  11. Shafiee G, Keshtkar A, Soltani A, et al. Prevalence of sarcopenia in the world: a systematic review and meta-analysis of general population studies. J Diabetes Metabol Disord 2017;16:21. https://doi.org/10.1186/s40200-017-0302-x. 10.1186/s40200-017-0302-x
  12. Patil R, Uusi-Rasi K, Pasanen M, et al. Sarcopenia and osteopenia among 70-80-year-old home-dwelling Finnish women: prevalence and association with functional performance. Osteoporosis Int 2013;24:787-96. https://doi.org/10.1007/s00198-012-2046-2. 10.1007/s00198-012-2046-2
  13. Bastiaanse LP, Hilgenkamp TI, Echteld MA, et al. Prevalence and associated factors of sarcopenia in older adults with intellectual disabilities. Res Develop Disab 2012;33:2004-12. https://doi.org/10.1016/j.ridd.2012.06.002. 10.1016/j.ridd.2012.06.002
  14. PCBS. On the occasion of the international Population Day, 2018.
  15. Yakout SM, Alkahtani SA, Al-Disi D, et al. Coexistence of pre-sarcopenia and metabolic syndrome in Arab men. Calcified Tissue Int 2019;104:130-6. https://doi.org/10.1007/s00223-018-0477-2. 10.1007/s00223-018-0477-2
  16. Cruz-Jentoft AJ, Bahat G, Bauer J, et al. Sarcopenia: revised European consensus on definition and diagnosis. Age Ageing 2018;48:16-31. https://doi.org/10.1093/ageing/afy169. 10.1093/ageing/afy169
  17. Lee RD, Nieman DC. Nutritional assessment: McGraw-Hill Higher Education, 2007.
  18. Prakash O, Gupta LN, Singh VB, et al. Applicability of 15-item Geriatric Depression scale to detect depression in elderly medical outpatients. Asian J Psychiatry 2009;2:63-5. https://doi.org/10.1016/j.ajp.2009.04.005. 10.1016/j.ajp.2009.04.005
  19. Yamada M, Nishiguchi S, Fukutani N, et al. Prevalence of sarcopenia in community-dwelling Japanese older adults. J Am Medl Direct Assoc 2013;14:911-5. https://doi.org/10.1016/j.jamda.2013.08.015. 10.1016/j.jamda.2013.08.015
  20. Chien MY, Huang TY, Wu YT. Prevalence of sarcopenia estimated using a bioelectrical impedance analysis prediction equation in community-dwelling elderly people in Taiwan. J Am Geriatr Soc 2008;56:1710-5. https://doi.org/10.1111/j.1532-5415.2008.01854.x. 10.1111/j.1532-5415.2008.01854.x
  21. Spira D, Norman K, Nikolov J, et al. Prevalence and definition of sarcopenia in community dwelling older people. Zeitschrift Gerontol Geriatr 2016;49:94-9. https://doi.org/10.1007/s00391-015-0886-z. 10.1007/s00391-015-0886-z
  22. Ethgen O, Beaudart C, Buckinx F, et al. The future prevalence of sarcopenia in Europe: a claim for public health action. Calcified Tissue Int 2017;100:229-34. https://doi.org/10.1007/s00223-016-0220-9. 10.1007/s00223-016-0220-9
  23. Khan A, Khan S, Khan M. Factors effecting life expectency in developed and developing countries of the world (an approach to available literature). Int J Yoga Physiother Phys Ed 2010;1:4-6.
  24. Pauly L, Stehle P, Volkert D. Nutritional situation of elderly nursing home residents. Zeitschrift Gerontol Geriatr 2007;40:3-12. https://doi.org/10.1007/s00391-007-0430-x. 10.1007/s00391-007-0430-x
  25. Gorji HA, Alikhani M, Mohseni M, et al. The prevalence of malnutrition in iranian elderly: a review article. Iran J Public Health 2017;46:1603.
  26. Ashwell M, Gunn P, Gibson S. Waist-to-height ratio is a better screening tool than waist circumference and BMI for adult cardiometabolic risk factors: systematic review and meta-analysis. Obesity Rev 2012;13:275-86. https://doi.org/10.1111/j.1467-789X.2011.00952.x. 10.1111/j.1467-789X.2011.00952.x
  27. Makizako H, Shimada H, Doi T, et al. Age-dependent changes in physical performance and body composition in community-dwelling Japanese older adults. J Cachexia, Sarcop Muscle 2017;8:607-14. https://doi.org/10.1002/jcsm.12197. 10.1002/jcsm.12197
  28. He X, Li Z, Tang X, et al. Age-and sex-related differences in body composition in healthy subjects aged 18 to 82 years. Medicine 2018;97. https://doi.org/10.1097/MD.0000000000011152. 10.1097/MD.0000000000011152
  29. Bilotta C, Bowling A, Casè A, et al. Research Dimensions and correlates of quality of life according to frailty status: a cross-sectional study on community-dwelling older adults referred to an outpatient geriatric service in Italy, 2010. https://doi.org/10.1186/1477-7525-8-56. 10.1186/1477-7525-8-56
  30. Deokar AJ, Anderson L, Adams M, et al. Functional difficulties associated with self-reported confusion or memory loss among adults aged 60 or older-21 states. Alzheimer’s Dementia 2013;9:P819. https://doi.org/10.1016/j.jalz.2013.05.1759. 10.1016/j.jalz.2013.05.1759
  31. Tanimoto Y, Watanabe M, Sun W, et al. Association of sarcopenia with functional decline in community-dwelling elderly subjects in Japan. Geriatr Gerontol Int 2013;13:958-63. https://doi.org/10.1111/ggi.12037. 10.1111/ggi.12037
  32. Bahat G, Saka B, Tufan F, et al. Prevalence of sarcopenia and its association with functional and nutritional status among male residents in a nursing home in Turkey. Aging Male 2010;13:211-4. https://doi.org/10.3109/13685538.2010.489130. 10.3109/13685538.2010.489130
  33. Alexandre TdS, Duarte YO, Santos JF, et al. Sarcopenia according to the European Working Group on Sarcopenia in Older People (EWGSOP) versus dynapenia as a risk factor for disability in the elderly. J Nutr Health Aging 2014;18:547-53. https://doi.org/10.1007/s12603-014-0465-9. 10.1007/s12603-014-0465-9
  34. Tolea MI, Galvin JE. Sarcopenia and impairment in cognitive and physical performance. Clinical Interv Aging 2015;10:663. https://doi.org/10.2147/CIA.S76275. 10.2147/CIA.S76275
  35. Abellan van Kan G, Cesari M, Gillette-Guyonnet S, et al. Sarcopenia and cognitive impairment in elderly women: results from the EPIDOS cohort. Age Ageing 2012;42:196-202. https://doi.org/10.1093/ageing/afs173. 10.1093/ageing/afs173
  36. Kennedy G, Meyer D, Hardman RJ, et al. Physical fitness and aortic stiffness explain the reduced cognitive performance associated with increasing age in older people. J Alzheimer’s Dis 2018;63:1307-16. https://doi.org/10.3233/JAD-171107. 10.3233/JAD-171107
  37. Wang H, Hai S, Liu Y, et al. Association between depressive symptoms and sarcopenia in older Chinese community-dwelling individuals. Clin Interv Aging 2018;13:1605. https://doi.org/10.2147/CIA.S173146. 10.2147/CIA.S173146
  38. Praetorius M, Thorvaldsson V, Johansson B, et al. Gender differences in cognitive performance in old age. Gero Psych 2014;27:129-34. https://doi.org/10.1024/1662-9647/a000111. 10.1024/1662-9647/a000111
  39. Kilavuz A, Meseri R, Savas S, et al. Association of sarcopenia with depressive symptoms and functional status among ambulatory community-dwelling elderly. Arch Gerontol Geriatr 2018;76:196-201. https://doi.org/10.1016/j.archger.2018.03.003. 10.1016/j.archger.2018.03.003
  40. Schaap LA, Pluijm SM, Deeg DJ, et al. Higher inflammatory marker levels in older persons: associations with 5-year change in muscle mass and muscle strength. Journals of Gerontology Series A: Biomedical Sciences and Medical Sciences. 2009;64:1183-9. https://doi.org/10.1093/gerona/glp097. 10.1093/gerona/glp097