Article

Correlation Studies of Different Decoupled Two-Scale Simulations for Lattice Structures

1
Aviation Technology Directorate, Japan Aerospace Exploration Agency, Mitaka 181-0015, Japan
2
Department of Aeronautics and Astronautics, The University of Tokyo, Bunkyo, Tokyo 113-8656, Japan
3
CAE Business Unit, Cybernet Systems Co., Ltd., Chiyoda, Tokyo 101-0022, Japan
*
Author to whom correspondence should be addressed.
Aerospace 2023, 10(8), 723; https://doi.org/10.3390/aerospace10080723
Submission received: 17 June 2023 / Revised: 9 August 2023 / Accepted: 16 August 2023 / Published: 18 August 2023
(This article belongs to the Special Issue Structural Design of Aerospace Vehicles)

Abstract

:
By deliberately designing microscopic internal mechanisms, architected materials can achieve a variety of material properties without changing constituent materials. Integration of the architected materials into a structure as substructures has a good potential to enhance structural performance and realize wide design freedom. This paper explores the capabilities of multiscale approaches for lattice structures, which is a major mechanism in architected materials. The objectives of this paper are (1) to demonstrate the capabilities of the framework to evaluate stiffness characteristics of lattice structures with two different two-scale analysis approaches and (2) to assess the accuracies and validity ranges of both approaches for appropriate evaluations of lattice structures. The two-scale analysis framework consists of the computational homogenizations for the generalized stiffness (ABD) and 3D stiffness (C) matrices. Equivalent stiffness characteristics of the unit cell are obtained by computational homogenizations to effectively capture the macroscopic responses of lattice structures. This study provides a comprehensive correlation study between the prediction accuracies of the two-scale analysis approaches in terms of tensile, bending, and torsional stiffness characteristics for practical modeling and development of lattice structures. The study will contribute a guideline for effective designs of high-performance structures with architected materials.

1. Introduction

Architected materials, sometimes called mechanical metamaterials, have been actively studied as emerging artificial materials for decades. Their distinctive characteristics, in comparison to other traditional/natural materials, can be artificially programmed by the artificial designing of microscopic internal mechanisms [1]. These materials have shown the potential to improve/extend structural performance and capabilities. Since these artificial materials usually result in complicated geometries, these conceptual designs have faced manufacturing challenges for the realization and production of the materials. However, the recent advancement in additive manufacturing (AM) technology has enabled effective realizations of sophisticated structures that had been conceptual and difficult to fabricate. Mechanical metamaterials can exhibit unique material characteristics and/or behaviors attributed to the micro/mesoscale mechanisms, such as truss or porosity, in addition to constituent material properties constructing the microscopic internal structures [2,3,4,5,6]. For instance, Bauer et al. demonstrated that these materials can realize various structural characteristics (strength, stiffness, weight, etc.) and exotic properties such as zero/negative Poisson’s ratio, ultralightweight, and high specific stiffness [7].
Applications of such materials in a macroscopic structural design would enhance the performance of aerospace structures. Architected materials, especially those based on micro/mesoscale lattice structures, provide good compatibility with the AM technique, although a variety of design concepts have been proposed in the literature [7,8,9]. However, a realization of preferred structural characteristics with structural integrity requires an elaborate design of microscale internal mechanisms in lattice structures. With the complex internal geometry of lattice-based structures, the conventional approach to evaluate the structural characteristics with the finite element method (FEM) by directly modeling designed structures is challenging. Although various topological designs can be precisely evaluated with FEM [10,11], constructions and simulations of sophisticated models with various geometries result in high costs. In the optimization of internal lattice geometry for a product, finite element models for every possible design need to be constructed even if their microscopic designs are highly complex. Moreover, a simulation of a large-scale structure with lattice-based substructures using a detailed FE model is computationally impractical since such a simulation requires sufficiently small element sizes to obtain accurate FE solutions.
The Gibson–Ashby (GA) model is an alternative approach to predicting the characteristics of cellular structures, including lattice structures [9,12,13]. The GA model evaluates the effective properties of a representative unit cell of architected materials as property fractions of constituent material, such as elastic modulus and strength, based on the relative density [7,13,14]. The technique enables simple estimations of structural properties for preliminary studies, and it is commonly used in studies of cellular or periodic structures. It is reported that the predictions of structural characteristics based on the GA model are consistent with specific experimental results [15]. Zargarian et al. reported that fatigue performance can also be predicted by the GA model [16]. However, it is sometimes difficult to identify appropriate coefficients and parameters in the GA model, which causes discrepancies in the predictions and experimental results as reported by Macona-chie et al. [9]. Also, since the GA model only provides effective material properties, microscopic mechanics for lattice structures cannot be captured, which architected materials sometimes exploit to realize unique characteristics. Theoretical equations for specific topologies have also been proposed for a further evaluation of the mechanical characteristics of lattice structures [17,18], although such a theoretical model is only valid for a target topology.
The multiscale modeling approach has been developed to evaluate the characteristics of composites by using the computational homogenization method [19,20,21,22,23,24,25,26]. Although the analysis technique originally focused on composite materials, it is reasonably applicable to heterogeneous structures such as architected materials. Therefore, the multiscale modeling approach has been accommodated to evaluate the structural characteristics of lattice-based architected materials by the authors [27]. Numerical multiscale analysis approaches for heterogeneous materials are commonly classified into two schemes: coupled [28,29,30] and decoupled schemes [25,31]. The coupled scheme has advantages in evaluations of nonlinear behaviors for which macroscopic constitutive equations are difficult to formulate. However, the computational cost increases significantly, which would be challenging in the practical design process. The decoupled scheme evaluates the discrete macroscopic stress–strain responses by performing a series of “numerical material tests”. Based on the numerical test results, the macroscale simulation is then carried out by deriving the macroscopic constitutive model and its parameters. Therefore, a cost-effective analysis can be performed for practical or large-scale structural designs such as aerospace applications [32,33,34,35]. Although it is difficult to deal with microscopic nonlinear behaviors in macroscopic structural analysis using the decoupled multiscale approach, due to its methodological nature, the decoupled scheme offers excellent effectiveness in terms of computational cost. However, as mentioned by White et al. [36], the homogenization approaches have to be employed with special care in their validity ranges and assumptions.
In our previous studies, two types of decoupled two-scale analysis schemes with homogenization methods have been developed. One is based on a homogenization for the generalized stiffness (ABD) matrix, which can be used for simulations with shell finite elements. The other is based on a homogenization for the C matrix, which can be generally used for solid finite elements. A representative unit cell of the structure with two-/three-dimensional periodicity is modeled as representative finite elements in the computational homogenization procedures. Equivalent stiffness characteristics of the representative unit cell are obtained based on the computational homogenization procedures. The equivalent structural characteristics are then used to effectively capture the macroscopic structural responses of lattice structures. Both approaches have been experimentally validated in previous works [27,31]. Although the set of two-scale analysis approaches with shell and solid elements enable efficient evaluations of various designs of architected materials, they have different advantages and limitations in finite element modeling. For example, the homogenization for the C matrix exhibits significant errors in the case of a plate with heterogeneity in the thickness direction if the plate thickness is small [26]. On the contrary, the homogenization for the ABD matrix is not suitable for thick plates as the method is based on the thin plate theory. The characteristics of homogenization for thin plates can be found in Refs. [37,38]. In addition, there are choices in the selection of the types of finite elements used in practical structural design and development depending on the geometry of the structure under development. The characteristics and limitations of the homogenization approaches should also be taken into account in the determination of the types of finite elements.
Therefore, multiscale approaches for lattice structures based on the different numerical homogenizations are further explored in this paper. The objectives of this paper are (1) to demonstrate the capabilities of the framework to evaluate stiffness characteristics of lattice structures and (2) to assess the accuracies and validity ranges of both approaches for appropriate predictions of responses of lattice structures. In the following sections, descriptions of both numerical homogenizations are first provided. A correlation study on the different multiscale approaches to effectively evaluate structural characteristics of lattice-based structures to achieve high-performance structures is then performed.

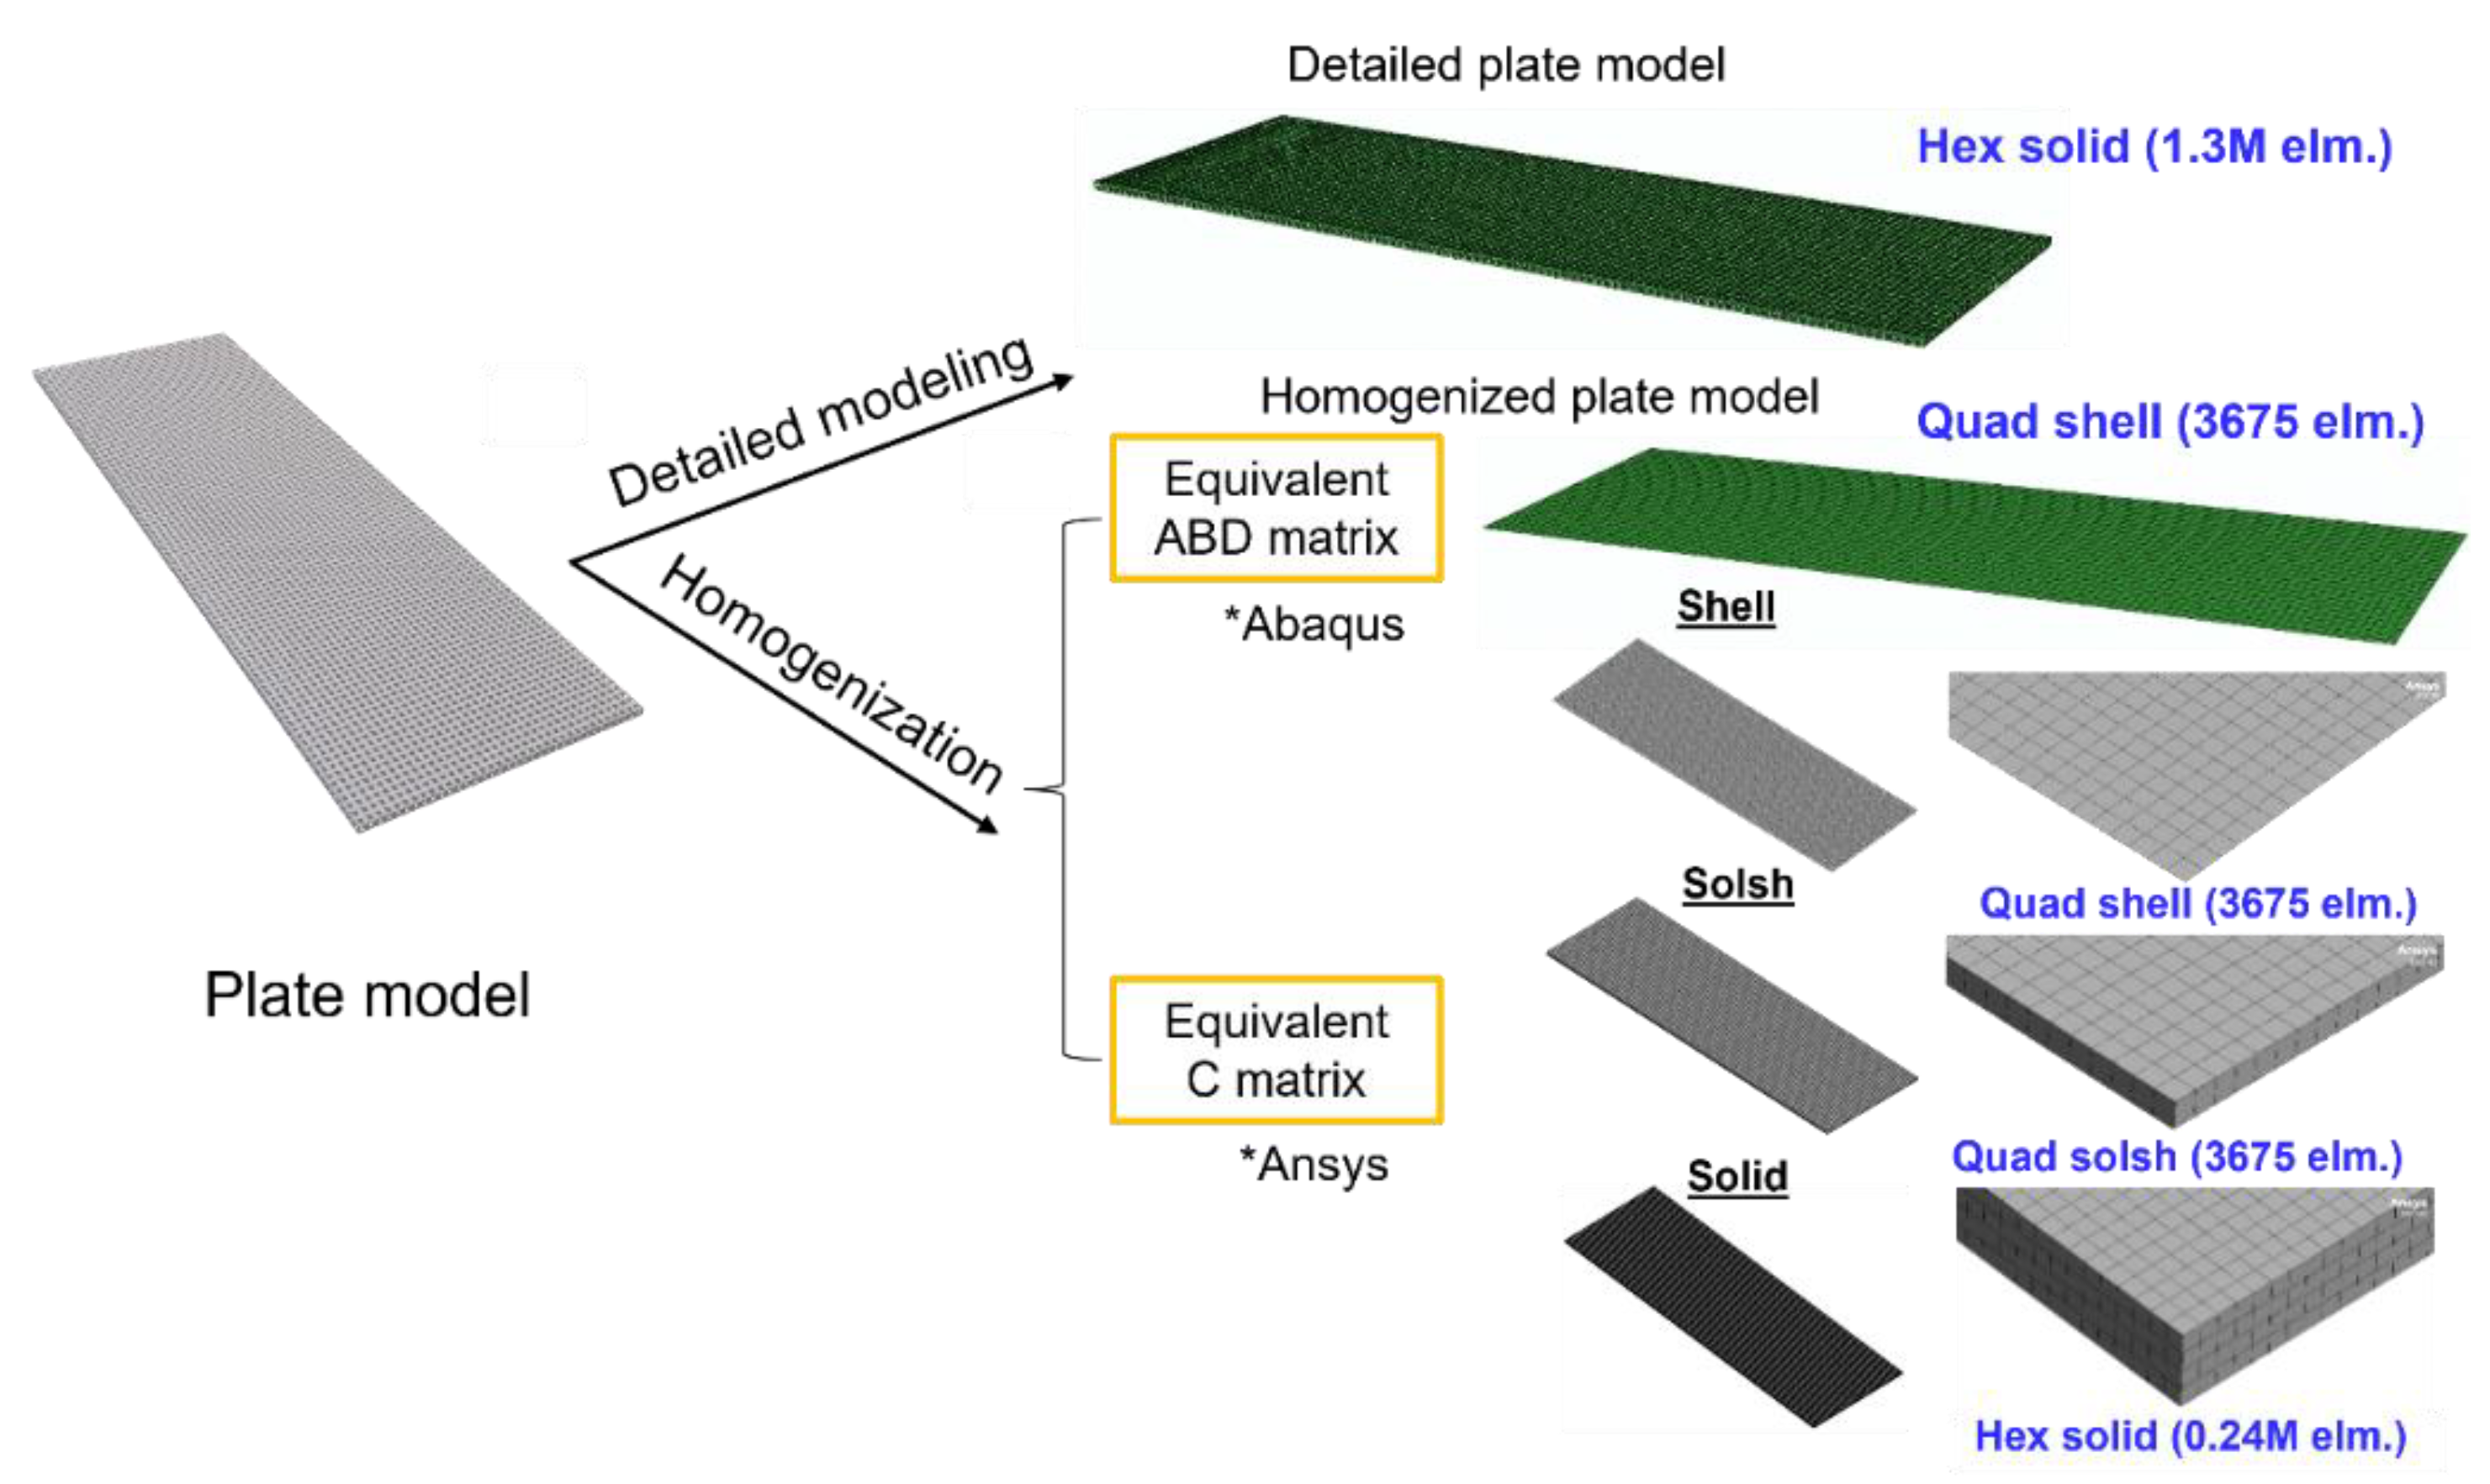
2. Numerical Procedures for Two-Scale Analysis

Descriptions of decoupled two-scale numerical procedures to evaluate the stiffness of a lattice structure are provided in this section. These procedures provide reasonable accuracy and efficiency to evaluate the properties of heterogeneous materials, which usually brings high computational costs to the modeling and simulations. Figure 1 illustrates the overview of decoupled two-scale modeling of lattice structures. Microscales and macroscales are introduced for the two-scale analysis. The microscale evaluation is performed by modeling components of the lattice with solid elements to take into account the heterogeneous characteristics of the lattice. In macroscale evaluation, the whole lattice structure is represented as a homogeneous Kirchhoff plate with shell elements or a homogeneous elastic solid with solid elements. The computational homogenization methods for plate [19,20,21,22,23,24,25,26] or solid [31] are incorporated as a scale-up approach to link the two different scales. The homogenization methods provide macroscopic equivalent stiffness of a Kirchhoff plate or elastic solid (i.e., the ABD and C matrices) based on the microscale periodic unit cell (PUC) of the lattice structure. Using an effective stiffness, a macroscopic structural simulation can be performed to evaluate the structural performance and integrity of the lattice structures. Note that the deformation of the lattice component is assumed to be small even in the macroscopic large deformation problem. In other words, the geometrical and material nonlinearities are neglected in the microscale evaluation. The formulations of the homogenization methods are summarized in the following sections.

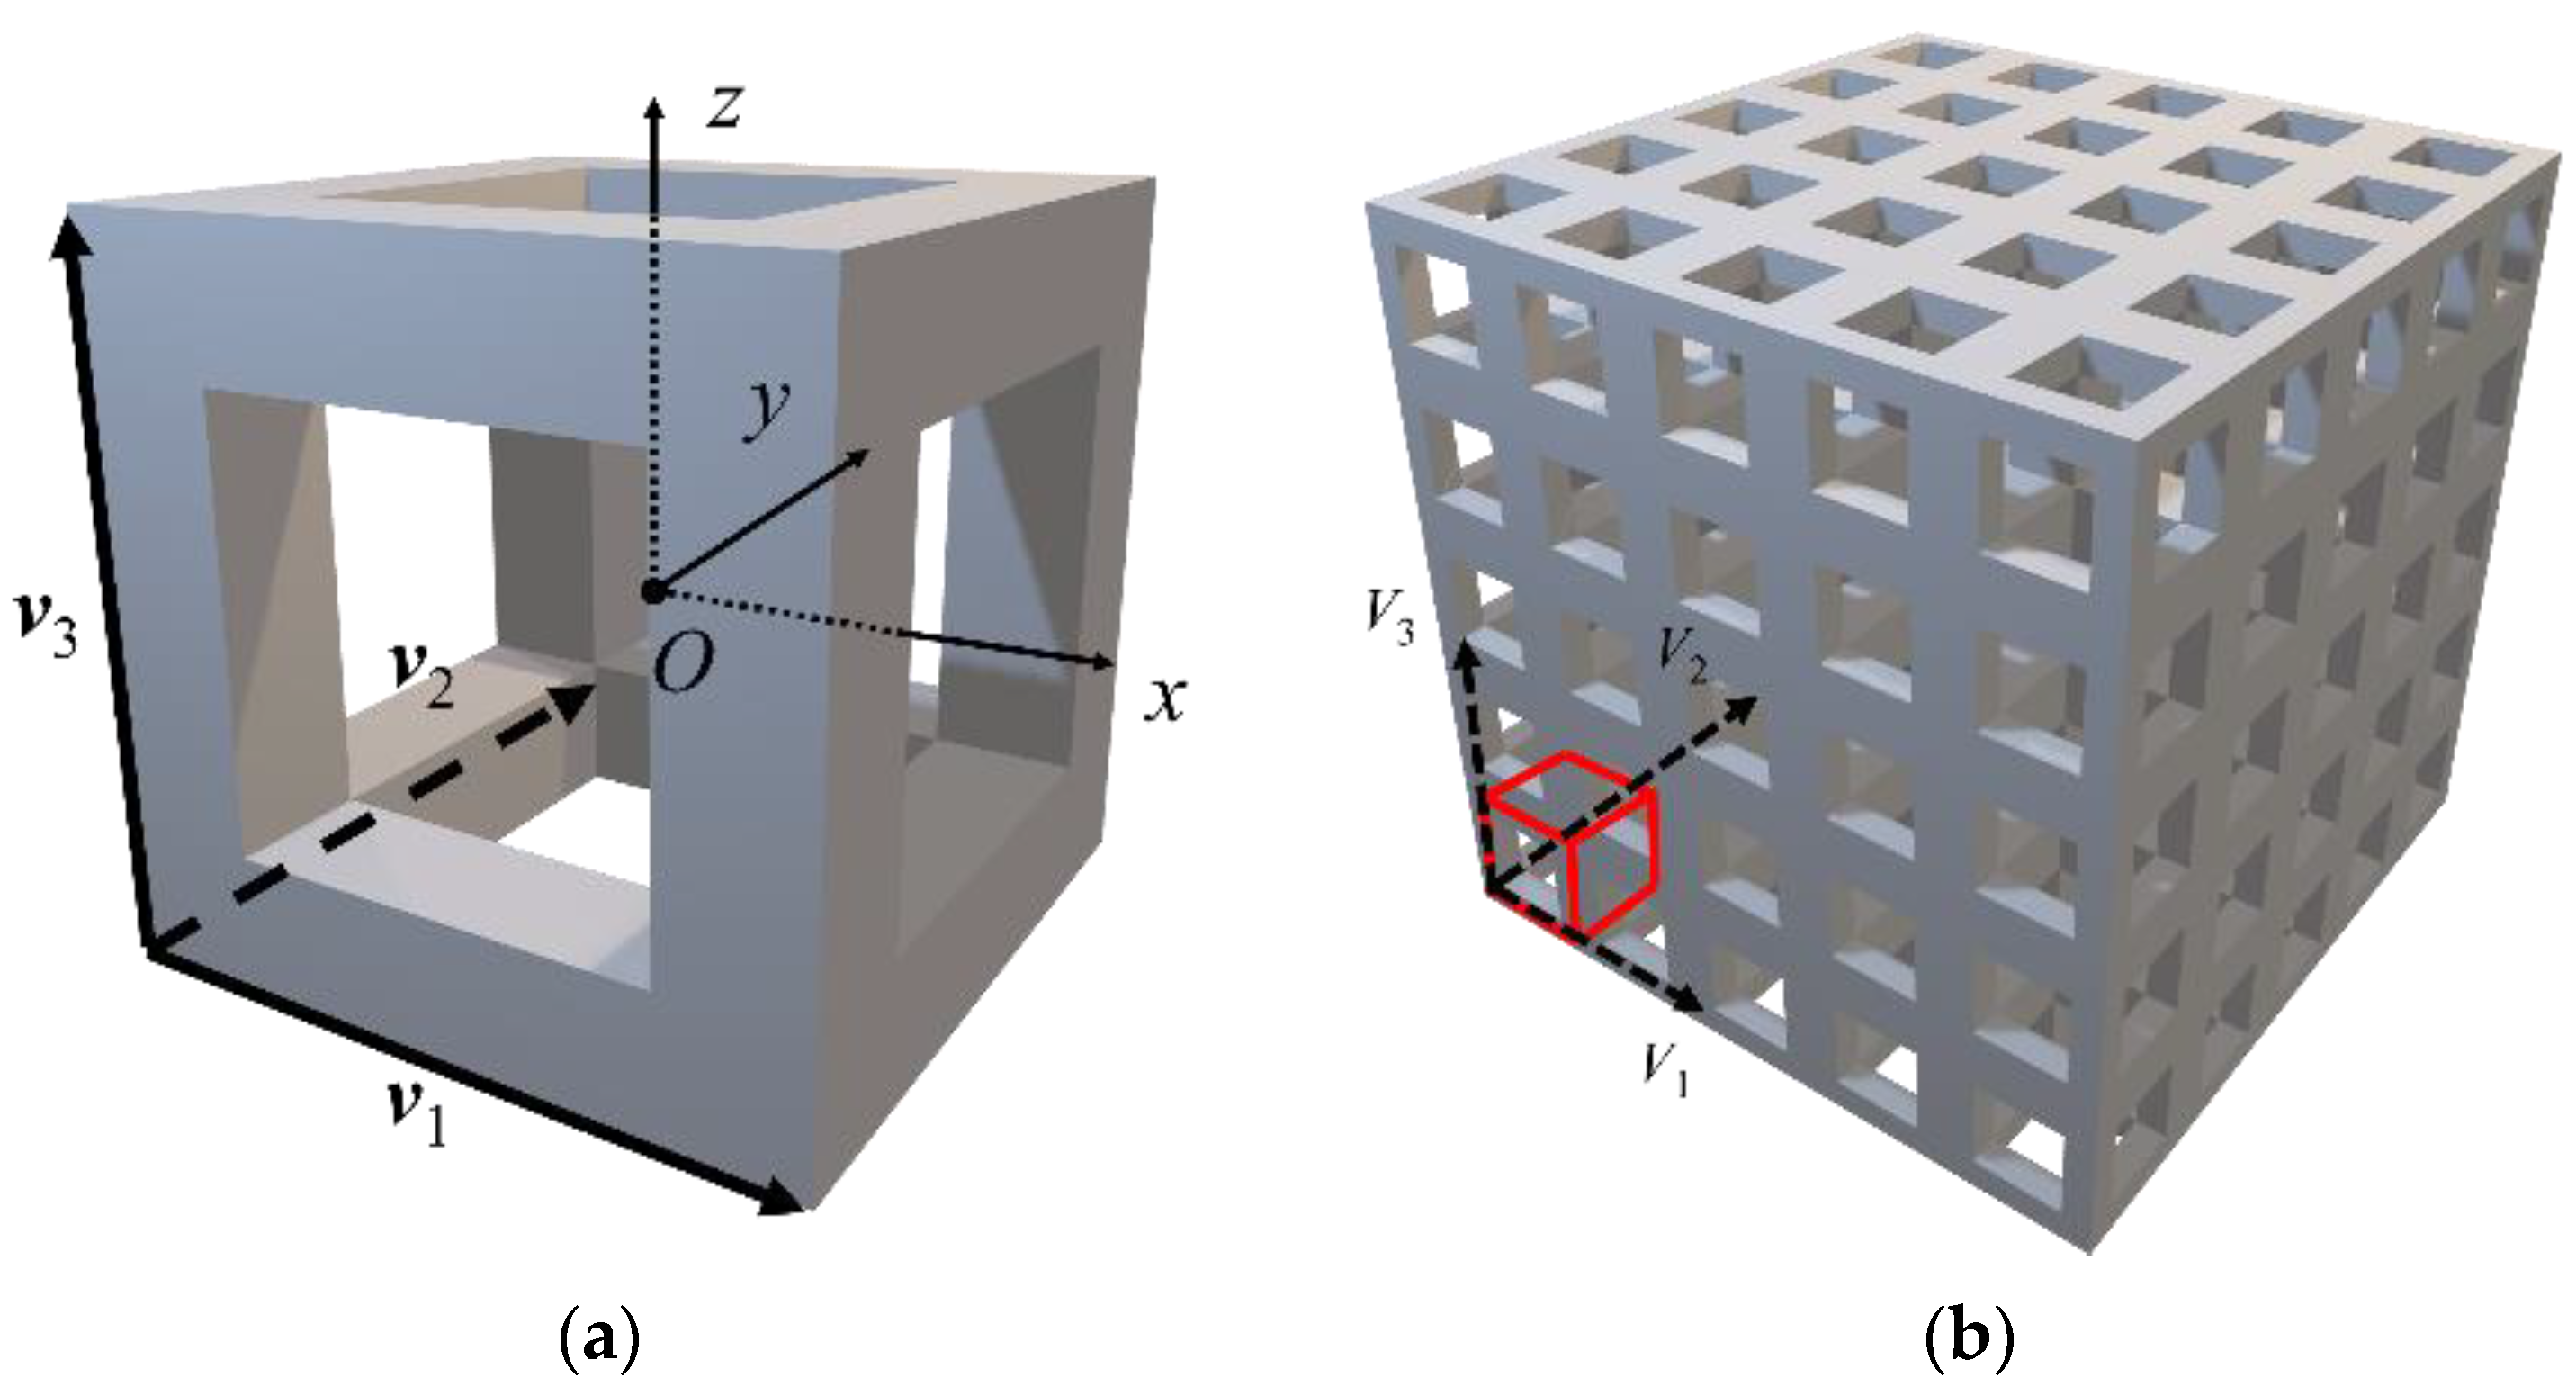
2.1. Computational Homogenization Method for Plates

A lattice-based heterogeneous plate consisting of periodic microlattice is considered as shown in Figure 1. Equivalent homogeneous stiffness for a Kirchhoff plate of a PUC is obtained based on a three-dimensional solid model of the lattice PUC by using the homogenization method for plates [19,20,21,22,23,24,25,26]. The following microscale governing equations are solved in the PUC, as shown in Figure 2.
σ i j x j = 0 , σ i j = C i j k l ε k l , ε α β = E α β 0 + x 3 K α β 0 + ε α β ( per ) , ε i 3 = ε i 3 ( per ) ε i j = 1 2 ( u i x j + u j x i ) , ε i j ( per ) = 1 2 ( u i ( per ) x j + u j ( per ) x i )
where σij, εij, and ui are the microscopic stress, strain, and displacement in the PUC. Cijkl is the stiffness tensor of the material in the lattice component. E α β 0 and K α β 0 are the macroscopic in-plane strain and curvature on the reference plane. The microscopic displacement and strain with in-plane periodicity are indicated as u i ( p e r ) and ε i j ( p e r ) . Latin indices i, j, k, and l range from one to three, while Greek indices α, β, γ, and δ take one and two.
Based on the Kirchhoff–Love theory, the macroscopic constitutive relation of the effective anisotropic lattice plate is given as:
N α β = A α β γ δ E γ δ 0 + B α β γ δ K γ δ 0 M α β = B α β γ δ E γ δ 0 + D α β γ δ K γ δ 0
with:
N α β = 1 | S | V σ α β d V , M α β = 1 | S | V σ α β x 3 d V
where Nαβ and Mαβ are the resultant forces and moments. The area of PUC is S = v 1 × v 2 . Aαβγδ, Dαβγδ, and Bαβγδ are the effective extension, bending, and coupling stiffness tensors. These equivalent stiffnesses are obtained in the following procedure.
(1)
The microscopic stress in the PUC is calculated by assigning the macroscopic unit strain or curvature (ex. E 11 0 = 1 ,   E 22 0 = E 12 0 = K 11 0 = K 22 0 = K 12 0 = 0 ) for the microscale problem defined by Equation (1).
(2)
The components of effective stiffness tensor are obtained by calculating the macroscopic resultant force and moment with Equation (3) (ex. A 1111 = N 11 ,   A 1122 = N 22 ,   A 1133 = N 12 ,   B 1111 = M 11 ,   B 1122 = M 22 ,   B 1133 = M 12 ,   in the case of E 11 0 = 1 ,   E 22 0 = E 12 0 = K 11 0 = K 22 0 = K 12 0 = 0 ).
The periodic boundary conditions (PBCs) are imposed on the PUC to solve the microscale problem given by Equation (1) [27,31,39,40]. In the case of the homogenization for plates, only the x-z and y-z planes of a PUC have periodicity, as shown in Figure 2. These procedures are implemented in the preprocesses and postprocesses of the commercial finite element software Abaqus 2019 [41] via the Python script.

2.2. Computational Homogenization Method for Solids

A lattice structure, which is a heterogeneous solid with three-dimensional periodicity, as shown in Figure 2, can be considered in an analogous manner to the homogenization method for plates. Instead of calculating an equivalent homogeneous Kirchhoff plate stiffness (i.e., the ABD matrix), an equivalent 3D stiffness matrix, C, is calculated.
Now, the macroscopic constitutive relation of the equivalent anisotropic lattice-based plate is given as:
Σ i j = C ¯ i j k l E k l
where Σij is the resultant stresses, and C ¯ i j k l is the effective 3D stiffness tensor. The independent components of the macrostrain tensor are E 11 ,   E 22 ,   E 33 ,   E 12 ,   E 22 , a n d   E 31 instead of E 11 0 ,   E 22 0 , E 12 0 , K 11 0 , K 22 0 , a n d K 12 0 in Kirchhoff–Love theory.
The other procedures are analogous to the ones for the homogenization of lattice-based plates. The procedures are implemented in Multiscale.simTM for Ansys® WorkbenchTM [42], which was developed by CYBERNET SYSTEMS Co., Ltd. Of Tokyo, Japan.

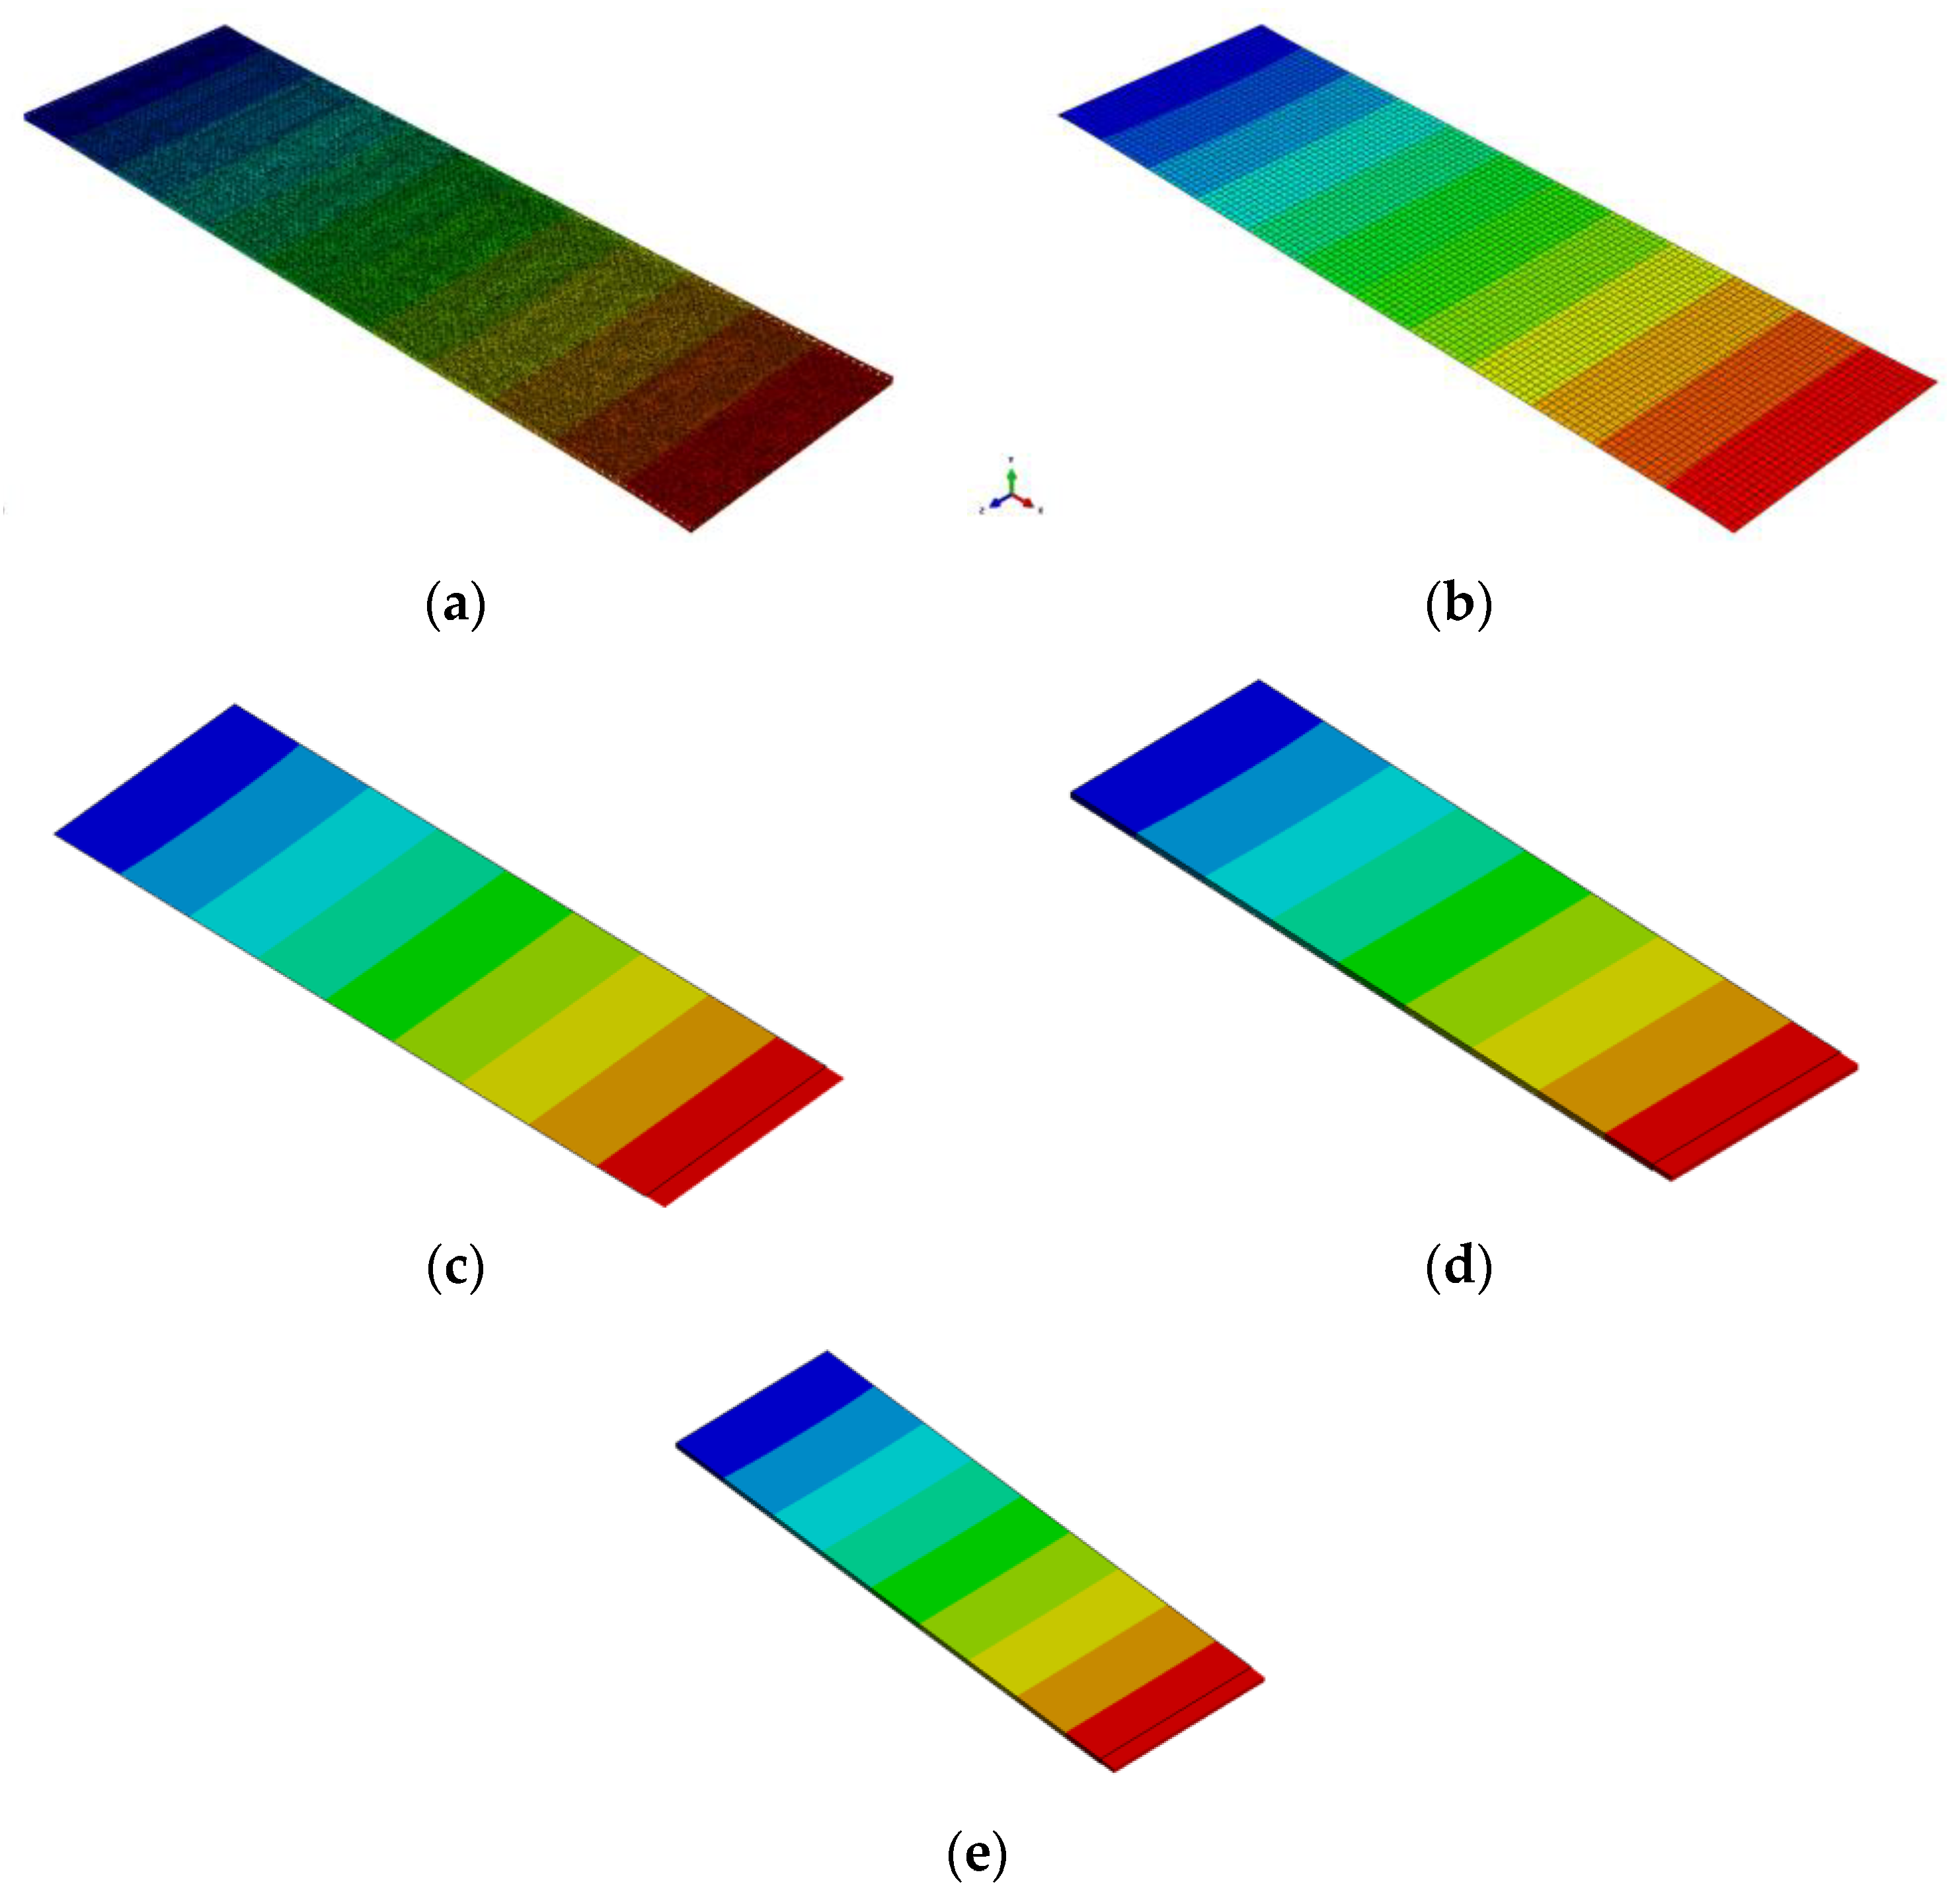
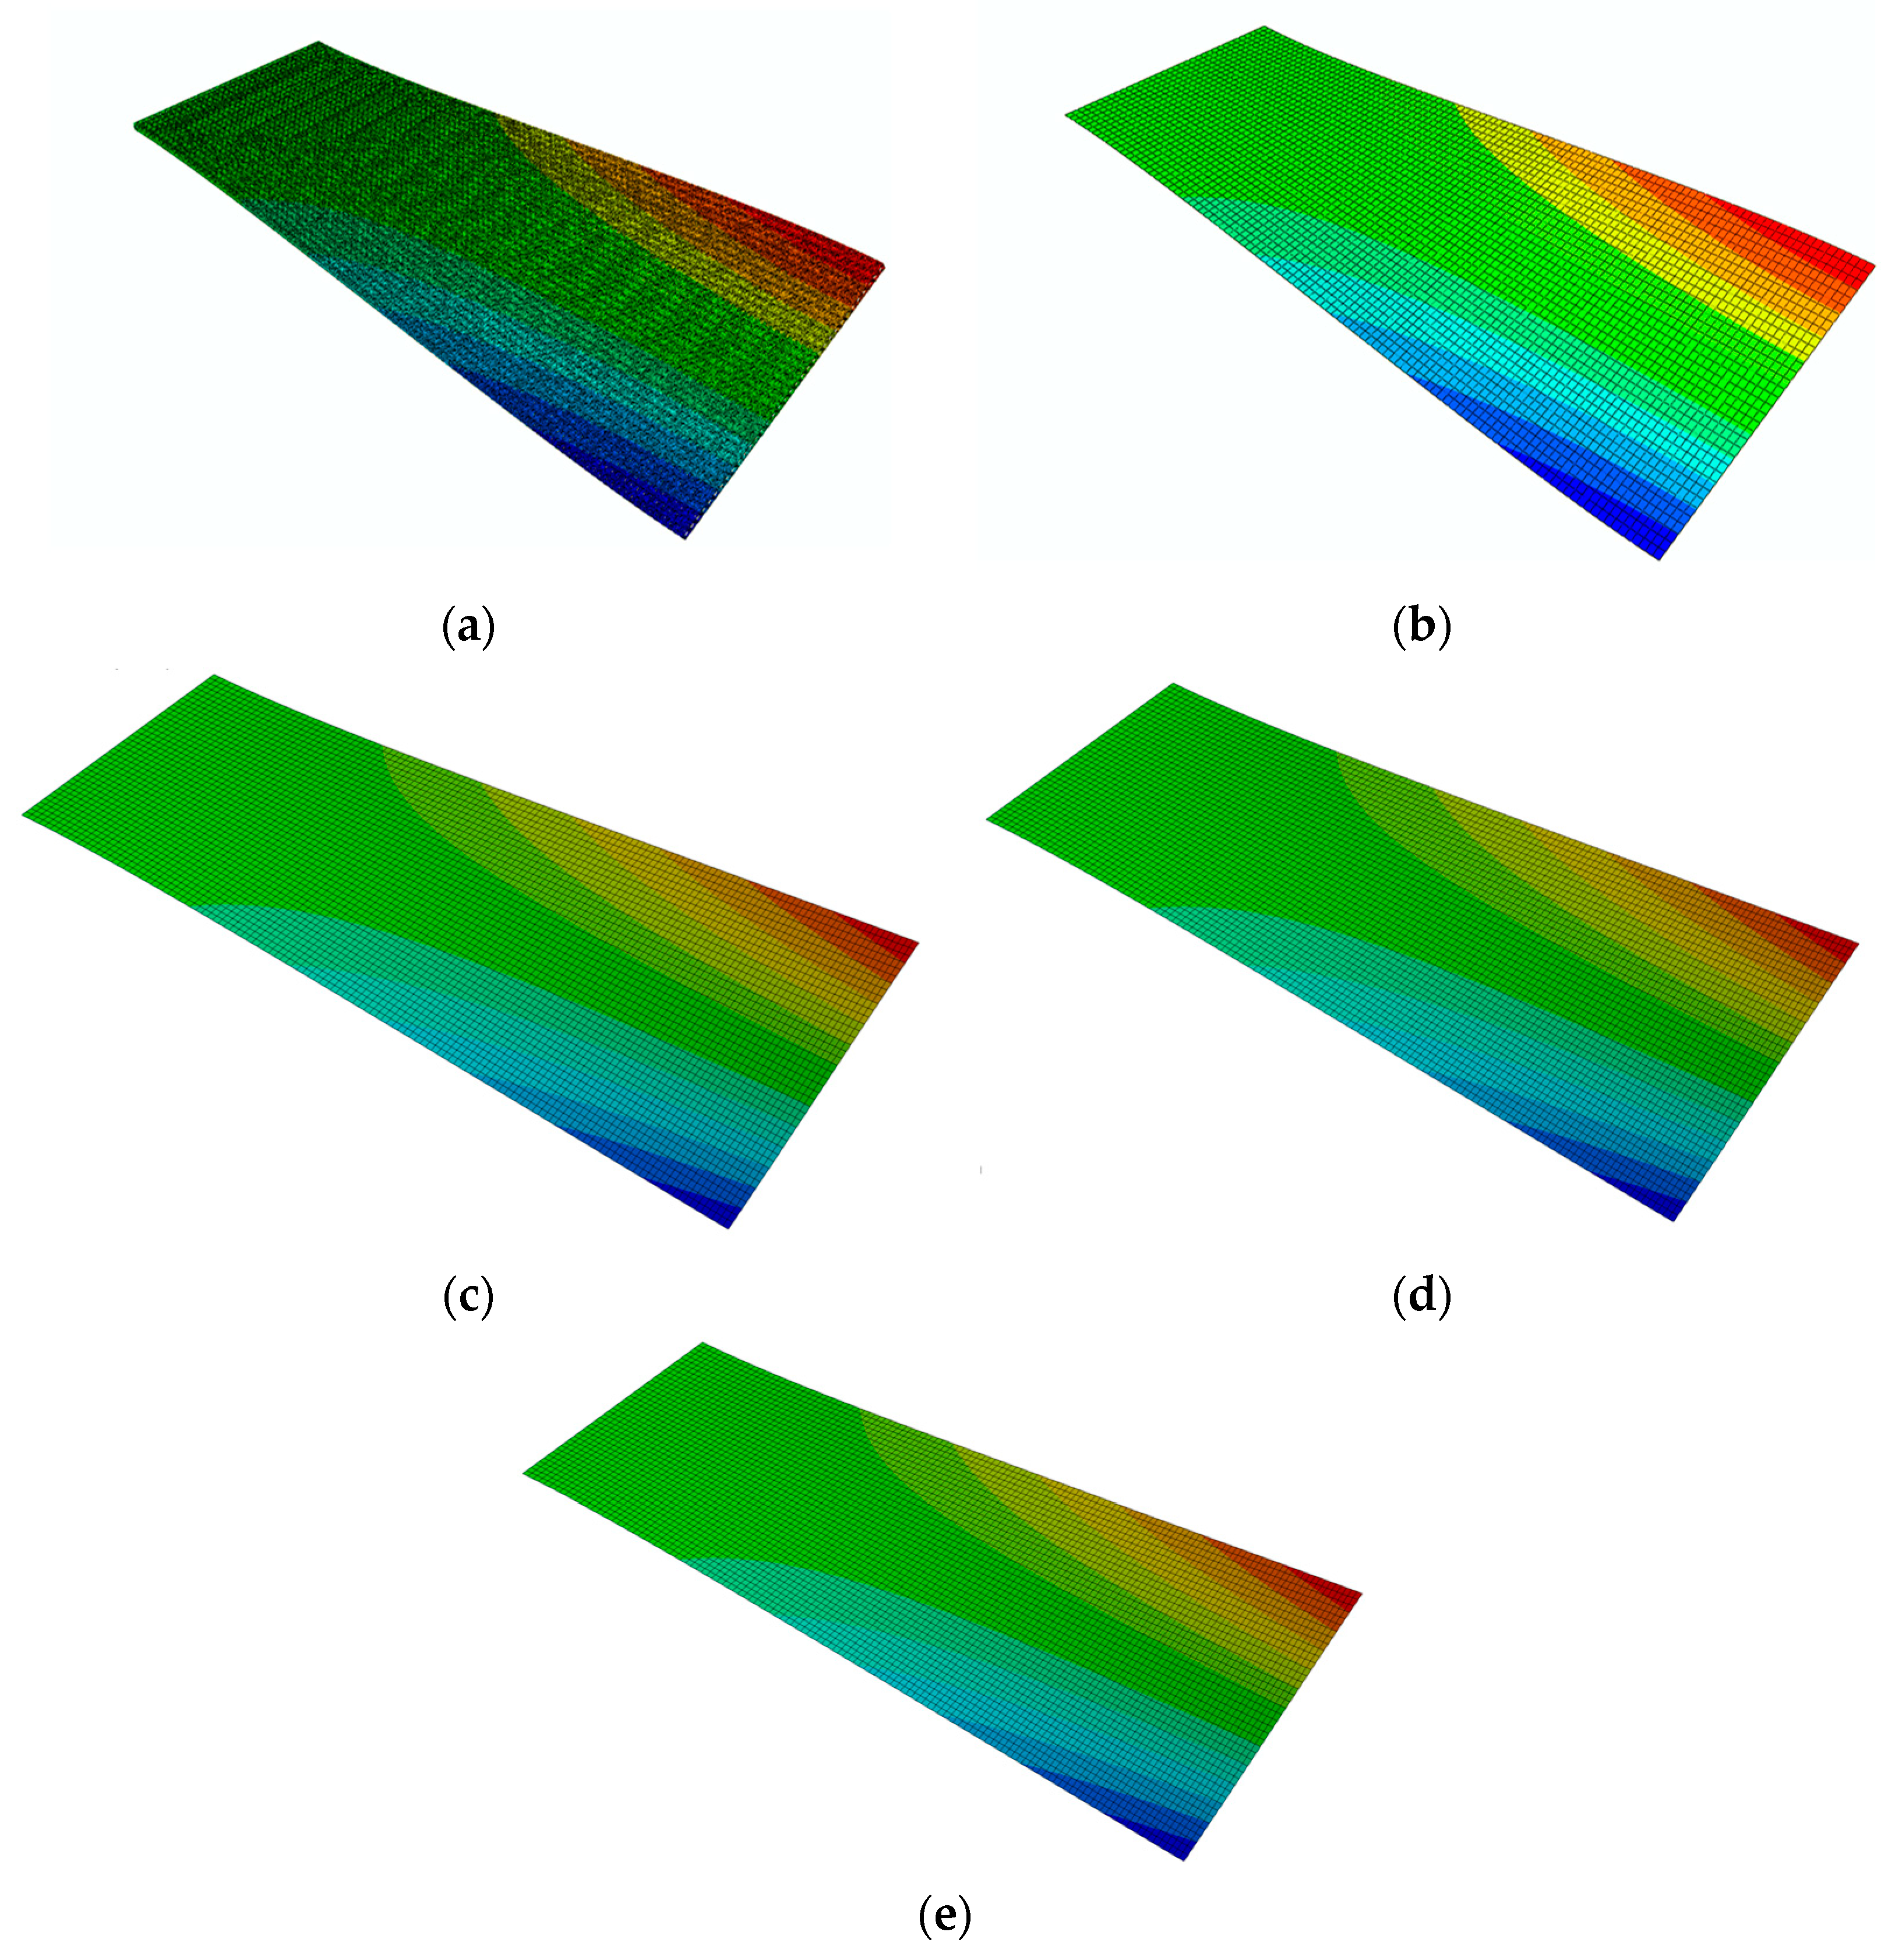
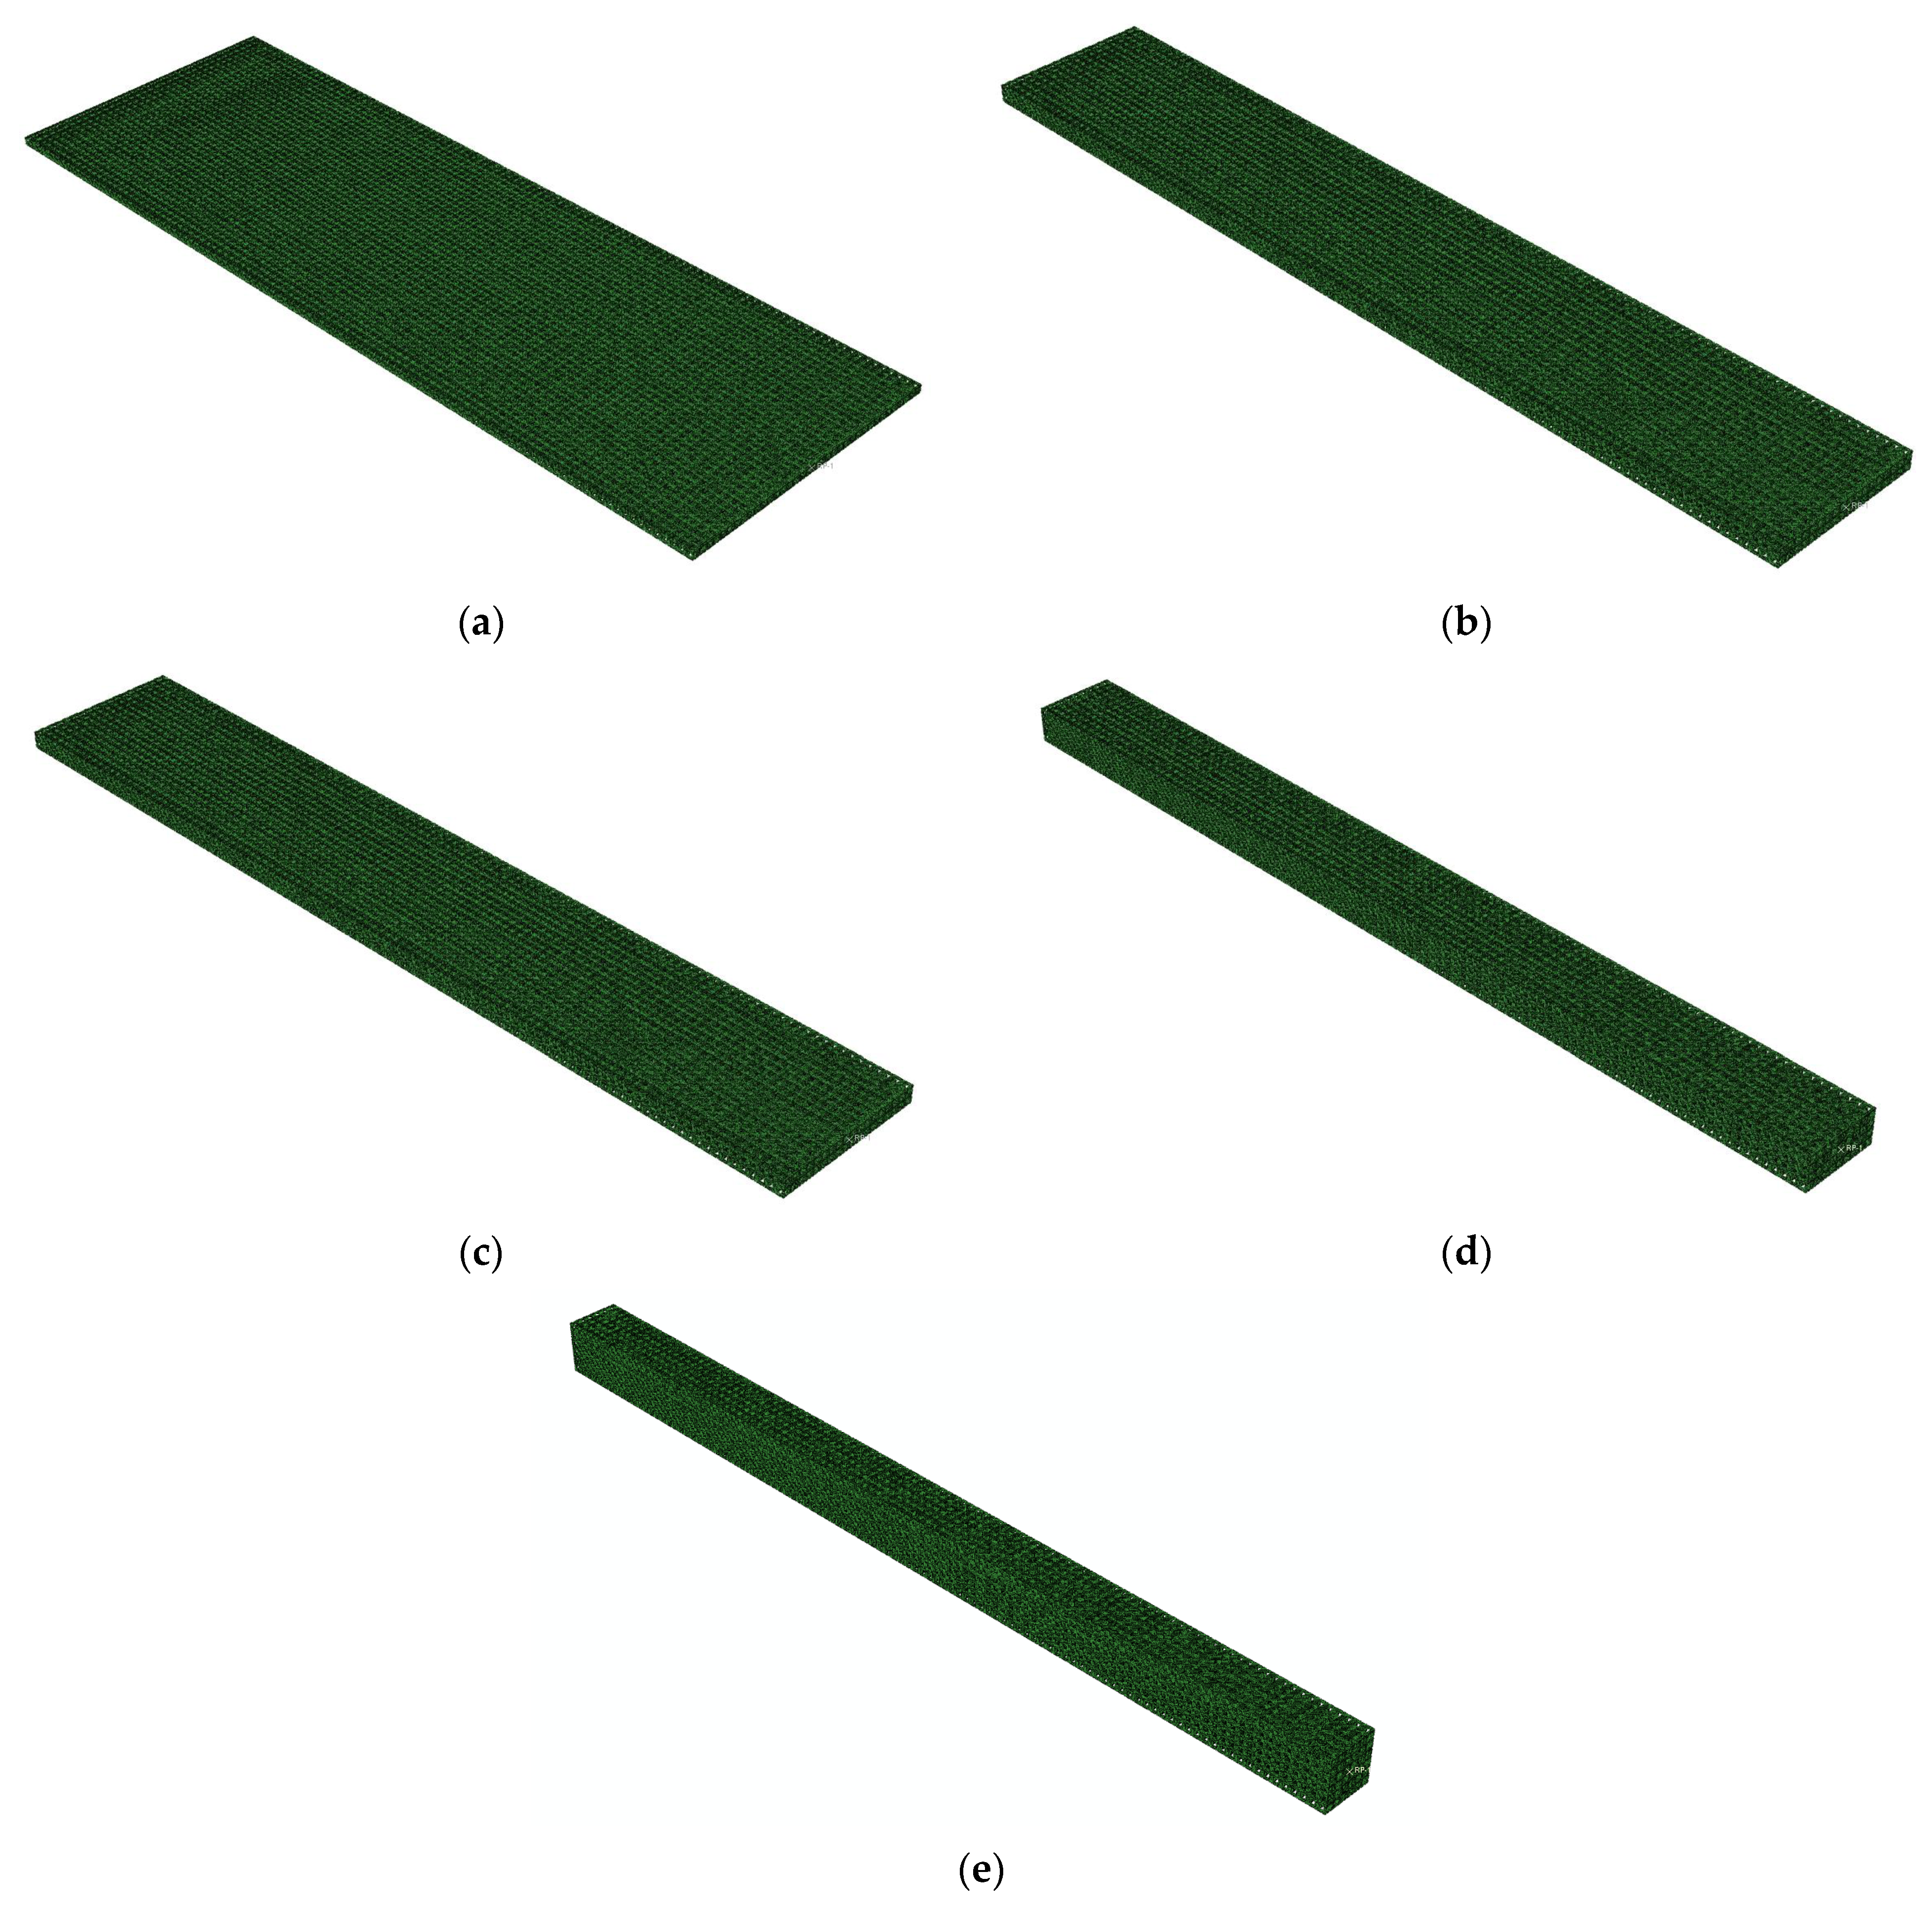
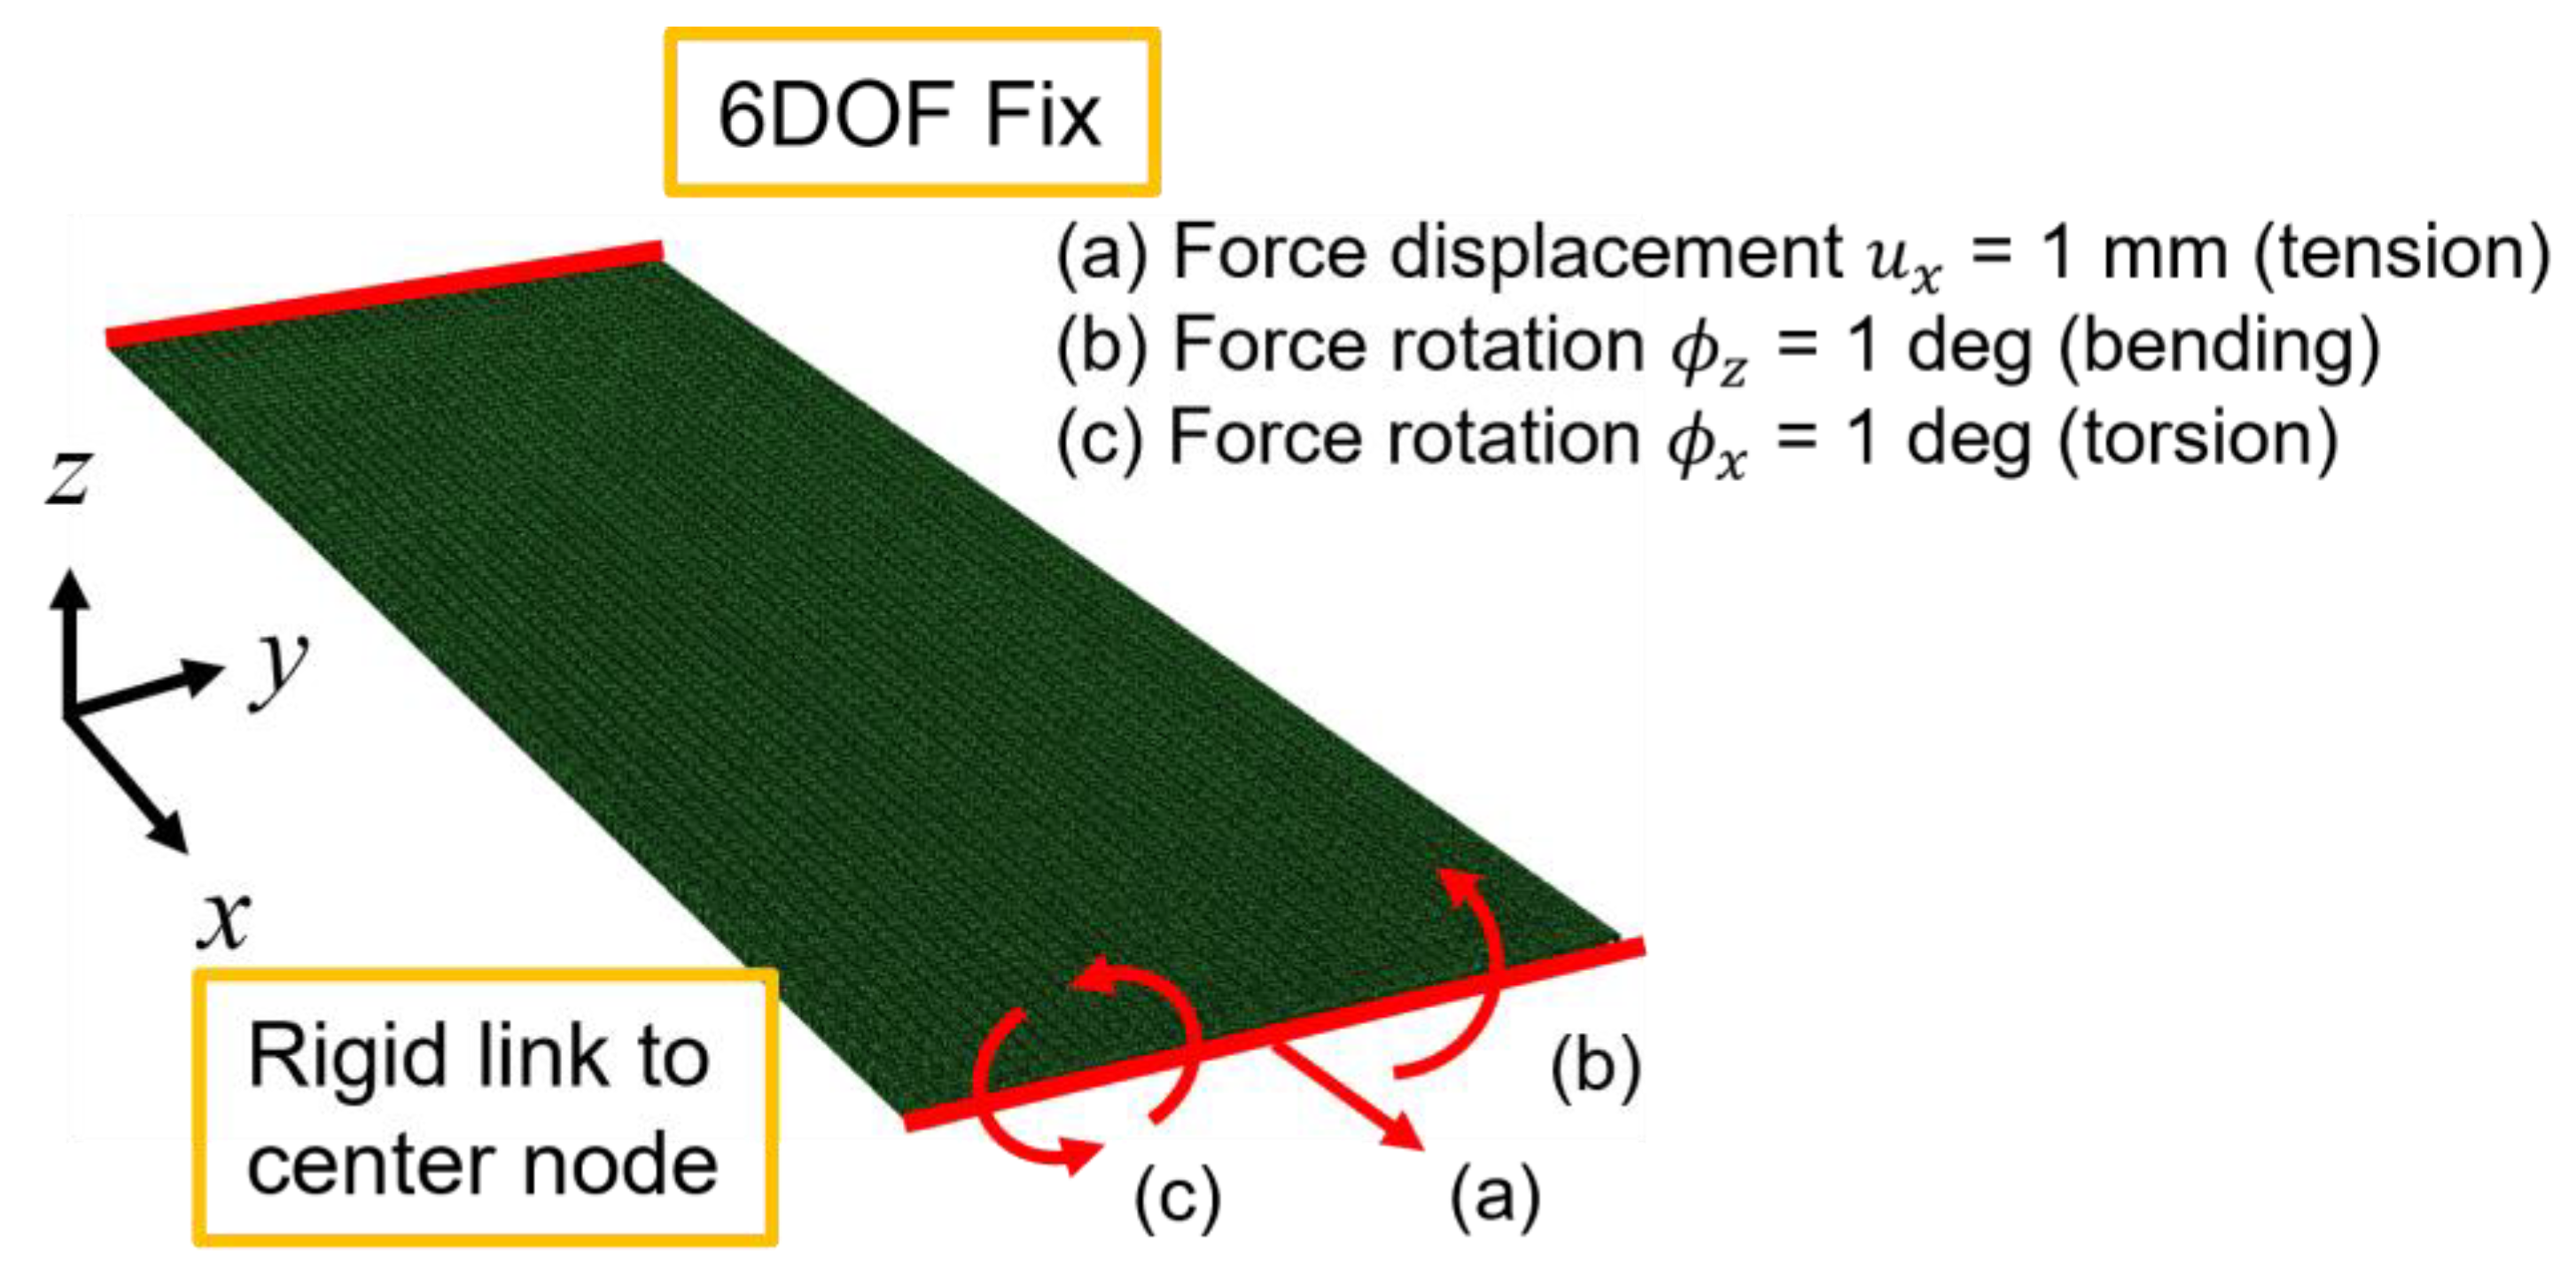
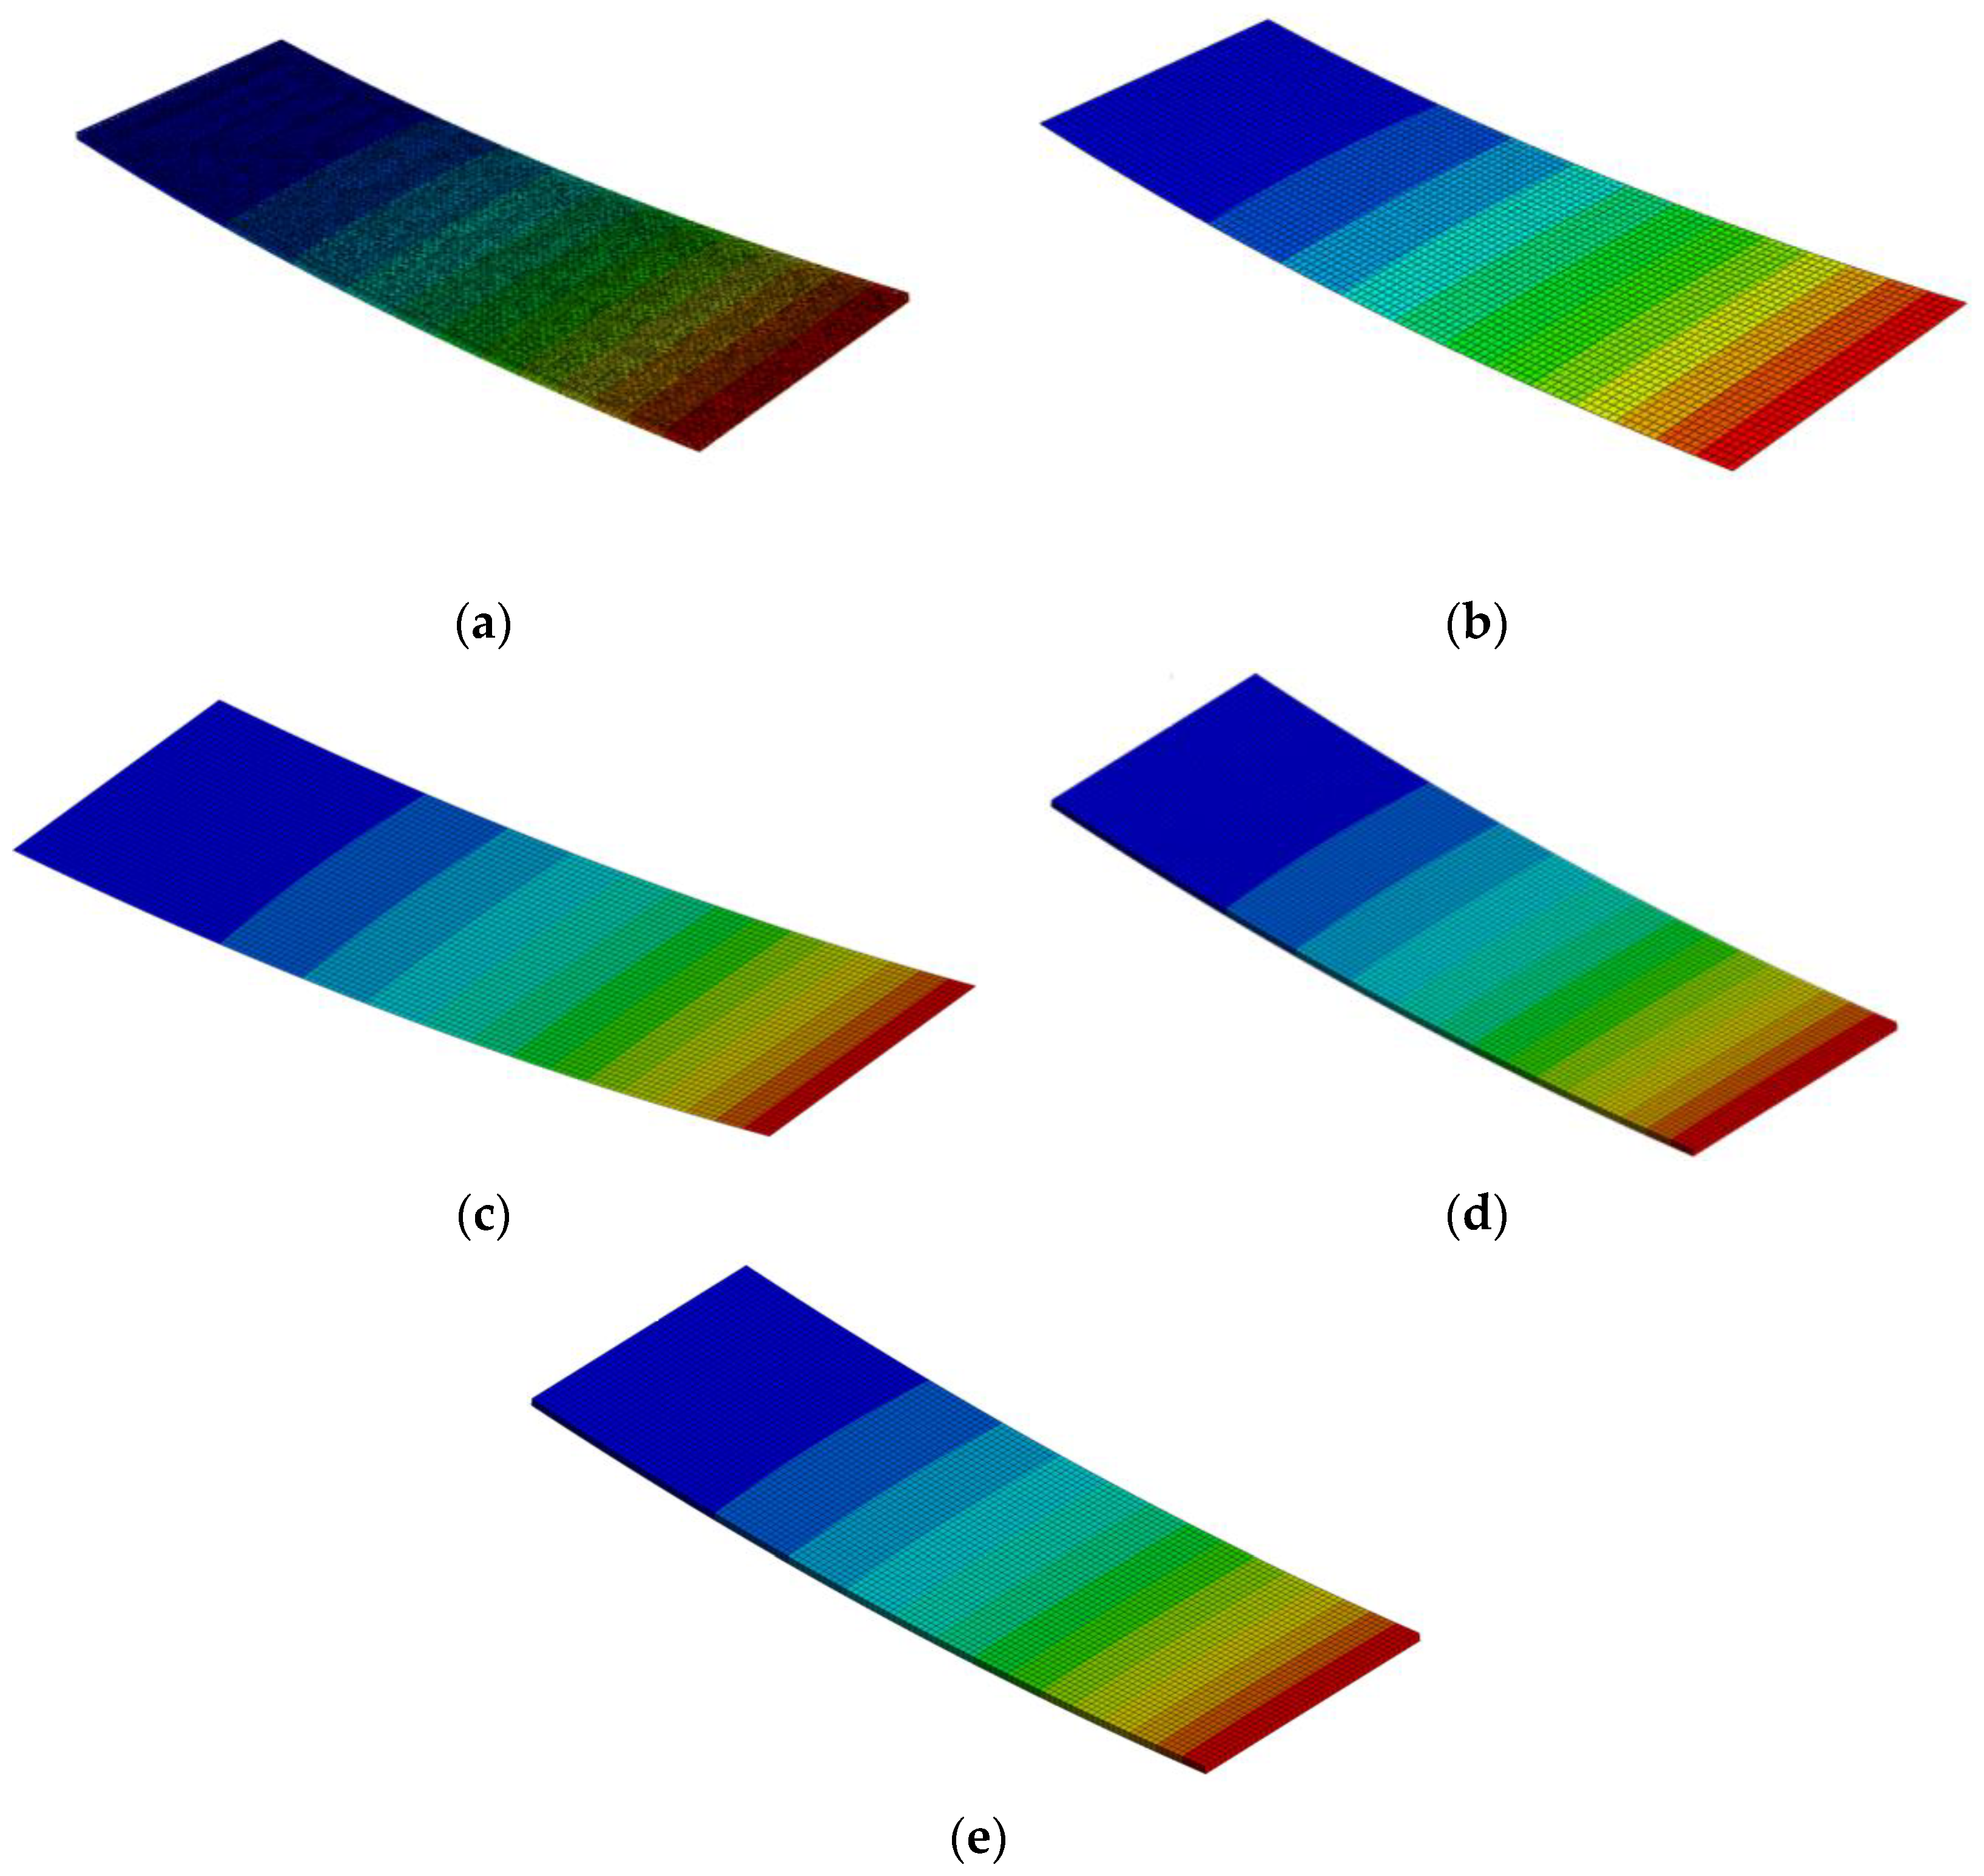
3. Correlation Study of Different Homogenization Approaches for Lattice-Based Structures

In this section, a comprehensive correlation study between the prediction accuracies of the two-scale analysis approaches in terms of tensile, bending, and torsional stiffness characteristics is performed for practical modeling and development of lattice structures for high-performance aerospace structures. A series of static analyses were performed to evaluate the stiffness characteristics of multiscale analysis with different approaches. In this study, a plate model based on simple cubic (SC) lattice PUCs as described in Figure 3 was first considered. The in-plane dimensions of the plate model were 315 mm and 105 mm in the x- and y-directions. The thickness t of the plate was 3.0 mm. The length of each side of the PUCs was 3.0 mm. Different widths b of the square lattice beams composing the SC lattice PUCs ranging from 1.2 mm, 1.6 mm, and 2.0 mm are investigated. Young’s modulus E, Poisson’s ratio ν, and density ρ of the structure were 2.8852 GPa, 0.4, and 1385.2 kg/m3, respectively. The correlation study was performed by comparing numerical solutions of a detailed model and homogenized models based on the equivalent ABD and C matrices for the plates with the periodically distributed cubic unit cells. The homogenized model based on the equivalent C matrix was further divided into three models. The first one is a model with solid elements, the second one is with shell elements, and the last one is with solsh elements. The solsh element is a shell element type with a wide range of thicknesses offered by Ansys Mechanical [43,44]. These models were simulated by the Abaqus for the detailed and homogenized models with the equivalent ABD matrix and by Ansys Mechanical [42] for the homogenized models based on the equivalent C matrix. Figure 4 shows finite element models with fine solid elements and homogenized elements. For example, approximately 1.3 million hexahedral solid elements were used for the detailed model with b = 1.2 mm to ensure enough accuracy for the study. On the other hand, the homogenized shell models were divided into 3675 quadratic shell or solsh elements, while the homogenized solid model with the equivalent C matrix used 0.24 million hexahedral solid elements. In this study, the tensile, bending, and torsional properties of the plate models were investigated.
Tensile characteristics of all models under a forced tensile displacement were first evaluated. The boundary conditions for the study are described in Figure 5. One edge of the models was fixed, while a forced displacement in the x-direction was applied on the other edge of the models by 1 mm. The forced edge displacement was modeled by a point displacement at the center node on the free edge, rigidly connected to the other nodes on the edge/face. Figure 6 describes the simulated deformations of the detailed model and the homogenized shell model based on the equivalent ABD matrix. The results for the homogenized shell, solsh, and solid models based on the equivalent C matrix are also shown in Figure 6. The resultant loads on the applied nodes for all models with different widths of the lattice beam are given in Table 1. The differences in the solutions from the homogenized models to the ones of the detailed models were denoted in parentheses. The solutions of the homogenized shell models based on the equivalent ABD matrix agreed with less than 2.6% of the difference, while the homogenized models based on the equivalent C matrix showed slightly larger differences.
Out-of-plane bending and torsional characteristics of the models under forced bending and torsional deformations were then evaluated. For the cantilevered models, a 1-rad rotation around the z-axis or a 1-rad rotation around the x-axis were applied with a point rotation at the center node on the free edge/face as shown in Figure 5. Figure 7 and Figure 8 show the deformations for the bending and torsional analyses. Table 2 and Table 3 give the comparison of solutions in terms of the resultant moments.
The differences in the resultant moments obtained from the detailed and homogenized shell model with the effective ABD matrix were less than 2.5%. On the other hand, although the models based on the equivalent C matrix show a good consistency even if the element types (shell, solsh, solid) are different, there are significant differences to the detailed model. The case represents a limitation of homogenization with the equivalent C matrix. Since the simulation models were thin plates with a single unit cell in the thickness direction, which gave the in-plane periodic condition, the assumption of the homogenization for the equivalent C matrix was violated for the cases. The limitation also applies to the homogenization for the equivalent ABD matrix with a structure with three-dimensional periodic conditions.
To perform further investigations of the validity ranges for both homogenization approaches, additional simulations were performed using plate models with different numbers of unit cell layers by increasing thickness-wise periodicity from one to six. In the cases, the cross-sectional areas and the width of lattice beams were fixed to 324 mm2 and 1.2 mm, while the width of the plates ranged from 108 mm to 18 mm. The length of the plates was still 315 mm. The five models are shown in Figure 9. The equivalent stiffness properties of the plates were calculated for the homogenized models based on the effective C and ABD matrices. However, in the calculations of the equivalent ABD matrices with multiple cells in the thickness direction, a set of unit cells in the thickness direction are considered as a “representative unit cell”, as shown in Figure 10, since the approach assumes in-plane periodicity. Also, plate models with solid elements were evaluated for homogenized models based on the equivalent C matrix.
The results are given in Table 4, Table 5 and Table 6. Figure 11, Figure 12 and Figure 13 show the errors of resultant loads and moments for the homogenized models to the ones for the detailed model with different cross-sectional aspect ratios (i.e., different cell layers) under the forced deformations. Firstly, the errors in the resultant moments based on the homogenized models with the equivalent C matrices, which were related to the bending and torsional stiffnesses, were significantly decreased as the layers increased. When the cross-sectional aspect ratio was reduced below 2.25, the homogenized models showed agreement with the detailed models with errors of less than 6.1%. Secondly, the number of cell layers did not have a significant influence on the prediction accuracy of the tensile stiffnesses in the homogenized models with both equivalent ABD and C matrices. Both models maintained the prediction differences to the detailed models of less than 4%. For the homogenized model with the equivalent ABD matrices, the bending stiffnesses also agreed with the detailed models even if the cell layers were increased. Finally, the torsional stiffnesses in the homogenized models with the equivalent ABD matrices were drastically increased (overestimated) as the cross-sectional aspect ratio decreased to less than nine. According to Table 4, Table 5 and Table 6, it can also be confirmed that the tensile stiffness obtained by the homogenization with the C matrices could not capture the influence of the aspect ratio. In other words, the tensile stiffnesses almost did not change with different aspect ratios. In addition, the homogenization with the C matrices underestimated the effective bending and torsional stiffnesses for the higher aspect ratios. Therefore, it is recommended that the homogenization approach for simulations of a lattice-based structure should be determined based on the cross-sectional aspect ratio, the border of which is around four in this study. However, one has to carefully examine the threshold since the value may be changed based on the geometrical design of the structure. The homogenization approach with shell elements based on an equivalent ABD matrix can be used for a plate model with the cross-sectional aspect ratio being more than four to ensure the prediction accuracy of the stiffness. On the other hand, the homogenization approach based on an equivalent C matrix should be used for a model with the cross-sectional aspect ratio being less than the threshold.
Figure 14, Figure 15 and Figure 16 show the errors of resultant loads and moments for the homogenized models to the ones for the detailed model with widths of lattice beams under the forced deformations. Since the lattice plates become solid plates as the width of the lattice beams increases, the errors of the homogenized models are mostly reduced. In other words, one needs extra caution in evaluations with homogenizations when a filling rate (ratio between the lattice volume to the unit cell volume) is small, which is the case for lightweight lattice structures. In addition, the homogenization approach for periodic beams could also be used for a beam-like structure such as Model 5, although such a homogenization approach is out of the scope of the current study.

4. Conclusions

Multiscale approaches based on the different computational homogenizations for lattice-based architected materials were explored in this paper. This study demonstrated the capabilities of the framework to evaluate stiffness characteristics of lattice structures with two different two-scale analysis approaches and assessed the accuracies and validity ranges of both approaches for appropriate predictions of responses of lattice structures. The two-scale analysis framework consisted of the computational homogenizations for the generalized stiffness (ABD) matrix and 3D stiffness (C) matrix. The former could be used for simulations with shell elements, while the latter offers options for solid, shell, and thick shell (solsh) elements. A representative unit cell of the structure with two-/three-dimensional periodicity was modeled as representative finite elements in the computational homogenization procedures. Equivalent stiffness characteristics of the representative unit cell were obtained based on the computational homogenization procedures. The equivalent structural characteristics were then used to effectively capture the macroscopic structural responses of lattice-based structures.
To assess the correlation between the prediction accuracies of the two-scale analysis approaches in terms of tensile, bending, and torsional stiffness characteristics, a series of static analyses were performed. When a model violated assumptions in periodic conditions, most homogenized models with both two-scale analysis approaches exhibited large discrepancies to detail models with fine meshes, which were used as reference solutions. However, it was found that the homogenized models for plates still provided good accuracy for tensile and bending stiffness characteristics, although deviations in torsional characteristics drastically increased as the cross-sectional aspect ratio increased if multiple PUCs in the third direction were modeled as a “unit cell” in the homogenization for plates. The numerical studies also indicated that the approach with the computational homogenization for solids was more susceptible to a violation of periodic conditions. In the current study, the border to switch the approaches was the cross-sectional aspect ratio of about four. However, one has to carefully examine the threshold since the value may be changed based on the geometrical design of the structure. The homogenization approach with shell elements based on an equivalent ABD matrix can be used for a plate model with the cross-sectional aspect ratio being more than the threshold to ensure the prediction accuracy of the stiffness. On the other hand, the homogenization approach based on an equivalent C matrix should be used for a model with the cross-sectional aspect ratio being less than the threshold.
The novelty of this study is the comprehensive correlation study between the prediction accuracies of the two-scale analysis approaches in terms of tensile, bending, and torsional stiffness characteristics for practical modeling and development of lattice structures, while most preceding studies have focused on specific properties. The numerical studies elucidated the advantages and limitations of homogenization for plates/solids. The multiscale analysis with the homogenization approach is a powerful tool for the practical analysis and development of high-performance structures with architected materials as substructures. When homogenization approaches are employed in the modeling and analysis of lattice structures or other architected materials, one needs to pay extra attention to their validity ranges and approximations. As most homogenization approaches assume an infinite periodicity of representative unit cells, the physical assumption must be appropriately taken into account. The recommendations obtained from this study are:
(1)
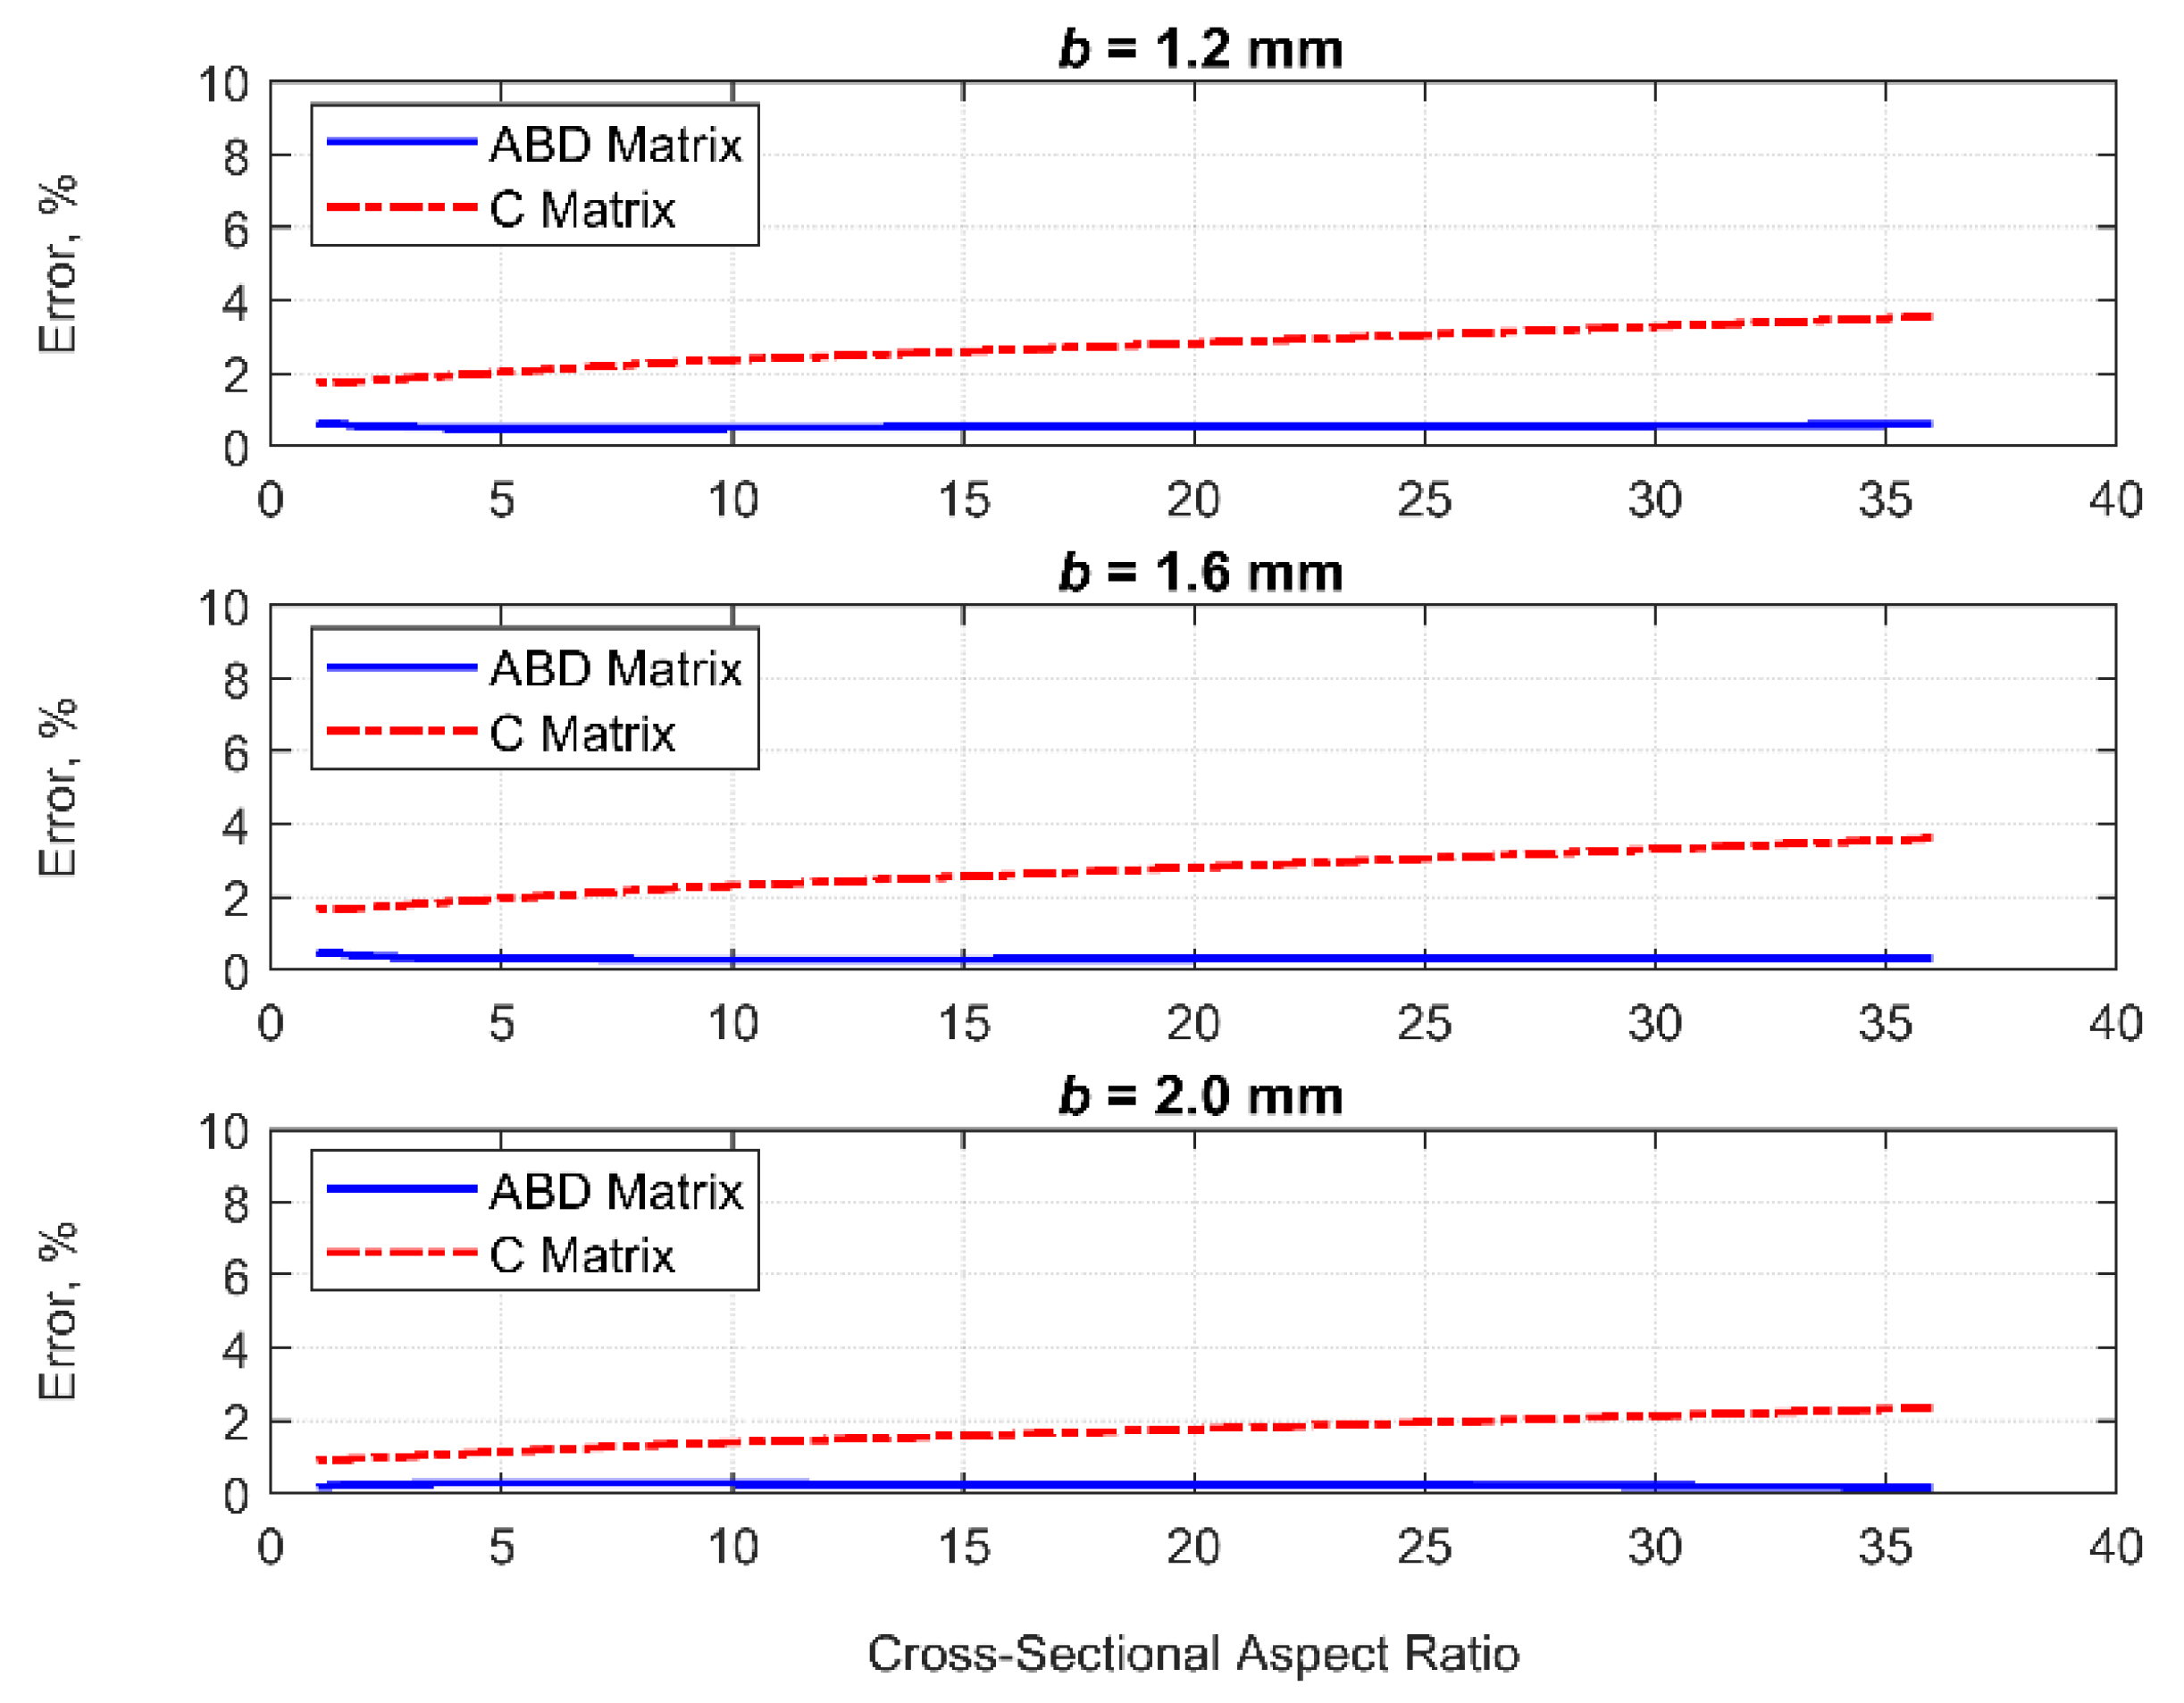
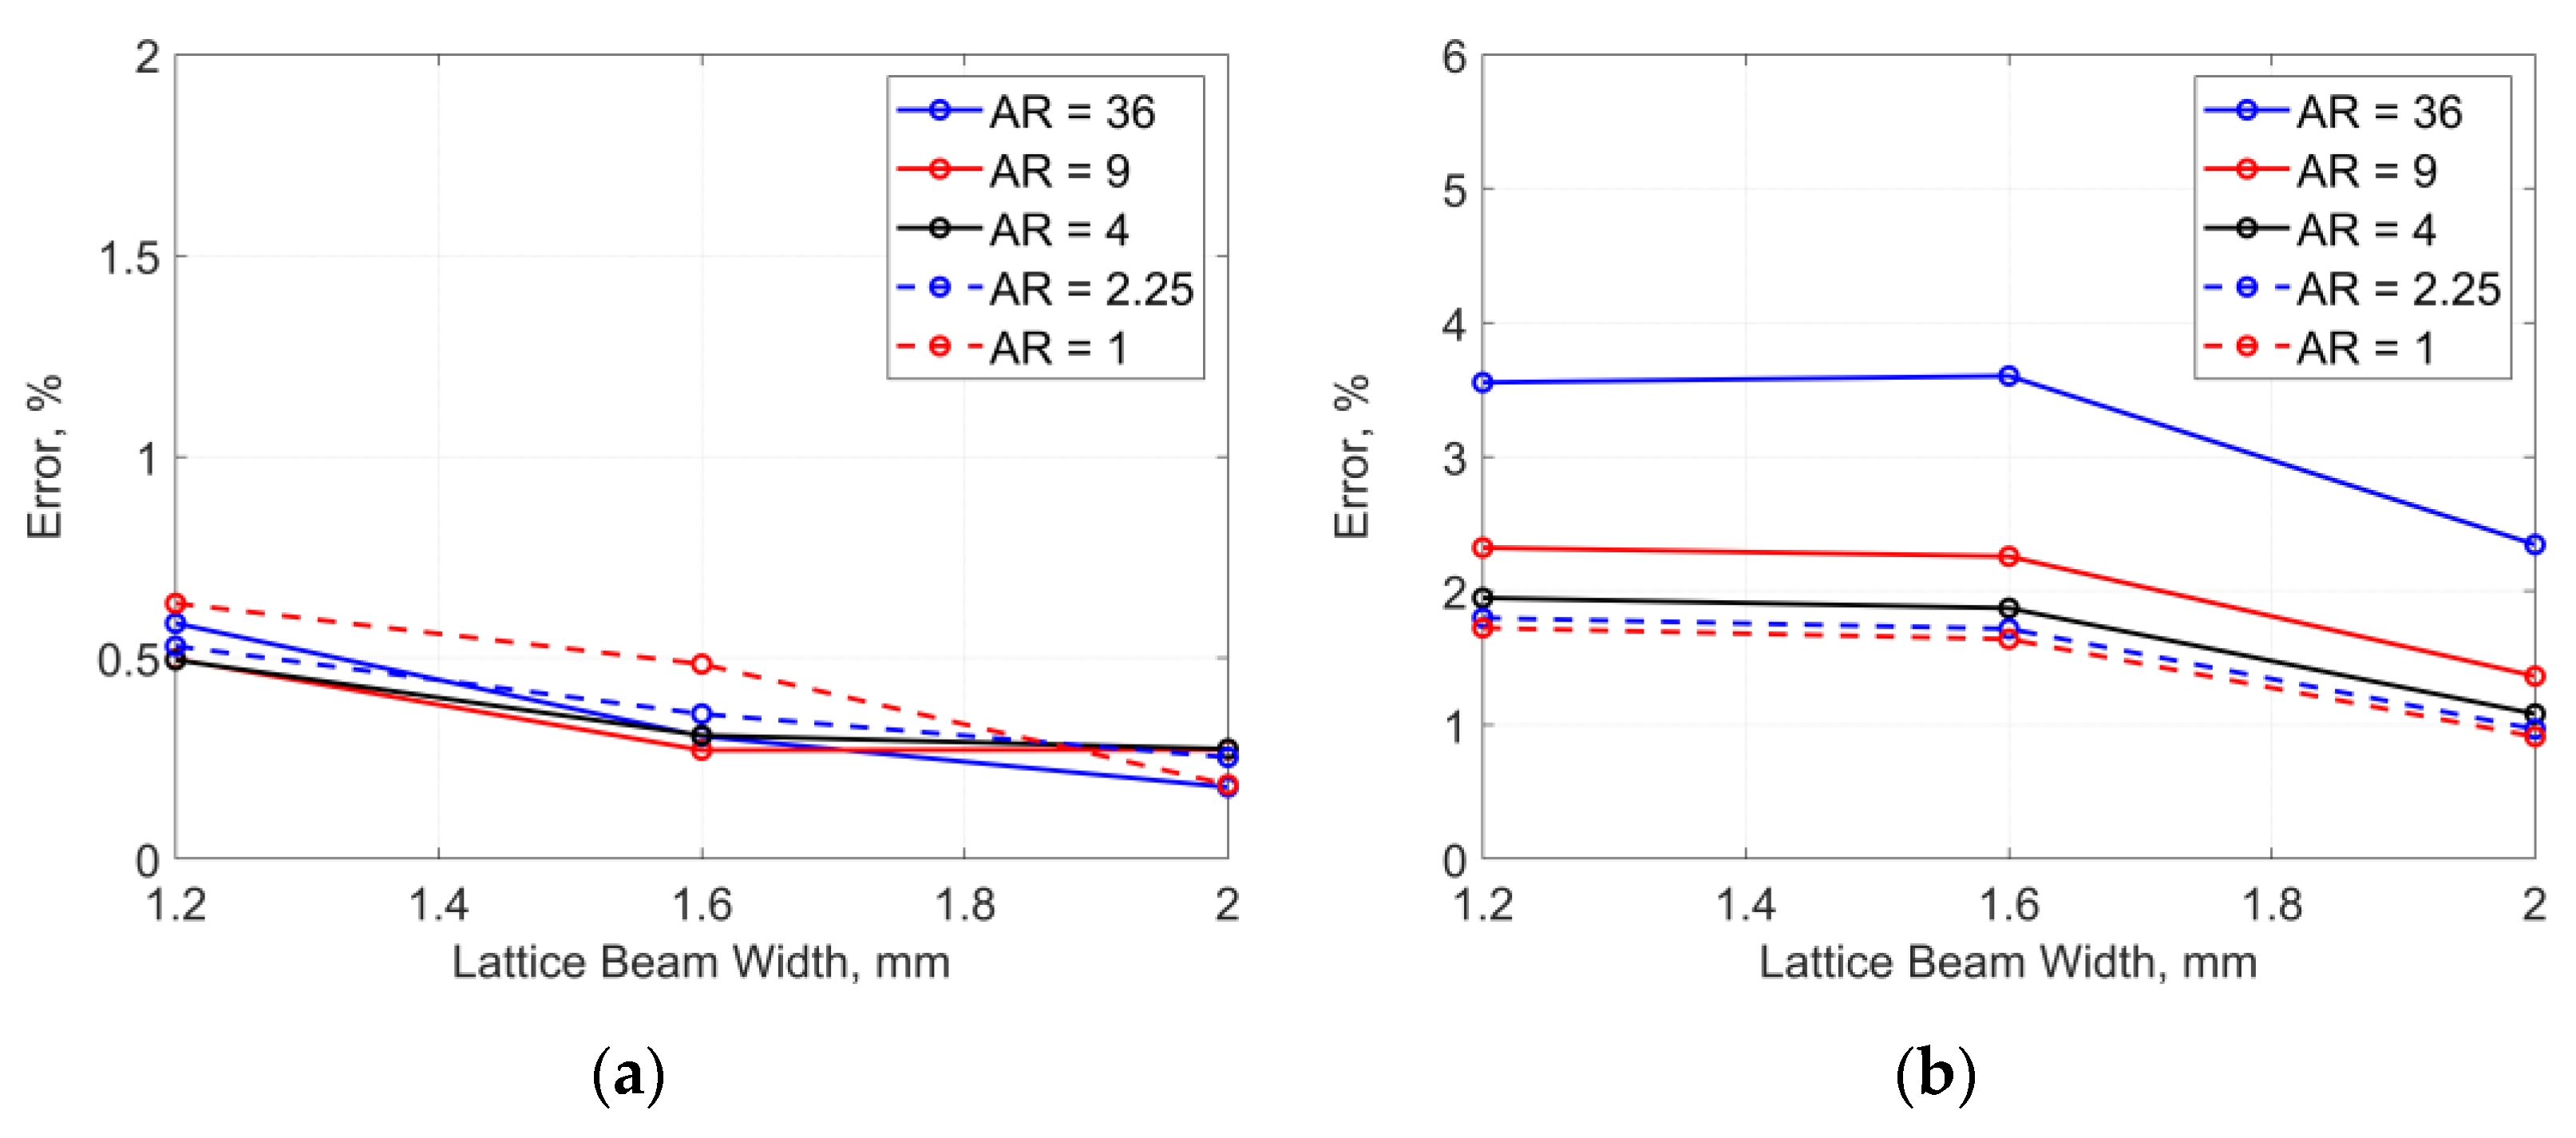
Tensile stiffness can be estimated by both homogenizations with reasonable accuracy even if the assumptions in periodic conditions are violated. Therefore, one can choose both homogenization approaches for cost-effective analysis of lattice structures if a focus is on tensile responses;
(2)
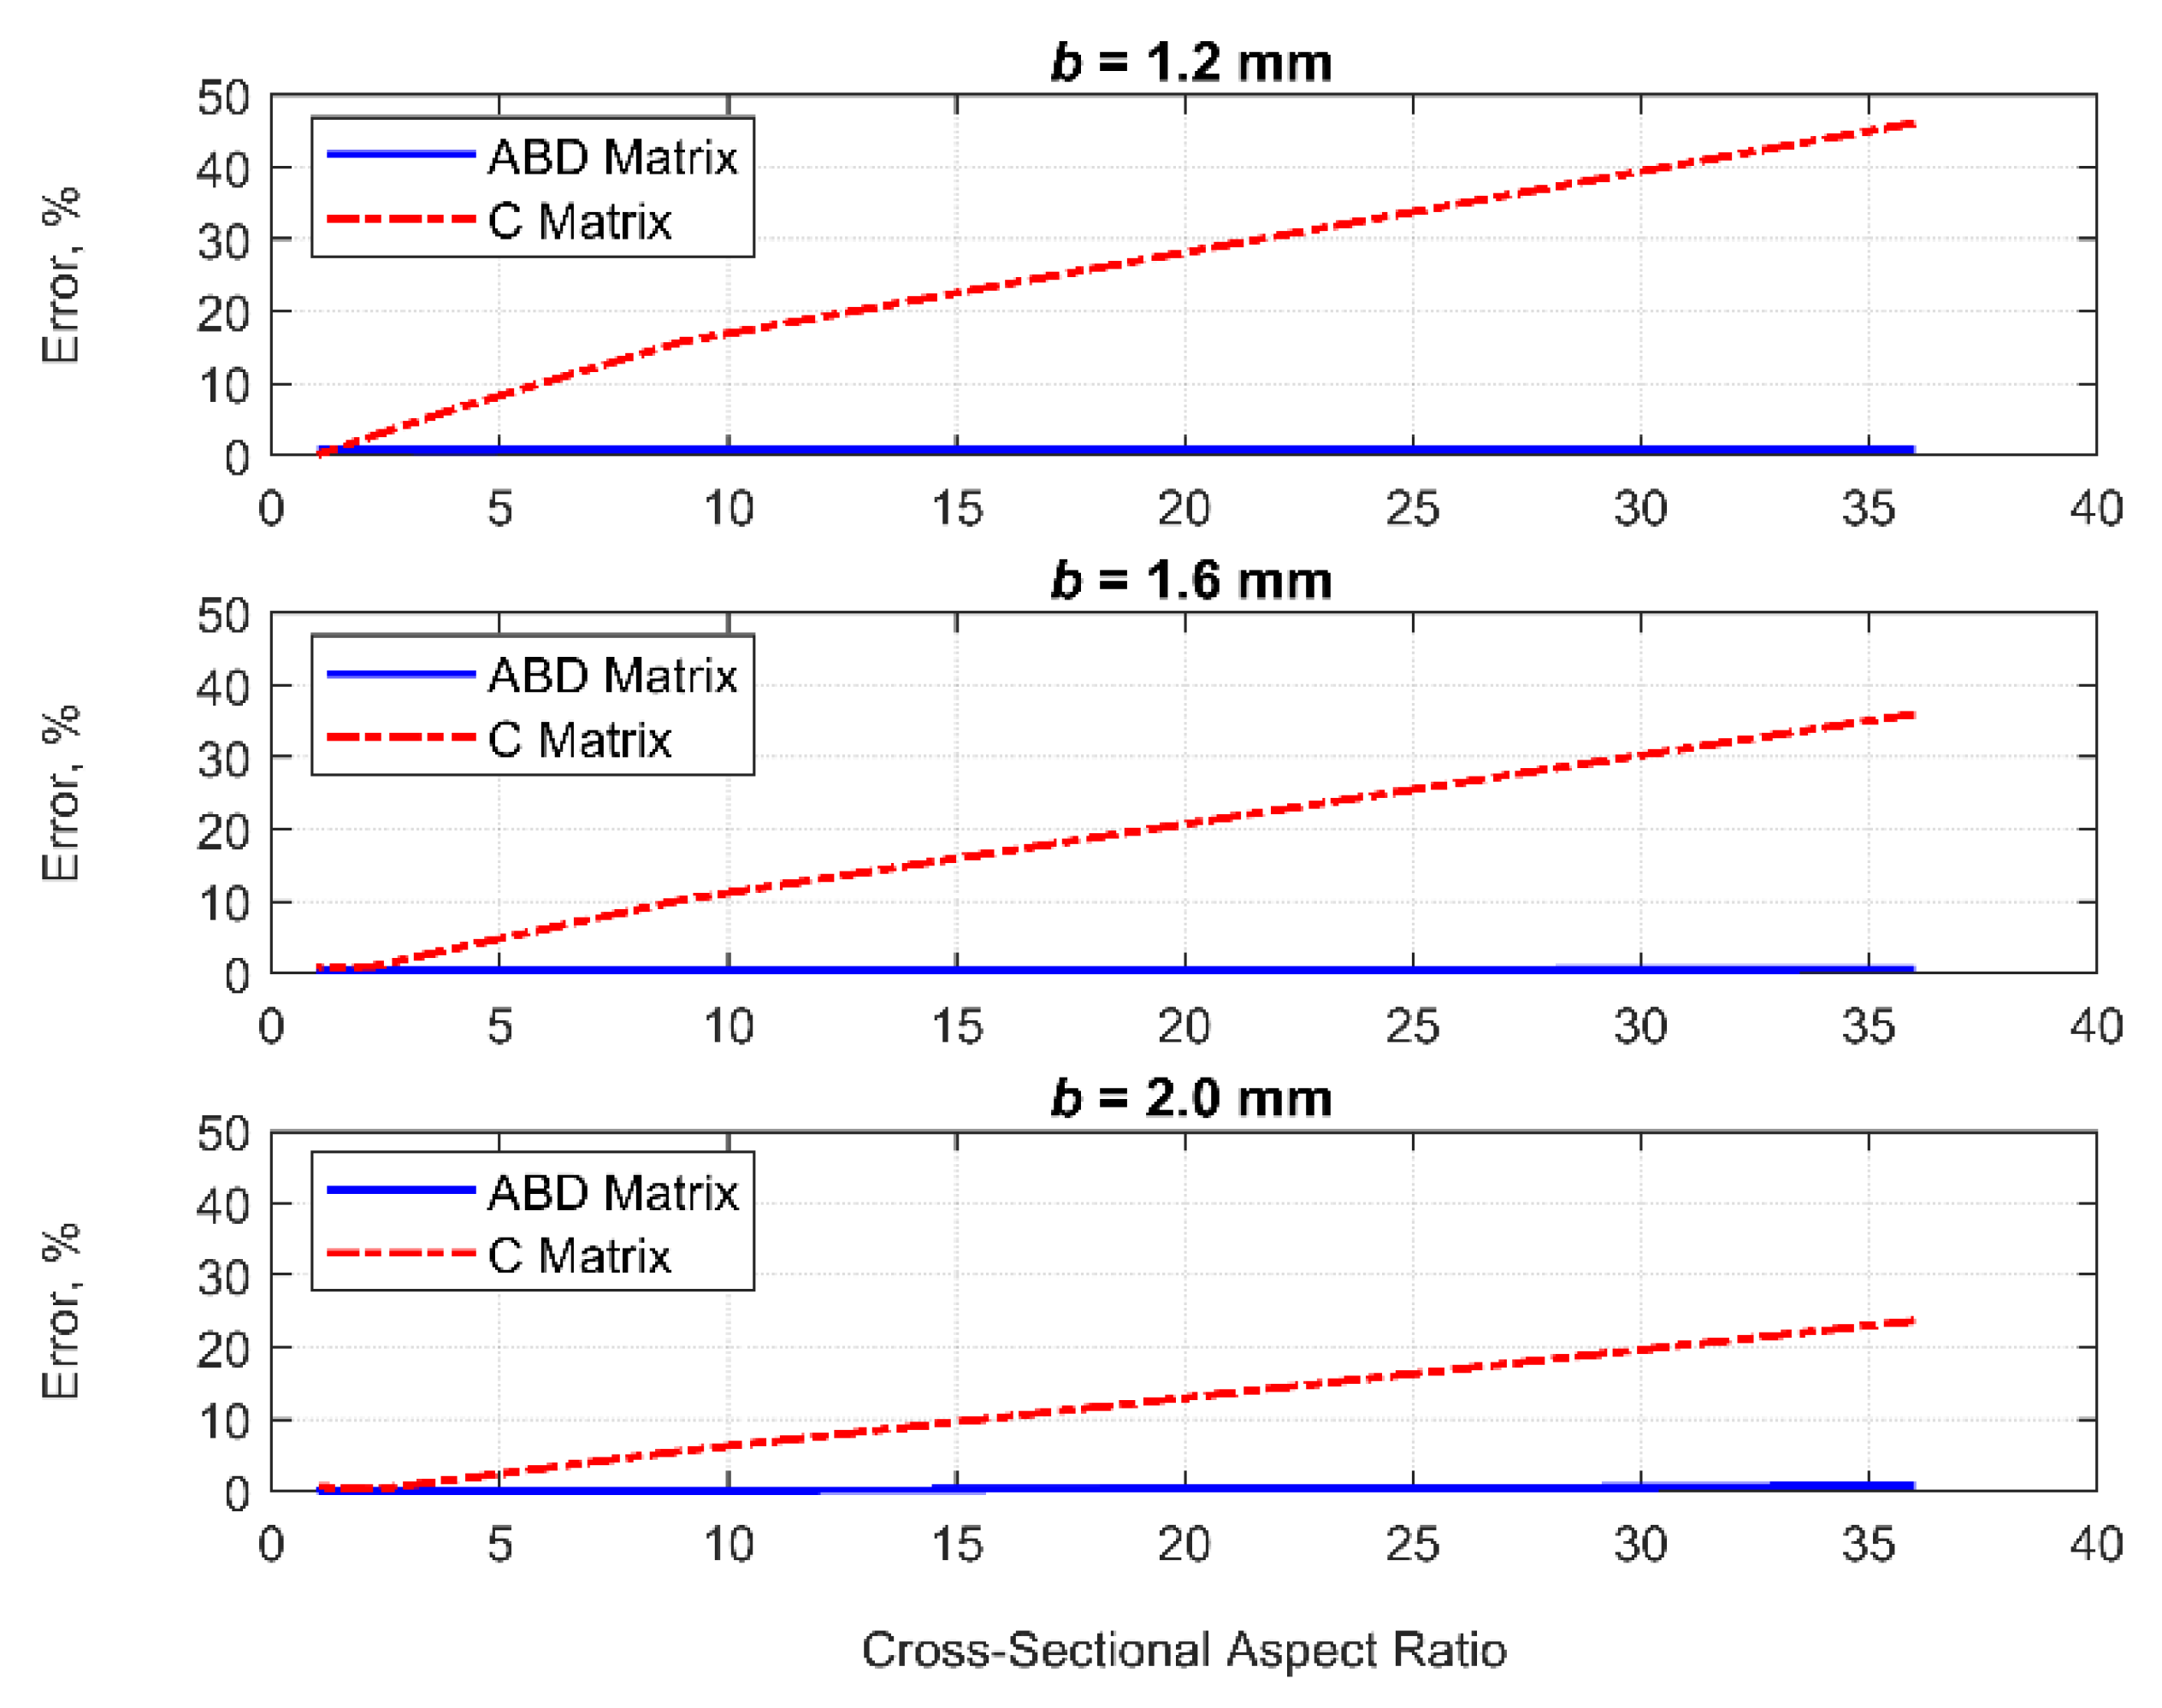
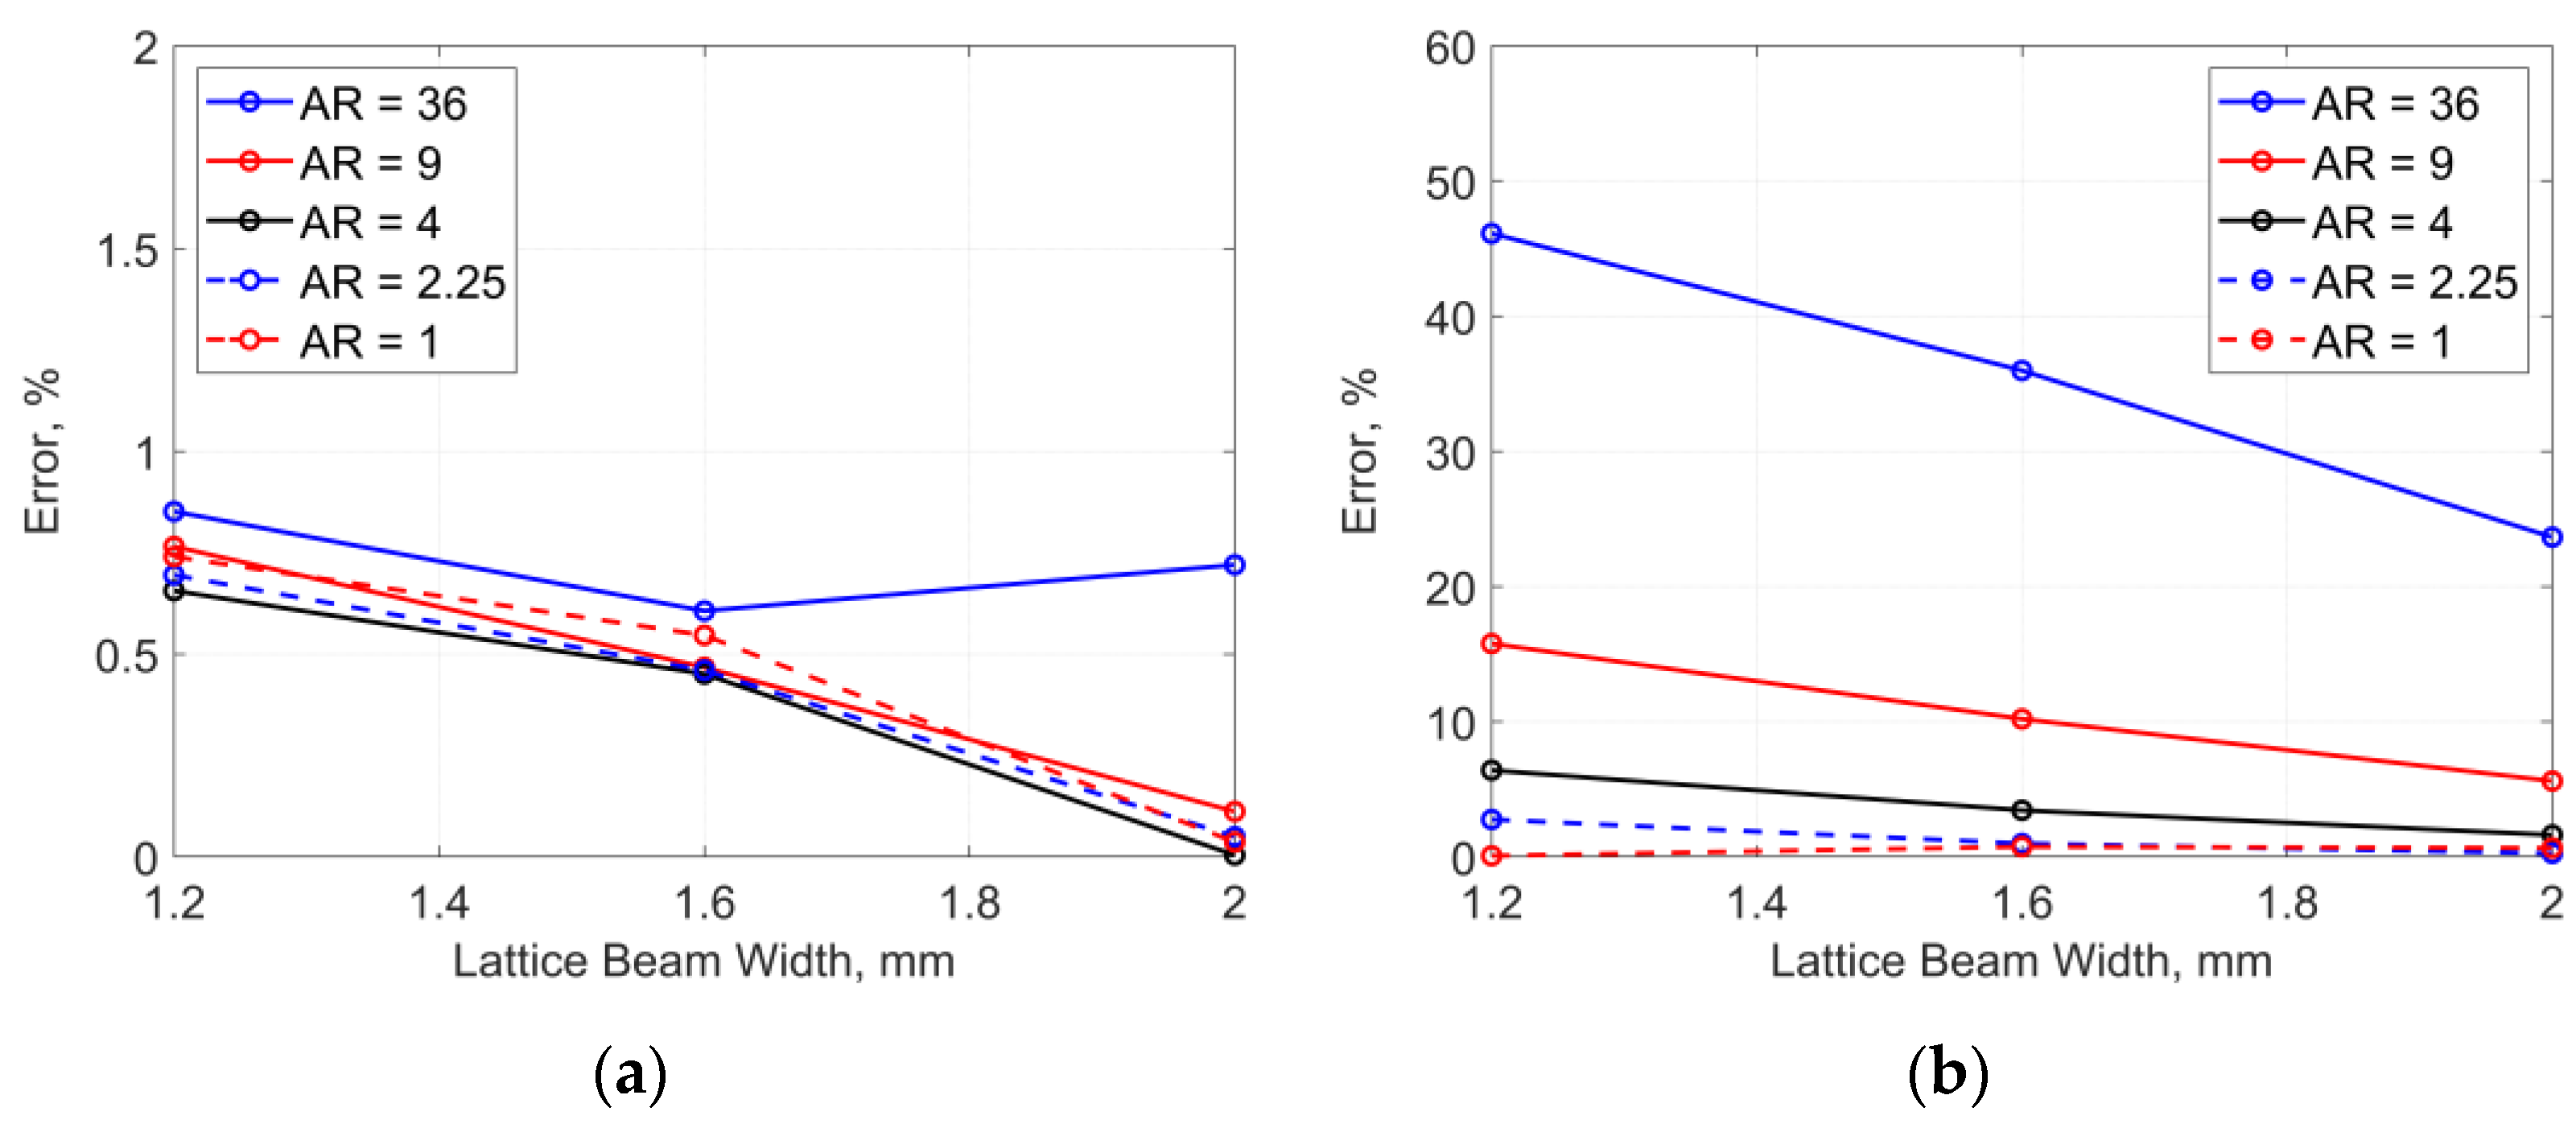
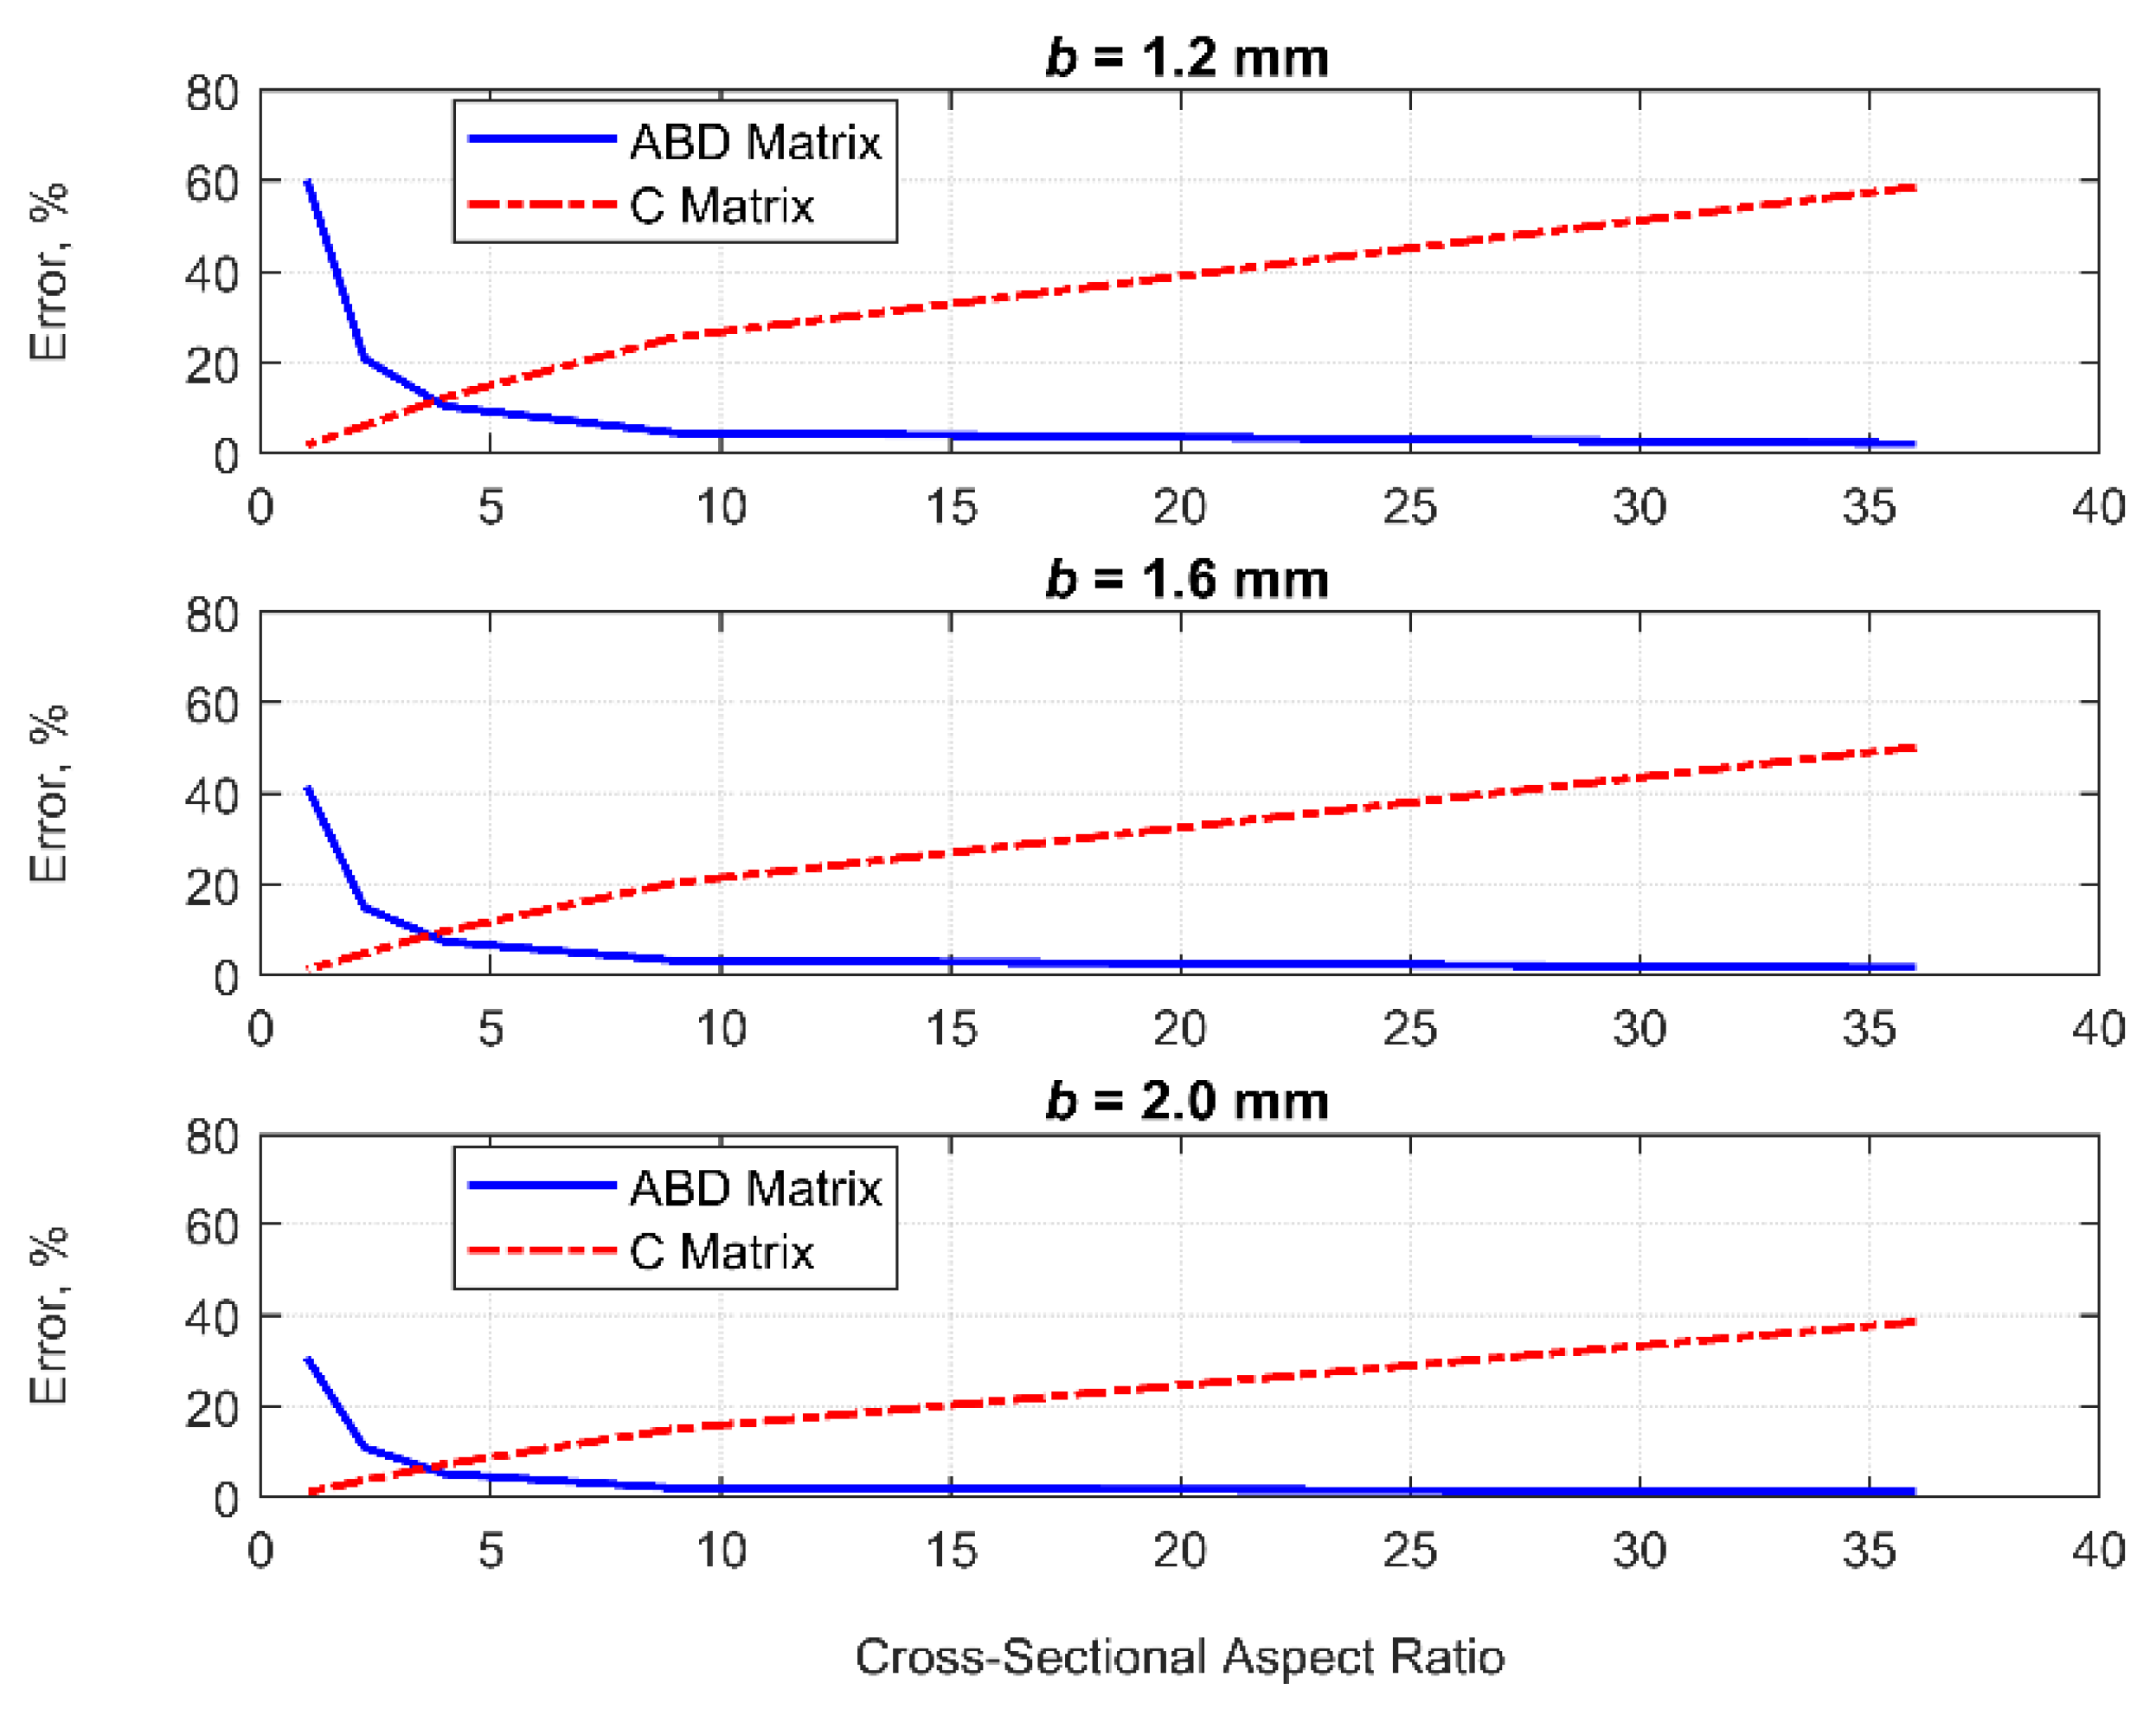
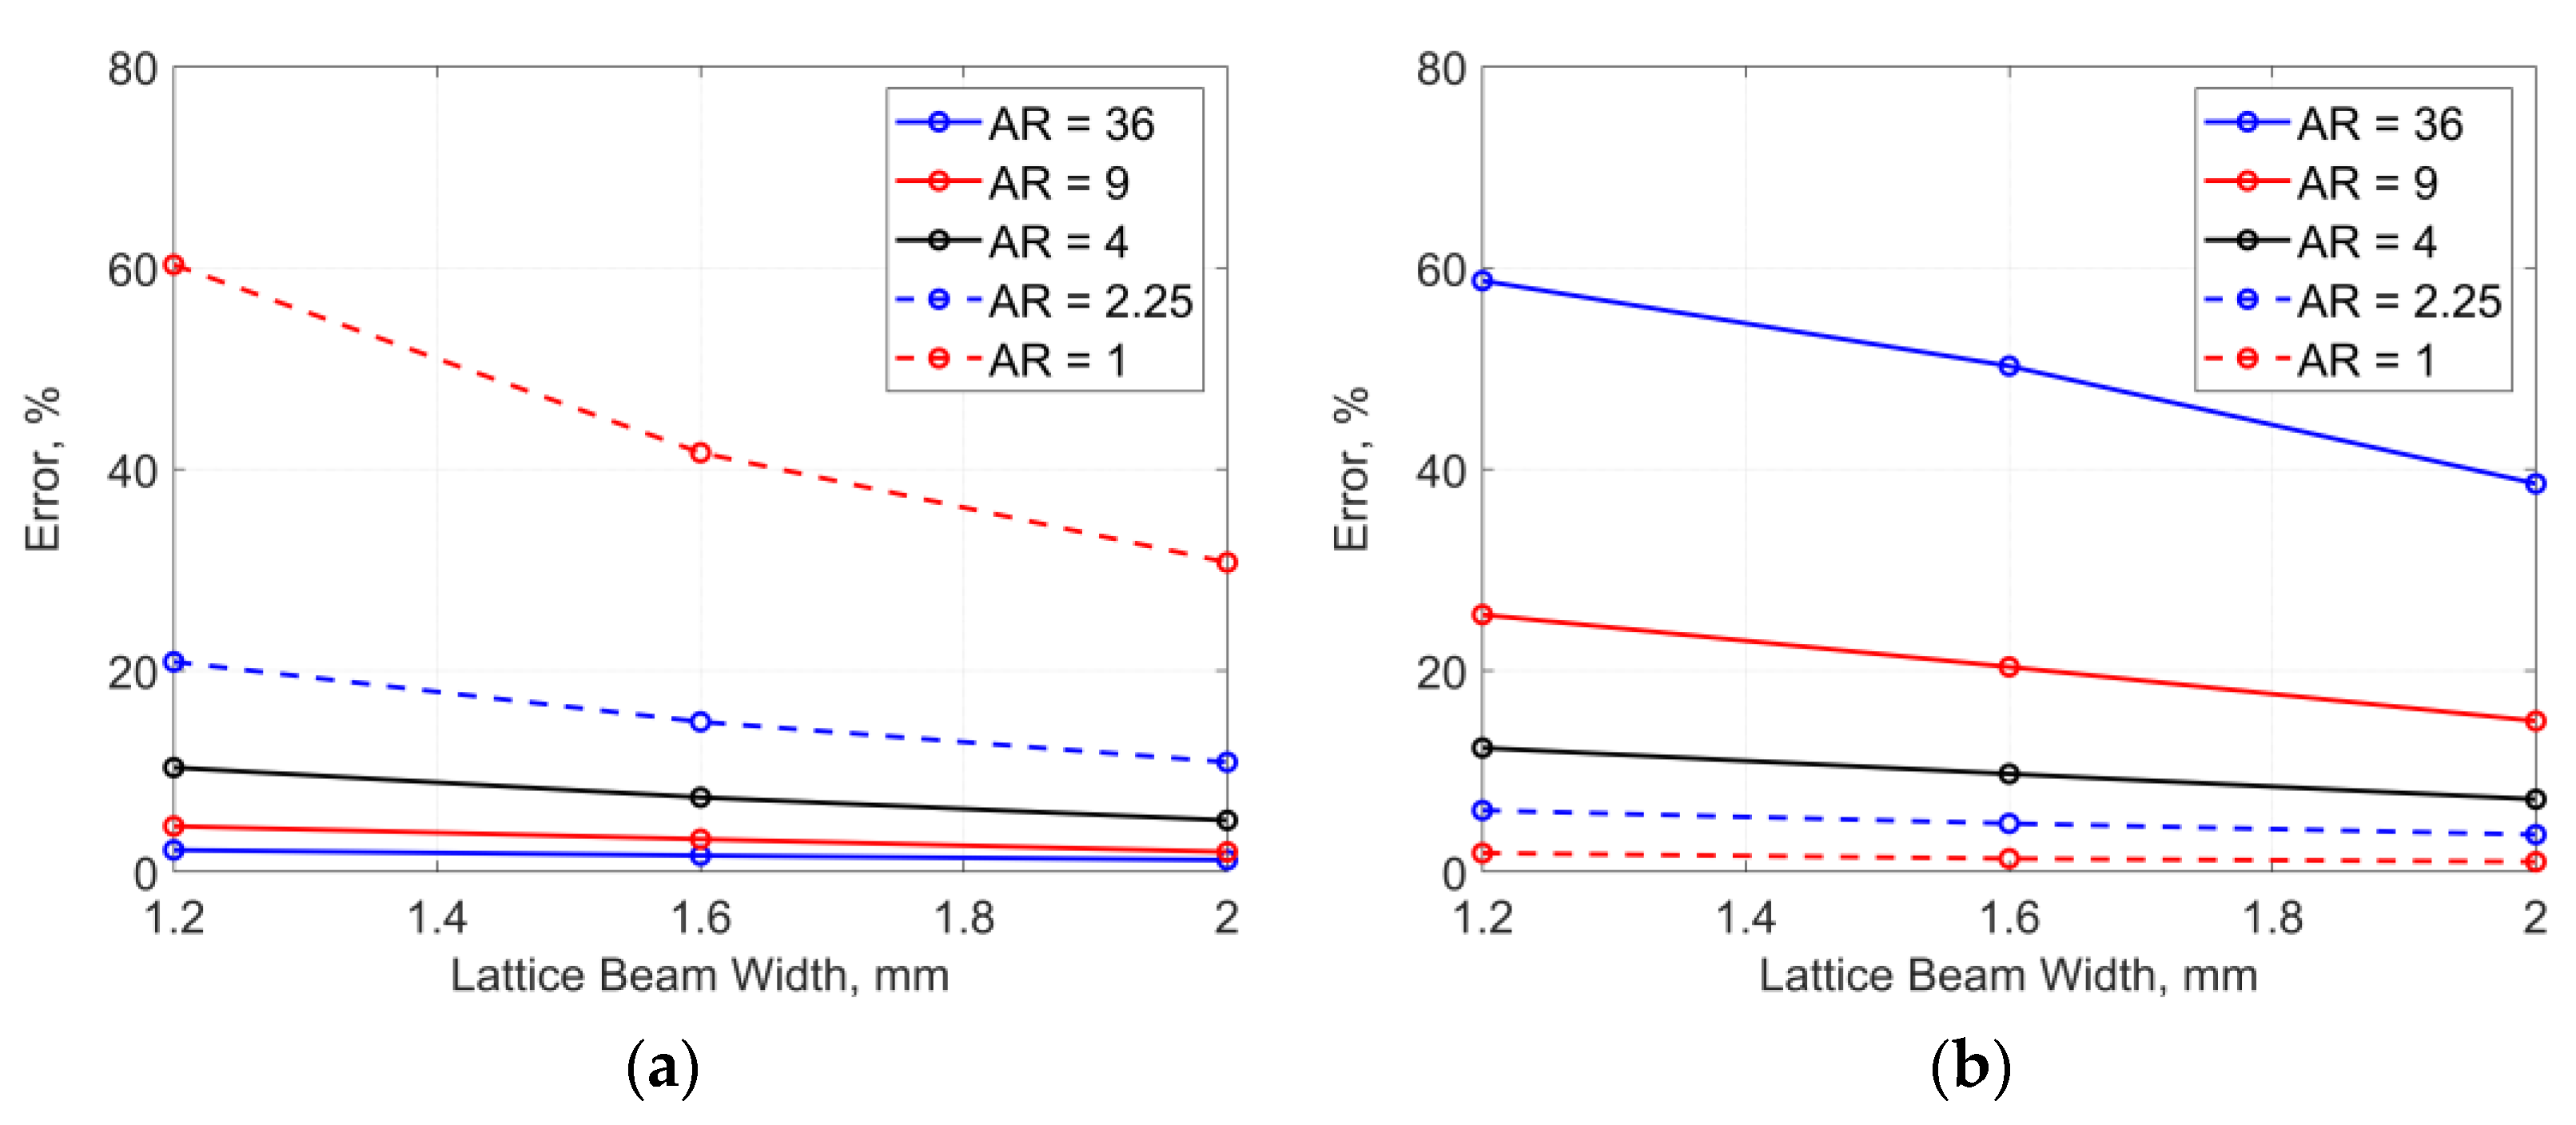
Predictions of bending and torsional stiffnesses by both homogenizations can provide enough accuracy within a certain threshold. Also, the validity range would be extended if a unit cell of lattices has a higher filling rate. Hence, these homogenizations can still be used for finite periodic arrays of lattices within the threshold.
These facts are important when one wants to use lattice structures as substructures or components. To achieve high performance in applications with lattice structures, there are cases in which lattices should not be completely periodic but distributed quasiperiodically, or in which lattice structures are limited in finite arrays due to the size of parts. In such cases, these homogenization approaches could still be used as efficient and reasonable modeling techniques.
This study contributes a guideline for effective designs and developments of high-performance aerospace structures with lattice-based architected materials since the cost-effective multiscale analysis would also enable the design optimization of such structures. The current study focused on the specific lattice topology, which was a simple cubic lattice. However, there are a variety of choices for lattice designs, including lattice topologies, unit cell sizes, lattice beam geometries, etc. Therefore, a detailed study with a wider range of design variables will be performed in future work to investigate the influences of each design variable.

Author Contributions

Conceptualization, N.T., R.H. and K.Y.; methodology, N.T., R.H. and K.Y.; software, N.T., R.H. and K.Y.; validation, N.T., R.H. and K.Y.; formal analysis, N.T., R.H. and K.Y.; investigation, N.T., R.H. and K.Y.; resources, N.T., R.H. and K.Y.; data curation, N.T.; writing—original draft preparation, N.T.; writing—review and editing, N.T., R.H. and K.Y.; visualization, N.T. and K.Y.; supervision, N.T.; project administration, N.T.; funding acquisition, N.T. All authors have read and agreed to the published version of the manuscript.

Funding

Part of this research was conducted under financial support by the New Energy and Industrial Technology Development Organization (NEDO), grant number JPNP20004.

Data Availability Statement

The data presented in this study are available on request from the corresponding author.

Conflicts of Interest

The authors declare no conflict of interest.

References

  1. Berger, J.B.; Wadley, H.N.G.; McMeeking, R.M. Mechanical Metamaterials at the Theoretical Limit of Isotropic Elastic Stiffness. Nature 2017, 543, 533–537. [Google Scholar] [CrossRef] [PubMed]
  2. Wu, W.; Hu, W.; Qian, G.; Liao, H.; Xu, X.; Berto, F. Mechanical Design and Multifunctional Applications of Chiral Mechanical Metamaterials: A Review. Mater. Des. 2019, 180, 107950. [Google Scholar] [CrossRef]
  3. Qureshi, A.; Li, B.; Tan, K.T. Numerical Investigation of Band Gaps in 3D Printed Cantilever-in-Mass Metamaterials. Sci. Rep. 2016, 6, 28314. [Google Scholar] [CrossRef]
  4. Tan, K.T.; Huang, H.H.; Sun, C.T. Blast-Wave Impact Mitigation Using Negative Effective Mass Density Concept of Elastic Metamaterials. Int. J. Impact Eng. 2014, 64, 20–29. [Google Scholar] [CrossRef]
  5. Wang, H.; Zhang, Y.; Lin, W.; Qin, Q.H. A Novel Two-Dimensional Mechanical Metamaterial with Negative Poisson’s Ratio. Comp. Mater. Sci. 2020, 171, 109232. [Google Scholar] [CrossRef]
  6. Ye, M.; Gao, L.; Li, H. A Design Framework for Gradually Stiffer Mechanical Metamaterial Induced by Negative Poisson’s Ratio Property. Mater. Des. 2020, 192, 108751. [Google Scholar] [CrossRef]
  7. Bauer, J.; Meza, L.R.; Schaedler, T.A.; Schwaiger, R.; Zheng, X.; Valdevit, L. Nanolattices: An Emerging Class of Mechanical Metamaterials. Adv. Mater. 2017, 29, 1701850. [Google Scholar] [CrossRef]
  8. Yuan, S.; Shen, F.; Bai, J.; Chua, C.K.; Wei, J.; Zhou, K. 3d Soft Auxetic Lattice Structures Fabricated by Selective Laser Sintering: Tpu Powder Evaluation and Process Optimization. Mater. Des. 2017, 120, 317–327. [Google Scholar] [CrossRef]
  9. Maconachie, T.; Leary, M.; Lozanovski, B.; Zhang, X.; Qian, M.; Faruque, O.; Brandt, M. Slm Lattice Structures: Properties, Performance, Applications and Challenges. Mater. Des. 2019, 183, 108137. [Google Scholar] [CrossRef]
  10. Xiao, Z.; Yang, Y.; Xiao, R.; Bai, Y.; Song, C.; Wang, D. Evaluation of Topology-Optimized Lattice Structures Manufactured Via Selective Laser Melting. Mater. Des. 2018, 143, 27–37. [Google Scholar] [CrossRef]
  11. Mizzi, L.; Attard, D.; Gatt, R.; Farrugia, P.S.; Grima, J.N. An Analytical and Finite Element Study on the Mechanical Properties of Irregular Hexachiral Honeycombs. Smart Mater. Struct. 2018, 27, 105016. [Google Scholar] [CrossRef]
  12. Gibson, L.J. Cellular Solids. MRS Bull. 2003, 28, 270–274. [Google Scholar] [CrossRef]
  13. Ashby, M.F. The Properties of Foams and Lattices. Philos. T. R. Soc. A 2006, 364, 15–30. [Google Scholar] [CrossRef] [PubMed]
  14. Zheng, X.; Lee, H.; Weisgraber, T.H.; Shusteff, M.; DeOtte, J.; Duoss, E.B.; Kuntz, J.D.; Biener, M.M.; Ge, Q.; Jackson, J.A.; et al. Ultralight, Ultrastiff Mechanical Metamaterials. Science 2014, 344, 1373–1377. [Google Scholar] [CrossRef] [PubMed]
  15. Yan, C.; Hao, L.; Hussein, A.; Young, P.; Raymont, D. Advanced Lightweight 316l Stainless Steel Cellular Lattice Structures Fabricated Via Selective Laser Melting. Mater. Des. 2014, 55, 533–541. [Google Scholar] [CrossRef]
  16. Zargarian, A.; Esfahanian, M.; Kadkhodapour, J.; Ziaei-Rad, S.; Zamani, D. On the Fatigue Behavior of Additive Manufactured Lattice Structures. Theor. Appl. Fract. Mech. 2019, 100, 225–232. [Google Scholar] [CrossRef]
  17. Shen, J.; Liu, K.; Zeng, Q.; Ge, J.; Dong, Z.; Liang, J. Design and Mechanical Property Studies of 3d Re-Entrant Lattice Auxetic Structure. Aerosp. Sci. Technol. 2021, 118, 106998. [Google Scholar] [CrossRef]
  18. Chen, Y.J.; Scarpa, F.; Liu, Y.J.; Leng, J.S. Elasticity of Anti-Tetrachiral Anisotropic Lattices. Int. J. Solids. Struct. 2013, 50, 996–1004. [Google Scholar] [CrossRef]
  19. Caillerie, D.; Nedelec, J.C. Thin Elastic and Periodic Plates. Math. Method. Appl. Sci. 1984, 6, 159–191. [Google Scholar] [CrossRef]
  20. Kohn, R.V.; Vogelius, M. A New Model for Thin Plates with Rapidly Varying Thickness. Int. J. Solids. Struct. 1984, 20, 333–350. [Google Scholar] [CrossRef]
  21. Kohn, R.V.; Vogelius, M. A New Model for Thin Plates with Rapidly Varying Thickness. II: A Convergence Proof. Q. Appl. Math. 1985, 43, 1–22. [Google Scholar] [CrossRef]
  22. Kohn, R.V.; Vogelius, M. A New Model for Thin Plates with Rapidly Varying Thickness. III: Comparison of Different Scalings. Q. Appl. Math. 1986, 44, 35–48. [Google Scholar] [CrossRef]
  23. Lewinski, T.; Telega, J.J. Plates, Laminates, and Shells: Asymptotic Analysis and Homogenization; World Scientific: Singapore, 2000; Volume 52. [Google Scholar]
  24. Schmitz, A.; Horst, P. A Finite Element Unit-Cell Method for Homogenised Mechanical Properties of Heterogeneous Plates. Compos. Pt. A Appl. Sci. Manuf. 2014, 61, 23–32. [Google Scholar] [CrossRef]
  25. Terada, K.; Hirayama, N.; Yamamoto, K.; Muramatsu, M.; Matsubara, S.; Nishi, S. Numerical Plate Testing for Linear Two-Scale Analyses of Composite Plates with in-Plane Periodicity. Int. J. Numer. Methods Eng. 2016, 105, 111–137. [Google Scholar] [CrossRef]
  26. Yoshida, K.; Nakagami, M. Numerical Analysis of Bending and Transverse Shear Properties of Plain-Weave Fabric Composite Laminates Considering Intralaminar Inhomogeneity. Adv. Compos. Mater. 2017, 26, 135–156. [Google Scholar] [CrossRef]
  27. Tsushima, N.; Higuchi, R. Stiffness and Strength Evaluation of Lattice-Based Mechanical Metamaterials by Decoupled Two-Scale Analysis. Mater. Today Commun. 2022, 31, 103598. [Google Scholar] [CrossRef]
  28. Terada, K.; Kikuchi, N. Nonlinear Homogenization Method for Practical Applications. Am. Soc. Mech. Eng. Appl. Mech. Div. AMD 1995, 212, 1–16. [Google Scholar]
  29. Tan, V.B.C.; Raju, K.; Lee, H.P. Direct Fe2 for Concurrent Multilevel Modelling of Heterogeneous Structures. Comput. Method Appl. M. 2020, 360, 112694. [Google Scholar] [CrossRef]
  30. Raju, K.; Tay, T.E.; Tan, V.B.C. A Review of the Fe2 Method for Composites. Multiscale Multidiscip. Model. Exp. Des. 2021, 4, 1–24. [Google Scholar] [CrossRef]
  31. Terada, K.; Kato, J.; Hirayama, N.; Inugai, T.; Yamamoto, K. A Method of Two-Scale Analysis with Micro-Macro Decoupling Scheme: Application to Hyperelastic Composite Materials. Comput. Mech. 2013, 52, 1199–1219. [Google Scholar] [CrossRef]
  32. Tsushima, N.; Arizono, H.; Tamayama, M. Geometrically Nonlinear Flutter Analysis with Corotational Shell Finite Element Analysis and Unsteady Vortex-Lattice Method. J. Sound Vib. 2022, 520, 116621. [Google Scholar] [CrossRef]
  33. Tsushima, N.; Tamayama, M.; Arizono, H.; Makihara, K. Geometrically Nonlinear Aeroelastic Characteristics of Highly Flexible Wing Fabricated by Additive Manufacturing. Aerosp. Sci. Technol. 2021, 117, 106923. [Google Scholar] [CrossRef]
  34. Tsushima, N.; Saitoh, K.; Arizono, H.; Nakakita, K. Structural and Aeroelastic Studies of Wing Model with Metal Additive Manufacturing for Transonic Wind Tunnel Test by Naca 0008 Example. Aerospace 2021, 8, 200. [Google Scholar] [CrossRef]
  35. Tsushima, N.; Yokozeki, T.; Su, W.; Arizono, H. Geometrically Nonlinear Static Aeroelastic Analysis of Composite Morphing Wing with Corrugated Structures. Aerosp. Sci. Technol. 2019, 88, 244–257. [Google Scholar] [CrossRef]
  36. White, D.A.; Kudo, J.; Swartz, K.; Tortorelli, D.A.; Watts, S. A Reduced Order Model Approach for Finite Element Analysis of Cellular Structures. Finite Elem. Anal. Des. 2023, 214, 103855. [Google Scholar] [CrossRef]
  37. Coenen, E.W.C.; Kouznetsova, V.G.; Geers, M.G.D. Computational Homogenization for Heterogeneous Thin Sheets. Int. J. Numer. Methods Eng. 2010, 83, 1180–1205. [Google Scholar] [CrossRef]
  38. Geers, M.G.D.; Coenen, E.W.C.; Kouznetsova, V.G. Multi-Scale Computational Homogenization of Structured Thin Sheets. Model. Simul. Mater. Sc. 2007, 15, S393. [Google Scholar] [CrossRef]
  39. Higuchi, R.; Yokozeki, T.; Nagashima, T.; Aoki, T. Evaluation of Mechanical Properties of Noncircular Carbon Fiber Reinforced Plastics by Using Xfem-Based Computational Micromechanics. Compos. Pt. A Appl. Sci. Manuf. 2019, 126, 105556. [Google Scholar] [CrossRef]
  40. Higuchi, R.; Aoki, R.; Yokozeki, T.; Okabe, T. Evaluation of the in-Situ Damage and Strength Properties of Thin-Ply Cfrp Laminates by Micro-Scale Finite Element Analysis. Adv. Compos. Mater. 2020, 29, 475–493. [Google Scholar] [CrossRef]
  41. Systems, D. Abaqus 2019 Documentation; Simulia Corp.: Providence, RI, USA, 2019. [Google Scholar]
  42. ANSYS Inc. Ansys Mechanical User’s Guide; ANSYS Inc.: Southpointe Canonsburg, PA, USA, 2013. [Google Scholar]
  43. Desalvo, G.J.; Gorman, R.W. Ansys Engineering Analysis System User’s Manual; Swanson Analysis Systems: Houston, PA, USA, 1989. [Google Scholar]
  44. Banerjee, B.; Chen, Z.J.; Kathirgamanathan, A.; Das, R. Comparison of Ansys Elements Shell181 and Solsh190; Industrial Research Limited: Lower Hutt, New Zealand, 2011. [Google Scholar]
Figure 1. A concept of computational homogenization for the lattice structure. Effective characteristics of a lattice structure constructed with periodic unit cells are evaluated based on computational homogenizations with the representative unit cell. The obtained effective properties are used to predict macroscopic responses of the structure with a homogenized structural model.
Aerospace 10 00723 g001
Figure 2. A concept of computational homogenization for the lattice structures. Effective characteristics of a lattice structure constructed with periodic unit cells are evaluated based on computational homogenizations with the representative unit cell. The obtained effective properties are used to predict macroscopic responses of the structure with a homogenized structural model. (a) A periodic unit cell; (b) a lattice structure constructed with periodic unit cells.
Aerospace 10 00723 g002
Figure 3. A plate model constructed with simple cubic unit cells. The in-plane dimensions of the plate model were 315 mm and 105 mm in the x- and y-directions. The unit cell is bounded by 3 mm × 3 mm × 3 mm.
Aerospace 10 00723 g003
Figure 4. Plate models with different finite elements. The lattice plate is modeled as five different finite element models: the detailed model with hex solid elements, the homogenized model based on the computational homogenization for plates, and the homogenized models based on the computational homogenization for solids. The * symbols represent which software was used.
Aerospace 10 00723 g004
Figure 5. Boundary conditions of the plate models. The cantilevered condition is applied at one edge by fixing six degrees of freedom. The forced loading is applied at the center node on the other end.
Aerospace 10 00723 g005
Figure 6. Deformations of detailed and homogenized models under forced tensile displacement. The maximum error in the homogenized shell model with the equivalent ABD matrix is 2.5%. The maximum error in the homogenized models with the equivalent C matrix is 5.9%. (a) Detailed solid model; (b) homogenized shell model (equivalent ABD matrix); (c) homogenized shell model (equivalent C matrix); (d) homogenized solsh model (equivalent C matrix); (e) homogenized solid model (equivalent C matrix). The color indicates the displacements in the x direction.
Aerospace 10 00723 g006
Figure 7. Deformations of detailed and homogenized models with the equivalent ABD matrix under the forced bending rotation. The maximum error in the homogenized shell model with the equivalent ABD matrix is 2.4%. The maximum error in the homogenized models with the equivalent C matrix is more than 46%. (a) Detailed solid model; (b) homogenized shell model (equivalent ABD matrix); (c) homogenized shell model (equivalent C matrix); (d) homogenized solsh model (equivalent C matrix); (e) homogenized solid model (equivalent C matrix). The color indicates the displacements in the z direction.
Aerospace 10 00723 g007
Figure 8. Deformations of detailed and homogenized models with the equivalent ABD matrix under forced torsional rotation. The maximum error in the homogenized shell model with the equivalent ABD matrix is 2.3%. The maximum error in the homogenized models with the equivalent C matrix is more than 49%. (a) Detailed solid model; (b) homogenized shell model (equivalent ABD matrix); (c) homogenized shell model (equivalent C matrix); (d) homogenized solsh model (equivalent C matrix); (e) homogenized solid model (equivalent C matrix). The color indicates the displacements in the z direction.
Aerospace 10 00723 g008
Figure 9. Plates with different numbers of unit cell layers for detailed solid models. The numbers of unit cell layers are varied from one to six to change the thickness-wise periodicity, while the cross-sectional areas and the width of lattice beams are fixed. (a) Model 1 with the cross-sectional aspect ratio = 36; (b) Model 2 with the cross-sectional aspect ratio = 9; (c) Model 3 with the cross-sectional aspect ratio = 4; (d) Model 4 with the cross-sectional aspect ratio = 2.25; (e) Model 5 with the cross-sectional aspect ratio = 1.
Aerospace 10 00723 g009
Figure 10. An image of a “representative unit cell” of an equivalent ABD matrix for a plate with multiple cells in the thickness direction. The whole layers of the multiple unit cells, as bounded in the red box, are considered as a “representative unit cell”.
Aerospace 10 00723 g010
Figure 11. Errors of resultant loads on the center node for the homogenized models to the ones for the detailed model with different cell layers under the forced tensile displacement. The homogenized models with both equivalent ABD and C matrices maintain the prediction differences to the detailed models of less than 4%.
Aerospace 10 00723 g011
Figure 12. Errors of resultant moments on the center node for the homogenized models to the ones for the detailed model with different cell layers under the forced bending rotation. The errors of the homogenized models with the equivalent ABD matrices are maintained at less than 1%, while the ones with the equivalent C matrices increase for the higher cross-sectional aspect ratios.
Aerospace 10 00723 g012
Figure 13. Errors of resultant moments on the center node for the homogenized models to the ones for the detailed model with different cell layers under the forced torsional rotation. The errors of the homogenized models with the equivalent ABD matrices increase for the lower aspect ratio, while the ones with the equivalent C matrices increase for the higher cross-sectional aspect ratios.
Aerospace 10 00723 g013
Figure 14. Errors of resultant loads on the center node for the homogenized models to the ones for the detailed model with different widths of lattice beams under forced tensile displacement. The errors of the homogenized models are reduced as the width of the lattice beams increases. (a) ABD matrices; (b) C matrices.
Aerospace 10 00723 g014
Figure 15. Errors of resultant moments on the center node for the homogenized models to the ones for the detailed model with different widths of lattice beams under forced bending rotation. The errors of the homogenized models are mostly reduced as the width of the lattice beams increases. (a) ABD matrices; (b) C matrices.
Aerospace 10 00723 g015
Figure 16. Errors of resultant moments on the center node for the homogenized models to the ones for the detailed model with different widths of lattice beams under the forced torsional rotation. The errors of the homogenized models are mostly reduced as the width of the lattice beams increases. (a) ABD matrices; (b) C matrices.
Aerospace 10 00723 g016
Table 1. Resultant loads on the center node of the detailed and homogenized models under the forced tensile.
Modelb, mmResultant Load, N
Detailed1.2512.32
Shell (ABD matrix)515.35 (0.59%)
Shell (C matrix)527.83 (3.03%)
Solsh (C matrix)527.88 (3.04%)
Solid (C matrix)527.85 (3.03%)
Detailed1.6939.60
Shell (ABD matrix)963.06 (2.50%)
Shell (C matrix)994.68 (5.86%)
Solsh (C matrix)994.84 (5.88%)
Solid (C matrix)994.74 (5.87%)
Detailed2.01575.1
Shell (ABD matrix)1585.6 (0.67%)
Shell (C matrix)1625.4 (3.19%)
Solsh (C matrix)1626.0 (3.23%)
Solid (C matrix)1625.7 (3.21%)
Table 2. Resultant moments on the center node of the detailed and homogenized model with the equivalent ABD.
Modelb, mmResultant Moment, N·mm
Detailed1.212.903
Shell (ABD matrix)13.013 (0.85%)
Shell (C matrix)6.9361 (46.24%)
Solsh (C matrix)6.9204 (46.37%)
Solid (C matrix)6.9189 (46.38%)
Detailed1.620.038
Shell (ABD matrix)20.520 (2.41%)
Shell (C matrix)13.133 (34.46%)
Solsh (C matrix)13.065 (34.80%)
Solid (C matrix)13.133 (34.46%)
Detailed2.027.704
Shell (ABD matrix)28.234 (1.91%)
Shell (C matrix)21.630 (21.92%)
Solsh (C matrix)21.417 (22.69%)
Solid (C matrix)21.633 (21.91%)
Table 3. Resultant moments on the center node of the detailed and homogenized model with the equivalent ABD matrix under the forced torsional rotation.
Modelb, mmResultant Moment, N·mm
Detailed1.29.0123
Shell (ABD matrix)9.2158 (2.26%)
Shell (C matrix)3.7271 (58.64%)
Solsh (C matrix)3.6902 (59.05%)
Solid (C matrix)3.6699 (59.28%)
Detailed1.623.019
Shell (ABD matrix)23.442 (1.84%)
Shell (C matrix)11.645 (49.41%)
Solsh (C matrix)11.541 (49.86%)
Solid (C matrix)11.473 (50.16%)
Detailed2.041.934
Shell (ABD matrix)41.549 (0.92%)
Shell (C matrix)25.644 (38.85%)
Solsh (C matrix)25.424 (39.37%)
Solid (C matrix)25.266 (39.75%)
Table 4. Resultant loads on the center node of the detailed and homogenized models with multiple cell layers under the forced tensile displacement.
b, mmWidth, mmThickness, mmResultant Load, N
DetailedShell
(ABD Matrix)
Solid
(C Matrix)
1.21083526.996530.083 (0.59%)545.720 (3.55%)
546533.166535.813 (0.50%)545.540 (2.32%)
369535.078537.723 (0.49%)545.490 (1.95%)
2712535.843538.677 (0.53%)545.470 (1.80%)
1818536.225539.631 (0.64%)545.460 (1.72%)
1.61083987.637990.646 (0.30%)1023.210 (3.60%)
546999.8291002.53 (0.27%)1022.384 (2.26%)
3691003.391006.47 (0.31%)1022.151 (1.87%)
27121004.821008.44 (0.36%)1022.061 (1.72%)
18181005.541010.41 (0.48%)1022.017 (1.64%)
2.010831633.991631.08 (−0.18%)1672.289 (2.34%)
5461647.241642.77 (−0.27%)1669.681 (1.36%)
3691651.111646.60 (−0.27%)1668.957 (1.08%)
27121652.691648.52 (−0.25%)1668.685 (0.97%)
18181653.491650.44 (−0.18%)1668.556 (0.91%)
Table 5. Resultant moments on the center node of the detailed and homogenized models with multiple cell layers under the forced bending rotation.
b, mmWidth, mmThickness, mmResultant Moment, N·mm
DetailedShell
(ABD Matrix)
Solid
(C Matrix)
1.2108313.274313.3873 (0.85%)7.154 (46.11%)
54633.929434.189 (0.77%)28.579 (15.77%)
36968.665269.1156 (0.66%)64.272 (6.40%)
2712117.475118.291 (0.69%)114.240 (2.75%)
1818257.200259.103 (0.74%)257.020 (0.07%)
1.6108320.987621.1148 (0.61%)13.439 (35.97%)
54659.681459.9601 (0.47%)53.598 (10.19%)
369124.748125.31 (0.45%)120.463 (3.43%)
2712216.184217.178 (0.46%)214.066 (0.98%)
1818477.997480.607 (0.55%)481.534 (0.74%)
2.0108328.855129.0628 (0.72%)22.034 (23.64%)
54692.834692.9382 (0.11%)87.637 (5.60%)
369199.988199.98 (0.00%)196.772 (1.61%)
2712350.387350.214 (0.05%)349.517 (0.25%)
1818780.946780.662 (0.04%)786.025 (0.65%)
Table 6. Resultant moments on the center node of the detailed and homogenized models with multiple cell layers under forced torsional rotation.
b, mmWidth, mmThickness, mmResultant Moment, N·mm
DetailedShell (ABD Matrix)Solid (C Matrix)
1.210839.377789.58021 (2.16%)3.873 (58.70%)
54617.997618.8126 (4.53%)13.402 (25.53%)
36930.189333.3146 (10.35%)26.474 (12.31%)
271242.046650.8146 (20.85%)39.482 (6.10%)
181852.398583.9939 (60.30%)51.423 (1.86%)
1.6108323.911424.2967 (1.61%)11.901 (50.23%)
54652.916154.6308 (3.24%)42.151 (20.34%)
36992.908299.7746 (7.39%)83.874 (9.72%)
2712132.062151.731 (14.89%)125.723 (4.80%)
1818166.669236.039 (41.62%)164.490 (1.31%)
2.0108342.518543.017 (1.17%)26.130 (38.54%)
546109.803111.973 (1.98%)93.362 (14.97%)
369201.765212.075 (5.11%)187.237 (7.20%)
2712292.105323.915 (10.89%)281.315 (3.69%)
1818372.514486.983 (30.73%)368.809 (0.99%)
Disclaimer/Publisher’s Note: The statements, opinions and data contained in all publications are solely those of the individual author(s) and contributor(s) and not of MDPI and/or the editor(s). MDPI and/or the editor(s) disclaim responsibility for any injury to people or property resulting from any ideas, methods, instructions or products referred to in the content.

