
Hypotension after Anesthesia Induction: Target-Controlled Infusion Versus Manual Anesthesia Induction of Propofol
 , , ,
, , ,
Abstract
1. Introduction
2. Materials and Methods
2.1. Ethical Approval
2.2. Trial Registration
2.3. Patients
2.4. Randomization and Blinding
2.5. Study Protocol
2.6. Sets of Measurements
2.7. Statistical Analysis
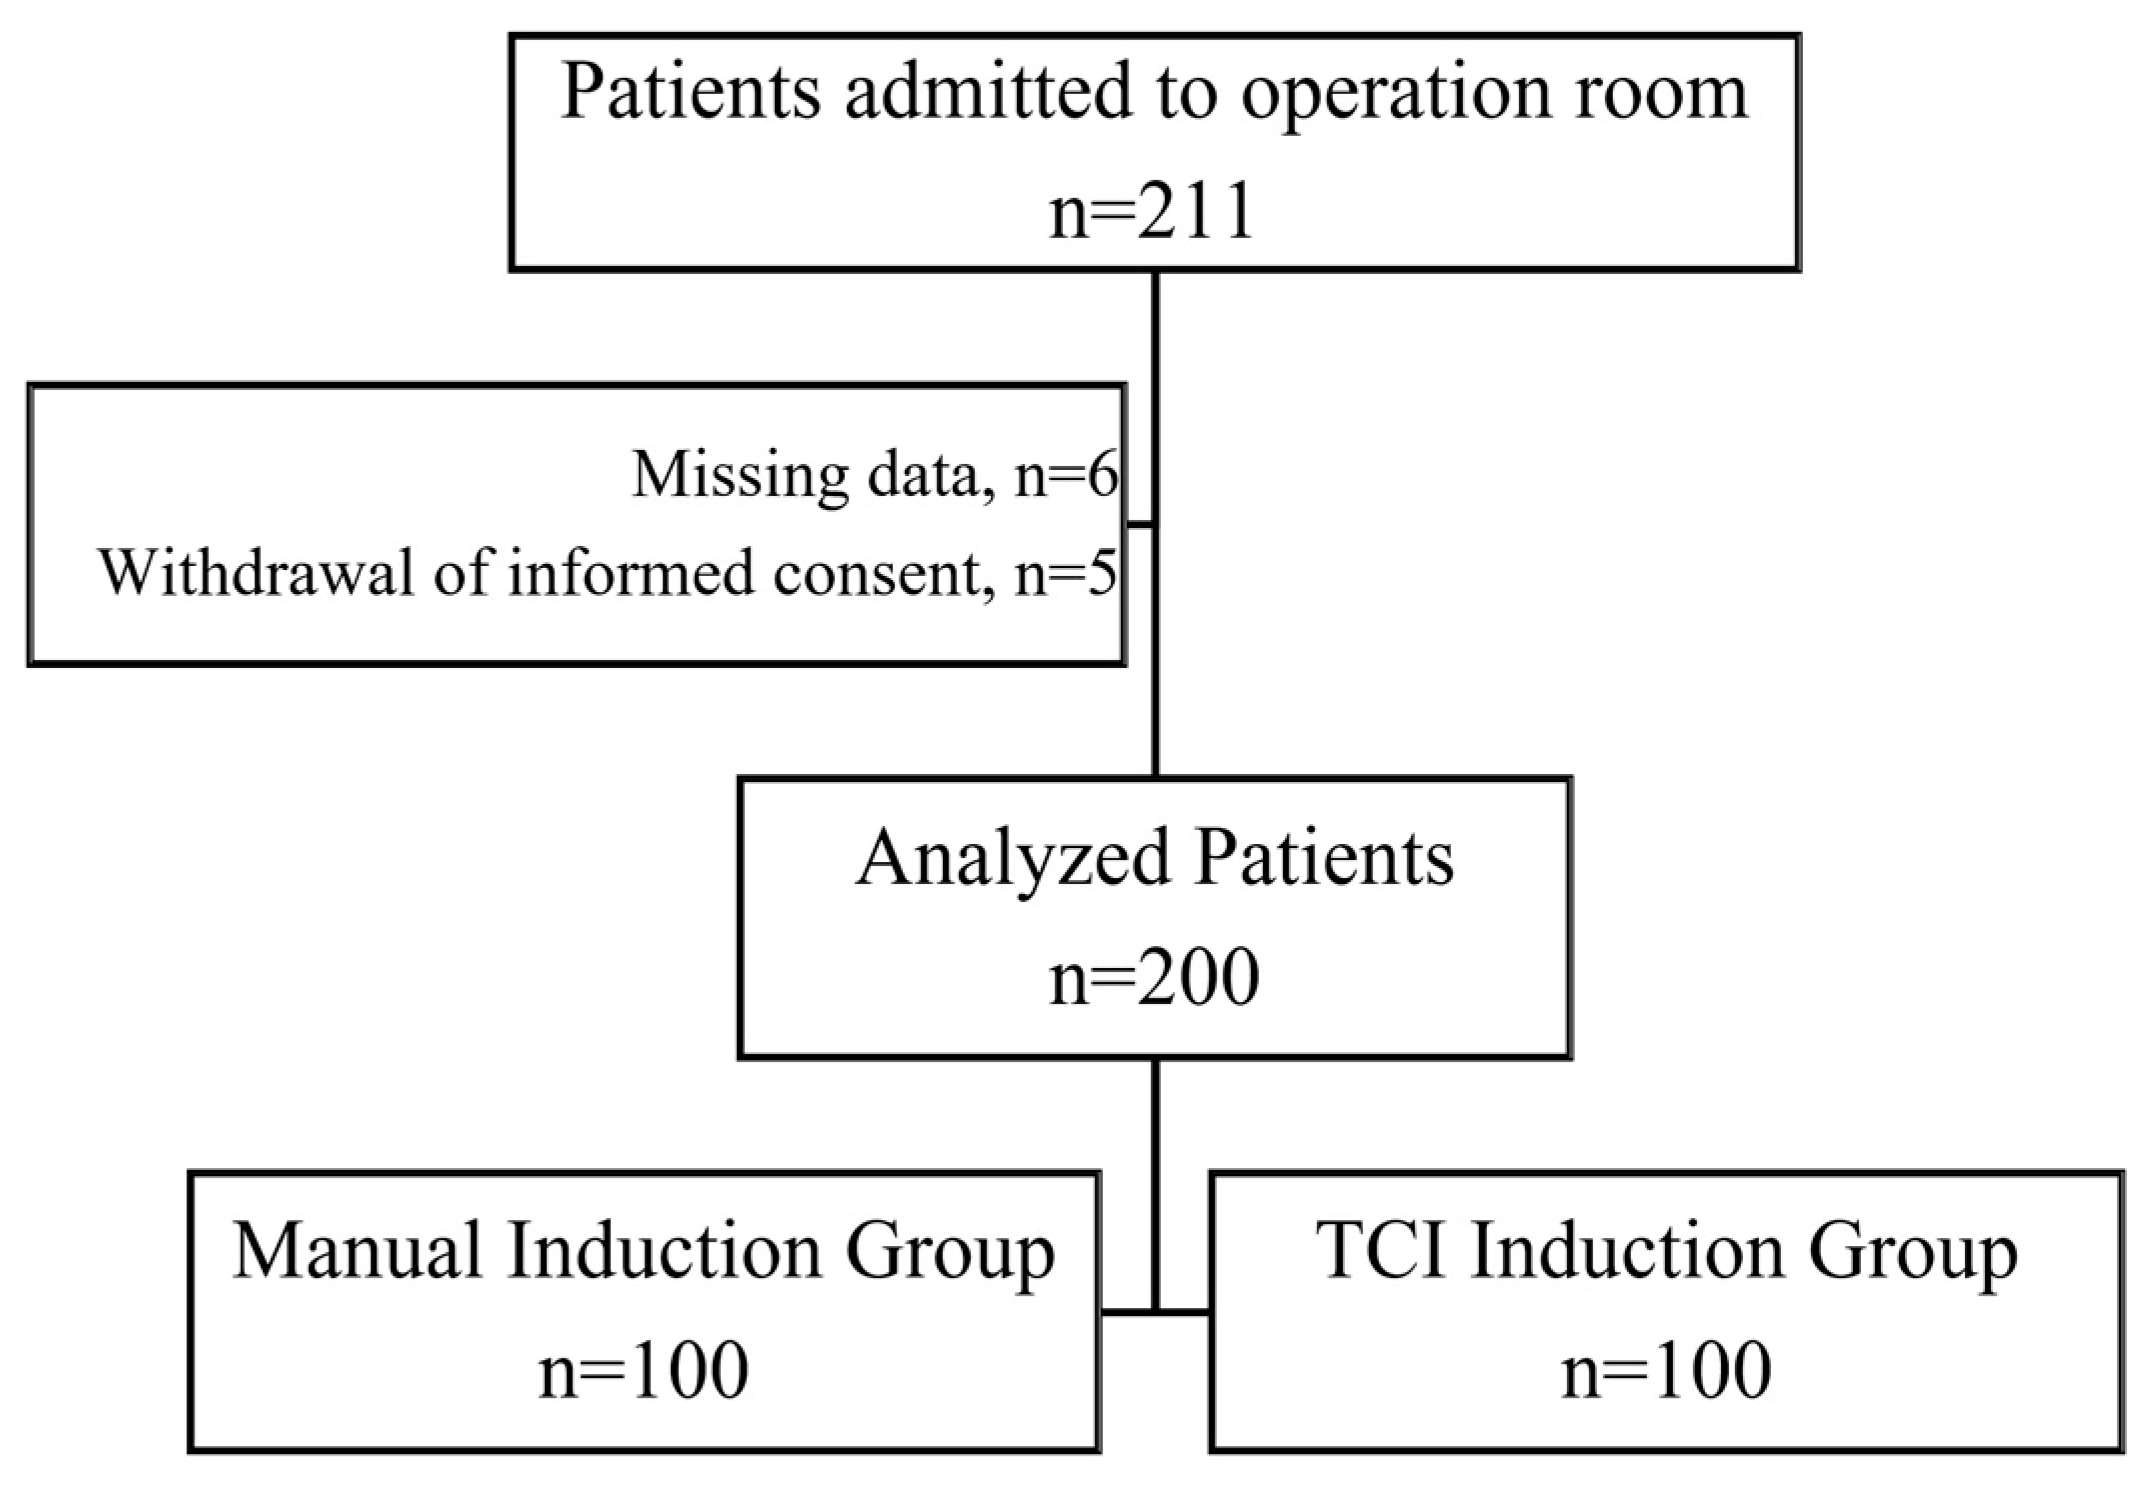
3. Results
4. Discussion
5. Conclusions
Author Contributions
Funding
Institutional Review Board Statement
Informed Consent Statement
Data Availability Statement
Acknowledgments
Conflicts of Interest
References
- Saugel, B.; Sessler, D.I. Perioperative Blood Pressure Management. Anesthesiology 2021, 134, 250–261. [Google Scholar] [CrossRef]
- Jor, O.; Maca, J.; Koutna, J.; Gemrotova, M.; Vymazal, T.; Litschmannova, M.; Sevcik, P.; Reimer, P.; Mikulova, V.; Trlicova, M.; et al. Hypotension after Induction of General Anesthesia: Occurrence, Risk Factors, and Therapy. A Prospective Multicentre Observational Study. J. Anesth. 2018, 32, 673–680. [Google Scholar] [CrossRef] [PubMed]
- Südfeld, S.; Brechnitz, S.; Wagner, J.Y.; Reese, P.C.; Pinnschmidt, H.O.; Reuter, D.A.; Saugel, B. Post-Induction Hypotension and Early Intraoperative Hypotension Associated with General Anaesthesia. Br. J. Anaesth. 2017, 119, 57–64. [Google Scholar] [CrossRef] [PubMed]
- Goodchild, C.S.; Serrao, J.M. Propofol-Induced Cardiovascular Depression: Science and Art. Br. J. Anaesth. 2015, 115, 641–642. [Google Scholar] [CrossRef] [PubMed]
- Kakazu, C.Z.; Lippmann, M. Playing with Fire: Debate about Propofol-Induced Hypotension. Br. J. Anaesth. 2015, 114, 164–165. [Google Scholar] [CrossRef]
- Guarracino, F.; Lapolla, F.; Cariello, C.; Danella, A.; Doroni, L.; Baldassarri, R.; Boldrini, A.; Volpe, M.L. Target Controlled Infusion: TCI. Minerva Anestesiol. 2005, 71, 335–337. [Google Scholar]
- Schonberger, R.B.; Dai, F.; Michel, G.; Vaughn, M.T.; Burg, M.M.; Mathis, M.; Kheterpal, S.; Akhtar, S.; Shah, N.; Bardia, A. Association of Propofol Induction Dose and Severe Pre-Incision Hypotension among Surgical Patients over Age 65. J. Clin. Anesth. 2022, 80, 110846. [Google Scholar] [CrossRef] [PubMed]
- Yeganeh, N.; Roshani, B.; Yari, M.; Almasi, A. Target-Controlled Infusion Anesthesia with Propofol and Remifentanil Compared with Manually Controlled Infusion Anesthesia in Mastoidectomy Surgeries. Middle East J. Anaesthesiol. 2010, 20, 785–793. [Google Scholar]
- Schnider, T.W.; Minto, C.F.; Struys, M.M.R.F.; Absalom, A.R. The Safety of Target-Controlled Infusions. Anesth. Analg. 2016, 122, 79–85. [Google Scholar] [CrossRef]
- Absalom, A.R.; Mani, V.; De Smet, T.; Struys, M.M.R.F. Pharmacokinetic Models for Propofol—Defining and Illuminating the Devil in the Detail. Br. J. Anaesth. 2009, 103, 26–37. [Google Scholar] [CrossRef]
- Leslie, K.; Clavisi, O.; Hargrove, J. Target-Controlled Infusion versus Manually-Controlled Infusion of Propofol for General Anaesthesia or Sedation in Adults. Cochrane Database Syst. Rev. 2008, 16, CD006059. [Google Scholar] [CrossRef]
- Viterbo, J.F.; Lourenço, A.P.; Leite-Moreira, A.F.; Pinho, P.; Barros, F. Prospective Randomised Comparison of Marsh and Schnider Pharmacokinetic Models for Propofol during Induction of Anaesthesia in Elective Cardiac Surgery. Eur. J. Anaesthesiol. 2012, 29, 477–483. [Google Scholar] [CrossRef] [PubMed]
- Kassam, S.I.; Lu, C.; Buckley, N.; Lee, R.M.K.W. The Mechanisms of Propofol-Induced Vascular Relaxation and Modulation by Perivascular Adipose Tissue and Endothelium. Anesth. Analg. 2011, 112, 1339–1345. [Google Scholar] [CrossRef] [PubMed]
- Czajka, S.; Putowski, Z.; Krzych, Ł.J. Post-Induction Hypotension and Intraoperative Hypotension as Potential Separate Risk Factors for the Adverse Outcome: A Cohort Study. J. Anesth. 2023, 37, 442–450. [Google Scholar] [CrossRef]
- Khan, A.I.; Fischer, M.; Pedoto, A.C.; Seier, K.; Tan, K.S.; Dalbagni, G.; Donat, S.M.; Arslan-Carlon, V. The Impact of Fluid Optimisation before Induction of Anaesthesia on Hypotension after Induction. Anaesthesia 2020, 75, 634–641. [Google Scholar] [CrossRef]
- Struys, M.M.R.F.; De Smet, T.; Glen, J.I.B.; Vereecke, H.E.M.; Absalom, A.R.; Schnider, T.W. The History of Target-Controlled Infusion. Anesth. Analg. 2016, 122, 56. [Google Scholar] [CrossRef]
- Breslin, D.S.; Mirakhur, R.K.; Reid, J.E.; Kyle, A. Manual versus Target-Controlled Infusions of Propofol. Anaesthesia 2004, 59, 1059–1063. [Google Scholar] [CrossRef]
- Weninger, B.; Czerner, S.; Steude, U.; Weninger, E. Vergleich zwischen TCI-TIVA, manueller TIVA und balanzierter Anästhesie während stereotaktischer Gewebsentnahme in der Neurochirurgie. Anasthesiol. Intensivmed. Notfallmed. Schmerzther. 2004, 39, 212–219. [Google Scholar] [CrossRef]
- Gale, T.; Leslie, K.; Kluger, M. Propofol Anaesthesia via Target Controlled Infusion or Manually Controlled Infusion: Effects on the Bispectral Index as a Measure of Anaesthetic Depth. Anaesth. Intensive Care 2001, 29, 579–584. [Google Scholar] [CrossRef]
- Matsumoto, E.; Yamasaki, K.; Nakata, K.; Hazama, A.; Kita, T.; Mammoto, T.; Kambara, N.; Sakai, T.; Kishi, Y. Effects of infusion methods of propofol on quality of sedation and ease of sedation control during gynecological laparotomy under spinal anesthesia. Masui 2000, 49, 1103–1108. [Google Scholar]
- Passot, S.; Servin, F.; Allary, R.; Pascal, J.; Prades, J.-M.; Auboyer, C.; Molliex, S. Target-Controlled versus Manually-Controlled Infusion of Propofol for Direct Laryngoscopy and Bronchoscopy. Anesth. Analg. 2002, 94, 1212–1216, table of contents. [Google Scholar] [CrossRef]
- Passot, S.; Servin, F.; Pascal, J.; Charret, F.; Auboyer, C.; Molliex, S. A Comparison of Target- and Manually Controlled Infusion Propofol and Etomidate/desflurane Anesthesia in Elderly Patients Undergoing Hip Fracture Surgery. Anesth. Analg. 2005, 100, 1338–1342. [Google Scholar] [CrossRef] [PubMed]
- Chen, G.; Buell, O.; Gruenewald, M.; Fudickar, A.; Scholz, J.; Bein, B. A Comparison between Target-Controlled and Manually Controlled Propofol Infusions in Patients Undergoing Routine Surgical Procedures. Eur. J. Anaesthesiol. 2009, 26, 928–935. [Google Scholar] [CrossRef] [PubMed]
- Juri, T.; Suehiro, K.; Tsujimoto, S.; Kuwata, S.; Mukai, A.; Tanaka, K.; Yamada, T.; Mori, T.; Nishikawa, K. Pre-Anesthetic Stroke Volume Variation Can Predict Cardiac Output Decrease and Hypotension during Induction of General Anesthesia. J. Clin. Monit. Comput. 2018, 32, 415–422. [Google Scholar] [CrossRef]
- Ali, A.; Altiparmak, O.; Tetik, A.; Altun, D.; Sivrikoz, N.; Buget, M.; Bolsoy, S.; Yaman, N.; Akinci, I.O. Pulse Pressure Variation and Weight-Loss Percentage Predict Hypotension After Anesthesia Induction in Neurosurgery Patients: A Prospective, Observational, Blinded Study. J. Neurosurg. Anesthesiol. 2017, 29, 304–311. [Google Scholar] [CrossRef] [PubMed]
- Jo, Y.Y.; Jung, W.S.; Kim, H.S.; Chang, Y.J.; Kwak, H.J. Prediction of Hypotension in the Beach Chair Position during Shoulder Arthroscopy Using Pre-Operative Hemodynamic Variables. J. Clin. Monit. Comput. 2014, 28, 173–178. [Google Scholar] [CrossRef]
- Jacob, M.; Chappell, D.; Conzen, P.; Finsterer, U.; Rehm, M. Blood Volume Is Normal after Pre-Operative Overnight Fasting. Acta Anaesthesiol. Scand. 2008, 52, 522–529. [Google Scholar] [CrossRef]
- Saugel, B.; Bebert, E.-J.; Briesenick, L.; Hoppe, P.; Greiwe, G.; Yang, D.; Ma, C.; Mascha, E.J.; Sessler, D.I.; Rogge, D.E. Mechanisms Contributing to Hypotension after Anesthetic Induction with Sufentanil, Propofol, and Rocuronium: A Prospective Observational Study. J. Clin. Monit. Comput. 2022, 36, 341–347. [Google Scholar] [CrossRef]
- Claeys, M.A.; Gepts, E.; Camu, F. Haemodynamic Changes during Anaesthesia Induced and Maintained with Propofol. Br. J. Anaesth. 1988, 60, 3–9. [Google Scholar] [CrossRef]
- Fairfield, J.E.; Dritsas, A.; Beale, R.J. Haemodynamic Effects of Propofol: Induction with 2.5 Mg kg−1. Br. J. Anaesth. 1991, 67, 618–620. [Google Scholar] [CrossRef]
- de Wit, F.; van Vliet, A.L.; de Wilde, R.B.; Jansen, J.R.; Vuyk, J.; Aarts, L.P.; de Jonge, E.; Veelo, D.P.; Geerts, B.F. The Effect of Propofol on Haemodynamics: Cardiac Output, Venous Return, Mean Systemic Filling Pressure, and Vascular Resistances. Br. J. Anaesth. 2016, 116, 784–789. [Google Scholar] [CrossRef] [PubMed]


| Patients’ Characteristics | Manual Induction (n = 100) | TCI Induction (n = 100) | p |
|---|---|---|---|
| Age, years | 64 (52–68) | 61 (48–69) | 0.717 |
| Male, n (%) | 69 (68.3) | 58 (58.6) | 0.153 |
| BMI, (kg m2) | 25.5 (23.5–28.9) | 26.1 (23.4–29.8) | 0.768 |
| ASA score | 2 (2–2) | 2 (2–2) | 0.183 |
| Comorbidities, n (%) | |||
| Hypertension | 56 (55.4) | 56 (56.6) | 0.873 |
| Diabetes mellitus | 26 (25.7) | 20 (20.2) | 0.352 |
| COPD | 9 (8.9) | 11 (11.1) | 0.644 |
| CHF | 3 (3.0) | 1 (1.0) | 0.621 |
| CAD | 20 (19.8) | 14 (14.1) | 0.287 |
| CVD | 3 (3.0) | 3 (3.0) | 0.649 |
| CRF | 3 (3.0) | 1 (1.0) | 0.621 |
| Preoperative medications, n (%) | |||
| B-blocker | 17 (16.8) | 20 (20.2) | 0.539 |
| ACE inhibitors | 5 (5.0) | 5 (5.1) | 1.000 |
| Pre-Anesthesia Induction | Post-Anesthesia Induction | |||||
|---|---|---|---|---|---|---|
| Manual Induction (n = 100) | TCI Induction (n = 100) | p | Manual Induction (n = 100) | TCI Induction (n = 100) | p | |
| HR, min−1 | 73 (66–82) | 72 (65–85) | 0.951 | 72 ± 13 | 68 ± 11 | 0.044 |
| SAP, mmHg | 144 ± 22 | 147 ± 18 | 0.321 | 108 (88–121) | 118 (99–138) | 0.001 |
| DAP, mmHg | 70 ± 9 | 72 ± 9 | 0.175 | 58 (50–67) | 64 (56–70) | <0.001 |
| MAP, mmHg | 94 ± 13 | 97 ± 11 | 0.131 | 75 ± 14 | 81 ± 13 | <0.001 |
| SVI, mL/m2 | 43 (37–51) | 46 (40–54) | 0.112 | 36 ± 11 | 40 ± 11 | 0.004 |
| CI, L/min/m2 | 3.1 (2.7–3.9) | 3.4 (2.9–3.9) | 0.107 | 2.4 (2.0–2.8) | 2.5 (2.3–3.0) | 0.017 |
| SVV, % | 15 (12–17) | 15 (13–16) | 0.400 | 12 (8–14) | 8 (5–10) | <0.001 |
| PPV, % | 15 (13–16) | 15 (14–16) | 0.204 | 12 (9–16) | 8 (6–12) | <0.001 |
| Ea, mmHg m−2 mL−1 | 1.08 (0.86–1.28) | 1.05 (0.90–1.18) | 0.531 | 1.07 (0.91–1.34) | 1.07 (0.91–1.27) | 0.837 |
| CPO, watt | 1.23 (1.03–1.66) | 1.40 (1.08–1.78) | 0.120 | 0.74 (0.57–0.97) | 0.81 (0.71–1.13) | 0.001 |
| dp/dt, mmHg/msn | 1.33 (1.10–1.70) | 1.32 (1.13–1.70) | 0.624 | 0.80 (0.60–1.01) | 0.90 (0.71–1.14) | 0.014 |
| Induction propofol dose, mg | 150 (120–200) | 155 (135–180) | 0.719 | |||
| Duration of BIS < 60, sec | 47 (35–60) | 150 (105–220) | <0.001 | |||
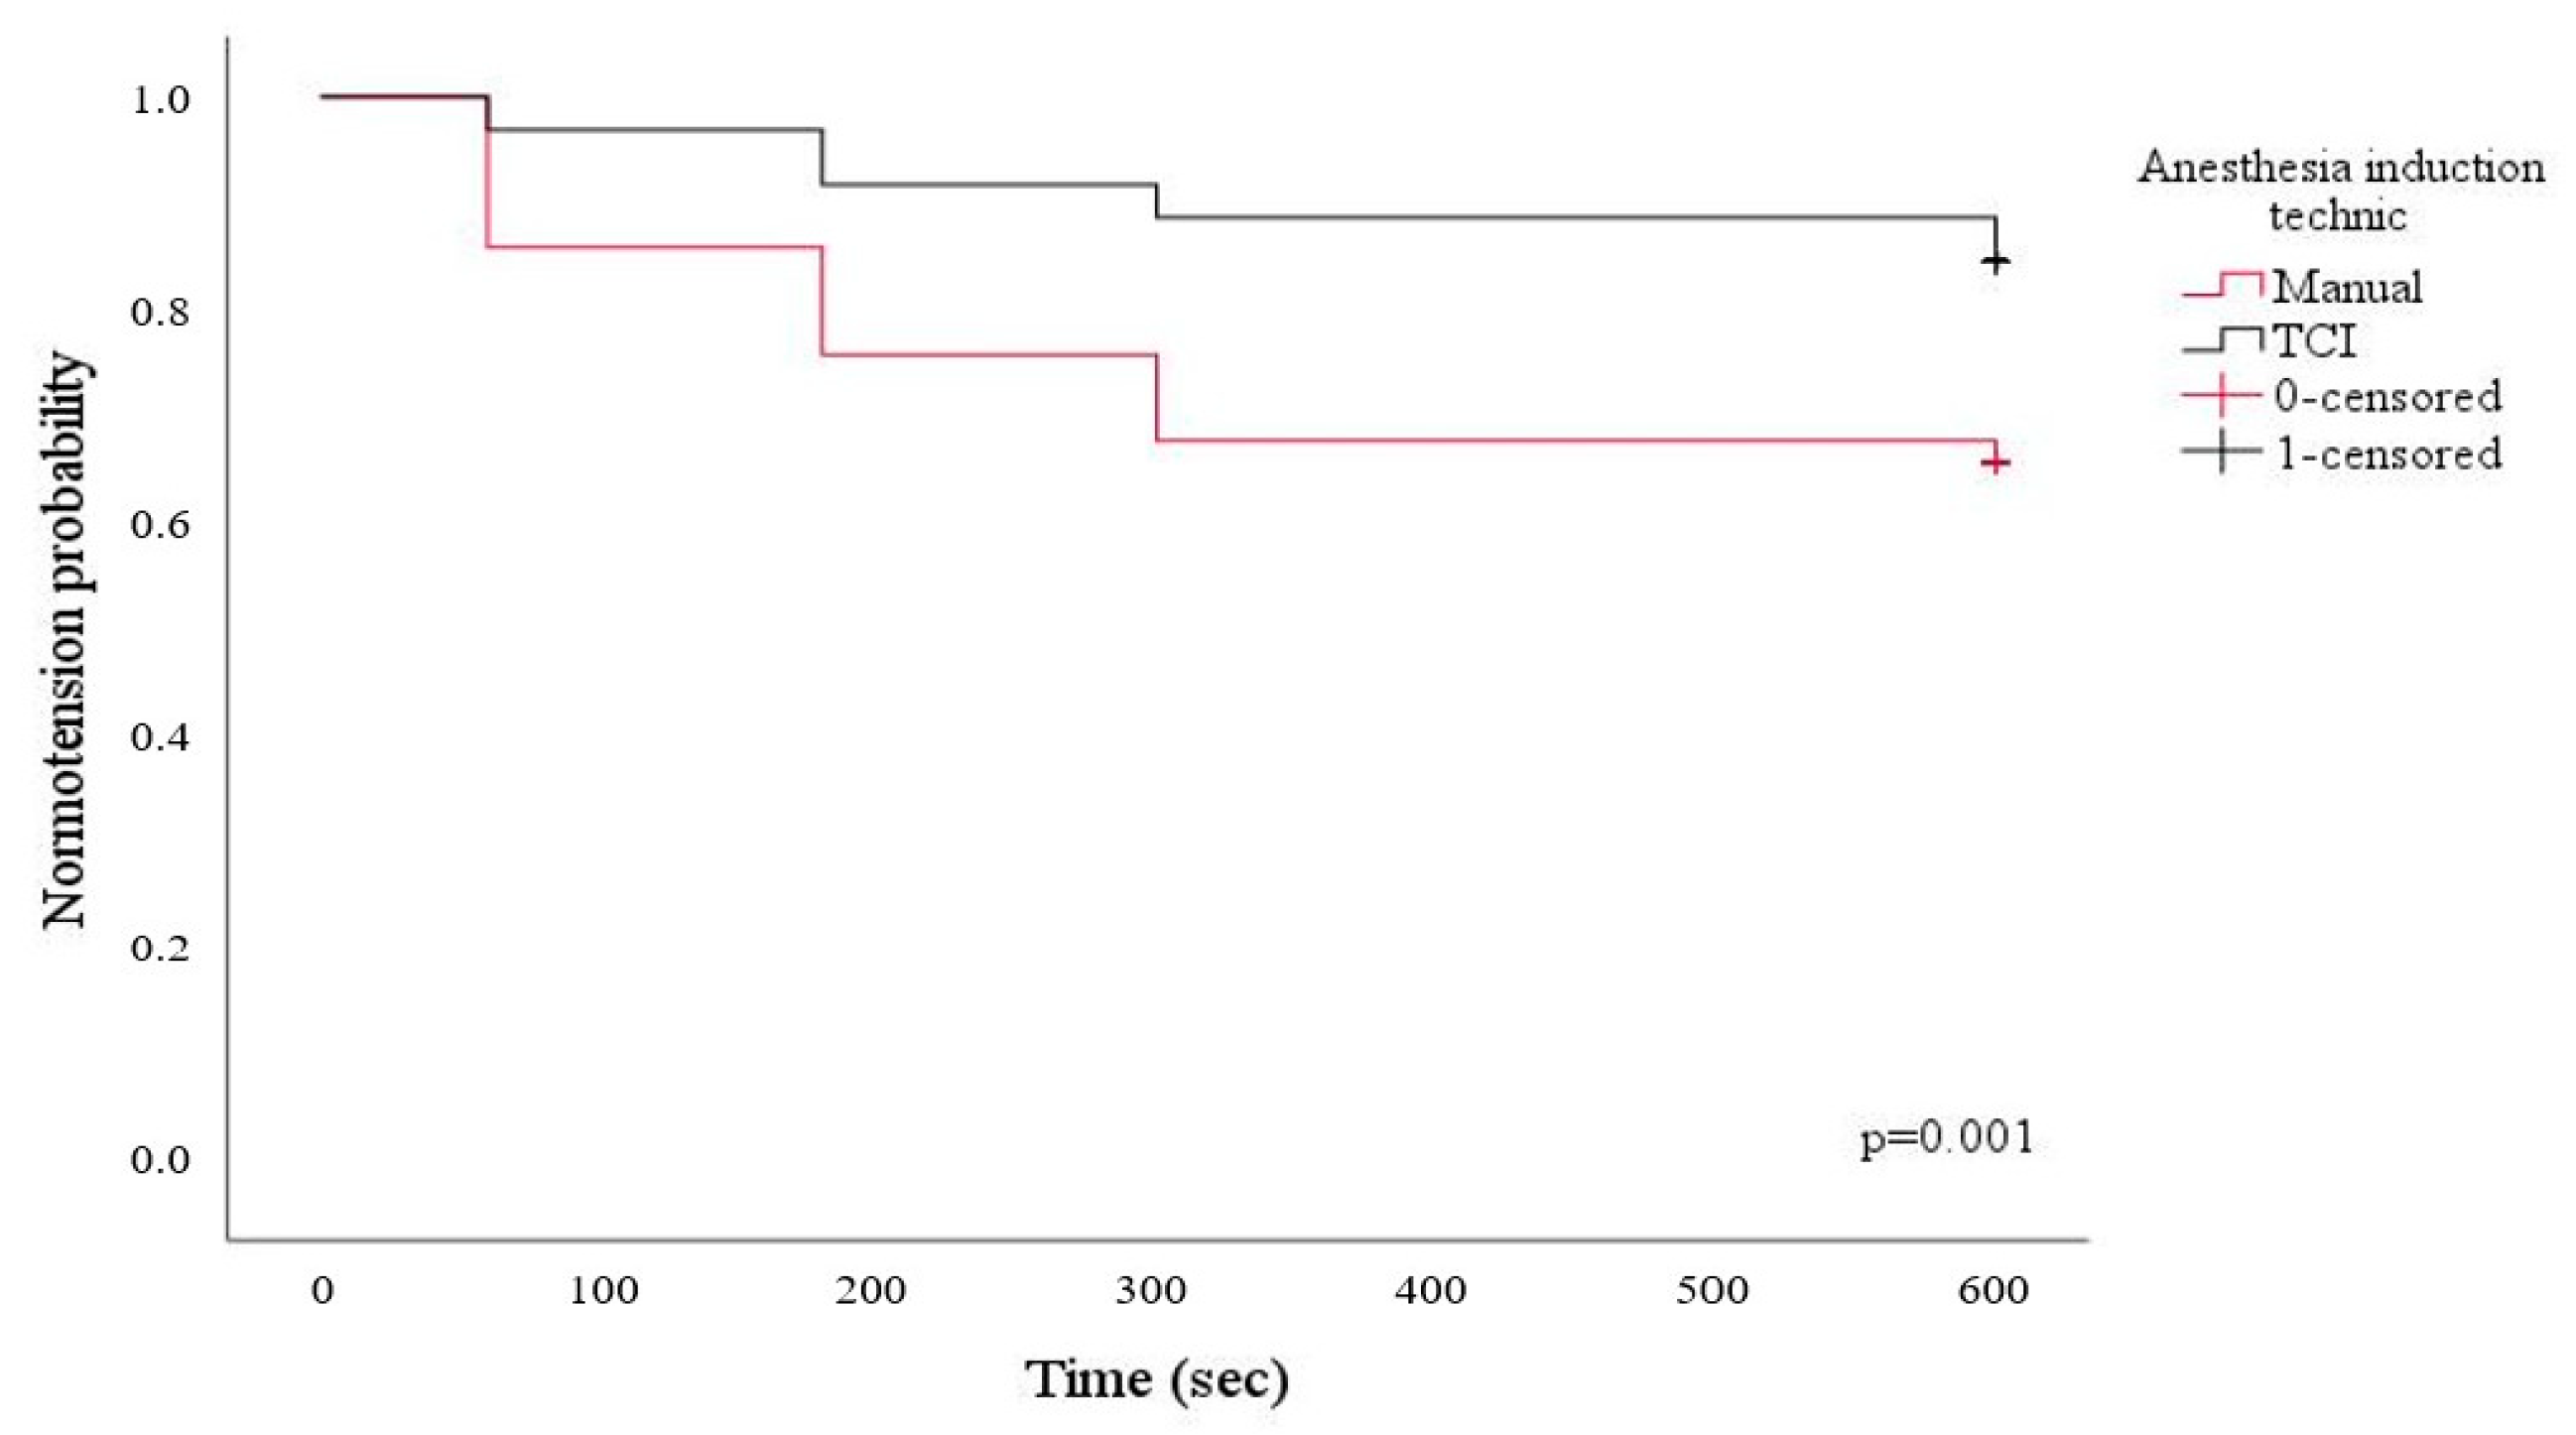
| Hypotension after induction n (%) | 34 (33.7) | 13 (13.1) | <0.001 | |||
| Epinephrine dosage, mg | 0 (0–10) | 0 (0–5) | 0.362 | |||
| Patients’ Characteristics | Hypotension (−) (n = 153) | Hypotension (+) (n = 47) | p |
|---|---|---|---|
| Age, years | 62 (48–69) | 64 (55–68) | 0.583 |
| Male, n (%) | 97 (63.4) | 30 (63.8) | 0.957 |
| BMI, (kg m2) | 26.0 (23.3–30.1) | 25.5 (23.9–27.8) | 0.452 |
| ASA score | 2 (2–2) | 2 (2–2) | 0.183 |
| Comorbidities, n (%) | |||
| Hypertension | 79 (51.6) | 33 (70.2) | 0.029 |
| Diabetes mellitus | 37 (24.2) | 9 (19.1) | 0.555 |
| COPD | 15 (9.8) | 5 (10.6) | 0.789 |
| CHF | 2 (1.3) | 2 (4.3) | 0.235 |
| CAD | 26 (17.0) | 8 (17.9) | 1.000 |
| CVD | 5 (3.3) | 1 (2.1) | 1.000 |
| CRF | 4 (2.6) | 0 (0.0) | 0.575 |
| Preoperative medications, n (%) | |||
| B-blocker | 28 (18.3) | 9 (19.1) | 1.000 |
| ACE inhibitors | 6 (3.9) | 4 (8.5) | 0.249 |
| Pre-anesthesia induction | |||
| HR, min−1 | 72 (65–81) | 78 (68–85) | 0.088 |
| SAP, mmHg | 147 ± 17 | 142 ± 23 | 0.176 |
| DAP, mmHg | 72 ± 8 | 70 ± 10 | 0.233 |
| MAP, mmHg | 98 ± 10 | 94 ± 14 | 0.124 |
| SVI, mL/m2 | 48 (41–56) | 39 (33–45) | <0.001 |
| CI, L/min/m2 | 3.3 (2.9–4.1) | 2.9 (2.6–3.2) | <0.001 |
| SVV, % | 15 (12–16) | 15 (13–18) | 0.150 |
| PPV, % | 15 (14–16) | 15 (14–16) | 0.654 |
| Ea, mmHg m−2 mL−1 | 1.03 (0.86–1.17) | 1.13 (0.98–1.50) | 0.006 |
| CPO, watt | 1.42 (1.15–1.81) | 1.03 (0.82–1.30) | <0.001 |
| dp/dt, mmHg/msn | 1.40 (1.19–1.80) | 1.13 (0.94–1.40) | <0.001 |
| Anesthesia induction technique, n (%) | |||
| Manual induction TCI induction | 67 (43.8) 86 (56.2) | 34 (72.3) 13 (27.7) | <0.001 |
| Epinephrine dosage, mg | 0 (0–0) | 15 (10–20) | <0.001 |
| Univariable | Multivariable | |||
|---|---|---|---|---|
| HR (95% CI) | p | HR (95% CI) | p | |
| Hypertension | 2.2 (1.2–4.2) | 0.012 | 2.09 (1.06–4.08) | 0.032 |
| Pre-anesthesia induction parameters | ||||
| SVI | 0.96 (0.93–0.98) | <0.001 | 0.93 (0.88–0.99) | 0.013 |
| CPO | 0.24 (0.11–0.50) | <0.001 | 0.30 (0.10–0.85) | 0.024 |
| CI | 0.55 (0.37–0.81) | 0.003 | 1.97 (0.89–4.36) | 0.096 |
| Ea | 2.20 (1.00–4.80) | 0.045 | 0.46 (0.12–1.81) | 0.267 |
| dp/dt | 0.33 (0.15–0.74) | 0.007 | 1.07 (0.41–2.80) | 0.897 |
| The usage of the TCI | 0.38 (0.20–0.72) | 0.003 | 0.42 (0.21–0.84) | 0.015 |
Disclaimer/Publisher’s Note: The statements, opinions and data contained in all publications are solely those of the individual author(s) and contributor(s) and not of MDPI and/or the editor(s). MDPI and/or the editor(s) disclaim responsibility for any injury to people or property resulting from any ideas, methods, instructions or products referred to in the content. |
© 2023 by the authors. Licensee MDPI, Basel, Switzerland. This article is an open access article distributed under the terms and conditions of the Creative Commons Attribution (CC BY) license (https://creativecommons.org/licenses/by/4.0/).
Share and Cite
Yildirim, S.A.; Dogan, L.; Sarikaya, Z.T.; Ulugol, H.; Gucyetmez, B.; Toraman, F. Hypotension after Anesthesia Induction: Target-Controlled Infusion Versus Manual Anesthesia Induction of Propofol. J. Clin. Med. 2023, 12, 5280. https://doi.org/10.3390/jcm12165280
Yildirim SA, Dogan L, Sarikaya ZT, Ulugol H, Gucyetmez B, Toraman F. Hypotension after Anesthesia Induction: Target-Controlled Infusion Versus Manual Anesthesia Induction of Propofol. Journal of Clinical Medicine. 2023; 12(16):5280. https://doi.org/10.3390/jcm12165280
Chicago/Turabian StyleYildirim, Serap Aktas, Lerzan Dogan, Zeynep Tugce Sarikaya, Halim Ulugol, Bulent Gucyetmez, and Fevzi Toraman. 2023. "Hypotension after Anesthesia Induction: Target-Controlled Infusion Versus Manual Anesthesia Induction of Propofol" Journal of Clinical Medicine 12, no. 16: 5280. https://doi.org/10.3390/jcm12165280
APA StyleYildirim, S. A., Dogan, L., Sarikaya, Z. T., Ulugol, H., Gucyetmez, B., & Toraman, F. (2023). Hypotension after Anesthesia Induction: Target-Controlled Infusion Versus Manual Anesthesia Induction of Propofol. Journal of Clinical Medicine, 12(16), 5280. https://doi.org/10.3390/jcm12165280