
The Trend of Tuberculosis Case Notification Rates from 1995 to 2022 by Country Income and World Health Organization Region


Abstract
1. Introduction
2. Materials and Methods
2.1. Study Design, Setting, and Data Collection
- -
- In the WHO database, nine countries were excluded as their income from the World Bank database was not available: (1) Anguilla, (2) Netherlands Antilles, (3) Cook Islands, (4) Montserrat, (5) Niue, (6) Serbia & Montenegro, (7) Tokelau, (8) The Bolivarian Republic of Venezuela, and (9) Wallis and Futuna;
- -
- In the World Bank database, nine countries and islands were excluded as TB case notifications were not available from the WHO Report: (1) Channel Islands, (2) Faroe Islands, (3) Gibraltar, (4) Isle of Man, (5) Liechtenstein, (6) St. Martin (French part), (7) Taiwan, China; (8) Virgin Islands (U.S.), and (9) Kosovo.
2.2. Study Definitions
2.3. Data Analysis
2.4. Ethics
3. Results
3.1. Description of Countries by Income, WHO Region, and TB Epidemiology
- -
- In the African Region, 20 (42.6%) countries were categorized as low-income, 20 (42.6%) as lower-middle-income, 6 (12.7%) as upper-middle-income, and 1 (2.1%) as high-income.
- -
- In the Region of the Americas (AMR), the European Region (EUR), and the Western Pacific Region (WPR), no countries were categorized as low-income. In these regions, high-income countries were predominant: 45.2% in AMR, 64.8% in EUR, and 43.7% in WPR.
- -
- In the Eastern Mediterranean Region (EMR), 5 (22.7%) countries were categorized as low-income, 8 (36.4%) as lower-middle-income, 3 (13.6%) as upper-middle-income, and 6 (27.3%) as high-income.
- -
- In the South-East Asian Region (SEAR), no countries were categorized as high-income. One (9.1%), 7 (63.6%), and 3 (27.3%) countries were categorized, respectively, as low-income, lower-middle-income, and upper-middle-income.
3.2. Trend of the Mean TB CNR Rate from 1995 to 2022
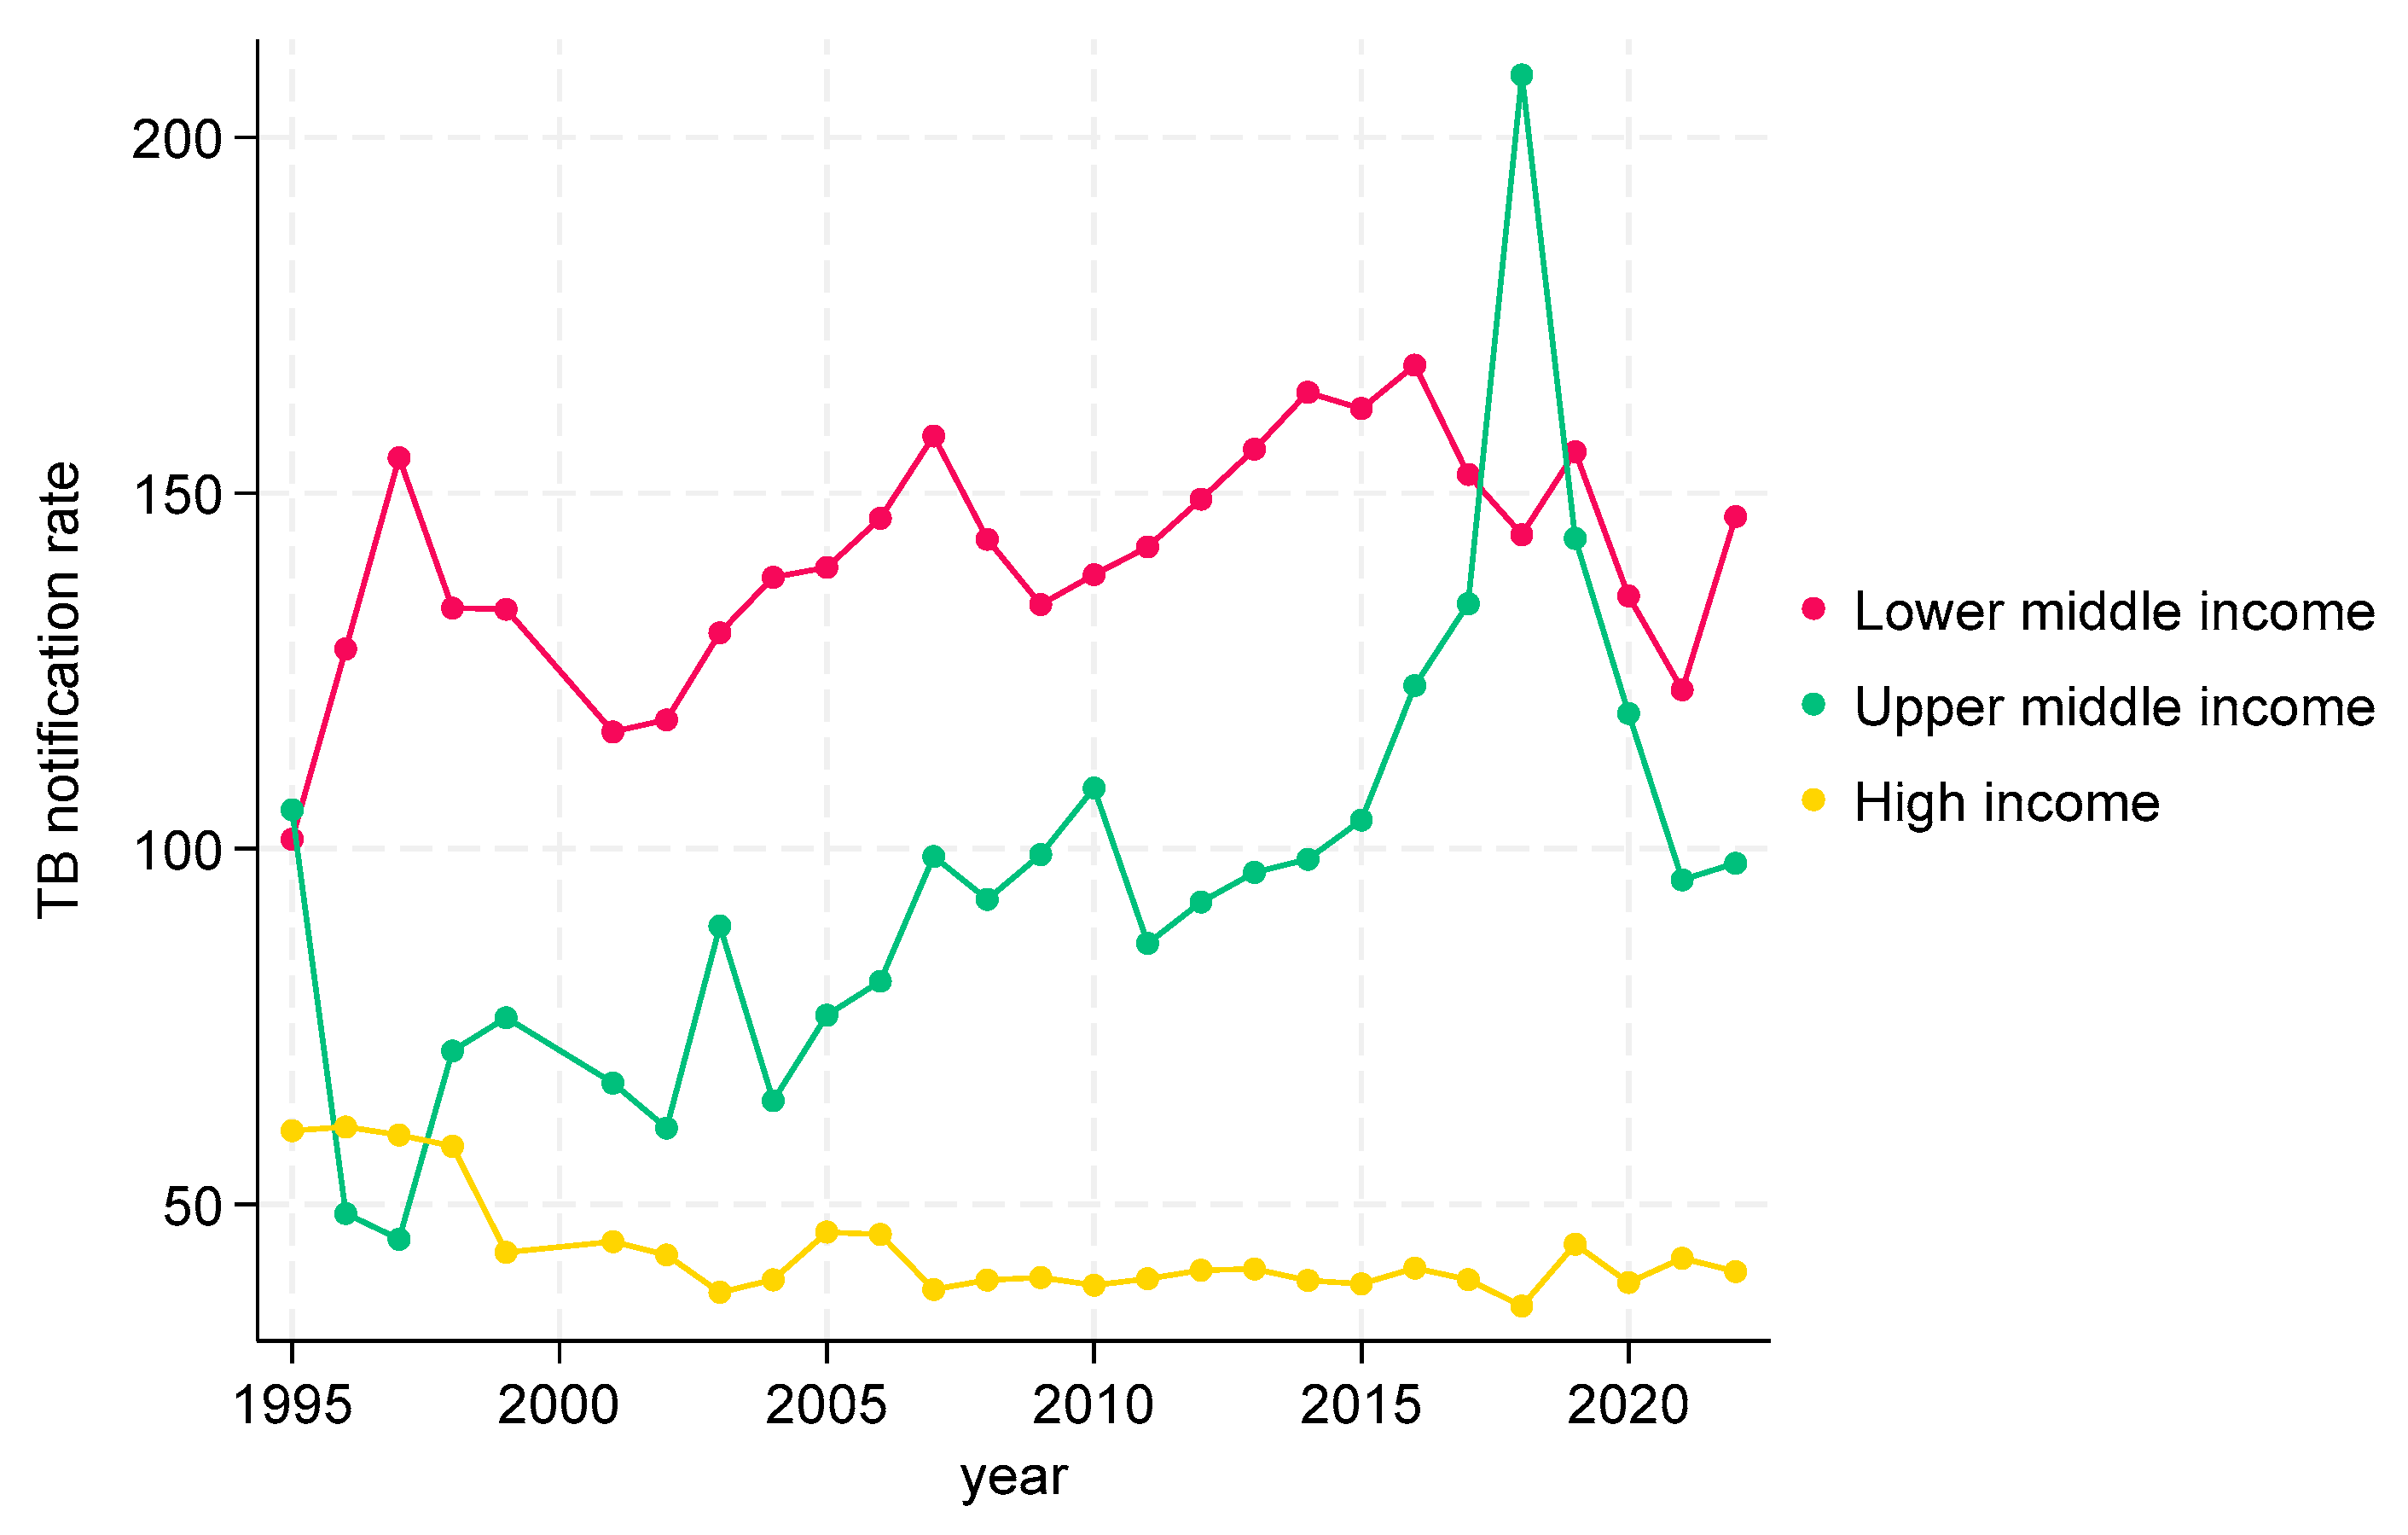
3.2.1. TB CNRs from 1995 to 2022 by Income at Global Level
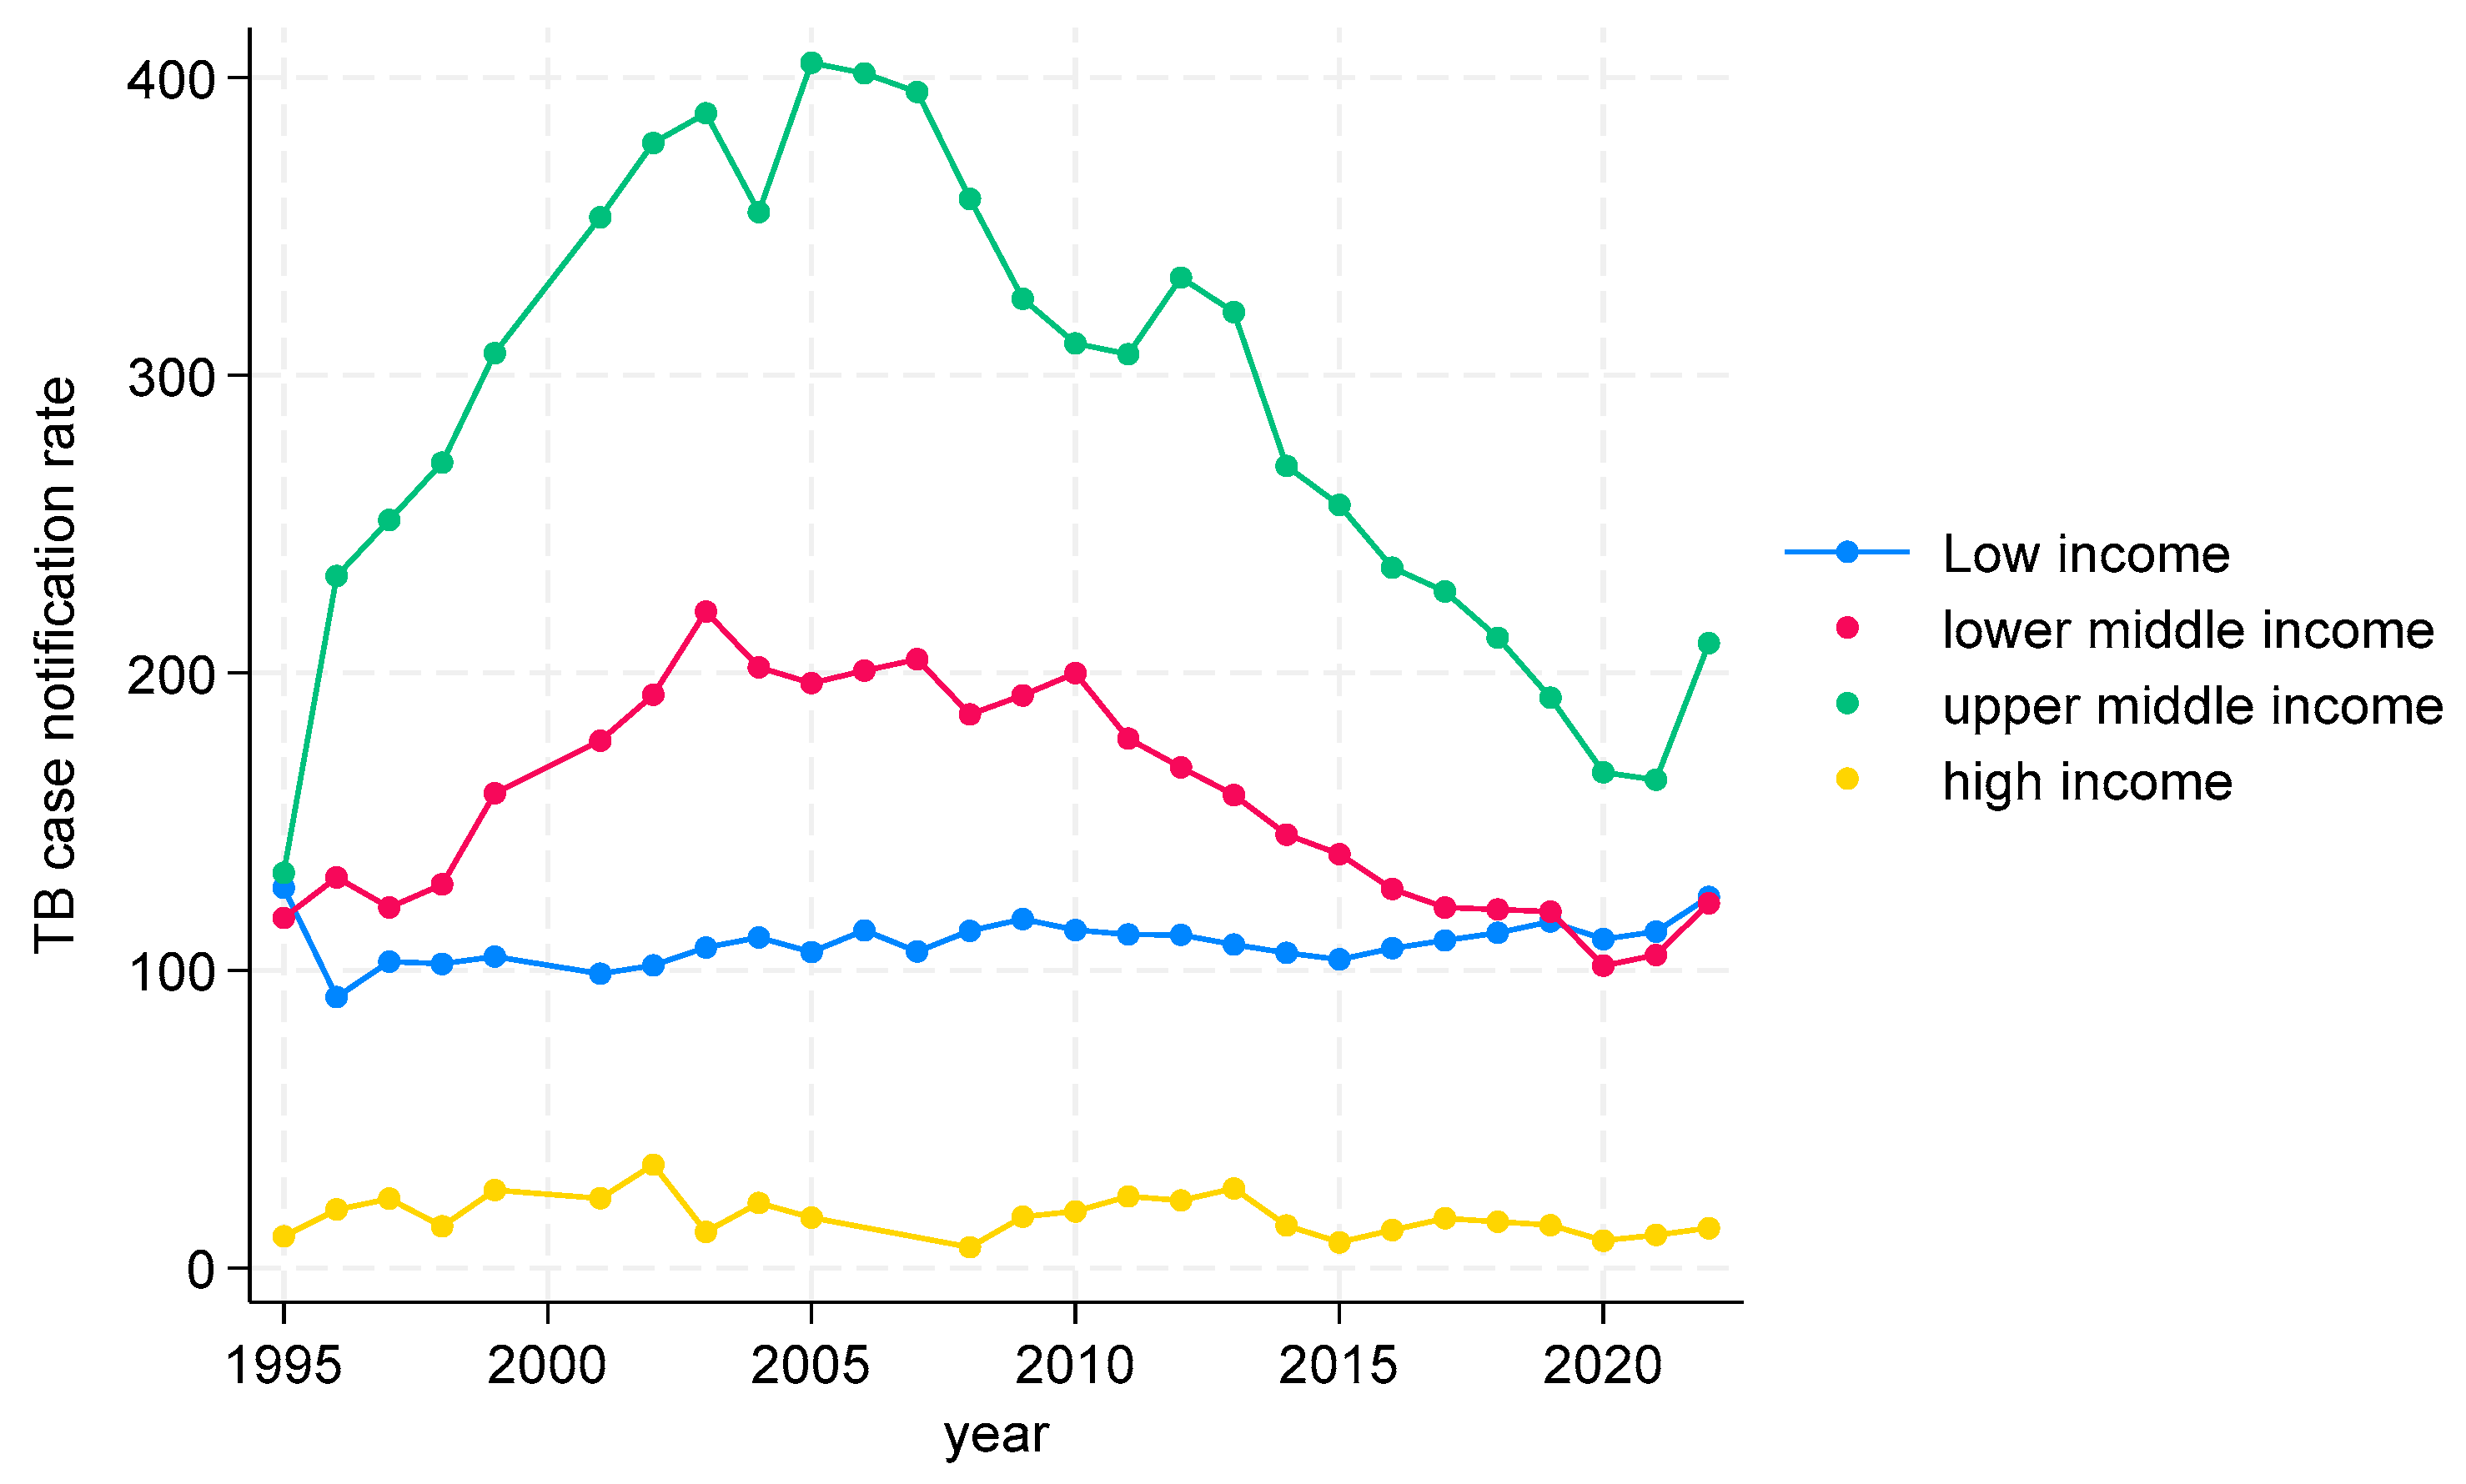
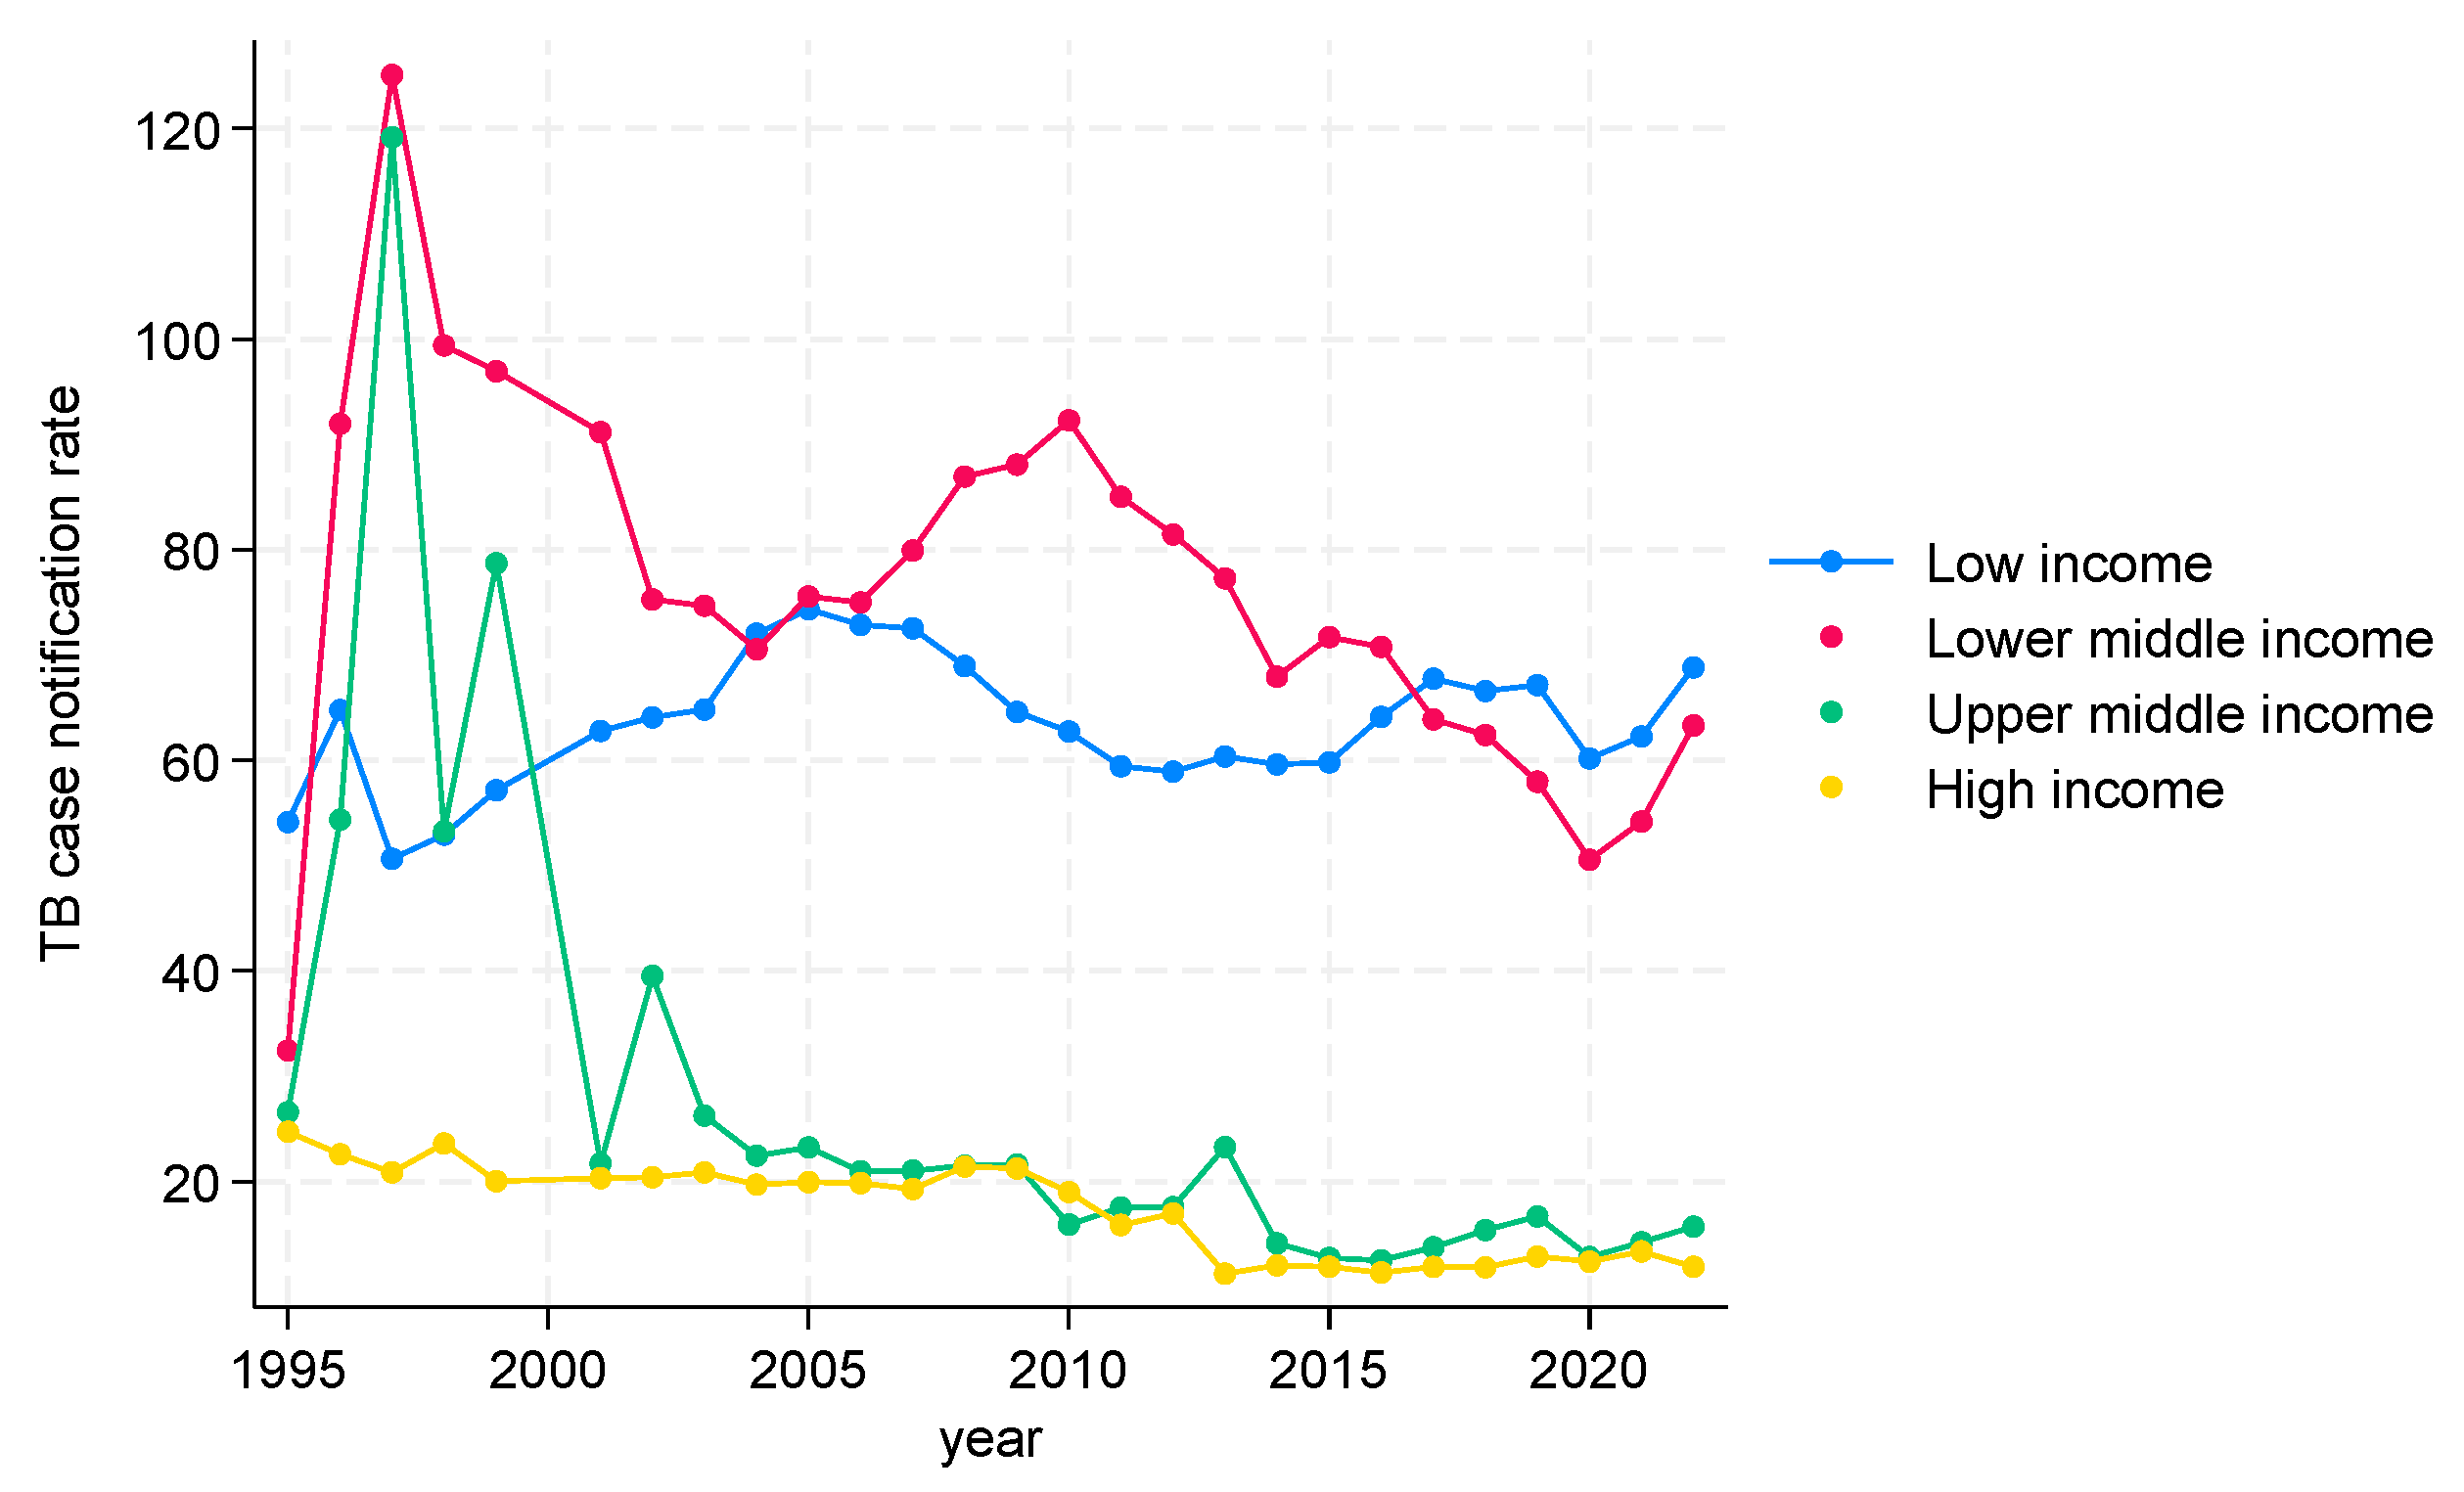
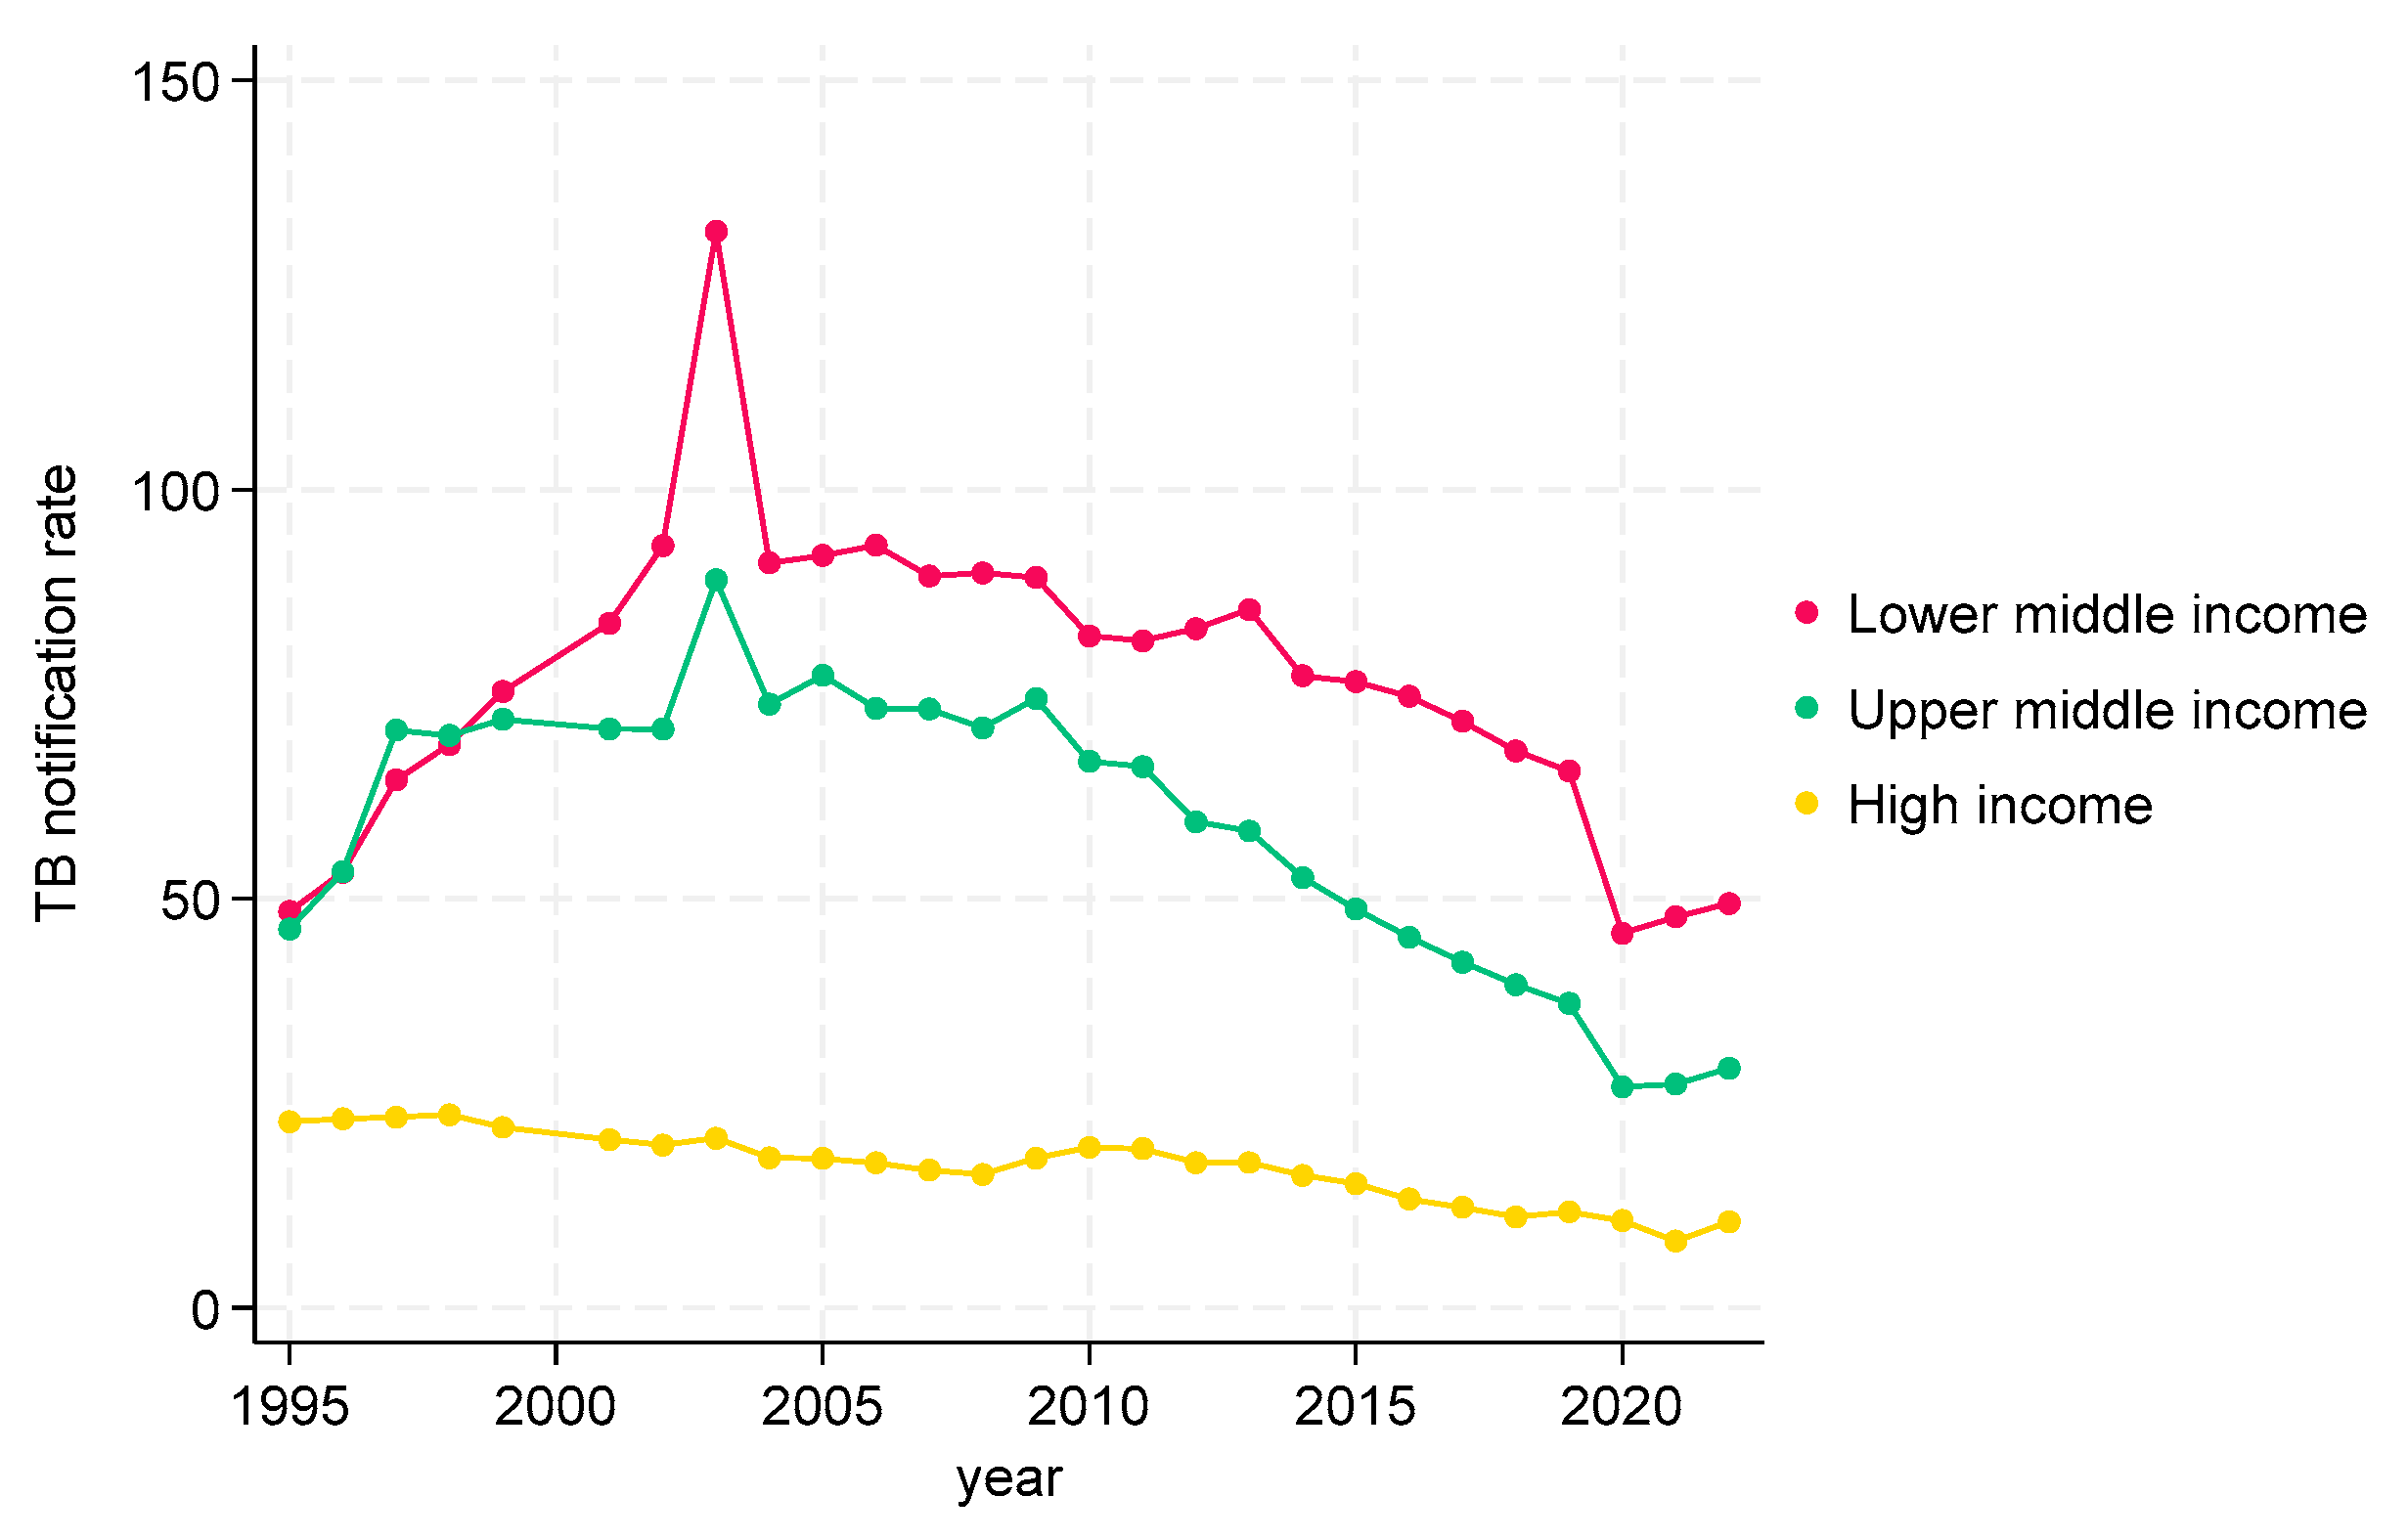
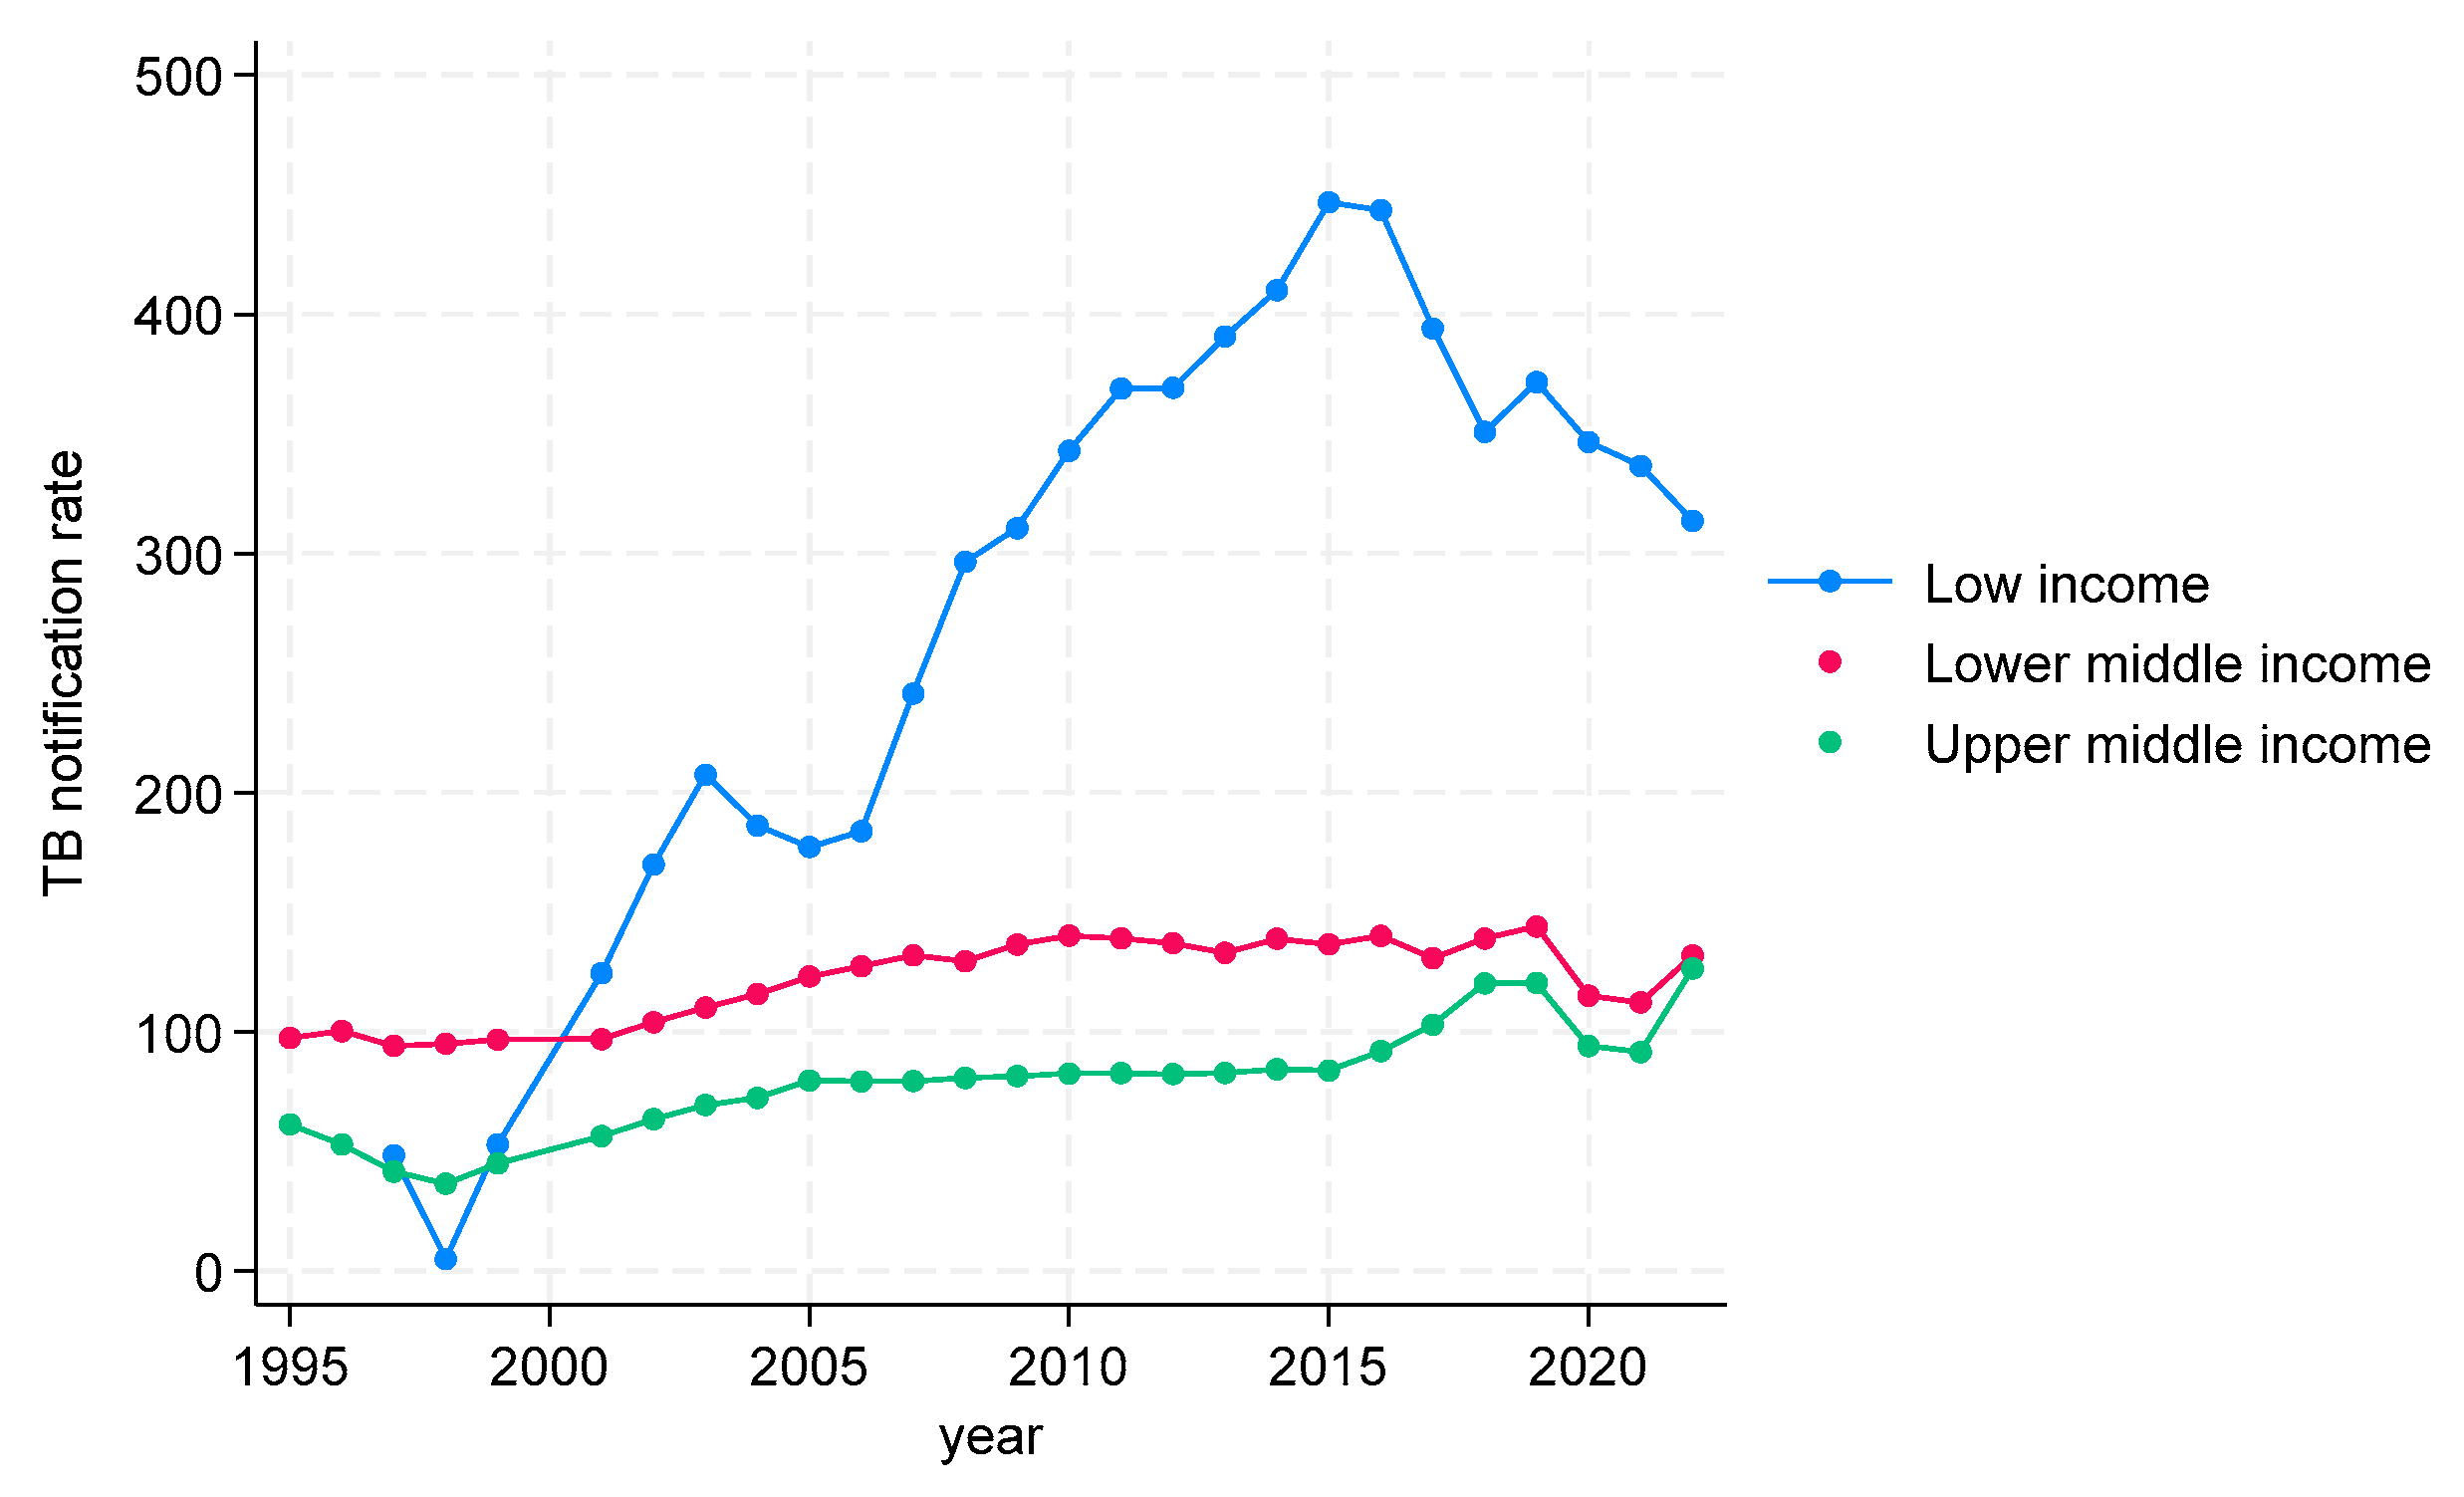
3.2.2. TB CNRs from 2000 to 2022 in WHO Regions by Income
TB CNRs from 1995 to 2022 in WHO African Region
TB CNRs from 1995 to 2022 in the WHO Region of the Americas (AMR)
TB CNRs from 1995 to 2022 in WHO Eastern Mediterranean Region (EMR)
TB CNRs from 1995 to 2022 in WHO European Region (EUR)
TB CNRs from 1995 to 2022 in WHO South-East Asian Region (SEAR)
TB CNRs from 1995 to 2022 in WHO Western Pacific Region (WPR)
4. Discussion
4.1. Overview of Key Findings
4.2. Income-Based Disparities in TB Notification Rates
4.3. Regional Trends and Implications
4.4. Impact of the COVID-19 Pandemic
4.5. Historical Context of TB in High-Income Countries
4.6. Implications of Our Results for TB Control Strategies
4.7. Limitations and Future Research
5. Conclusions
Supplementary Materials
Author Contributions
Funding
Institutional Review Board Statement
Informed Consent Statement
Data Availability Statement
Acknowledgments
Conflicts of Interest
References
- Cohen, A.; Mathiasen, V.D.; Schon, T.; Wejse, C. The global prevalence of latent tuberculosis: A systematic review and meta-analysis. Eur. Respir. J. 2019, 54, 1900655. [Google Scholar] [CrossRef] [PubMed]
- World Health Organization. Global Tuberculosis Report 2019. World Health Organization: Geneva, Switzerland, 2019. Licence: CC BY-NC-SA 3.0 IGO. 2019. Available online: https://www.who.int/publications/i/item/9789241565714 (accessed on 20 April 2024).
- World Health Organization. Global Tuberculosis Report 2020. World Health Organization: Geneva, Switzerland, 2020. Licence: CC BY-NC-SA 3.0 IGO. 2020. Available online: https://www.who.int/publications/i/item/9789240013131 (accessed on 20 April 2024).
- World Health Organization. Global Tuberculosis Report 2021. World Health Organization: Geneva, Switzerland, 2021. Licence: CC BY-NC-SA 3.0 IGO. 2021. Available online: https://www.who.int/publications/i/item/9789240037021 (accessed on 20 April 2024).
- World Health Organization. Global Tuberculosis Report 2022. World Health Organization: Geneva, Switzerland, 2022. Licence: CC BY-NC-SA 3.0 IGO. 2022. Available online: https://www.who.int/teams/global-tuberculosis-programme/tb-reports/global-tuberculosis-report-2022 (accessed on 20 April 2024).
- World Health Organization. Framework for Effective Tuberculosis Control; World Health Organization Document; WHO/TB/94.179:1-7; World Health Organization: Geneva, Switzerland, 1994. [Google Scholar]
- Enarson, D.A. Principles of IUATLD collaborative tuberculosis progammes. Bull. Int. Union Tuberc. Lung Dis. 1991, 66, 195–200. [Google Scholar] [PubMed]
- Rouillon, A. Tuberculosis: A model for approaching disease control. Chest 1979, 76 (Suppl. S6), 739–740. [Google Scholar] [CrossRef] [PubMed]
- World Health Organization, Stop TB Partnership. The Stop TB Strategy. Building on and Enhancing DOTS to Meet the TB-Related Millenium Development Goals. World Health Organization Document WHO/HTM/TB/2006.368. Available online: https://www.who.int/publications/i/item/WHO-HTM-TB-2006.368 (accessed on 20 May 2024).
- World Health Organization. The End TB Strategy. World Health Organization Document 2015; WHO/HTM/TB/2015.19. Available online: https://www.who.int/publications/i/item/WHO-HTM-TB-2015.19 (accessed on 20 May 2024).
- World Health Organization. Global Tuberculosis Report 2023. World Health Organization: Geneva, Switzerland, 2023. Licence: CC BY-NC-SA 3.0 IGO. 2023. Available online: https://www.who.int/teams/global-tuberculosis-programme/tb-reports/global-tuberculosis-report-2023 (accessed on 20 April 2024).
- World Health Organization. Tuberculosis Data 2023. Available online: https://www.who.int/teams/global-tuberculosis-programme/data (accessed on 20 May 2024).
- World Bank. World Bank Country and Lending Groups 2024. Available online: https://datahelpdesk.worldbank.org/knowledgebase/articles/906519-world-bank-country-and-lending-groups (accessed on 20 May 2024).
- World Bank. Population, Total 2024. Available online: https://data.worldbank.org/indicator/SP.POP.TOTL (accessed on 20 May 2024).
- World Bank. The World Bank Atlas Method—Detailed Methodology 2024. Available online: https://datahelpdesk.worldbank.org/knowledgebase/articles/378832-what-is-the-world-bank-atlas-method (accessed on 20 May 2024).
- Duarte, R.; Lönnroth, K.; Carvalho, C.; Lima, F.; Carvalho, A.C.C.; Muñoz-Torrico, M.; Centis, R. Tuberculosis, social determinants and co-morbidities (including HIV). Pulmonology 2018, 24, 115–119. [Google Scholar] [CrossRef] [PubMed]
- Liyew, A.M.; Clements, A.C.; Akalu, T.Y.; Gilmour, B.; Alene, K.A. Ecological-level factors associated with tuberculosis incidence and mortality: A systematic review and meta-analysis. PLoS Glob. Public Health 2024, 4, e0003425. [Google Scholar] [CrossRef] [PubMed]
- Marco, M.H.; Ahmedov, S.; Castro, K.G. The global impact of COVID-19 on tuberculosis: A thematic scoping review, 2020–2023. PLoS Glob. Public Health 2024, 4, e0003043. [Google Scholar] [CrossRef] [PubMed]
- Davies, R.P.O.; Tocque, K.; Bellis, M.A.; Rimmington, T.; Davies, P.D.O. Historical declines in tuberculosis in England and Wales: Improving social conditions or natural selection. Int. J. Tuberc. Lung Dis. 1999, 3, 1051–1054. [Google Scholar] [PubMed]
- Preez, K.D.; Gabardo, B.M.A.; Kabra, S.K.; Triasih, R.; Lestari, T.; Kal, M.; Tsogt, B.; Dorj, G.; Purev, E.; Nguyen, T.A.; et al. Priority activities in child and adolescent tuberculosis to close the policy-practice gap in low- and middle-income countries. Pathogens 2022, 11, 196. [Google Scholar] [CrossRef] [PubMed]
- Horton, K.C.; MacPherson, P.; Houben, R.M.; White, R.G.; Corbett, E.L. Sex differences in tuberculosis burden and notifications in low- and middle-income countries: A systematic review and meta-analysis. PLoS Med. 2016, 13, e1002119. [Google Scholar] [CrossRef] [PubMed]
- Snow, K.J.; Sismanidis, C.; Denholm, J.; Sawyer, S.M.; Graham, S.M. The incidence of tuberculosis among adolescents and young adults: A global estimate. Eur. Respir. J. 2018, 51, 1702352. [Google Scholar] [CrossRef] [PubMed]
- Boere, T.M.; Visser, D.H.; van Furth, A.M.; Lips, P.; Cobelens, F.G.J. Solar ultraviolet B exposure and global variation in tuberculosis incidence: An ecological analysis. Eur. Respir. J. 2017, 49, 1601979. [Google Scholar] [CrossRef] [PubMed]
- Gelaw, Y.A.; Yu, W.; Magalhães, R.J.S.; Assefa, Y.; Williams, G. Effect of temperature and altitude difference on tuberculosis notification: A systematic review. J. Glob. Infect. Dis. 2019, 11, 63–68. [Google Scholar] [CrossRef] [PubMed]
- Dye, C.; Lönnroth, K.; Jaramillo, E.; Williams, B.G.; Raviglione, M. Trends in tuberculosis incidence and their determinants in 134 countries. Bull. World Health Organ. 2009, 87, 683–691. [Google Scholar] [CrossRef] [PubMed]


| Characteristics | n (%) |
|---|---|
| Income | |
| Low income | 26 (12.5) |
| Lower-middle income | 54 (26.0) |
| Upper-middle income | 53 (25.5) |
| High income | 75 (36.1) |
| WHO regions | |
| African Region (AFR) | 47 (22.6) |
| Region of the Americas (AMR) | 42 (20.2) |
| Eastern Mediterranean Region (EMR) | 22 (10.6) |
| European Region (EUR) | 54 (26.0) |
| South-East Asian Region (SEAR) | 11 (5.3) |
| Western Pacific Region (WPR) | 32 (15.4) |
| Low Income | Lower Middle Income | Upper Middle Income | High Income | p Value | |
|---|---|---|---|---|---|
| WHO Region | <0.001 | ||||
| African Region (AFR) (n = 47) | 20 (42.6) | 20 (42.6) | 6 (12.7) | 1 (2.1) | |
| Region of the Americas (AMR) (n = 42) | 0 (0.0) | 4 (9.5) | 19 (45.2) | 19 (45.2) | |
| Eastern Mediterranean Region (EMR) (n = 22) | 5 (22.7) | 8 (36.4) | 3 (13.6) | 6 (27.3) | |
| European Region (EUR) ( n = 54) | 0 (0.0) | 4 (7.4) | 15 (27.8) | 35 (64.8) | |
| South-East Asian Region (SEAR) (n = 11) | 1 (9.1) | 7 (63.6) | 3 (27.3) | 0 (0.0) | |
| Western Pacific Region (WPR) (n = 32) | 0 (0.0) | 11 (34.4) | 7 (21.9) | 14 (43.7) | |
| Total | 26 | 54 | 53 | 75 |
| WHO Region | Income Categories | Countries |
|---|---|---|
| African Region (AFR) | Low income (n = 20) | Mali, Togo, Democratic Republic of the Congo, South Sudan, Chad, Burkina Faso, Gambia, Liberia, Sierra Leone, Mozambique, Guinea-Bissau, Central African Republic, Malawi, Madagascar, Uganda, Eritrea, Burundi, Rwanda, Ethiopia, Niger |
| Lower-middle income (n = 20) | Algeria, Senegal, Nigeria, Cabo Verde, United Republic of Tanzania, Zambia, Comoros, Lesotho, Zimbabwe, Kenya, Côte d’Ivoire, Mauritania, Guinea, Congo, Cameroon, Angola, Sao Tome and Principe, Ghana, Eswatini, Benin | |
| Upper-middle income (n = 6) | South Africa, Namibia, Botswana, Equatorial Guinea, Gabon, Mauritius | |
| High income (n = 1) | Seychelles | |
| Region of the Americas (AMR) | Low income (n = 0) | - |
| Lower-middle income (n = 4) | Honduras, Nicaragua, Bolivia (Plurinational State of), Haiti | |
| Upper-middle income (n = 19) | Paraguay, Peru, Colombia, Dominican Republic, Guatemala, Saint Vincent and the Grenadines, Grenada, Brazil, Jamaica, Belize, Ecuador, Dominica, El Salvador, Argentina, Mexico, Saint Lucia, Suriname, Costa Rica, Cuba | |
| High income (n = 19) | Guyana, Bahamas, Puerto Rico, British Virgin Islands, Bermuda, Trinidad and Tobago, Cayman Islands, United States of America, Saint Kitts and Nevis, Antigua and Barbuda, Panama, Canada, Aruba, Barbados, Uruguay, Chile, Turks and Caicos Islands, Sint Maarten (Dutch part), Curaçao | |
| Eastern Mediterranean Region (EMR) | Low income (n = 5) | Afghanistan, Yemen, Sudan, Somalia, Syrian Arab Republic |
| Lower-middle income (n = 8) | Morocco, Djibouti, Egypt, Tunisia, Jordan, Lebanon, Iran (Islamic Republic of), Pakistan | |
| Upper-middle income (n = 3) | Occupied Palestinian territory, including east Jerusalem, Iraq, Libya | |
| High income (n = 6) | United Arab Emirates, Bahrain, Saudi Arabia, Kuwait, Qatar, Oman | |
| European Region (EUR) | Low income (n = 0) | - |
| Lower-middle income (n = 4) | Ukraine, Uzbekistan, Tajikistan, Kyrgyzstan | |
| Upper-middle income (n = 15) | Republic of Moldova, North Macedonia, Albania, Armenia, Turkmenistan, Kazakhstan, Azerbaijan, Georgia, Tăźrkiye, Russian Federation, Belarus, Bulgaria, Bosnia and Herzegovina, Montenegro, Serbia | |
| High income (n = 35) | Norway, Belgium, Germany, Romania, San Marino, Luxembourg, Slovenia, Sweden, Latvia, Lithuania, Malta, Iceland, Monaco, Italy, Croatia, Israel, Portugal, Denmark, Slovakia, Greenland, Finland, Greece, Austria, Andorra, Spain, Switzerland, Estonia, Ireland, Netherlands (Kingdom of the), Poland, United Kingdom of Great Britain and Northern Ireland, Czechia, Cyprus, Hungary, France | |
| South-East Asian Region (SEAR) | Low income (n = 1) | Democratic People’s Republic of Korea |
| Lower-middle income (n = 7) | Bhutan, Nepal, Bangladesh, India, Myanmar, Sri Lanka, Timor-Leste | |
| Upper-middle income (n = 3) | Maldives, Indonesia, Thailand | |
| High income (n = 0) | - | |
| Western Pacific Region (WPR) | Low income (n = 0) | - |
| Lower-middle income (n = 11) | Samoa, Solomon Islands, Lao People’s Democratic Republic, Mongolia, Kiribati, Viet Nam, Philippines, Papua New Guinea, Vanuatu, Micronesia (Federated States of), Cambodia | |
| Upper-middle income (n = 7) | Malaysia, Palau, Tuvalu, Marshall Islands, Fiji, Tonga, China | |
| High income (n = 14) | Singapore, American Samoa, Japan, China Macao SAR, China Hong Kong SAR, Nauru, New Caledonia, Guam, Northern Mariana Islands, Australia, French Polynesia, New Zealand, Brunei Darussalam, Republic of Korea |
| Key Area | Description |
|---|---|
| 1. Strengthening Health Systems | Universal Health Coverage: Ensure all individuals have access to quality health services without financial hardship, including diagnostics, treatment, and preventive services. |
| Health care Infrastructure: Invest in robust health care infrastructure, especially in low- and middle-income countries, to improve TB detection, treatment, and follow-up. | |
| 2. Enhancing TB Detection and Diagnosis | Advanced Diagnostics: Deploy advanced and rapid diagnostic tools, such as molecular tests (e.g., GeneXpert), to quickly and accurately identify TB cases. While GeneXpert has been a significant advancement in TB diagnostics, its utility in peripheral and resource-limited settings remains constrained due to its cost, infrastructure requirements, and operational challenges. These limitations highlight the urgent need for diagnostic tools that are affordable, portable, and capable of functioning effectively in decentralized settings with minimal resources. Future strategies to improve TB detection should prioritize innovations that address these gaps, ensuring accessibility and scalability across diverse health care systems. |
| Screening Programs: Implement comprehensive screening programs targeting high-risk populations, including people living with HIV, health care workers, and those in close contact with TB patients. | |
| 3. Ensuring Effective Treatment and Care | Adherence to Treatment: Improve patient adherence to TB treatment regimens through education, support programs, and adherence-monitoring technologies. |
| Drug-Resistant TB: Develop and distribute effective treatment regimens for multidrug-resistant TB (MDR-TB) and extensively drug-resistant TB (XDR-TB). | |
| 4. Addressing Social Determinants of Health | Poverty Reduction: Tackle poverty, malnutrition, and poor living conditions, which are significant risk factors for TB. |
| Education and Awareness: Increase public awareness about TB prevention, symptoms, and the importance of completing treatment through educational campaigns. | |
| 5. Expanding Preventive Measures | Vaccination: Develop and distribute an effective TB vaccine. The current BCG vaccine has limited effectiveness in adults, so new vaccines are crucial. |
| Preventive Therapy: Provide preventive therapy for individuals at high risk of developing TB, such as people living with HIV as well as household contacts of infectious pulmonary TB patients and those with latent TB infection. | |
| 6. Strengthening Global Collaboration and Funding | International Partnerships: Foster collaboration among countries, international organizations (e.g., WHO, Global Fund), NGOs, and research institutions to share knowledge, resources, and best practices. |
| Sustainable Funding: Secure long-term funding for TB control programs to ensure consistent and comprehensive efforts. | |
| 7. Implementing Robust Surveillance and Research | Surveillance Systems: Strengthen TB surveillance systems to monitor trends, identify outbreaks, and measure the impact of interventions. |
| Research and Innovation: Invest in research to develop new diagnostics, treatments, and vaccines and in operational research to understand how best to deploy new tools. Innovation and subsequent deployment are essential to address emerging challenges like drug-resistant TB. | |
| 8. Integrating TB Services with Other Health Programs | TB and Comorbidities Co-management: e.g., Integrate TB and HIV services to ensure that people living with HIV receive regular TB screening and prompt treatment if necessary. The same approach should be used for the other key risk factors (undernutrition, tobacco use, diabetes, and alcohol use). |
| Primary Health Care: Incorporate TB services into primary health care to increase accessibility and reduce stigma. | |
| 9. Community Engagement and Support | Community Health Workers: Train and deploy community health workers to support TB detection, treatment adherence, and patient education. |
| Empower Communities: Engage communities in TB control efforts to foster local ownership and culturally appropriate interventions. | |
| 10. Policy and Advocacy | National TB Programs: Strengthen national TB programs with clear policies, strategies, and guidelines aligned with global standards. |
| Advocacy: Advocate for political commitment and leadership at all levels to prioritize TB control and allocate necessary resources. |
Disclaimer/Publisher’s Note: The statements, opinions and data contained in all publications are solely those of the individual author(s) and contributor(s) and not of MDPI and/or the editor(s). MDPI and/or the editor(s) disclaim responsibility for any injury to people or property resulting from any ideas, methods, instructions or products referred to in the content. |
© 2024 by the authors. Licensee MDPI, Basel, Switzerland. This article is an open access article distributed under the terms and conditions of the Creative Commons Attribution (CC BY) license (https://creativecommons.org/licenses/by/4.0/).
Share and Cite
Koura, K.G.; Harries, A.D. The Trend of Tuberculosis Case Notification Rates from 1995 to 2022 by Country Income and World Health Organization Region. Trop. Med. Infect. Dis. 2024, 9, 294. https://doi.org/10.3390/tropicalmed9120294
Koura KG, Harries AD. The Trend of Tuberculosis Case Notification Rates from 1995 to 2022 by Country Income and World Health Organization Region. Tropical Medicine and Infectious Disease. 2024; 9(12):294. https://doi.org/10.3390/tropicalmed9120294
Chicago/Turabian StyleKoura, Kobto G., and Anthony D. Harries. 2024. "The Trend of Tuberculosis Case Notification Rates from 1995 to 2022 by Country Income and World Health Organization Region" Tropical Medicine and Infectious Disease 9, no. 12: 294. https://doi.org/10.3390/tropicalmed9120294
APA StyleKoura, K. G., & Harries, A. D. (2024). The Trend of Tuberculosis Case Notification Rates from 1995 to 2022 by Country Income and World Health Organization Region. Tropical Medicine and Infectious Disease, 9(12), 294. https://doi.org/10.3390/tropicalmed9120294