
Predictive Risk Mapping of Schistosomiasis in Madagascar Using Ecological Niche Modeling and Precision Mapping

Abstract
:1. Introduction
2. Materials and Methods
2.1. Study Area
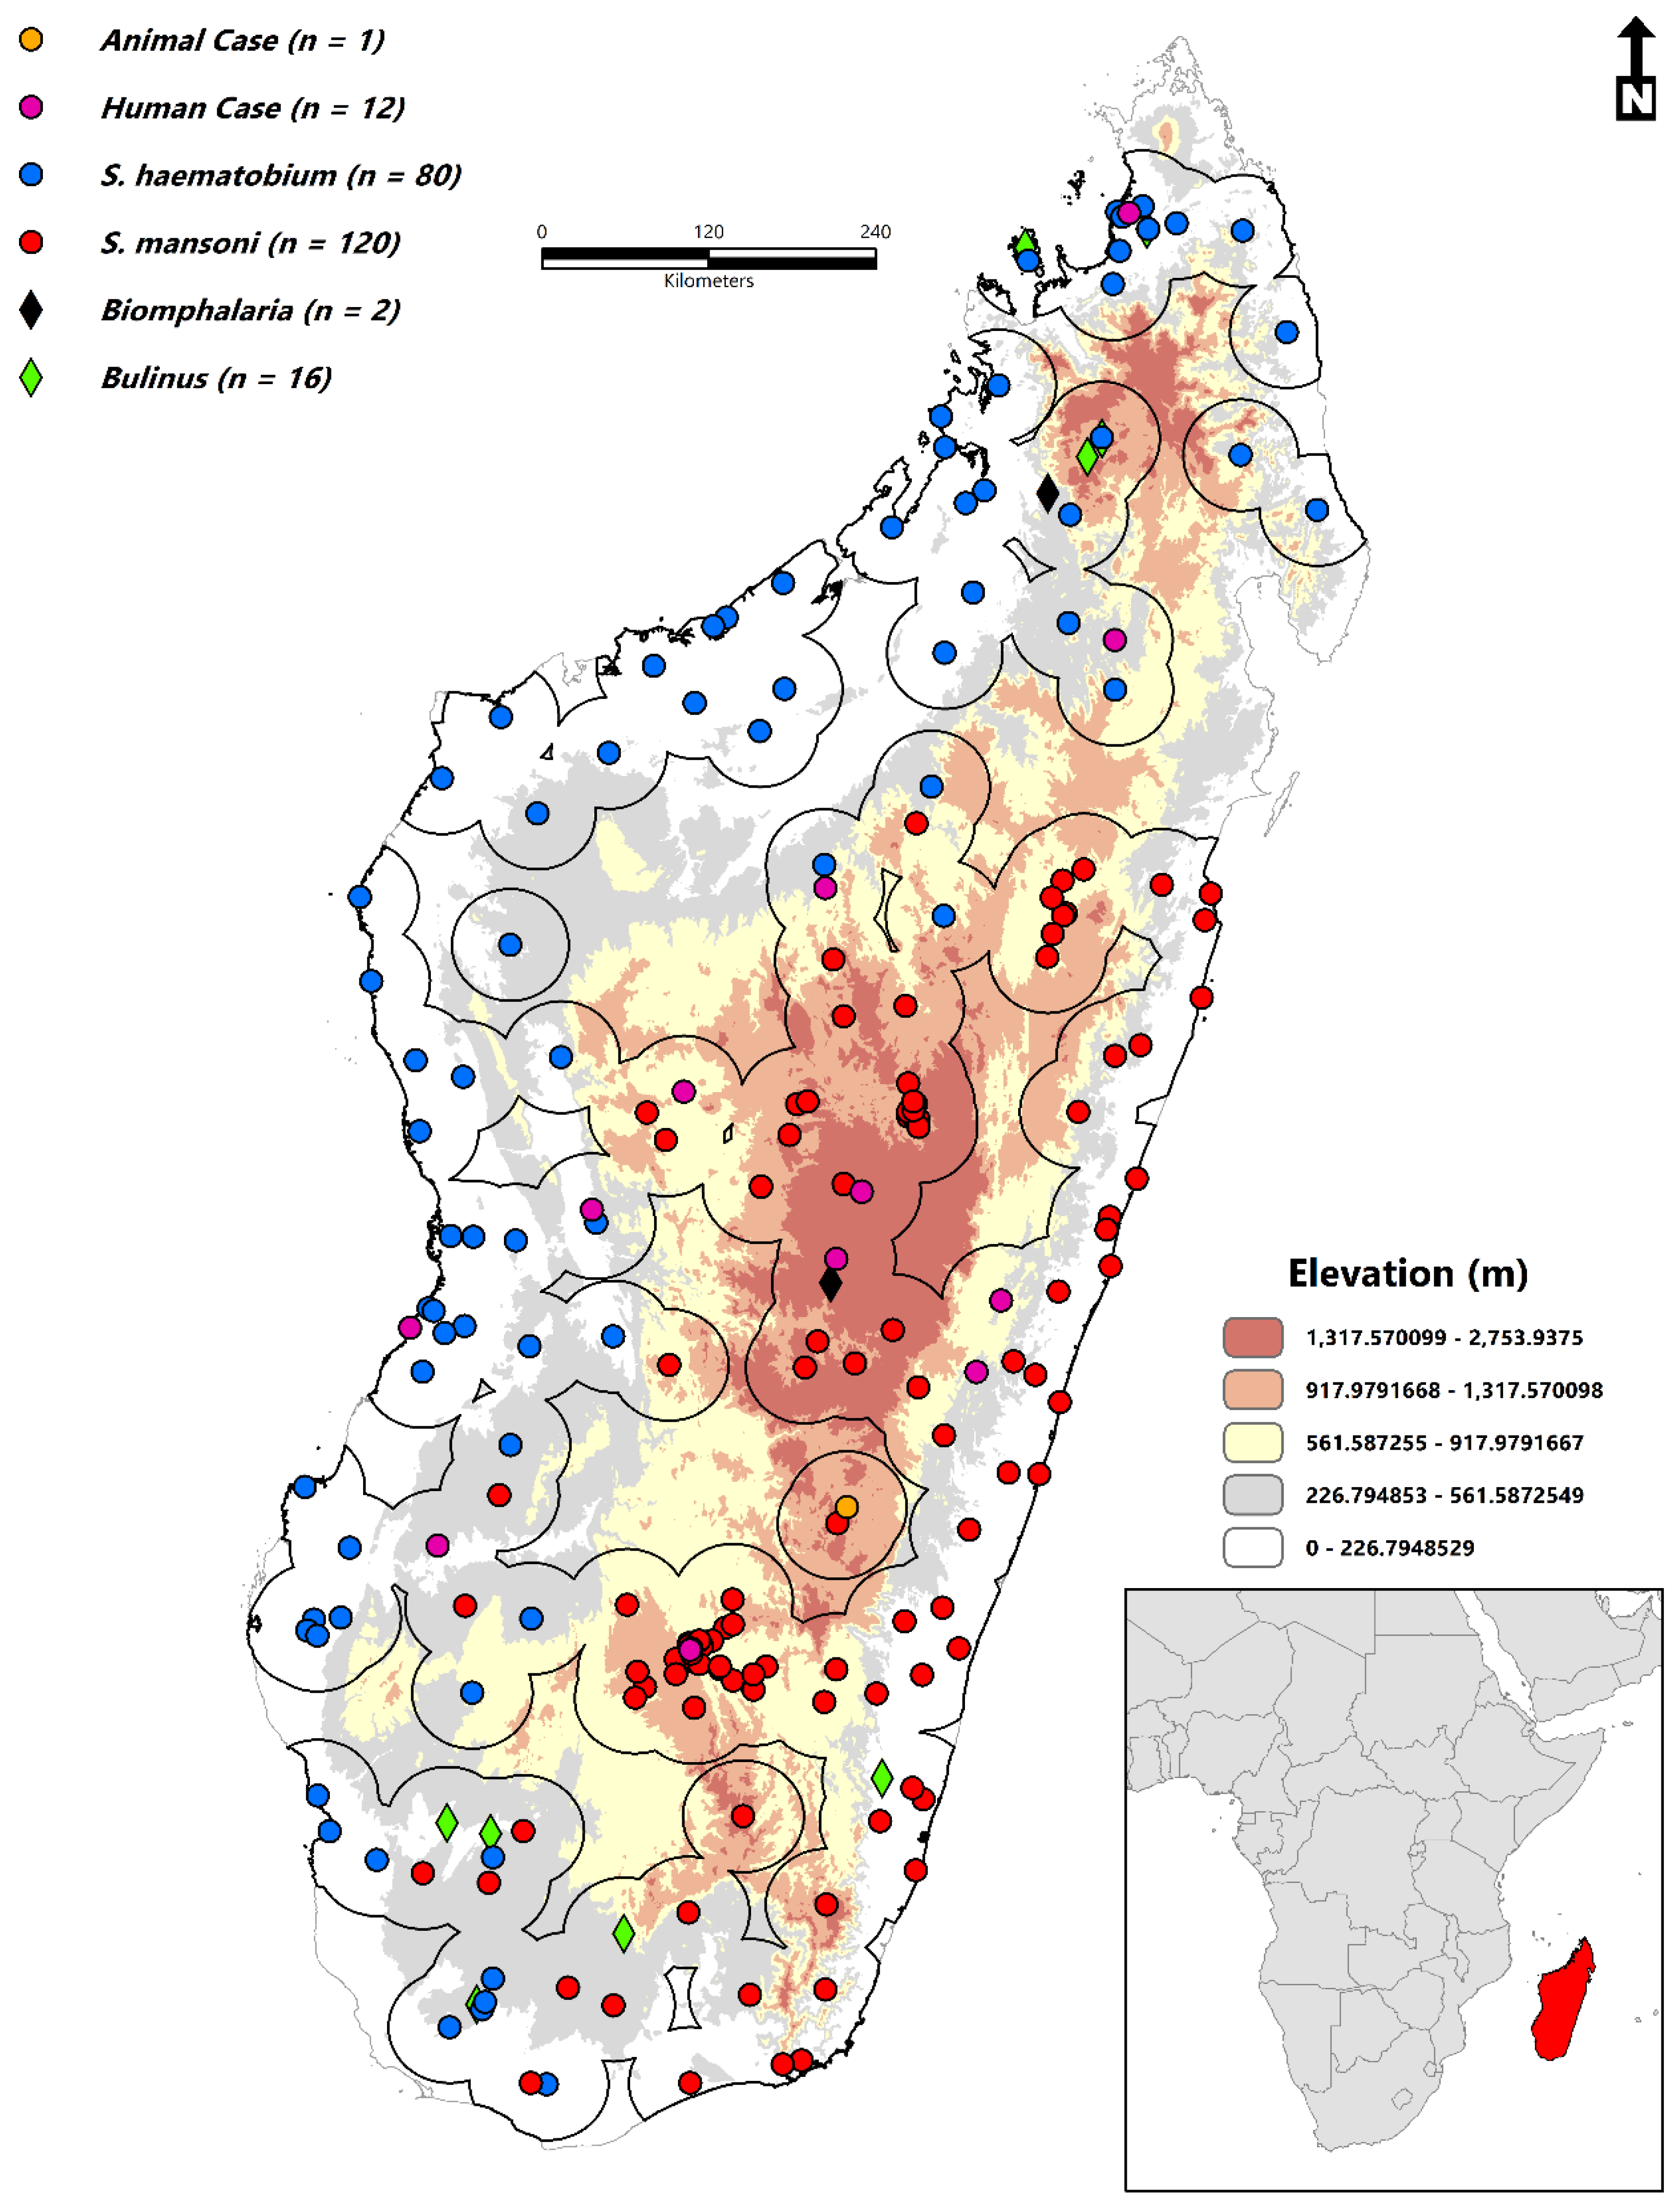
2.2. Occurrence Data
2.3. Environmental Variables
2.4. Variable Selection
2.5. Ecological Niche Modeling
2.6. Estimating Zones of Exposure Risk and the At-Risk Population
3. Results
4. Discussion
5. Conclusions
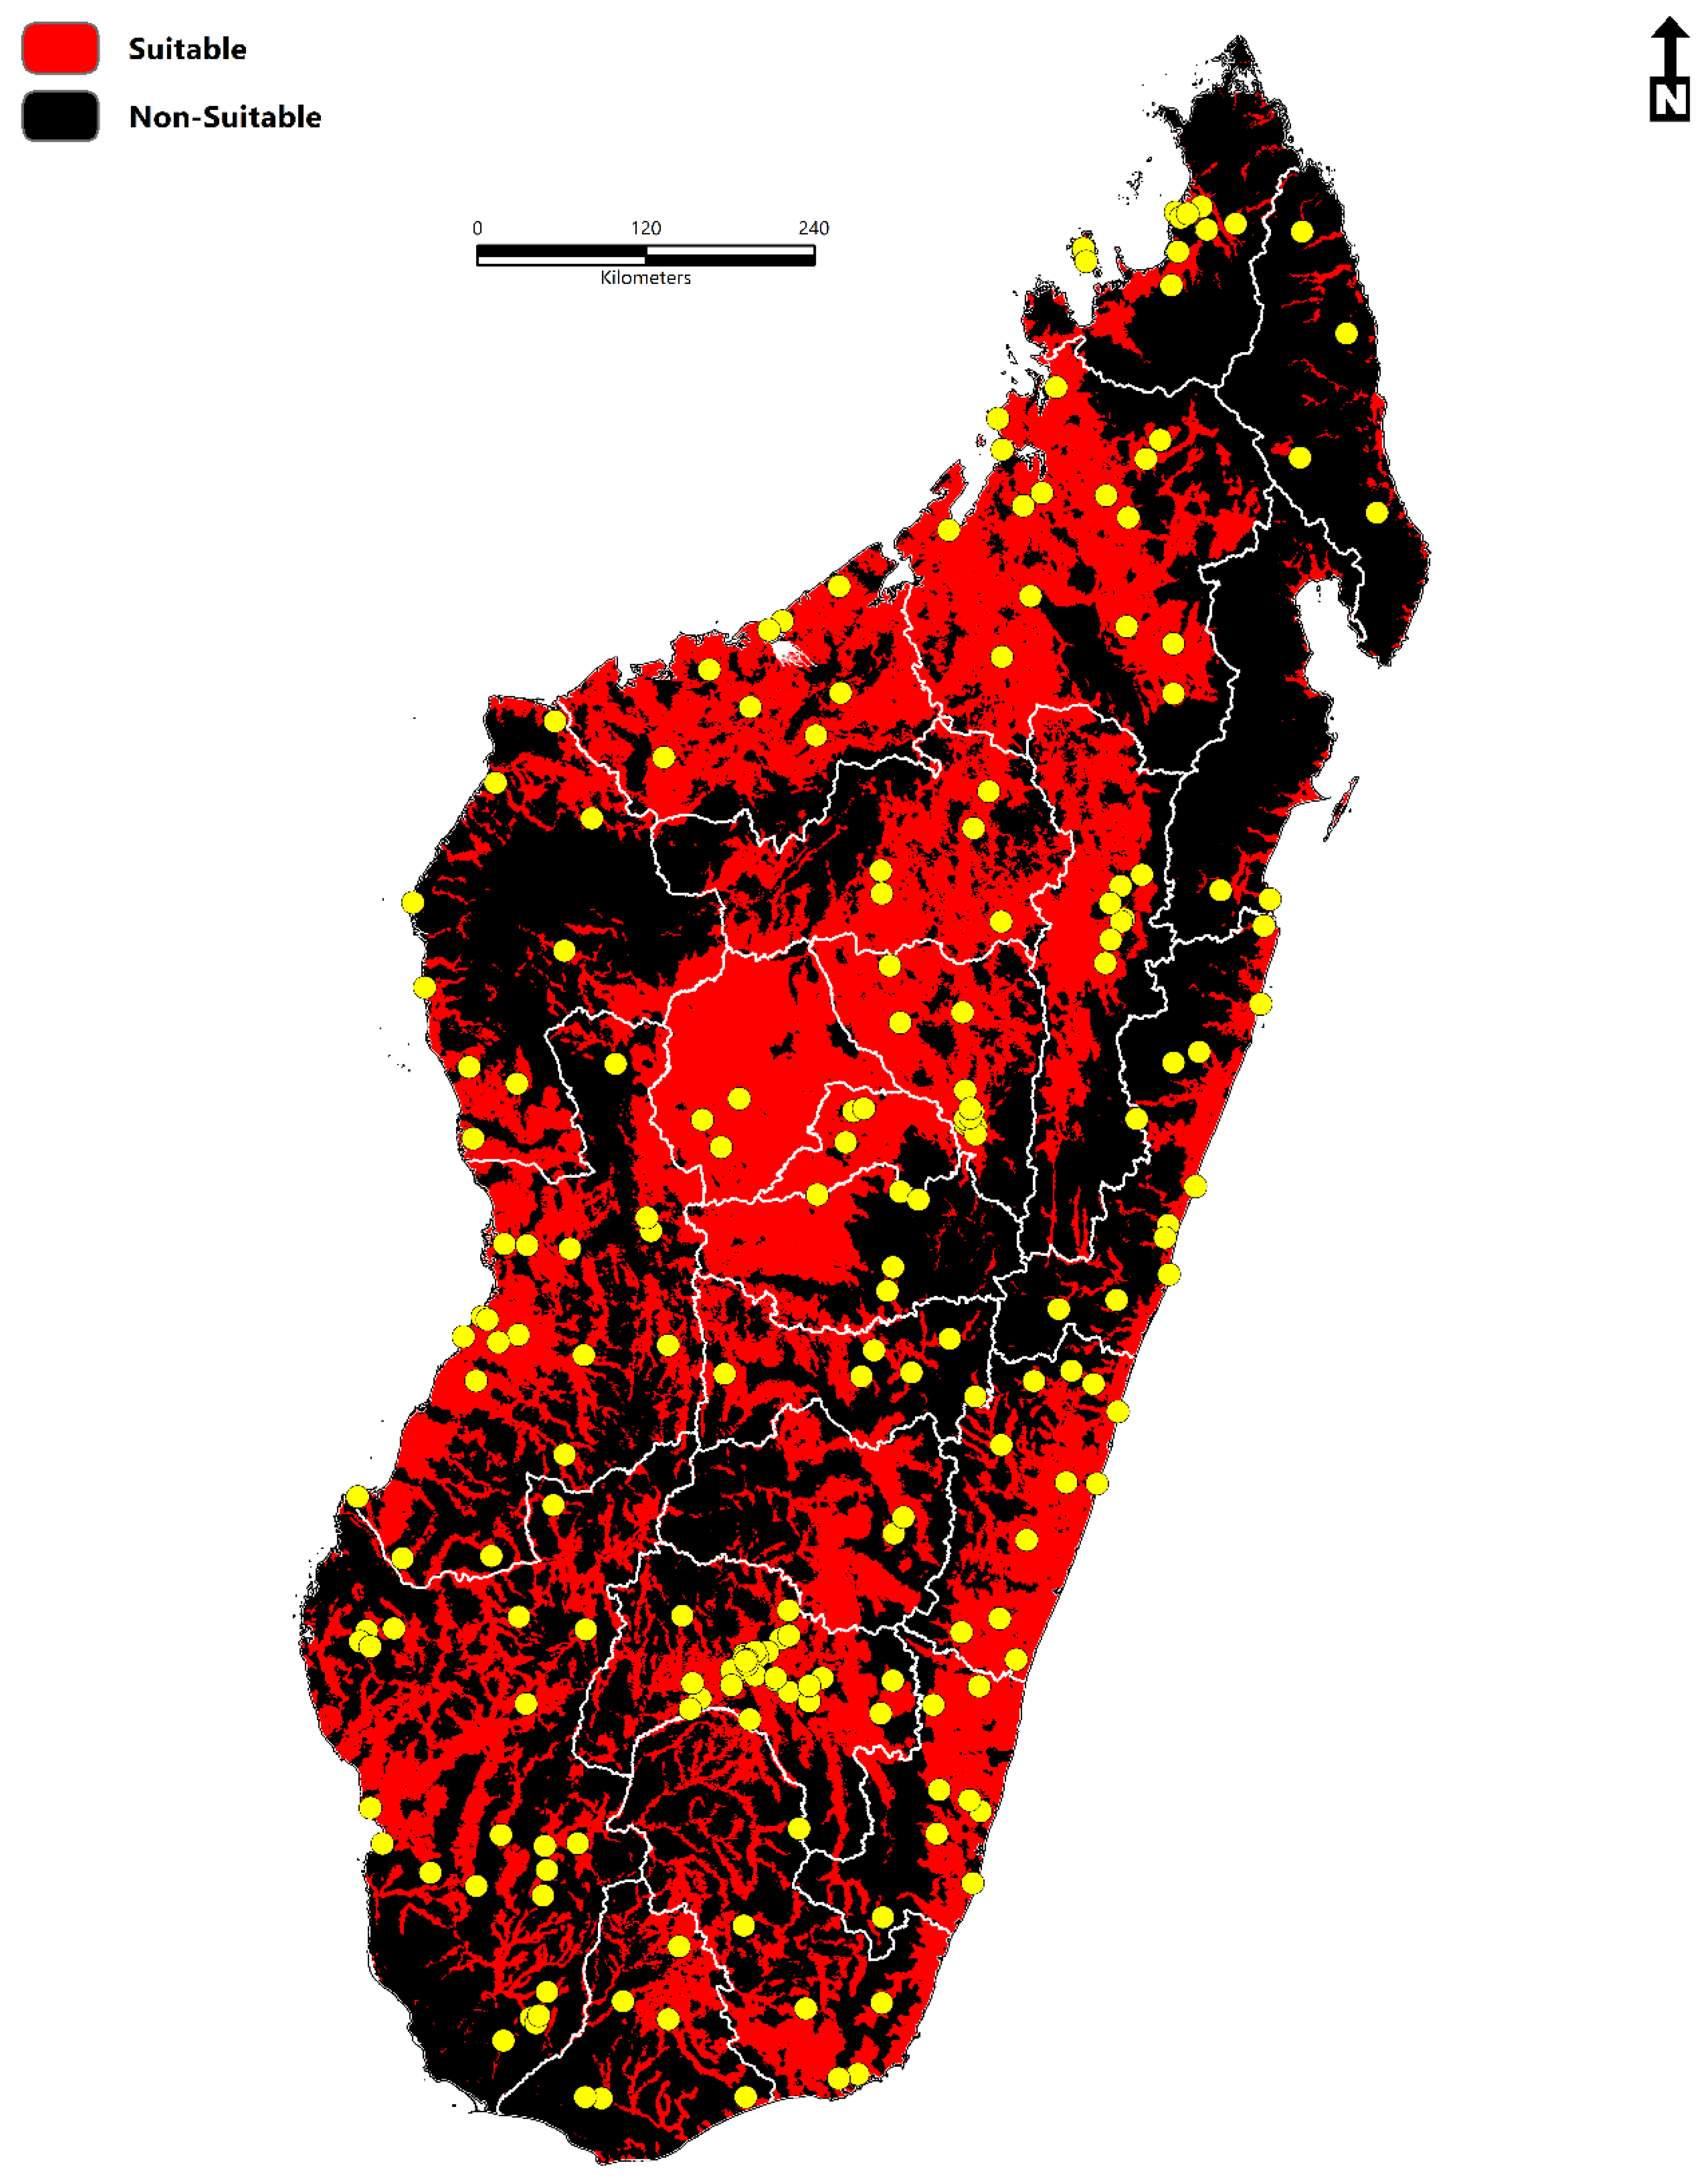
- The total area of environmental suitability is 264,781 km2 (102,232 sq miles).
- The population at risk is 14,972,194 million people (2020) (11.4 million-rural areas; 3.5 million-urban areas).
- Environmental suitability is concentrated throughout Sofia, Boeny, Bongolava, Itasy, Analamanga, Betsiboka, Alaotra-Mangoro, Atsinanana, Vakinankaratra, Amoron’I mania, Vatovavy Fitovinany, Haute Matsiatra, Menabe, Atsimo–Andrefana, Ihorombe, Anosy, Androy, and Atsimo-Atsinana.
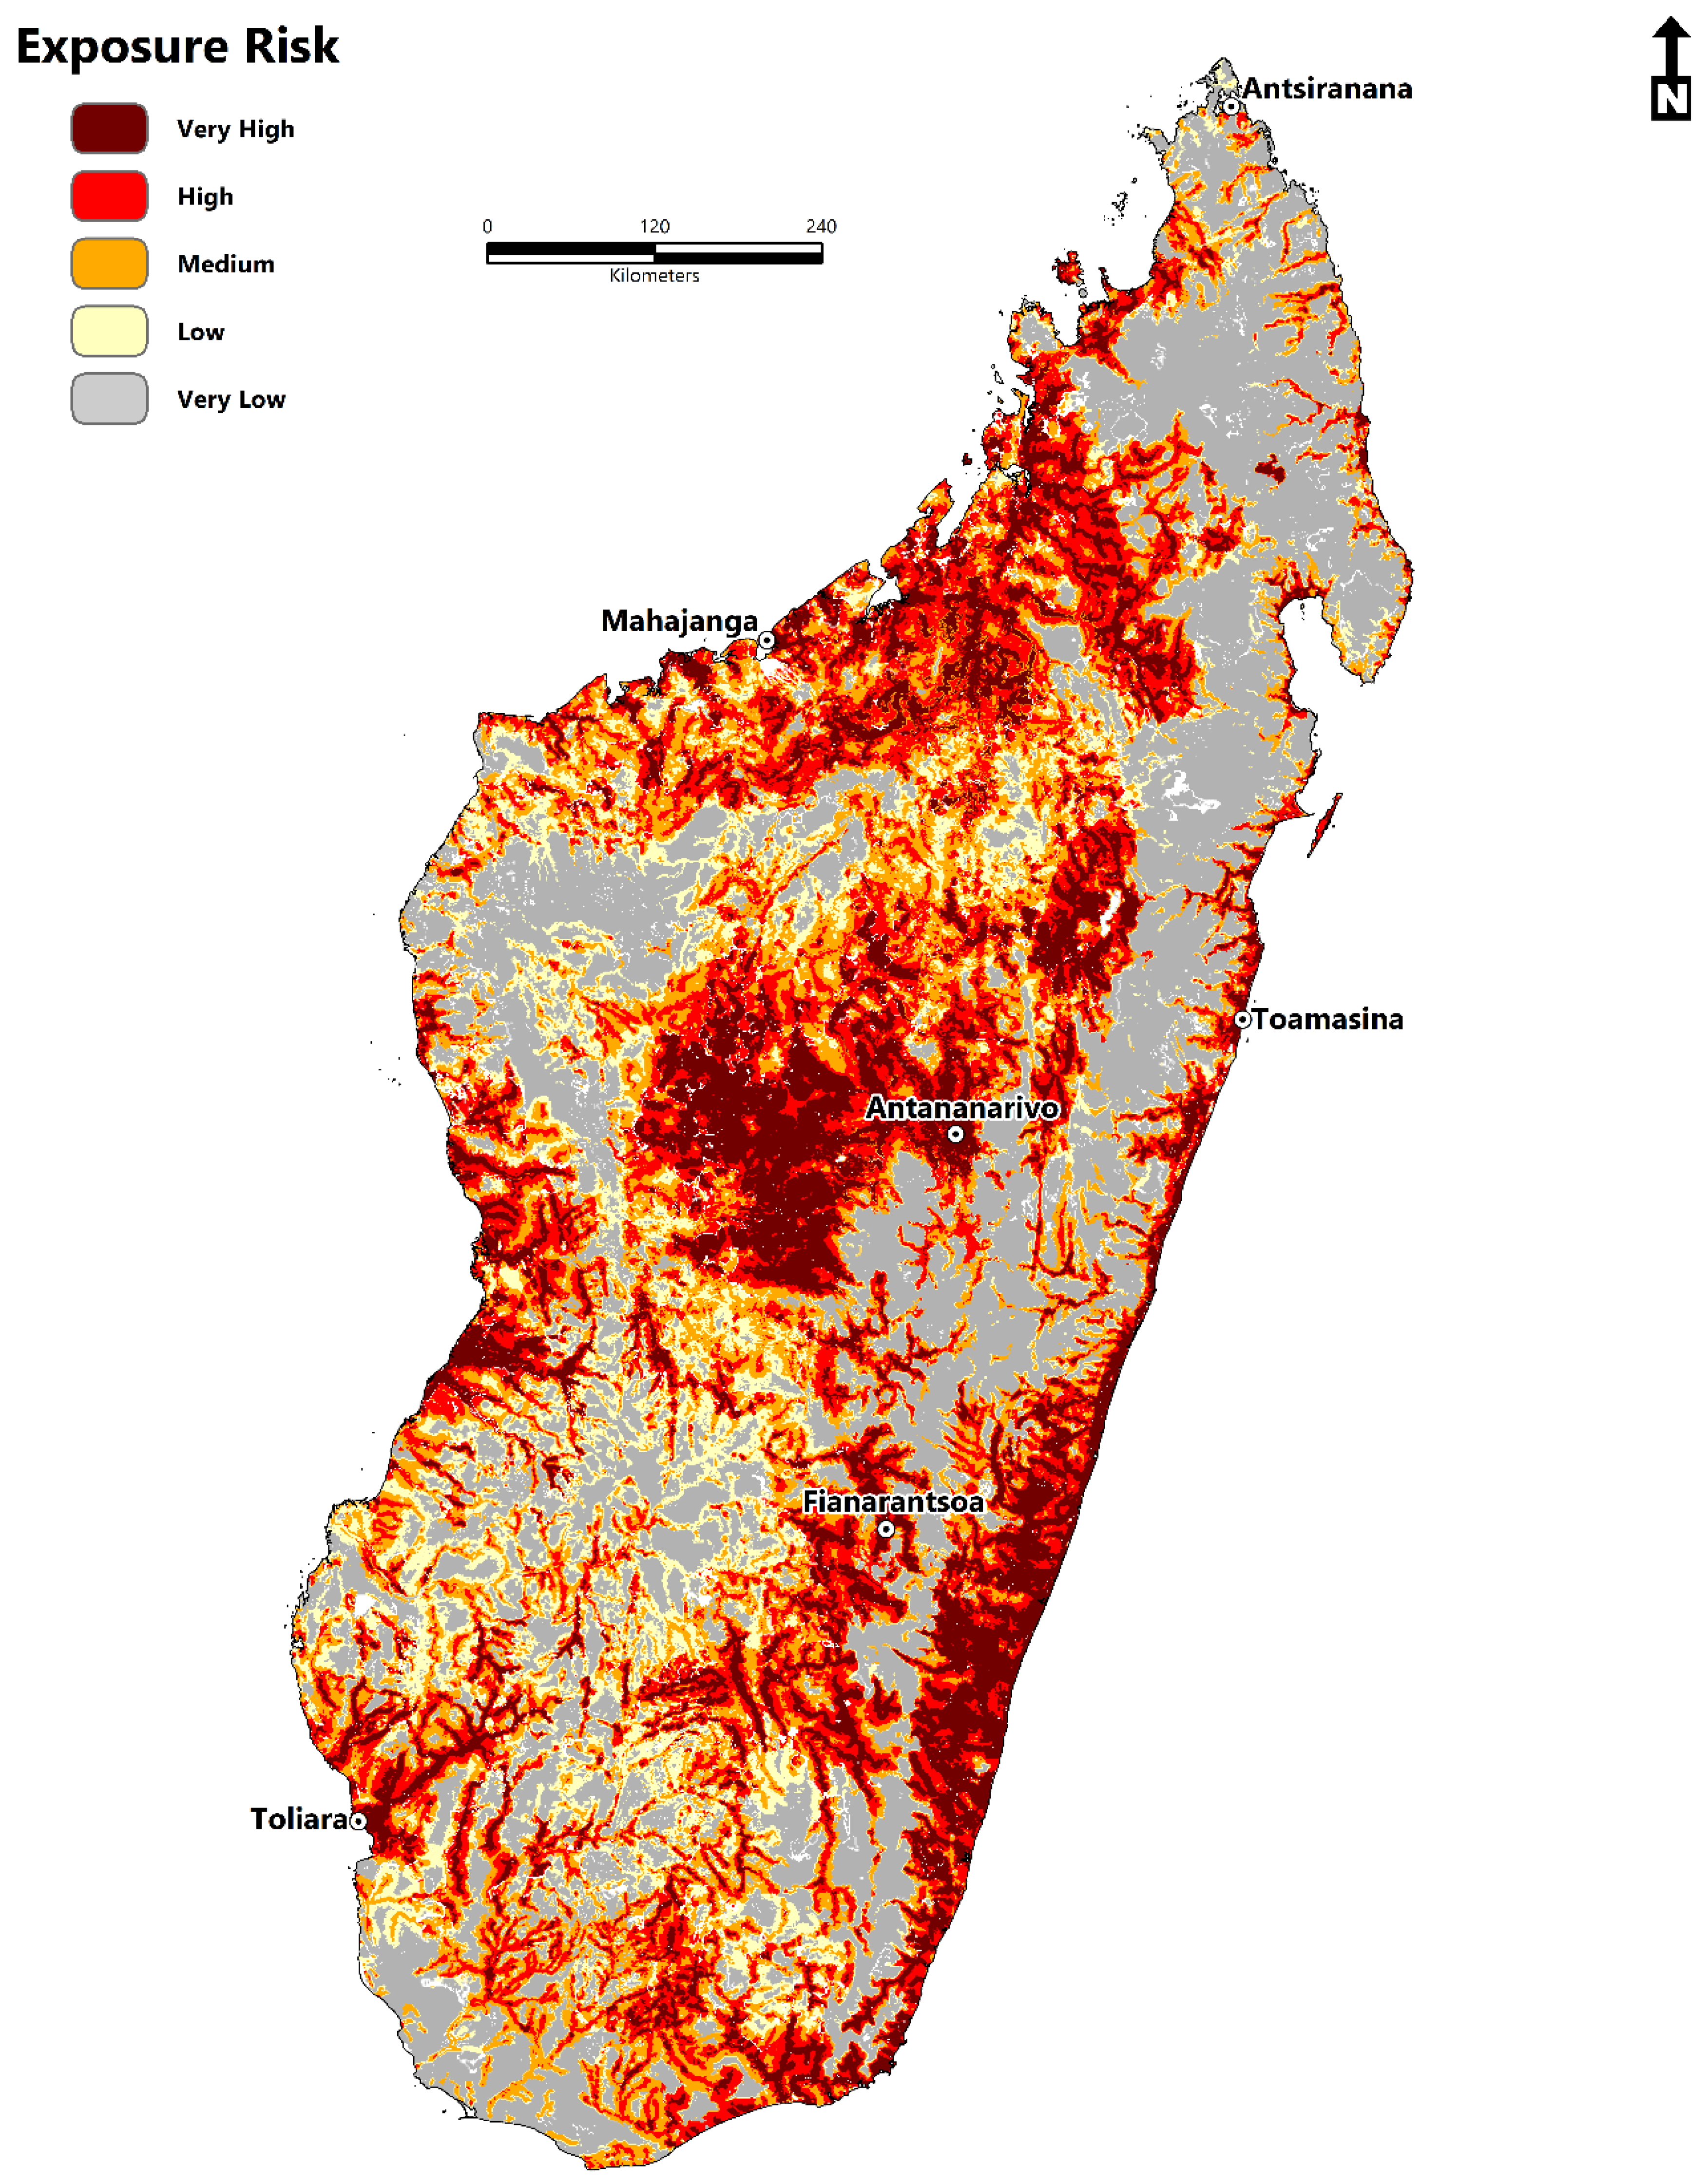
- The disease transmission risk to human populations is significant within the central highland region, humid tropical eastern coast, dry-arid southwest, northwest, and to a lesser extent, the north and east.
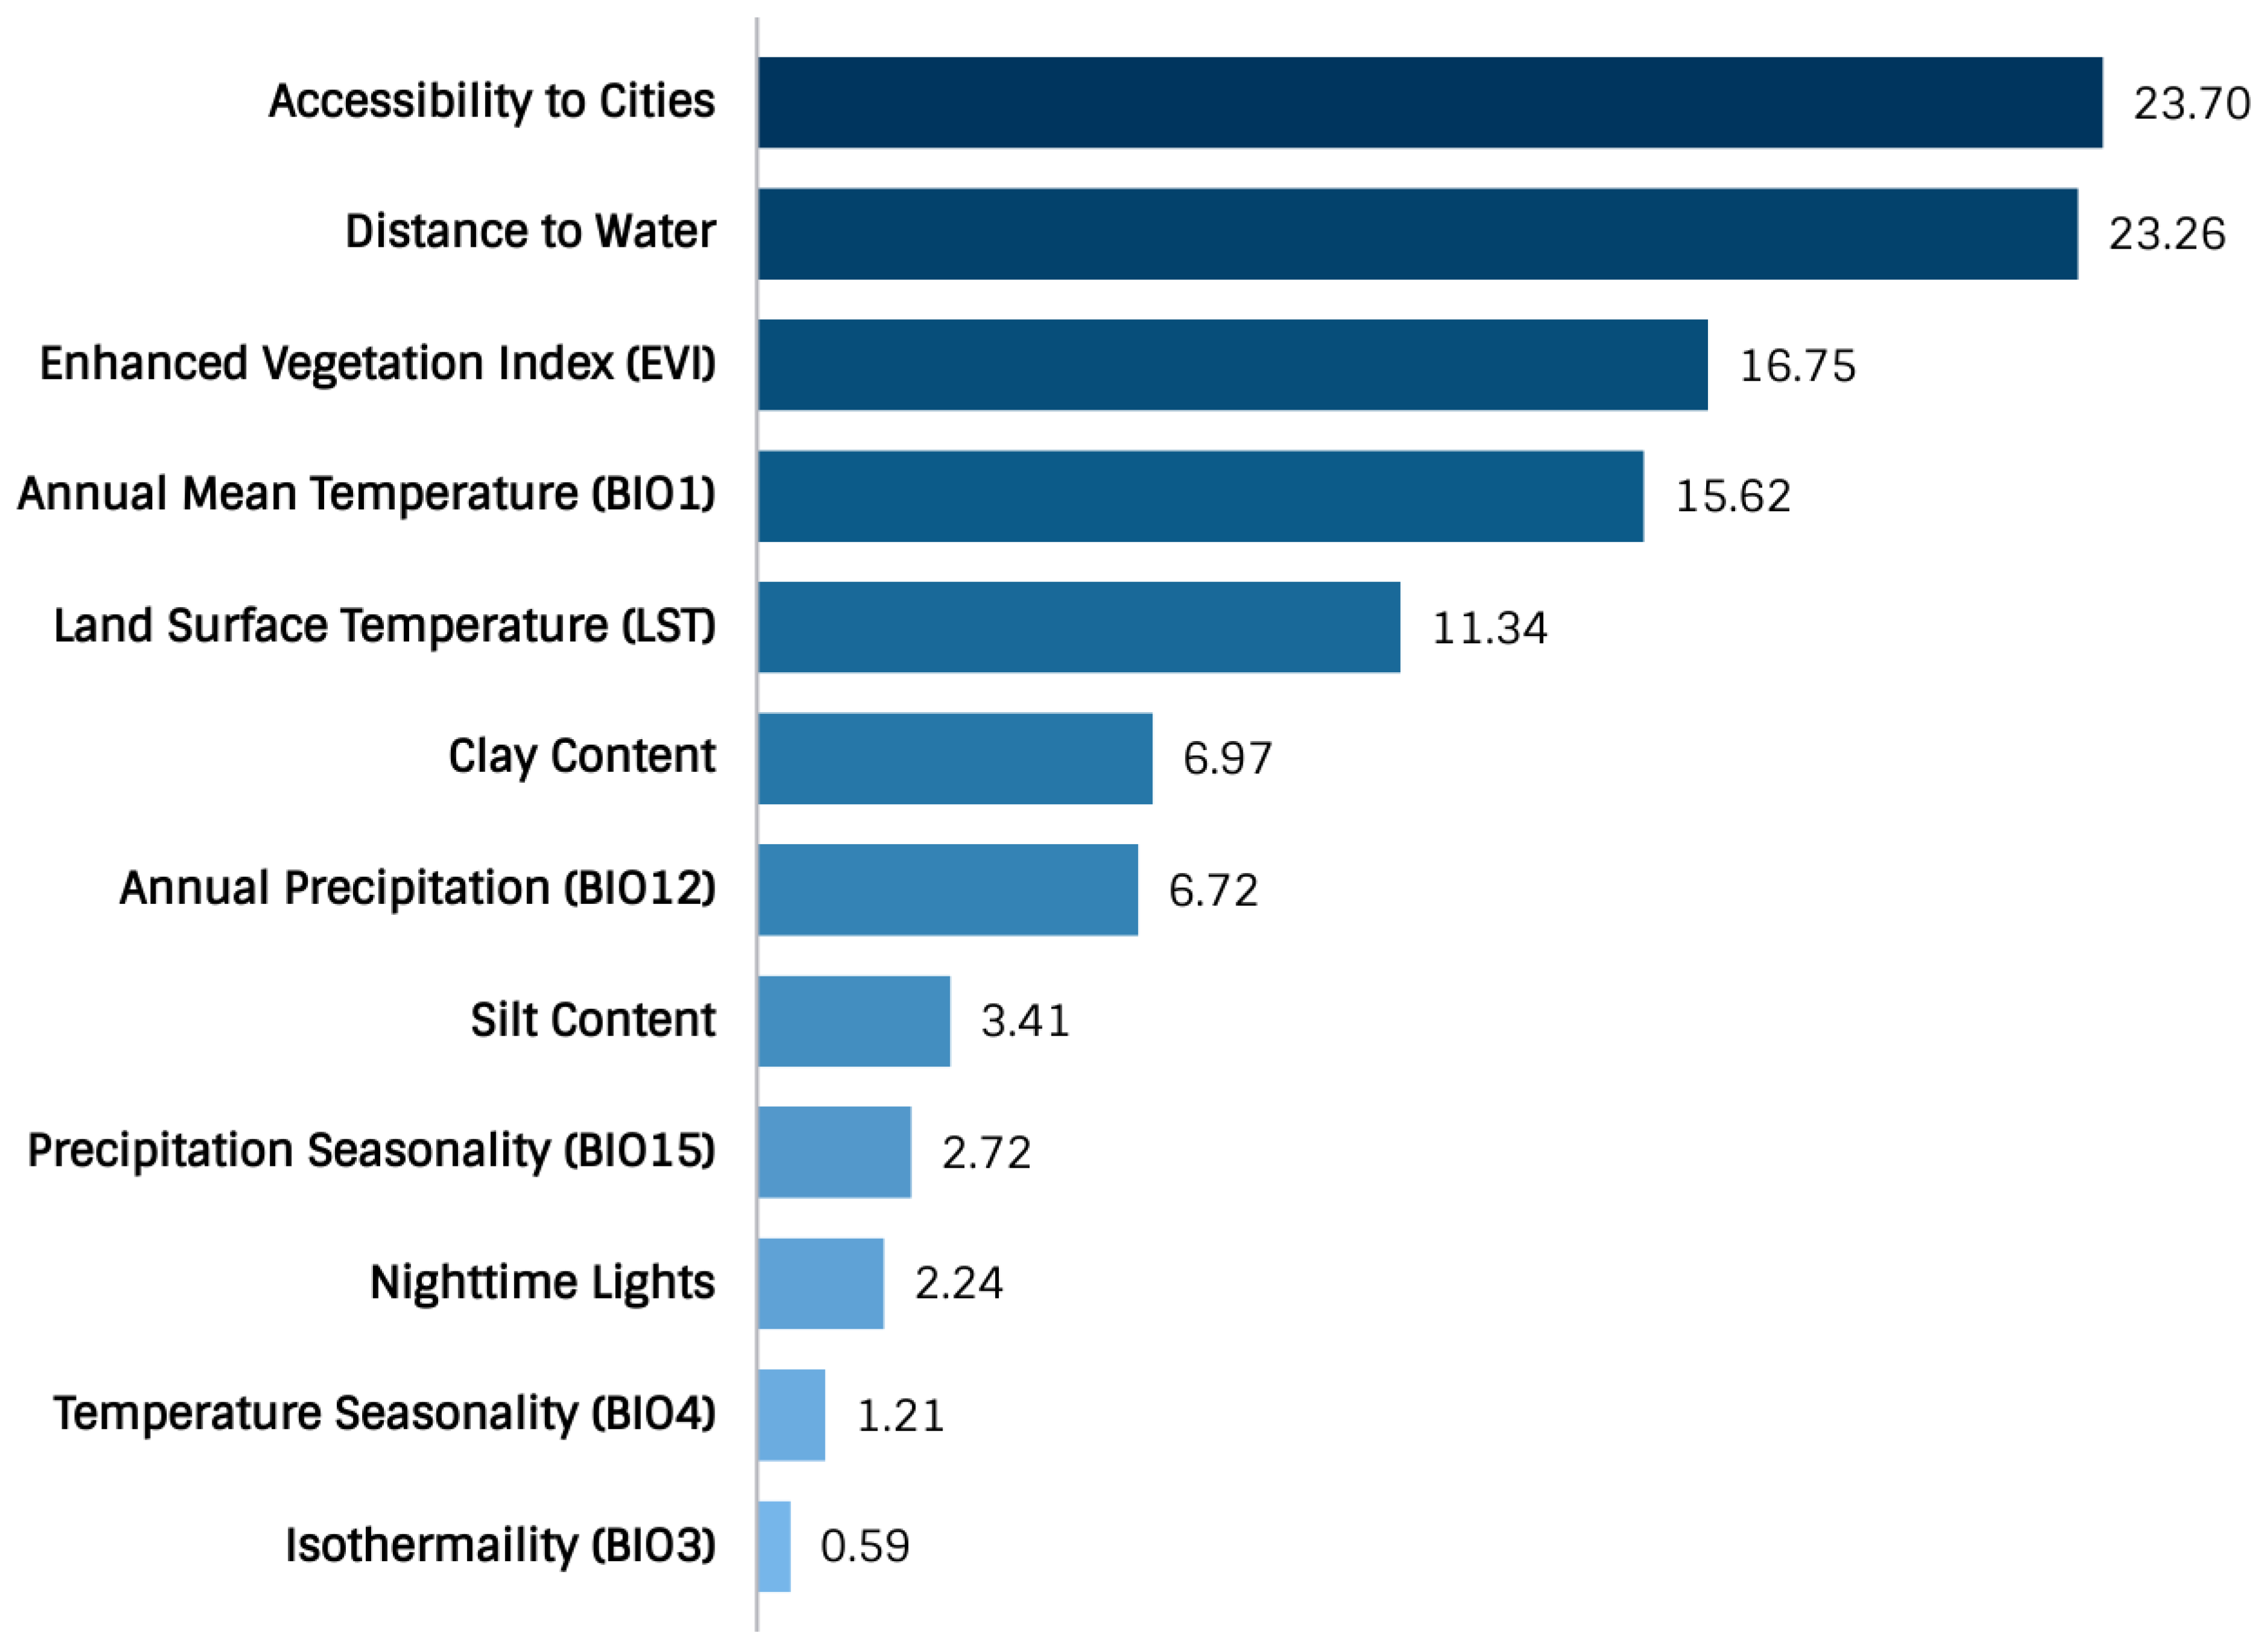
- Variables of significance model contribution were the accessibility to cities, distance to water, enhanced vegetation index (EVI), annual mean temperature, land surface temperature (LST), clay content, and annual precipitation.
Supplementary Materials
Funding
Data Availability Statement
Conflicts of Interest
References
- Schistosomiasis. Available online: https://www.who.int/news-room/fact-sheets/detail/schistosomiasis (accessed on 11 November 2021).
- Livingston, M.; Pillay, P.; Zulu, S.G.; Sandvik, L.; Kvalsvig, J.D.; Gagai, S.; Galappaththi-Arachchige, H.N.; Kleppa, E.; Ndhlovu, P.; Vennervald, B. Mapping Schistosoma Haematobium for Novel Interventions against Female Genital Schistosomiasis and Associated HIV Risk in KwaZulu-Natal, South Africa. Am. J. Trop. Med. Hyg. 2021, 104, 2055. [Google Scholar] [CrossRef]
- Adenowo, A.F.; Oyinloye, B.E.; Ogunyinka, B.I.; Kappo, A.P. Impact of Human Schistosomiasis in Sub-Saharan Africa. Braz. J. Infect. Dis. 2015, 19, 196–205. [Google Scholar] [CrossRef] [Green Version]
- Chevalier, F.D.; Diaz, R.; McDew-White, M.; Anderson, T.J.; Le Clec’h, W. The Hemolymph of Biomphalaria Snail Vectors of Schistosomiasis Supports a Diverse Microbiome. Environ. Microbiol. 2020, 22, 5450–5466. [Google Scholar] [CrossRef] [PubMed]
- Pennance, T.; Allan, F.; Emery, A.; Rabone, M.; Cable, J.; Garba, A.D.; Hamidou, A.A.; Webster, J.P.; Rollinson, D.; Webster, B.L. Interactions between Schistosoma Haematobium Group Species and Their Bulinus Spp. Intermediate Hosts along the Niger River Valley. Parasites Vectors 2020, 13, 1–15. [Google Scholar] [CrossRef]
- Shan, X.; Liu, S.; Liu, J.; Zhu, H.; Xiao, Y.; Chen, Y. Geographical Survey of the Intermediate Host of Schistosoma Japonicum: Toward Precise Management of Oncomelania Hupensis. PLoS Negl. Trop. Dis. 2020, 14, e0008674. [Google Scholar] [CrossRef] [PubMed]
- Gundamaraju, R. Novel Antipathy for Schistosomiasis-the Most Lethal Ailment of the Tropical Region. Asian Pac. J. Trop. Biomed. 2014, 4, S43. [Google Scholar] [CrossRef] [Green Version]
- Field Listing: Major Infectious Diseases. 2010. Available online: https://www.cia.gov/library/publications/the-world-factbook/fields/2193.html (accessed on 3 November 2021).
- Hotez, P.J.; Alvarado, M.; Basáñez, M.-G.; Bolliger, I.; Bourne, R.; Boussinesq, M.; Brooker, S.J.; Brown, A.S.; Buckle, G.; Budke, C.M. The Global Burden of Disease Study 2010: Interpretation and Implications for the Neglected Tropical Diseases. PLoS Negl. Trop. Dis. 2014, 8, e2865. [Google Scholar] [CrossRef] [PubMed] [Green Version]
- Steinmann, P.; Keiser, J.; Bos, R.; Tanner, M.; Utzinger, J. Schistosomiasis and Water Resources Development: Systematic Review, Meta-Analysis, and Estimates of People at Risk. Lancet Infect. Dis. 2006, 6, 411–425. [Google Scholar] [CrossRef]
- Ministère de la Santé Publique de Madagascar Cartographie Des Maladies Tropicales Negligees a Chimiotherapie Preventive Schistosomiasis-Geo Helminthiases-Filariose Lymphatique. 2016. Available online: https://www.pseau.org/outils/ouvrages/min_sante_mg_oms_plan_directeur_de_lutte_contre_les_maladies_tropicales_negligees_2016_2020_2016 (accessed on 4 November 2021).
- Sheehy, C.; Lawson, H.; Andriamasy, E.H.; Russell, H.J.; Reid, A.; Raderalazasoa, G.U.; Dodge, G.; Kornitschky, R.; Penney, J.M.; Ranaivoson, T.N. Prevalence of Intestinal Schistosomiasis in Pre-School Aged Children: A Pilot Survey in Marolambo District, Madagascar. Infect. Dis. Poverty 2021, 10, 1–9. [Google Scholar] [CrossRef]
- World Bank Group. Madagascar. Available online: https://data.worldbank.org/country/madagascar (accessed on 18 February 2020).
- Index Mundi. Madagascar: People Practicing Open Defecation (% of Population). Available online: https://www.indexmundi.com/facts/madagascar/indicator/SH.STA.ODFC.ZS (accessed on 18 February 2020).
- Rollinson Rollinson: Time to Set the Agenda for Schistosomiasis. Available online: https://scholar.google.com/scholar_lookup?title=Time+to+set+the+agenda+for+schistosomiasis+elimination&publication_year=2013&doi=10.1016%2Fj.actatropica.2012.04.013&pages=423-40&journal=Acta+Trop&volume=128&issue=2&author=D.+Rollinson&author=S.+Knopp&author=S.+Levitz&author=J.+R.+Stothard&author=L.+A.+Tchuem+Tchuente&author=A.+Garba&author=K.+A.+Mohammed&author=N.+Schur&author=B.+Person&author=D.+G.+Colley&author=J.+Utzinger (accessed on 27 November 2021).
- Robinson, K.E.; Grewal, E.P.; Pritt, B.S.; Lloyd, M.; Stephano, A.M.; Fardine, M.; Brumble, L.M.; Libertin, C.R. Schistosomiasis Prevalence and Low-Cost Diagnostics in Rural Northwestern Madagascar: A Pilot Study. J. Glob. Health Rep. 2021, 5, e2021034. [Google Scholar] [CrossRef]
- Dlamini, S.N. Remote Sensing Applications in Disease Mapping. In Remote Sensing; IntechOpen: London, UK, 2020. [Google Scholar]
- Musa, G.J.; Chiang, P.-H.; Sylk, T.; Bavley, R.; Keating, W.; Lakew, B.; Tsou, H.-C.; Hoven, C.W. Use of GIS Mapping as a Public Health Tool—From Cholera to Cancer. Health Serv. Insights 2013, 6, 111–116. [Google Scholar] [CrossRef]
- Tatem, A.J.; Campiz, N.; Gething, P.W.; Snow, R.W.; Linard, C. The Effects of Spatial Population Dataset Choice on Estimates of Population at Risk of Disease. Popul. Health Metr. 2011, 9, 1–14. [Google Scholar] [CrossRef] [Green Version]
- Nicol, J. Geographic Information Systems within the National Health Service: The Scope for Implementation. Plan. Outlook 1991, 34, 37–42. [Google Scholar] [CrossRef]
- Murad, A.; Khashoggi, B.F. Using GIS for Disease Mapping and Clustering in Jeddah, Saudi Arabia. ISPRS Int. J. Geo-Inf. 2020, 9, 328. [Google Scholar] [CrossRef]
- Chen, Y.-Y.; Huang, X.-B.; Xiao, Y.; Jiang, Y.; Shan, X.; Zhang, J.; Cai, S.-X.; Liu, J.-B. Spatial Analysis of Schistosomiasis in Hubei Province, China: A GIS-Based Analysis of Schistosomiasis from 2009 to 2013. PLoS ONE 2015, 10, e0118362. [Google Scholar] [CrossRef] [Green Version]
- Guimarães, R.J.; Freitas, C.C.; Dutra, L.V.; Moura, A.C.; Amaral, R.S.; Drummond, S.C.; Scholte, R.G.; Carvalho, O.S. Schistosomiasis Risk Estimation in Minas Gerais State, Brazil, Using Environmental Data and GIS Techniques. Acta Trop. 2008, 108, 234–241. [Google Scholar] [CrossRef] [PubMed]
- Abdullahi, M.; Bassey, S.; Oyeyi, T. A Comprehensive Mapping of Urinary Schistosomiasis Using Geographic Information Systems (GIS) in Kano State, Nigeria. Bayero J. Pure Appl. Sci. 2009, 2, 41–46. [Google Scholar] [CrossRef]
- Belizario Jr, V.Y.; delos Trinos, J.P.C.R.; Lentejas, N.; Alonte, A.J.; Cuayzon, A.N.; Isiderio, M.E.; Delgado, R.; Tejero, M.; Molina, V.B. Use of Geographic Information System as a Tool for Schistosomiasis Surveillance in an Endemic Municipality in Eastern Samar, the Philippines. Geospat. Health 2021, 16. [Google Scholar] [CrossRef]
- Lai, Y.-S.; Biedermann, P.; Ekpo, U.F.; Garba, A.; Mathieu, E.; Midzi, N.; Mwinzi, P.; N’Goran, E.K.; Raso, G.; Assaré, R.K. Spatial Distribution of Schistosomiasis and Treatment Needs in Sub-Saharan Africa: A Systematic Review and Geostatistical Analysis. Lancet Infect. Dis. 2015, 15, 927–940. [Google Scholar] [CrossRef]
- Ponpetch, K.; Erko, B.; Bekana, T.; Kebede, T.; Tian, D.; Yang, Y.; Liang, S. Environmental Drivers and Potential Distribution of Schistosoma Mansoni Endemic Areas in Ethiopia. Microorganisms 2021, 9, 2144. [Google Scholar] [CrossRef]
- Tchuem Tchuenté, L.-A.; Stothard, J.R.; Rollinson, D.; Reinhard-Rupp, J. Precision Mapping: An Innovative Tool and Way Forward to Shrink the Map, Better Target Interventions, and Accelerate toward the Elimination of Schistosomiasis. PLoS Negl. Trop. Dis. 2018, 12, e0006563. [Google Scholar] [CrossRef] [Green Version]
- Marcotrends. Available online: https://www.macrotrends.net/countries/MDG/madagascar/population (accessed on 12 November 2021).
- International Monetary Fund (IMF). Available online: https://www.imf.org/en/Publications/SPROLLS/world-economic-outlook-databases#sort=%40imfdate%20descending (accessed on 12 November 2021).
- United Nations Development Programme (UNDP). Available online: http://hdr.undp.org/sites/default/files/hdr2020.pdf (accessed on 12 November 2021).
- SCI Foundation. Available online: https://schistosomiasiscontrolinitiative.org/news/2020/7/2/tackling-ntds-in-madagascar-during-the-covid-19-pandemic (accessed on 12 November 2021).
- Brooker, S.; Hotez, P.J.; Bundy, D.A. The Global Atlas of Helminth Infection: Mapping the Way Forward in Neglected Tropical Disease Control. PLoS Negl. Trop. Dis. 2010, 4, e779. [Google Scholar] [CrossRef] [PubMed]
- Doumenge, J.-P.; Mott, K.E.; Cheung, C. Atlas of the Global Distribution of Schistosomiasis Continued. Atlas Glob. Distrib. Schistosomiasis Contin. 1987, 1–17. Available online: https://www.who.int/schistosomiasis/epidemiology/en/madagascar_mauritius.pdf (accessed on 4 November 2021).
- Hörchner, F.; Karrasch, A. The First Cases of Bovine Schistosomiasis in Madagascar. Berl. Und Münchener Tierärztliche Wochenschr. 1972, 85, 329–330. [Google Scholar]
- Spencer, S.A.; Penney, J.M.S.J.; Russell, H.J.; Howe, A.P.; Linder, C.; Rakotomampianina, A.L.; Nandimbiniaina, A.M.; Squire, S.B.; Stothard, J.R.; Bustinduy, A.L. High Burden of Schistosoma Mansoni Infection in School-Aged Children in Marolambo District, Madagascar. Parasites Vectors 2017, 10, 1–8. [Google Scholar] [CrossRef] [Green Version]
- Hoffmann, T.; Carsjens, I.; Rakotozandrindrainy, R.; Girmann, M.; Randriamampionona, N.; Maïga-Ascofaré, O.; Podbielski, A.; Hahn, A.; Frickmann, H.; Schwarz, N.G. Serology-and Blood-PCR-Based Screening for Schistosomiasis in Pregnant Women in Madagascar—A Cross-Sectional Study and Test Comparison Approach. Pathogens 2021, 10, 722. [Google Scholar] [CrossRef]
- Sawyer, S.G. Schistosomiasis (Bilharzia) in Madagascar: A Case Study of a Neglected Tropical Disease. 2013. Available online: https://digitalcollections.sit.edu/isp_collection/1675/ (accessed on 14 November 2021).
- Sato, M.O.; Rafalimanantsoa, A.; Ramarokoto, C.; Rahetilahy, A.M.; Ravoniarimbinina, P.; Kawai, S.; Minamoto, T.; Sato, M.; Kirinoki, M.; Rasolofo, V. Usefulness of Environmental DNA for Detecting Schistosoma Mansoni Occurrence Sites in Madagascar. Int. J. Infect. Dis. 2018, 76, 130–136. [Google Scholar] [CrossRef] [Green Version]
- Leutscher, P.; Ravaoalimalala, V.; Raharisolo, C.; Ramarokoto, C.; Rasendramino, M.; Raobelison, A.; Vennervald, B.; Esterre, P.; Feldmeier, H. Clinical Findings in Female Genital Schistosomiasis in Madagascar. Trop. Med. Int. Health 1998, 3, 327–332. [Google Scholar] [CrossRef]
- Leutscher, P.D.; Høst, E.; Reimert, C.M. Semen Quality in Schistosoma Haematobium Infected Men in Madagascar. Acta Trop. 2009, 109, 41–44. [Google Scholar] [CrossRef]
- Randrianasolo, B.S.; Jourdan, P.M.; Ravoniarimbinina, P.; Ramarokoto, C.E.; Rakotomanana, F.; Ravaoalimalala, V.E.; Gundersen, S.G.; Feldmeier, H.; Vennervald, B.J.; Van Lieshout, L. Gynecological Manifestations, Histopathological Findings, and Schistosoma-Specific Polymerase Chain Reaction Results among Women with Schistosoma Haematobium Infection: A Cross-Sectional Study in Madagascar. J. Infect. Dis. 2015, 212, 275–284. [Google Scholar] [CrossRef] [Green Version]
- Leutscher, P.D.; Behets, F.; Rousset, D.; Ramarokoto, C.-E.; Siddiqi, O.; Ravaoalimalala, E.V.; Christensen, N.O.; Migliani, R. Sexual Behavior and Sexually Transmitted Infections in Men Living in Rural Madagascar: Implications for HIV Transmission. Sex. Transm. Dis. 2003, 30, 262–265. [Google Scholar] [CrossRef] [PubMed]
- Burnod, M. An Isolated Focus of Intestinal Sohistosomiasis in Madagascar. Bull. Société Pathol. Exot. 1952, 45, 744–746. [Google Scholar]
- GBIF.org. GBIF Occurrence Download. Available online: https://www.gbif.org/occurrence/download/0050572-210914110416597 (accessed on 11 November 2021).
- GBIF.org. GBIF Occurrence Download. Available online: https://www.gbif.org/occurrence/download/0050578-210914110416597 (accessed on 11 November 2021).
- Phillips, S.J.; Dudík, M.; Elith, J.; Graham, C.H.; Lehmann, A.; Leathwick, J.; Ferrier, S. Sample Selection Bias and Presence-only Distribution Models: Implications for Background and Pseudo-absence Data. Ecol. Appl. 2009, 19, 181–197. [Google Scholar] [CrossRef] [PubMed] [Green Version]
- Boria, R.A.; Olson, L.E.; Goodman, S.M.; Anderson, R.P. Spatial Filtering to Reduce Sampling Bias Can Improve the Performance of Ecological Niche Models. Ecol. Model. 2014, 275, 73–77. [Google Scholar] [CrossRef]
- Aiello-Lammens, M.E.; Boria, R.A.; Radosavljevic, A.; Vilela, B.; Anderson, R.P. SpThin: An R Package for Spatial Thinning of Species Occurrence Records for Use in Ecological Niche Models. Ecography 2015, 38, 541–545. [Google Scholar] [CrossRef]
- Team, R.C. R: A Language and Environment for Statistical Computing. 2013. Available online: https://www.r-project.org/ (accessed on 1 November 2021).
- Barve, N.; Barve, V.; Jiménez-Valverde, A.; Lira-Noriega, A.; Maher, S.P.; Peterson, A.T.; Soberón, J.; Villalobos, F. The Crucial Role of the Accessible Area in Ecological Niche Modeling and Species Distribution Modeling. Ecol. Model. 2011, 222, 1810–1819. [Google Scholar] [CrossRef]
- Soberón, J.; Peterson, A.T. Interpretation of Models of Fundamental Ecological Niches and Species’ Distributional Areas. 2005. Available online: https://journals.ku.edu/jbi/article/view/4 (accessed on 10 November 2021).
- Hu, Y.; Xia, C.; Li, S.; Ward, M.P.; Luo, C.; Gao, F.; Wang, Q.; Zhang, S.; Zhang, Z. Assessing Environmental Factors Associated with Regional Schistosomiasis Prevalence in Anhui Province, Peoples’ Republic of China Using a Geographical Detector Method. Infect. Dis. Poverty 2017, 6, 1–8. [Google Scholar] [CrossRef] [PubMed] [Green Version]
- Hu, Y.; Zhang, Z.; Chen, Y.; Wang, Z.; Gao, J.; Tao, B.; Jiang, Q.; Jiang, Q. Spatial Pattern of Schistosomiasis in Xingzi, Jiangxi Province, China: The Effects of Environmental Factors. Parasites Vectors 2013, 6, 1–8. [Google Scholar] [CrossRef] [Green Version]
- Manz, K.M.; Kroidl, I.; Clowes, P.; Gerhardt, M.; Nyembe, W.; Maganga, L.; Assisya, W.; Ntinginya, N.E.; Berger, U.; Hoelscher, M. Schistosoma Haematobium Infection and Environmental Factors in Southwestern Tanzania: A Cross-Sectional, Population-Based Study. PLoS Negl. Trop. Dis. 2020, 14, e0008508. [Google Scholar] [CrossRef]
- Walker, J.W.; Kittur, N.; Binder, S.; Castleman, J.D.; Drake, J.M.; Campbell Jr, C.H.; King, C.H.; Colley, D.G. Environmental Predictors of Schistosomiasis Persistent Hotspots Following Mass Treatment with Praziquantel. Am. J. Trop. Med. Hyg. 2020, 102, 328. [Google Scholar] [CrossRef] [PubMed] [Green Version]
- Fick, S.E.; Hijmans, R.J. WorldClim 2: New 1-km Spatial Resolution Climate Surfaces for Global Land Areas. Int. J. Climatol. 2017, 37, 4302–4315. [Google Scholar] [CrossRef]
- Escobar, L.E.; Lira-Noriega, A.; Medina-Vogel, G.; Peterson, A.T. Potential for Spread of the White-Nose Fungus (Pseudogymnoascus Destructans) in the Americas: Use of Maxent and NicheA to Assure Strict Model Transference. Geospat. Health 2014, 9, 221–229. [Google Scholar] [CrossRef] [PubMed]
- Amatulli, G.; Domisch, S.; Tuanmu, M.-N.; Parmentier, B.; Ranipeta, A.; Malczyk, J.; Jetz, W. A Suite of Global, Cross-Scale Topographic Variables for Environmental and Biodiversity Modeling. Sci. Data 2018, 5, 1–15. [Google Scholar] [CrossRef] [PubMed] [Green Version]
- Hengl, T. WorldGrids Archived Layers at 1 Km to 20 Km Spatial Resolution. 2018. Available online: https://zenodo.org/record/1637816#.Yed8s_gRVPY (accessed on 2 November 2021).
- Weiss, D.J.; Nelson, A.; Gibson, H.; Temperley, W.; Peedell, S.; Lieber, A.; Hancher, M.; Poyart, E.; Belchior, S.; Fullman, N. A Global Map of Travel Time to Cities to Assess Inequalities in Accessibility in 2015. Nature 2018, 553, 333–336. [Google Scholar] [CrossRef]
- Noor, A.M.; Alegana, V.A.; Gething, P.W.; Tatem, A.J.; Snow, R.W. Using Remotely Sensed Night-Time Light as a Proxy for Poverty in Africa. Popul. Health Metr. 2008, 6, 1–13. [Google Scholar] [CrossRef] [Green Version]
- Pearson, K. Notes on regression and inheritance in the case of two parents. Proc. R. Soc. Lond. 1895, 58, 240–242. [Google Scholar]
- Osorio-Olvera, L.; Lira-Noriega, A.; Soberon, J.; Peterson, A.T.; Falconi, M.; Contreras-Díaz, R.G.; Martínez-Meyer, E.; Barve, V.; Barve, N. Ntbox: An R Package with Graphical User Interface for Modelling and Evaluating Multidimensional Ecological Niches. Methods Ecol. Evol. 2020, 11, 1199–1206. [Google Scholar] [CrossRef]
- Thuiller, W.; Georges, D.; Engler, R.; Breiner, F.; Georges, M.D.; Thuiller, C.W. Package ‘Biomod2’. Species Distribution Modeling Ensemble Forecasting Framework. 2016, pp. 1–104. Available online: https://cran.r-project.org/web/packages/biomod2/biomod2.pdf (accessed on 2 November 2021).
- Elith, J.; Phillips, S.J.; Hastie, T.; Dudík, M.; Chee, Y.E.; Yates, C.J. A Statistical Explanation of MaxEnt for Ecologists. Divers. Distrib. 2011, 17, 43–57. [Google Scholar] [CrossRef]
- Blackburn, J.K.; McNyset, K.M.; Curtis, A.; Hugh-Jones, M.E. Modeling the Geographic Distribution of Bacillus Anthracis, the Causative Agent of Anthrax Disease, for the Contiguous United States Using Predictive Ecologic Niche Modeling. Am. J. Trop. Med. Hyg. 2007, 77, 1103–1110. [Google Scholar] [CrossRef] [Green Version]
- Deka, M.A.; Heukelbach, J. Distribution of Tungiasis in Latin America: Identification of Areas for Potential Disease Transmission Using an Ecological Niche Model. Lancet Reg. Health-Am. 2021, 5, 100080. [Google Scholar] [CrossRef]
- Elith, J.; Leathwick, J.R.; Hastie, T. A Working Guide to Boosted Regression Trees. J. Anim. Ecol. 2008, 77, 802–813. [Google Scholar] [CrossRef]
- Guisan, A.; Edwards Jr, T.C.; Hastie, T. Generalized Linear and Generalized Additive Models in Studies of Species Distributions: Setting the Scene. Ecol. Model. 2002, 157, 89–100. [Google Scholar] [CrossRef] [Green Version]
- Breiman, L. Bagging Predictors. Mach. Learn. 1996, 24, 123–140. [Google Scholar] [CrossRef] [Green Version]
- Friedman, J.H. Multivariate Adaptive Regression Splines. Ann. Stat. 1991, 1–67. Available online: https://www.jstor.org/stable/2241837 (accessed on 2 November 2021). [CrossRef]
- Allouche, O.; Tsoar, A.; Kadmon, R. Assessing the Accuracy of Species Distribution Models: Prevalence, Kappa and the True Skill Statistic (TSS). J. Appl. Ecol. 2006, 43, 1223–1232. [Google Scholar] [CrossRef]
- Gama, M.; Crespo, D.; Dolbeth, M.; Anastácio, P. Predicting Global Habitat Suitability for Corbicula Fluminea Using Species Distribution Models: The Importance of Different Environmental Datasets. Ecol. Model. 2016, 319, 163–169. [Google Scholar] [CrossRef] [Green Version]
- Deka, M.A. Mapping the Geographic Distribution of Tungiasis in Sub-Saharan Africa. Trop. Med. Infect. Dis. 2020, 5, 122. [Google Scholar] [CrossRef]
- Alaniz, A.J.; Bacigalupo, A.; Cattan, P.E. Spatial Quantification of the World Population Potentially Exposed to Zika Virus. Int. J. Epidemiol. 2017, 46, 966–975. [Google Scholar] [CrossRef]
- Alaniz, A.J.; Carvajal, J.G.; Carvajal, M.A.; Cogliati, M.; Vergara, P.M. Spatial Quantification of the Population Exposed to Cryptococcus Neoformans and Cryptococcus Gattii Species Complexes in Europe: Estimating the Immunocompetent and HIV/AIDS Patients under Risk. Risk Anal. 2020, 40, 524–533. [Google Scholar] [CrossRef]
- Kirby, R.S.; Delmelle, E.; Eberth, J.M. Advances in Spatial Epidemiology and Geographic Information Systems. Ann. Epidemiol. 2017, 27, 1–9. [Google Scholar] [CrossRef]
- Fletcher-Lartey, S.M.; Caprarelli, G. Application of GIS Technology in Public Health: Successes and Challenges. Parasitology 2016, 143, 401–415. [Google Scholar] [CrossRef]
- Brooker, S.J.; Smith, J.L. Mapping Neglected Tropical Diseases: A Global View. Community Eye Health 2013, 26, 32. [Google Scholar]
- Phillips, D.A.; Ferreira, J.A.; Ansah, D.; Teixeira, H.S.; Kitron, U.; de Filippis, T.; de Alcântara, M.H.; Fairley, J.K. A Tale of Two Neglected Tropical Infections: Using GIS to Assess the Spatial and Temporal Overlap of Schistosomiasis and Leprosy in a Region of Minas Gerais, Brazil. Memórias Inst. Oswaldo Cruz 2017, 112, 275–280. [Google Scholar] [CrossRef]
- Menghistu, H.T.; Mersha, T.T.; Shumuye, N.A.; Woldie, B.M.; Redda, Y.T.; Hadush, B.; Mohammed, A.H. Neglected Tropical Zoonotic Diseases in Tigray Region, Northern Ethiopia: Spatial Distribution and Trend Analysis of Rabies, Tuberculosis, Schistosomiasis, and Visceral Leishmaniasis in Humans. Zoonoses Public Health 2021, 68, 823–833. [Google Scholar] [CrossRef]
- Gething, P.W.; Patil, A.P.; Smith, D.L.; Guerra, C.A.; Elyazar, I.R.; Johnston, G.L.; Tatem, A.J.; Hay, S.I. A New World Malaria Map: Plasmodium Falciparum Endemicity in 2010. Malar. J. 2011, 10, 1–16. [Google Scholar] [CrossRef] [PubMed] [Green Version]
- Osgood-Zimmerman, A.; Millear, A.I.; Stubbs, R.W.; Shields, C.; Pickering, B.V.; Earl, L.; Graetz, N.; Kinyoki, D.K.; Ray, S.E.; Bhatt, S. Mapping Child Growth Failure in Africa between 2000 and 2015. Nature 2018, 555, 41–47. [Google Scholar]
- Reich, B.J.; Haran, M. Precision Maps for Public Health. 2018. Available online: https://www.nature.com/articles/d41586-018-02096-w (accessed on 12 November 2021).
- Carvajal, J.G.; Alaniz, A.J.; Carvajal, M.A.; Acheson, E.S.; Cruz, R.; Vergara, P.M.; Cogliati, M. Expansion of the Emerging Fungal Pathogen Cryptococcus Bacillisporus into America: Linking Phylogenetic Origin, Geographical Spread and Population under Exposure Risk. Front. Microbiol. 2020, 11, 2117. [Google Scholar] [CrossRef] [PubMed]
- Clements, A.C.; Lwambo, N.J.; Blair, L.; Nyandindi, U.; Kaatano, G.; Kinung’hi, S.; Webster, J.P.; Fenwick, A.; Brooker, S. Bayesian Spatial Analysis and Disease Mapping: Tools to Enhance Planning and Implementation of a Schistosomiasis Control Programme in Tanzania. Trop. Med. Int. Health 2006, 11, 490–503. [Google Scholar] [CrossRef] [Green Version]
- Van, G.; Onasanya, A.; Van Engelen, J.; Oladepo, O.; Diehl, J.C. Improving Access to Diagnostics for Schistosomiasis Case Management in Oyo State, Nigeria: Barriers and Opportunities. Diagnostics 2020, 10, 328. [Google Scholar] [CrossRef] [PubMed]
- Kloos, H.; Correa-Oliveira, R.; Quites, H.F.O.; Souza, M.C.C.; Gazzinelli, A. Socioeconomic Studies of Schistosomiasis in Brazil: A Review. Acta Tropica 2008, 108, 194–201. [Google Scholar] [CrossRef] [Green Version]
- Leonardo, L.R.; Rivera, P.; Crisostomo, B.; Sarol, J.; Bantayan, N.; Tiu, W.; Bergquist, N. A Study of the Environmental Determinants of Malaria and Schistosomiasis in the Philippines Using Remote Sensing and Geographic Information Systems. Parassitologia 2005, 47, 105–114. [Google Scholar]
- Coelho, P.R.; Ker, F.T.; Araújo, A.D.; Guimarães, R.; Negrão-Corrêa, D.A.; Caldeira, R.L.; Geiger, S.M. Identification of Risk Areas for Intestinal Schistosomiasis, Based on Malacological and Environmental Data and on Reported Human Cases. Front. Med. 2021, 1288. Available online: https://www.frontiersin.org/articles/10.3389/fmed.2021.642348/full (accessed on 2 November 2021). [CrossRef]
- Shiff, C.J. Studies on Bulinus (Physopsis) Globosus in Rhodesia: I.—The Influence of Temperature on the Intrinsic Rate of Natural Increase. Ann. Trop. Med. Parasitol. 1964, 58, 94–105. [Google Scholar] [CrossRef]
- Kalinda, C.; Chimbari, M.; Mukaratirwa, S. Implications of Changing Temperatures on the Growth, Fecundity and Survival of Intermediate Host Snails of Schistosomiasis: A Systematic Review. Int. J. Environ. Res. Public Health 2017, 14, 80. [Google Scholar] [CrossRef] [Green Version]
- Marks, F.; Rabehanta, N.; Baker, S.; Panzner, U.; Park, S.E.; Fobil, J.N.; Meyer, C.G.; Rakotozandrindrainy, R. A Way Forward for Healthcare in Madagascar? Clin. Infect. 2016, 62, S76–S79. [Google Scholar] [CrossRef] [Green Version]
- Garchitorena, A.; Miller, A.C.; Cordier, L.F.; Ramananjato, R.; Rabeza, V.R.; Murray, M.; Cripps, A.; Hall, L.; Farmer, P.; Rich, M. In Madagascar, Use of Health Care Services Increased When Fees Were Removed: Lessons for Universal Health Coverage. Health Aff. 2017, 36, 1443–1451. [Google Scholar] [CrossRef]
- Ciddio, M.; Mari, L.; Sokolow, S.H.; De Leo, G.A.; Casagrandi, R.; Gatto, M. The Spatial Spread of Schistosomiasis: A Multidimensional Network Model Applied to Saint-Louis Region, Senegal. Adv. Water Resour. 2017, 108, 406–415. [Google Scholar] [CrossRef] [PubMed] [Green Version]
- Stensgaard, A.-S.; Vounatsou, P.; Sengupta, M.E.; Utzinger, J. Schistosomes, Snails and Climate Change: Current Trends and Future Expectations. Acta Trop. 2019, 190, 257–268. [Google Scholar] [CrossRef] [PubMed]
- McCreesh, N.; Nikulin, G.; Booth, M. Predicting the Effects of Climate Change on Schistosoma Mansoni Transmission in Eastern Africa. Parasites Vectors 2015, 8, 1–9. [Google Scholar] [CrossRef] [PubMed] [Green Version]
- De Leo, G.A.; Stensgaard, A.-S.; Sokolow, S.H.; N’Goran, E.K.; Chamberlin, A.J.; Yang, G.-J.; Utzinger, J. Schistosomiasis and Climate Change. BMJ 2020, 371, m432. [Google Scholar] [CrossRef]
- Adekiya, T.A.; Aruleba, R.T.; Oyinloye, B.E.; Okosun, K.O.; Kappo, A.P. The Effect of Climate Change and the Snail-Schistosome Cycle in Transmission and Bio-Control of Schistosomiasis in Sub-Saharan Africa. Int. J. Environ. Res. Public Health 2020, 17, 181. [Google Scholar] [CrossRef] [PubMed] [Green Version]
- In Madagascar, Famine Affects More than a Million People. Available online: https://www.mediapart.fr/journal/international/080721/madagascar-la-famine-touche-plus-d-un-million-de-personnes?onglet=full (accessed on 26 November 2021).
- Madagascar Is Hit by the World’s First Climate Change Famine. Available online: https://www.trtworld.com/magazine/madagascar-is-hit-by-the-world-s-first-climate-change-famine-49491 (accessed on 26 November 2021).
- Brinkmann, U.; Korte, R.; Schmidt-Ehry, B. The Distribution and Spread of Schistosomiasis in Relation to Water Resources Development in Mali. Trop. Med. Parasitol. Off. Organ Dtsch. Trop. Ges. Dtsch. Ges. Fur Tech. Zs. 1988, 39, 182–185. [Google Scholar]
- Barbet-Massin, M.; Jiguet, F.; Albert, C.H.; Thuiller, W. Selecting Pseudo-absences for Species Distribution Models: How, Where and How Many? Methods Ecol. Evol. 2012, 3, 327–338. [Google Scholar] [CrossRef]


| Variable | Included in Model | Source | Resolution | Unit | Average |
|---|---|---|---|---|---|
| BIO1–Annual Mean Temperature | Yes | WorldClim (v.2.1) | ~1 km | °C | 23.18 |
| BIO2–Mean Diurnal Range | No | WorldClim (v.2.1) | ~1 km | °C | 11.93 |
| BIO3–Isothermality | Yes | WorldClim (v.2.1) | ~1 km | °C | 65.13 |
| BIO4–Temperature Seasonality | Yes | WorldClim (v.2.1) | ~1 km | °C | 232.32 |
| BIO5–Max Temperature of Warmest Month | No | WorldClim (v.2.1) | ~1 km | °C | 31.46 |
| BIO6–Min Temperature of Coldest Month | No | WorldClim (v.2.1) | ~1 km | °C | 13.12 |
| BIO7–Temperature Annual Range | WorldClim (v.2.1) | ~1 km | °C | 18.33 | |
| BIO8–Mean Temperature of Wettest Quarter | No * | WorldClim (v.2.1) | ~1 km | °C | - |
| BIO9–Mean Temperature of Driest Quarter | No * | WorldClim (v.2.1) | ~1 km | °C | - |
| BIO10–Mean Temperature of Warmest Quarter | No | WorldClim (v.2.1) | ~1 km | °C | 25.49 |
| BIO11–Mean Temperature of Coldest Quarter | No | WorldClim (v.2.1) | ~1 km | °C | 19.98 |
| BIO12–Annual Precipitation | Yes | WorldClim (v.2.1) | ~1 km | mm | 1371.61 |
| BIO13–Precipitation of Wettest Month | No | WorldClim (v.2.1) | ~1 km | mm | 310.46 |
| BIO14–Precipitation of Driest Month | No | WorldClim (v.2.1) | ~1 km | mm | 18.59 |
| BIO15–Precipitation Seasonality | Yes | WorldClim (v.2.1) | ~1 km | mm | 100.13 |
| BIO16–Precipitation of Wettest Quarter | No | WorldClim (v.2.1) | ~1 km | mm | 808.67 |
| BIO17–Precipitation of Driest Quarter | No | WorldClim (v.2.1) | ~1 km | mm | 68.88 |
| BIO18–Precipitation of Warmest Quarter | No * | WorldClim (v.2.1) | ~1 km | mm | - |
| BIO19–Precipitation of Coldest Quarter | No * | WorldClim (v.2.1) | ~1 km | mm | - |
| Clay Content | Yes | SoilGrids | ~1 km | g/100 g | 23.68 |
| Silt Content | Yes | SoilGrids | ~1 km | g/100 g | 15.84 |
| Sand Content | No | SoilGrids | ~1 km | g/100 g | 60.80 |
| Elevation | No | EarthEnv | ~1 km | meters | 465.11 |
| Enhanced Vegetation Index (EVI) | Yes | WorldGrids | ~1 km | 0–6 | 2.96 |
| Land Surface Temperature (LST) | Yes | WorldGrids | ~1 km | °C | 29.93 |
| Distance to Water | Yes | DIV-GIS | ~1 km | meters | 2515.57 |
| Accessibility to Cities | Yes | Malaria Atlas Project | ~1 km | time | 338.04 |
| Nighttime Lights | Yes | NOAA | ~1 km | 1–63 | 5.97 |
Publisher’s Note: MDPI stays neutral with regard to jurisdictional claims in published maps and institutional affiliations. |
© 2022 by the author. Licensee MDPI, Basel, Switzerland. This article is an open access article distributed under the terms and conditions of the Creative Commons Attribution (CC BY) license (https://creativecommons.org/licenses/by/4.0/).
Share and Cite
Deka, M.A. Predictive Risk Mapping of Schistosomiasis in Madagascar Using Ecological Niche Modeling and Precision Mapping. Trop. Med. Infect. Dis. 2022, 7, 15. https://doi.org/10.3390/tropicalmed7020015
Deka MA. Predictive Risk Mapping of Schistosomiasis in Madagascar Using Ecological Niche Modeling and Precision Mapping. Tropical Medicine and Infectious Disease. 2022; 7(2):15. https://doi.org/10.3390/tropicalmed7020015
Chicago/Turabian StyleDeka, Mark A. 2022. "Predictive Risk Mapping of Schistosomiasis in Madagascar Using Ecological Niche Modeling and Precision Mapping" Tropical Medicine and Infectious Disease 7, no. 2: 15. https://doi.org/10.3390/tropicalmed7020015
APA StyleDeka, M. A. (2022). Predictive Risk Mapping of Schistosomiasis in Madagascar Using Ecological Niche Modeling and Precision Mapping. Tropical Medicine and Infectious Disease, 7(2), 15. https://doi.org/10.3390/tropicalmed7020015