Article

Different In Vitro Drug Susceptibility Profile of Plasmodium falciparum Isolates from Two Adjacent Areas of Northeast Myanmar and Molecular Markers for Drug Resistance

1
Department of Pathogen Biology and Immunology, Kunming Medical University, Kunming 650500, China
2
Department of Pathology, Kunming Medical University, Kunming 650500, China
3
Department of Internal Medicine, Morsani College of Medicine, University of South Florida, 3720 Spectrum Boulevard, Suite 304, Tampa, FL 33612, USA
4
Myanmar Health Network Organization, Yangon 11181, Myanmar
*
Authors to whom correspondence should be addressed.
These authors contributed equally to this work.
Trop. Med. Infect. Dis. 2022, 7(12), 442; https://doi.org/10.3390/tropicalmed7120442
Submission received: 29 November 2022 / Revised: 10 December 2022 / Accepted: 14 December 2022 / Published: 17 December 2022
(This article belongs to the Special Issue Advances in Malaria Treatment and Prevention)

Abstract

:
The Greater Mekong Subregion (GMS) is the epicenter of antimalarial drug resistance. We determined in vitro susceptibilities to 11 drugs of culture-adapted Plasmodium falciparum isolates from adjacent areas (Laiza and Muse) along the China–Myanmar border. Parasites from this region were highly resistant to chloroquine and pyrimethamine but relatively sensitive to other antimalarial drugs. Consistently, the Dd2-like pfcrt mutations were fixed or almost fixed in both parasite populations, and new mutations mediating piperaquine resistance were not identified. Similarly, several mutations related to pfdhfr and pfdhps were also highly prevalent. Despite their geographical proximity, malaria parasites from Laiza showed significantly higher in vitro resistance to artemisinin derivatives, naphthoquine, pyronaridine, lumefantrine, and pyrimethamine than parasites from Muse. Likewise, the pfdhfr N51I, pfdhps A581G, pfmrp1 H785N, and pfk13 F446I mutations were significantly more frequent in Laiza than in Muse (p < 0.05). For the pfmdr1 mutations, Y184F was found only in Laiza (70%), whereas F1226Y was identified only in Muse (31.8%). Parasite isolates from Laiza showed a median RSA value of 5.0%, significantly higher than the 2.4% in Muse. Altogether, P. falciparum parasite populations from neighboring regions in the GMS may diverge substantially in their resistance to several antimalarial drugs. This information about different parasite populations will guide antimalarial treatment policies to effectively manage drug resistance during malaria elimination.

1. Introduction

The Greater Mekong Subregion (GMS) refers to six countries and regions in the Mekong River Basin, including Cambodia, Vietnam, Laos, Myanmar, Thailand, and China’s Yunnan and Guangxi provinces. China achieved the goal of malaria elimination in 2021, while the rest of the countries are trying to eliminate malaria by 2030 [1,2,3]. Myanmar has the highest malaria burden among the GMS countries [4]. Political instability and military conflict in Myanmar have driven hundreds of thousands of citizens into resettlement camps along its border, where malaria transmission is high [5]. While the camps’ poor sanitation and makeshift structures are conducive to malaria transmission, massive population movements to these camps have also contributed to malaria introduction [6]. Furthermore, intensive malaria transmission at the borders also poses a major threat to malaria introduction to neighboring countries [7]. Therefore, malaria surveillance, a core intervention promoted by the World Health Organization’s Global Technical Strategy for Malaria 2016–2030, must be strengthened to prevent the cross-border spread of malaria.
The GMS is a breeding ground for multidrug-resistant Plasmodium falciparum, which has developed resistance to almost all commonly used antimalarials [8]. Due to the difference in the adoption of drug policies, the epidemiological backgrounds of P. falciparum and P. vivax malaria, the public health infrastructure, and accessibility to treatment in the GMS countries, drug resistance exhibits considerable geographical variations. Even P. falciparum populations from closely located transmission “pockets” separated by malaria-free zones can display distinct resistance phenotypes [9]. This geographical difference highlights the necessity of resistance surveillance and management in multiple sentinel sites of malaria endemicity.
The Laiza town of Kachin State is in northeastern Myanmar and borders China. Throughout Myanmar’s history, this region has been relatively independent and has had little communication with the central government. Therefore, it has adopted a malaria prevention and treatment policy similar to that in China. Per local government policy, dihydroartemisinin–piperaquine (DHA-PPQ) has been used as the major artemisinin-based combination therapy (ACT) to treat falciparum malaria [10]. In addition, other antimalarial drugs, such as naphthoquine (NQ) and pyronaridine (PND), were also available for malaria treatment in the private sector. Muse is a border city of Shan State, Myanmar, 125 km south of Laiza. In recent years, economic trade between China and Myanmar has increased population movement to this region. As a result, malaria in this area is more migration-related. Malaria treatment here follows Myanmar’s antimalarial treatment policy [11], with artemether–lumefantrine designated as the first-line therapy for uncomplicated P. falciparum malaria [12]. Since we have installed malaria surveillance in these border areas, we were interested in determining whether P. falciparum parasites collected from the two border areas represent different parasite populations. After adapting clinical parasites to long-term in vitro culture, we profiled their in vitro susceptibilities to a panel of antimalarials and genotyped their drug resistance genes. This study revealed significant differences in drug resistance between these parasite populations, even though they were collected from two adjacent regions, emphasizing the importance of monitoring the sources of parasites at the ports of introduction.

2. Materials and Methods

2.1. Parasite Sample Collection

Clinical isolates of P. falciparum were collected in 2013 from two border areas of eastern Myanmar, Laiza and Muse, as part of cross-border malaria surveillance, control, and resistance monitoring efforts in western Yunnan province, China (Figure S1). Malaria was diagnosed by microscopy of Giemsa-stained blood smears from patients presenting to local clinics. After obtaining written informed consent or assent for minors, 2–5 mL of venous blood were drawn from patients with uncomplicated P. falciparum malaria. Blood samples were cryogenically stored in liquid nitrogen and subsequently adapted to long-term in vitro culture. The study protocol was approved by the Institutional Review Boards of local health bureaus and Kunming Medical University (Protocol code: IRB #KMC2011-01).

2.2. Parasite Culture and Drug Assays

Monoclonal infections were identified by genotyping three polymorphic genes pfmsp1, pfmsp2, and pfglurp, and were culture-adapted and used for in vitro drug assay and genotyping [13]. Frozen samples were thawed in solutions of NaCl and glucose. P. falciparum parasite isolates were cultured in RPMI 1640 culture medium with 6% human AB serum, supplemented with 0.5% Albumax II. Plasmodium isolates were cultured at 37 °C with type O+ human red blood cells (RBCs) under gas conditions of 3% O2, 5% CO2, and 92% N2 [14]. When the parasitemia reached ≥1% of the ring stage, the culture was synchronized with 5% sorbitol and diluted to 2% hematocrit and 0.5% parasitemia. Susceptibilities of the isolates to 11 antimalarial drugs, chloroquine (CQ), PPQ, mefloquine (MFQ), NQ, pyrimethamine (PY), artesunate (AS), DHA, artemether (AM), quinine (QN), lumefantrine (LMF), and PND, were determined using the SYBR Green Ⅰfluorimetric assay [15]. CQ, MFQ, QN, and PY were purchased from Sigma (St. Louis, MO, USA). PPQ was from Chongqing Kangle Pharmaceutical Co. (Chongqing, China), PND was from China Institute of Pharmaceutical and Biological Products (Beijing, China), and NQ, LMF, AS, and DHA were from Kunming Pharmaceutical Co. (Kunming, Yunnan, China). Stock solutions of CQ (3.75 μM), NQ (256 nM), PND (160 nM), and PPQ (320 nM) were prepared in distilled water. MFQ (256 nM), QN (10.24 μM), LMF (800 nM), AS, DHA, and AM (1.5 μM) were formulated in ethanol and PY in 1% acetic acid. Drugs were serially diluted and assayed in 96-well plates. Each drug concentration was assayed with three technical replicates and two biological replicates, while the 3D7 strain was included in each assay as an internal control.

2.3. Ring Survival Assay (RSA)

The RSA was performed as previously described [16,17,18]. Briefly, highly synchronous parasite cultures at the young ring stage (0–3h) were exposed to 700 nM DHA or 0.1% dimethyl sulfoxide (DMSO) as the control for 6 h. The drug was then washed off with RPMI 1640, and parasites were cultivated further for 66 h under standard in vitro culture conditions. At 72h after the assay initiation, survival rates were calculated in Giemsa-stained thin smears by counting the viable parasites surviving in DHA-treated versus DMSO-treated cultures. Parasite isolates demonstrating >1% survival were considered to display reduced susceptibility (or partial resistance) to artemisinin (ART) [19].

2.4. Sequencing of Genes Associated with Drug Resistance

Plasmodium DNA was extracted using the Roche High Pure PCR Template Preparation Kit. Polymorphisms in drug resistance genes were determined by PCR and sequencing. Included in the analysis are two pfcrt fragments covering codons 72 to 76, 220 and 356 [20]; a pfdhfr fragment covering codons 51, 59, 108, and 164; two pfdhps fragments covering sites 436, 540, 581; two pfmdr1 fragments covering codons 86, 130, 184, 1034, 1042, and 1226; and a pfmrp1 fragment covering codons 191, 325, 437, 785, 876, 1007, and 1390; the pfnhe1 fragment containing the ms4760 minisatellite; and the complete sequences of the pfk13 gene as previously reported [21,22,23]. To determine the copy numbers of the pfmdr1 and plasmepsin2/3 genes, real-time PCR was performed using the DBI Bestar qPCR Master Mix (SYBR Green) in Quant Studio 6 Flex (Life technologies). The β-tubulin gene was used as an internal reference gene for normalization. Each sample was analyzed in three replicates. The amplification efficiency of these genes was determined using 3D7 as the calibration sample, and the pfmdr1 gene in Dd2 was used as a multicopy control.

2.5. Statistical Analyses

Statistical analysis was performed using Graphpad Prism 6.0 for windows. The geometric mean of the half-maximal inhibitory concentration (IC50s) was calculated by curve fitting. Mann–Whitney U test was used to compare between two groups. The IC50 values and RSA of the clinical isolates were compared with those of the 3D7 strain using the Wilcoxon matched-pairs signed-rank test. A Chi-square test was used to compare the prevalence of the genetic variants between the two regions. Correlations between the IC50s of drugs were determined using Spearman’s test in the R package. Correlations between the RSA and drugs were determined using Spearman’s test.

3. Results

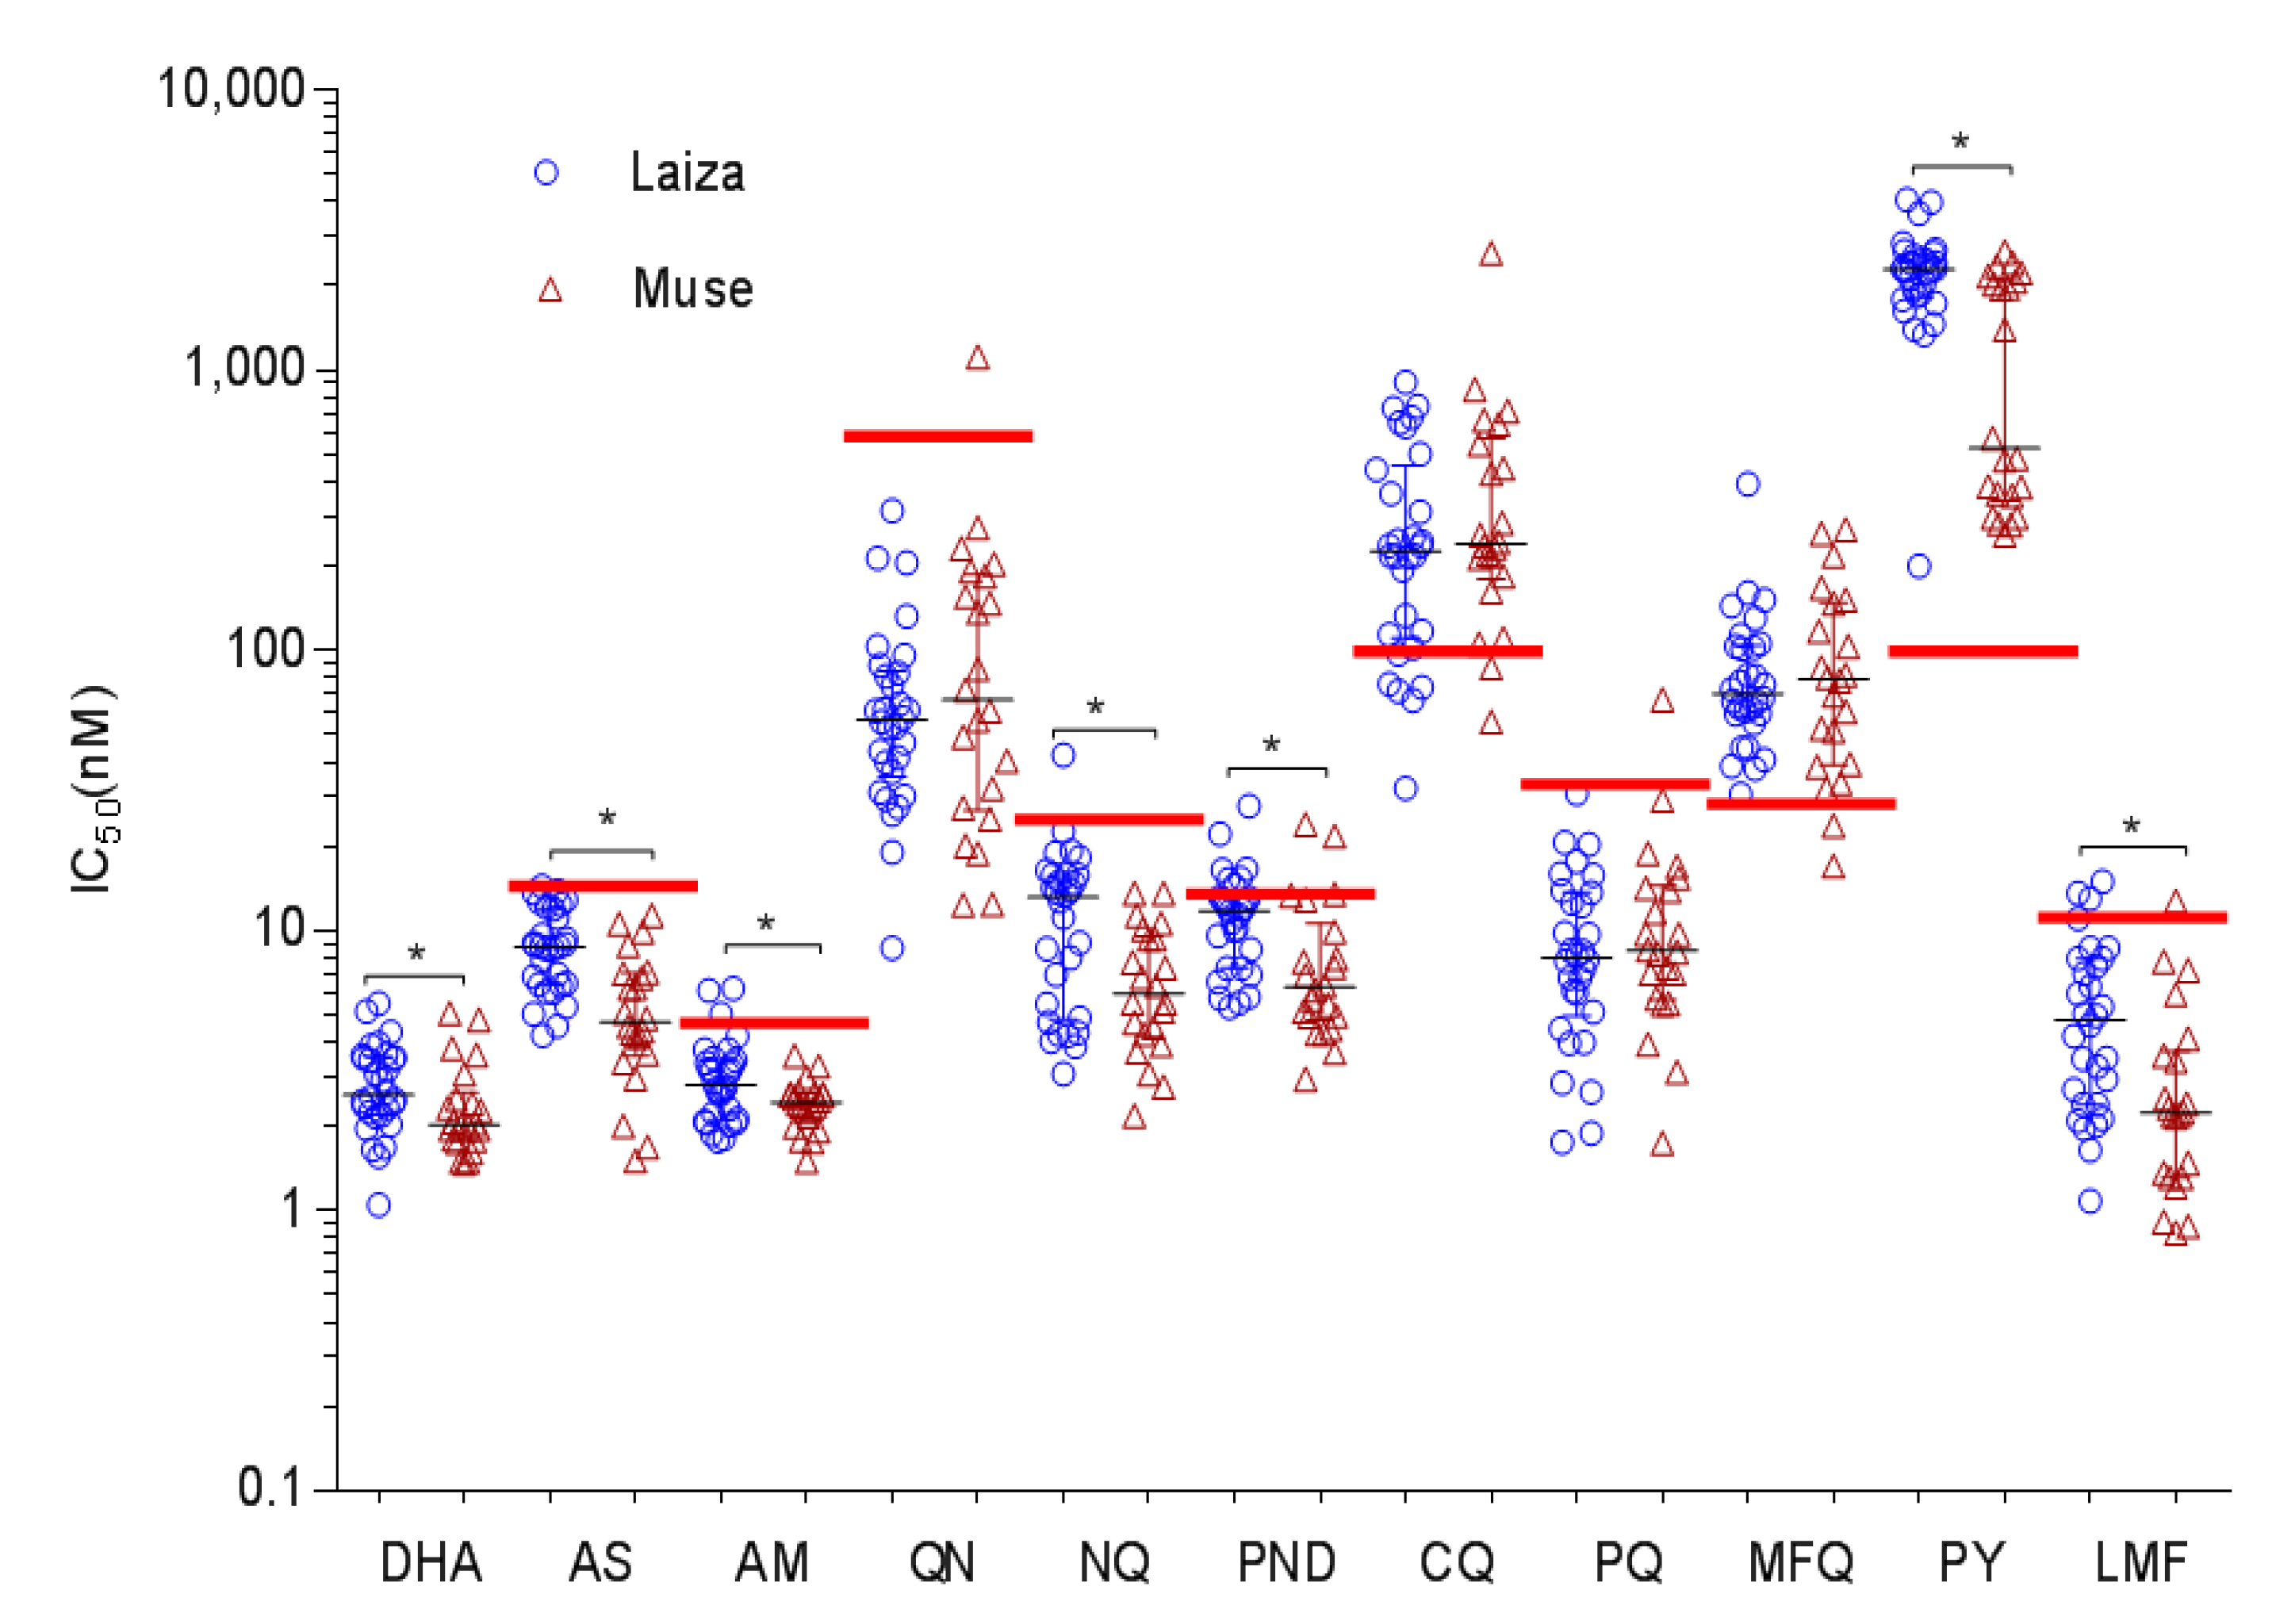
3.1. In Vitro Drug Susceptibilities of P. falciparum from the China–Myanmar Border

We collected and cultured 52 monoclonal P.falciparum isolates near Laiza (30 isolates) and Muse (22 isolates), two major border checkpoints at the China–Myanmar border. In vitro susceptibilities to 11 antimalarial drugs of 52 parasite isolates and the laboratory clone 3D7 were tested using the 72 h SYBR Green I assay and RSA (Table 1, Table S1). Overall, the field parasite isolates had significantly higher IC50 values than 3D7 for almost all drugs (p < 0.05, Mann–Whitney U test) (Table 1), except for QN, LMF, and PND. For CQ, 85% of the parasites were resistant, with IC50 values higher than the 100 nM cutoff value (Figure 1) [24]. For MFQ, 96% of parasite isolates were considered resistant with IC50 above the 30 nM cutoff value proposed in an earlier study [24]. The median IC50 of QN was significantly lower than the cutoff value of 600 nM, as proposed earlier [24], with 2% of the isolates exceeding this value. For PND, 15% of isolates had higher IC50 values than the cutoff value of 15 nM, as proposed earlier [25]. Given that there were no threshold values defined for resistance to LMF, NQ, PPQ, AS, and AM, we used the mean + 2 standard deviations (SD) as arbitrary cutoff values for potential resistance [26]. For LMF, 8% isolates had higher IC50 values above 11.8 nM. For AM, 6%of isolates had higher IC50 values above 4.7nM. For NQ, PPQ, and AS, 2% of isolates had higher IC50 values than the cutoff values (Figure 1). For the antifolate drug PY, IC50 ≤ 100 nM, 100 < IC50 ≤ 2000 nM, and IC50 ≥ 2000 nM were classified as sensitive, moderately resistant, and highly resistant, respectively [24,27]. According to this classification scheme, 52% of isolates were considered highly resistant to PY (IC50s ≥ 2000 nM), and 48% of isolates tested were considered moderately resistant to PY (100 < IC50 ≤ 2000 nM) (Figure 1). Although the parasites were relatively susceptible to most of the drugs tested, the IC50 values of individual parasite isolates varied widely. For example, the IC50 values between the least and most susceptible isolates differed by 38-fold for PPQ, ~19-fold for NQ and LMF, 23-fold for MFQ, and >127-fold for QN (Table 1). These results indicated the existence of parasite isolates with substantially reduced susceptibility to many antimalarial drugs, although clinical resistance was not clear. RSA values of the 52 clinical isolates were significantly higher than that for 3D7 (Table 1). The range of the RSA values for the field isolates was relatively wide (0–14.7%). Using 1% RSA value as the cutoff value for partial ART resistance, 49 (94%) parasite isolates had RSA values greater than 1%.

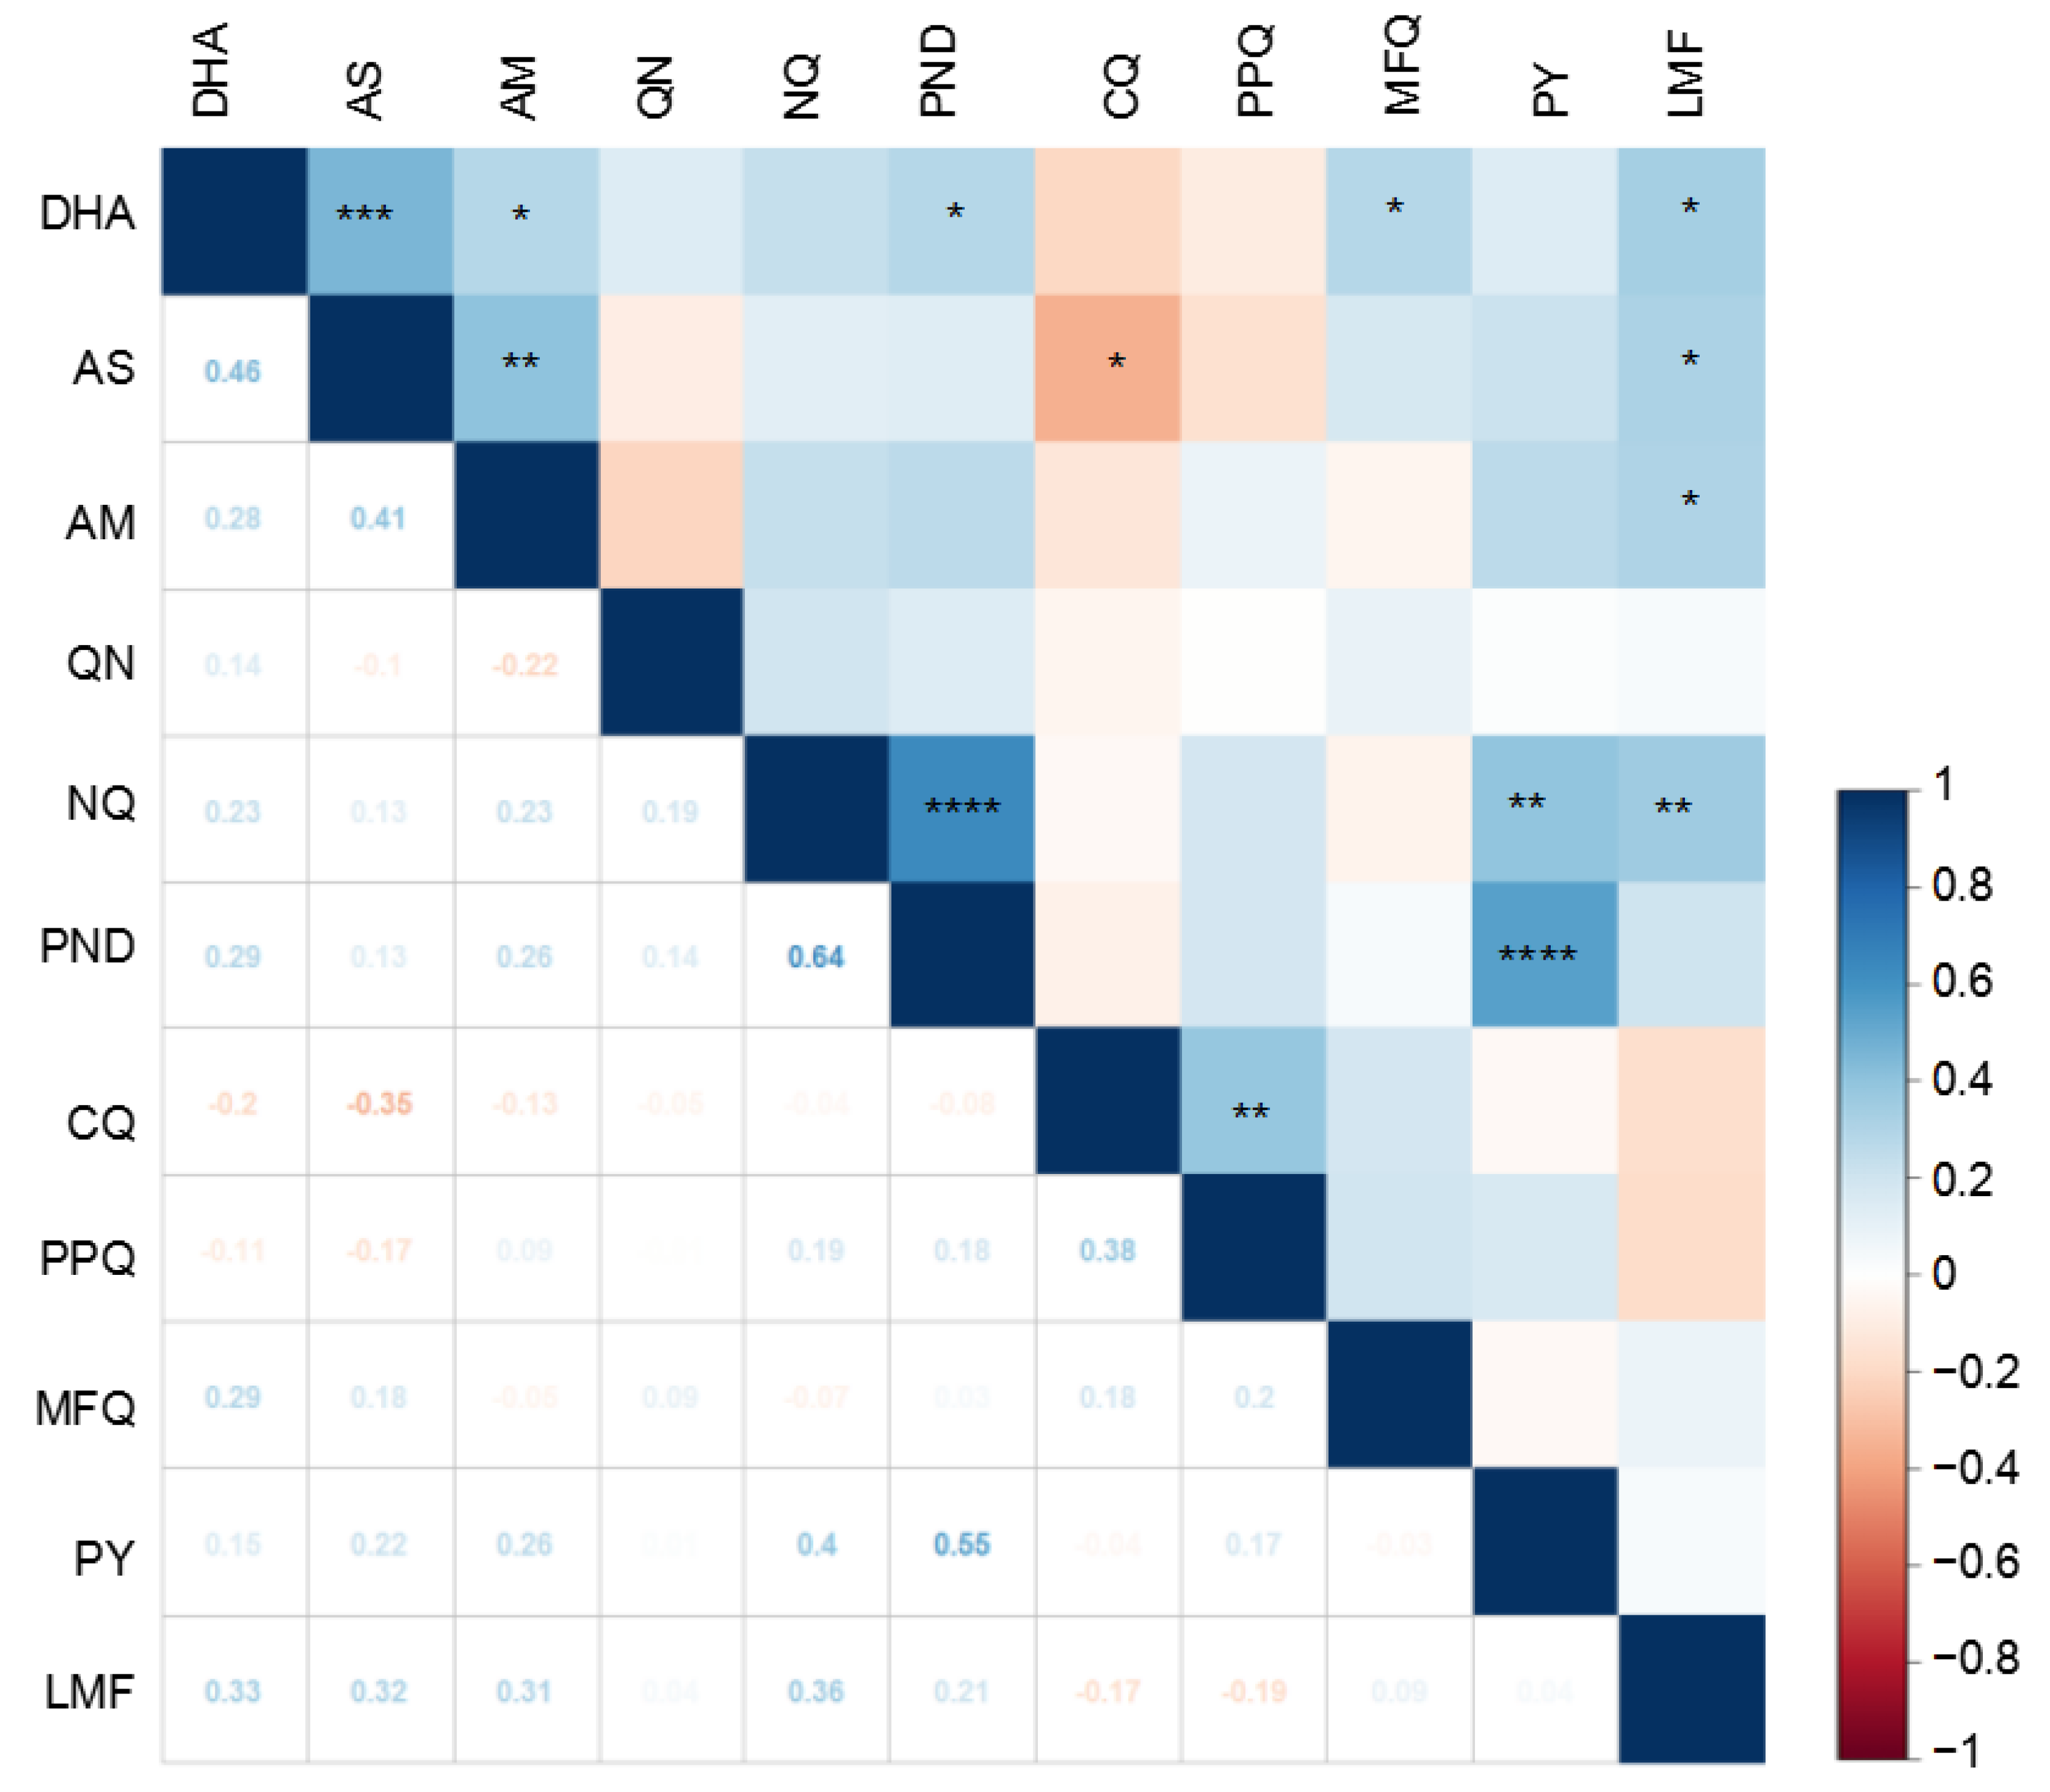
3.2. Correlations between Susceptibilities to Different Drugs

Consistent with a similar mode of action for the ART derivatives, the susceptibilities of the parasites to DHA, AS, and AM were positively correlated (p < 0.05) (Figure 2). Interestingly, the pairwise comparison revealed a significant positive correlation between PND and NQ or PY (p < 0.0001, Spearman’s test). As we found in an earlier study [28], parasites from eastern Myanmar showed a significant positive correlation between the two 4-aminoquinoline drugs, CQ and PPQ (p < 0.01, Spearman’s test). In addition, there was a weak, positive correlation between DHA and PND or MFQ (p < 0.05). Susceptibility to LMF was also weakly correlated with those of the three ART derivatives (p < 0.05). Furthermore, there was a moderate, positive correlation between NQ and PY or LMF (p < 0.01). Finally, the only significant negative correlation was identified between CQ and AS (p < 0.05). Pairwise comparison between the RSA and IC50 values for both AS and DHA showed no significant correlation (p > 0.05, Spearman’s correlation test) (Figure S2), except for AM (p < 0.05, Spearman’s correlation test), further indicating that the two assays measured different resistance phenotypes (Figure S2).

3.3. Polymorphisms in Genes Associated with Drug Resistance

We sequenced seven genes related to drug resistance (pfdhfr, pfdhps, pfcrt, pfmdr1, pfmrp1, pfnhe1, and pfk13) in all isolates and identified mutations by sequence alignment with 3D7. We performed statistical analysis to determine whether certain pfk13 mutations were associated with the RSA phenotypes.
Pfdhfr and pfdhps. The three mutations C59R, S108N, and I164L in pfdhfr mediating resistance to PY were fixed or approached fixation in the parasite population (Table 2). The N51Imutation also reached a high prevalence of 73.1%. Parasites carrying quadruple mutations (IRNL) reached 73.1%, suggesting high resistance to PY (Table 3). Consistent with the fact that the pfdhfr mutations mediate resistance to PY, both the N51I and I164L mutations were associated with significantly elevated in vitro IC50s to PY (Figure S3). Similarly, parasites carrying the quadruple mutations IRNL were also significantly more resistant to PY than those with triple (NRNL) or double mutations (NRNI) (Figure S3). In pfdhps, K540E/N was nearly fixed, while two other mutations, S436A and A581G, reached relatively high levels (>48%). Parasites carrying double mutations for these three positions accounted for 90.4% (Table 3).
Pfcrt. Consistent with widespread resistance to CQ in the GMS, the M74I, N75E, K76T, A220S, and I356T mutations were all fixed or approached fixation in the parasite populations. However, while parasites collected before 2013 were all wild-type at C72 [29], ~20% of parasites collected in 2013 carried the C72S mutation. As a result, the pfcrt CVIET haplotype (positions 72 to 76) decreased to 79% in 2013. Interestingly, although the C72S mutation did not change the parasites’ susceptibility to CQ, the SIETS haplotype showed significantly increased susceptibility to LMF and NQ but significantly decreased susceptibility to QN (p < 0.05, Mann–Whitney U test) (Figure S4).
Pfmdr1. We detected six mutations in the pfmdr1 gene (occurring at 2–40%). Y184F was the most frequent (40%), followed by F1226Y (14%) (Table 2). The N86Y mutation was relatively rare (1.9%). For the two most frequent mutations, Y184F was associated with increased in vitro resistance to LMF, AS, and MFQ, while F1226Y was related to increased susceptibility to PND and NQ (p < 0.05, Mann–Whitney U test) (Figure S5). The two most abundant pfmdr1 haplotypes were the wild-type (36.5%) and NEFSNF with a single Y184F mutation (40.4%). Using real-time PCR and Dd2 parasite as a multicopy pfmdr1 reference, we found that all Plasmodium isolates had single-copy pfmdr1 (data not shown).
Pfmrp1. Seven mutations were detected in pfmrp1 with frequencies ranging from 5.8% to 90.4%. Five mutations, H191Y, S437A, H785N, I876V, and T1007M, had >60% prevalence in the parasite population (Table 2). The correlation between pfmrp1 mutations and in vitro drug susceptibilities is complex. Of the eight mutations associated with altered drug responses, three correlated with reduced susceptibility. The H191Y and S437A mutations were associated with increased in vitro resistance to MFQ, while N325S was correlated with increased resistance to PPQ. While the I876V mutation was associated with increased susceptibility to PND, NQ, and PPQ, F1390I was correlated with increased sensitivity to the ART drugs DHA and AS. In addition, H785N and T1007M were associated with increased susceptibility to PPQ (Figure S6). Parasites carrying quintuple mutations YNANVMF reached almost 70% (Table 3), and this haplotype showed a much higher IC50 value for MFQ than the wild-type HNSHITF (p < 0.05, Mann–Whitney U test, not shown).
Pfnhe1. The minisatellite ms4760 allelic variants in the pfnhe1 gene were associated with QN resistance in some Plasmodium populations [9,30]. Five variants were identified in the parasites (Table 3), three of which, MS-5 (40.4%), MS-7 (34.6%), and MS-6 (17.3%), accounted for more than 90% of the parasite population (Table 3). Whereas only the rare haplotype MS-3 of pfnhe1 was associated with increased resistance to QN, both MS-5 and MS-6 showed reduced susceptibility to AS and AM. MS-6 was also correlated with decreased susceptibility to PND (p < 0.05, Mann–Whitney U test, Figure S7).
Pfk13. Three pfk13 point mutations (K189T, F446I, and N458Y) were detected in the parasite samples, and two were located in the propeller domain (>440 amino acids). F446I remained the predominant mutation (63.5%), which was associated with reduced susceptibility to both DHA and AS (Figure S8). In addition, 88.5% of Plasmodium parasites contained the NN insertion in the N-terminal region between positions 137 and 142 (Table 2). Since mutations in the propeller domain of the K13 protein (>440 amino acids) were associated with clinical ART resistance [31], we classified 52 parasites into two groups based on the presence or absence of mutations in the propeller domain. Parasites with mutations in the propeller domain showed a median RSA value of 4.9%, significantly higher than the 2.1% in the K13 WT group (p < 0.05, Mann–Whitney U test, Figure S9a). The most common mutation, F446I (33 isolates), also showed significantly higher median RSA values of 4.9% (p < 0.05, Mann–Whitney U test, Figure S9b, Table S2) than the WT. We also found that parasites from Muse with the K189T mutation located outside the Kelch domain showed relatively high RSA values, with the median value being significantly higher than that of the WT isolates (p < 0.05, Mann–Whitney U test, Figure S9b, Table S2). Moreover, parasites from Muse with the N458Y mutation had a higher median RSA (5.0%) than parasites from the K13 WT group (2.1%), although the difference was not significant (p > 0.05, Mann–Whitney U test, Figure S9b, Table S2).

3.4. Multidrug Resistance Haplotypes

The clonality of the parasite isolates allows us to assess the multidrug resistance (MDR) haplotypes. We focused our attention on haplotypes of the following five genes with well-defined resistance to 4-aminoquinolines (pfcrt and pfmdr1), antifolate drugs (dhfr/dhps), and artemisinins (K13). This analysis revealed that >65.4% (34/52) of parasite isolates carried MDR haplotypes (pfcrt 76T, quintuple–sextuple mutations in dhfr/dhps, and K13 446I or 458Y) that would confer resistance to 4-aminoquinoline, antifolate, and artemisinin drugs (Figure S10). Fifteen (28.9%) isolates carried the pfcrt 76T and quintuple–sextuple mutations in dhfr/dhps but lacked K13 mutations, suggesting resistance to 4-aminoquinolines and antifolates. Only two parasites had pfcrt 76T and quadruple mutations in dhfr/dhps, suggesting lower-level resistance to antifolate drugs.

3.5. Regional Differences in Drug Susceptibility and Genetic Polymorphisms

Plasmodium isolates from these two regions had different susceptibilities to seven of the 11 antimalarial drugs tested. Parasite isolates from Laiza (the northern site) had significantly higher IC50s for AS, DHA, AM, NQ, PND, PY, and LMF than parasites from Muse (the southern site) (p < 0.05, Mann–Whitney U test, Figure 1, Table 1). Notably, the median IC50 of parasites to PY from Laiza was more than 4-fold higher than that from Muse (Table 1). Meanwhile, the RSA values varied by region. Parasite isolates from Laiza (the northern site) showed a median RSA value of 5.0%, significantly higher than the 2.4% in Muse (the southern site) (p = 0.0495, Mann–Whitney U test, Figure S11).
The two parasite populations also showed different prevalences in mutations of resistance-related genes (Table 2). For genes involved in antifolate resistance, the N51I mutation was significantly more prevalent in Laiza (96.7%) than Muse (40.9%) (p < 0.05). As a result, the pfdhfr haplotype with quadruple mutations (IRNL at positions 51/59/108/164) was significantly more abundant in Laiza. The S436A mutation in pfdhps was significantly more prevalent in Muse (68.2%) than Laiza (33.3%), whereas A581G showed the opposite trend (p < 0.01, χ2 test, Table 2). Likewise, the most abundant haplotypes SNG and AEA (at positions 436/540/581) also showed contrasting prevalence at the two sites (Table 3).
For pfcrt, the C72S mutation was more common in the Muse samples (36.4%) (Table 2), which resulted in the more prevalent SIEVTS haplotype (at positions 72/74/75/76/220) in Muse (Table 3). For pfmdr1, two mutations showed different frequencies between the two sites. The Y184F mutations were only found in the Laiza parasites (70%), whereas the F1226Y mutation (31.8%) was only present in the Muse population (Table 2). For the pfmrp1 gene, only the H785N mutation was more prevalent in Laiza than Muse (p < 0.01, χ2 test).
For the pfnhe1 gene, the two most abundant haplotypes (MS-5 and MS-7) showed contrasting prevalence in the two regional populations (Table 3). For the pfk13 gene, although the F446I mutation was predominant in both sites, it was at a much higher frequency in Laiza (86.7%) than Muse (31.8%). Interestingly, two additional mutations, K189T and N458Y, were only present in the Muse population (Table 2).
For the MDR haplotypes, Laiza and Muse also differed drastically (Figure S10). Laiza had a significantly higher proportion of MDR parasites than Muse (86.7% vs.36.4%; p < 0.05, χ2 test). Conversely, Muse had a much higher percentage of parasites resistant to 4-aminoquinoline and antifolates than Laiza (50% vs.13.3%). Only Muse had parasites resistant to 4-aminoquinoline drugs but less resistant to antifolates (with quadruple mutations in dhfr/dhps). These results collectively indicated that parasites from Laiza had a relatively higher level of MDR parasites.

4. Discussion

Multidrug-resistant P. falciparum is a significant challenge to the global efforts of malaria eradication. Although P. falciparum incidence in the GMS has continually declined, monitoring drug resistance has remained critical for updating regional antimalarial drug policies. This study represents our efforts to monitor drug resistance in sentinel sites along the China–Myanmar border using in vitro drug assays and molecular surveillance. By assessing the in vitro susceptibilities of parasites from two adjacent but separated areas to 11 common antimalarial drugs, we identified their significantly divergent drug susceptibility profiles, with parasites from Laiza having significantly higher IC50s to NQ, PY, AS, DHA, AM, PND, and LMF than those from Muse. Consistent with the in vitro phenotypic difference, parasites from the two regions were also distinctive in resistance-conferring mutations, possibly reflecting different origins of parasite populations and different drug histories.
CQ and antifolate drugs have long been withdrawn from treating falciparum malaria, but parasites from the two regions remained highly resistant to these drugs. Consistent with this, resistance-conferring mutations in pfcrt, pfdhfr, and pfdhps were highly prevalent, with many remaining fixed in the parasite populations. Persistent CQ resistance has been speculated to be due to continued CQ selection pressure from the widespread use of CQ to treat sympatric P. vivax infections [29] and fixation of mutations in pfcrt that mediate CQ resistance in the parasite populations [32]. Since parasites from the hypoendemic regions are predominantly monoclonal, and intrahost competition is low, these mutations are likely preserved even though they inflict high fitness costs. In comparison, the pfmdr1 N86Y mutation, which was also associated with CQ resistance [33], was infrequent in the GMS parasite populations. On the other hand, the persistent resistance to antifolates may be related to their use to treat bacterial infections [34,35,36]. For example, trimethoprim–sulfamethoxazole, used to treat acute respiratory infections, presents cross-resistance with pyrimethamine and sulfadoxine [34,35].Differential use of antifolate drugs in Laiza and Muse may account for the >4-fold differences in PY susceptibility and different frequencies of key mutations in pfdhfr (N51I) and pfdhps (S436A and A581G) between the two populations.
Partial artemisinin resistance, displayed as delayed parasite clearance following treatment with an ACT, has been detected in all the GMS regions, and the K13-propeller mutations have been used widely to track the emergence and spread of ART-resistant P. falciparum [31,37]. Within the GMS, pfk13 mutations are diverse and region-specific [38,39]. F446I was most prevalent in northern Myanmar and the China–Myanmar border [38,40], and this study further confirmed this. Although the N-terminal NN insertion was associated with altered susceptibility to ART drugs [41] and its prevalence has increased dramatically over the years along the China–Myanmar border [42], we did not identify the association of this insertion with changes in in vitro IC50 values to DHA and AS. Siddiqui et al. showed that the N458Y mutation, which occurs at the China–Myanmar border, confers ART resistance with a significant increase in RSA values in vitro [43]. In our study, the median RSA was higher in parasites with the N458Y mutation (5.0%) than in the K13 WT group (2.1%), but the difference was not significant, probably because the number of samples with the N458Y mutation was limited and therefore it was difficult to draw firm conclusions about the association of certain K13 genotypes with reduced ART susceptibility. Consistent with previous reports [43], F446I is associated with significantly higher RSA values than the WT parasites. Globally, K189T was identified at a relatively high proportion in the Amazon basin [44]. This mutation showed a similar prevalence in Africa, but was rarely described in Southeast Asia [45,46,47,48]. The study by Wu et al. in 2020 showed that K189T was first discovered in Myanmar [49]. Reports showed that K189T mutation is associated with delayed parasite clearance, but there is no clear correlation with ART resistance [48,50,51]. However, in our study, the RSA values of the samples with K189T mutation were significantly higher than those of WT type, which provides a direction for future studies.
In Cambodia, AS-MFQ was the first ACT introduced, but its efficacy steadily declined in the early 2000s [52], resulting in the switch to DHA-PPQ in 2008. However, with partial ART resistance emerging in the region, this ACT was soon found to be ineffective [53,54]. The concurrent recovery of the sensitivity of the parasites to AS-MFQ led to the consideration of recycling this ACT. ACT failures in Cambodia appear largely due to resistance to partner drugs. MFQ and PPQ seem to impose opposing selection on drug targets, especially pfmdr1 copy number: MFQ is associated with pfmdr1 amplification, whereas PPQ selects single-copy pfmdr1. Such opposite selection on the same target has been the basis for including these drugs in a triple ACT design [55]. The main ACT used in the China–Myanmar border area was DHA-PPQ, which remained highly efficacious [10,56]. Our recent study using an in vitro drug assay also showed that parasites from the China–Myanmar border area were largely susceptible to PPQ [57]. Consistently, parasites from this region did not contain plasmepsin2/3 amplification [58,59] or the new pfcrt mutations (H97Y, F145I, M343L, and G353V) conferring PPQ resistance [60,61,62], while the parasites also contained predominantly single-copy pfmdr1. It is noteworthy that the I356T mutation fixed in the study populations was significantly associated with decreased QN sensitivity and increased MFQ sensitivity in P. falciparum parasites from Africa [20]. In addition, I356T and N326S might be the background mutations on which pfk13 mutations emerged [63].
The ATP-binding cassette (ABC) transporters, including pfmdr1 and pfmrp1, are involved in parasite resistance to multiple antimalarial drugs [64]. The Y184F mutation was only detected in Laiza, and the F1226Y mutation in Muse. The Y184F mutation was associated with increased resistance to AS, LMF, and MFQ, while the F1226Y mutation was correlated with increased susceptibility to PND and NQ, suggesting that the divergent pfmdr1 mutations may be partially responsible for the differences in drug susceptibility between the two neighboring sites. MFQ has not been deployed in the China–Myanmar border area. Consistently, parasites from the two areas showed similar sensitivity to MFQ and pfmdr1 amplification associated with MFQ resistance was not detected [65]. While this and an earlier study identified that several mutations in pfmrp1 were associated with altered sensitivities to a number of drugs [23], they were similarly prevalent in the two populations. Thus, the significance of the pfmrp1 mutations in the context of pfcrt and pfmdr1 haplotypes warrants further investigation.
Antimalarial therapy is one of the pillars of malaria control and elimination. Updated knowledge about antimalarial resistance in malaria parasites is critical for delivering effective frontline treatment. Myanmar has the heaviest malaria burden in the GMS and is also a gateway to the Indian subcontinent. Thus, effective management of border malaria is essential for preventing cross-border spillover of resistant parasites, especially to neighboring countries that have just become malaria-free. This and an earlier study have demonstrated drastic differences in drug resistance between neighboring parasite populations during the elimination phase in the GMS [9]. A limitation of this study is the relatively small sample size. As malaria incidence has plummeted in recent years, collecting laboratory culture samples has become difficult. Differences in anthropology, administration, public health infrastructure, access to treatment, and intensity of malaria transmission across borders may contribute to the observed differences in susceptibility to antimalarial drugs. This may require timely adjustment of the antimalarial drug policy between different strata of malaria endemicity.

Supplementary Materials

The following supporting information can be downloaded at: https://www.mdpi.com/article/10.3390/tropicalmed7120442/s1, Figure S1: Map of the China–Myanmar border sites, Laiza and Muse, where parasites were collected; Figure S2: Spearman’s correlation between RSA (%) and IC50 values for dihydroartemisinin, artesunate, andartemether; Figure S3: Association of SNPs and major haplotypes in pfdhfr with responses to different antimalarials (shown in the y-axis or below the x-axis). *Indicates significant differences (p < 0.05, Mann–Whitney U test) in sensitivity between parasites carrying the two alleles or haplotypes; Figure S4: Association of SNPs and major haplotypes in pfcrt with responses to different antimalarials (shown in the y-axis or below the x-axis). *Indicates significant differences (p < 0.05, Mann–Whitney U test) in sensitivity between parasites carrying the two alleles or haplotypes; Figure S5: Association of SNPs and major haplotypes in pfmdr1 with responses to different antimalarials (shown in the y-axis or below the x-axis). *Indicates significant differences (p < 0.05, Mann–Whitney U test) in sensitivity between parasites carrying the two alleles or haplotypes; Figure S6: Association of SNPs and major haplotypes in pfmrp1 with responses to different antimalarials (shown in the y-axis or below the x-axis). *Indicates significant differences (p < 0.05, Mann–Whitney U test) in sensitivity between parasites carrying the two alleles or haplotypes; Figure S7: Association of SNPs and major haplotypes in minisatellites in pfnhe1 with responses to different antimalarials (shown in they-axis or below the x-axis). *Indicates significant differences (p < 0.05, Mann–Whitney U test) in sensitivity between parasites carrying the two alleles or haplotypes; Figure S8: Association of SNPs and major haplotypes in PfK13 with responses to different antimalarials (shown in they-axis or below the x-axis). *Indicates significant differences (p < 0.05, Mann–Whitney U test) in sensitivity between parasites carrying the two alleles or haplotypes; Figure S9: Correlation of parasite survival rates (RSA0-3h) and K13 polymorphisms. (A) RSA values between parasites with mutations in the Kelch propeller domain (>440 mutations) and parasites without K13 mutations. Different K13 mutations were color-coded (p < 0.05, Mann–Whitney U test). (B) Comparison of RSA values between parasites with different K13 mutations and the wild-type (WT) (Mann–Whitney U test). *, p < 0.05; Figure S10: Multidrug resistance haplotypes of parasites from Laiza and Muse. Mutant amino acids are in bold. The haplotypes include Pfcrt(76T), pfmdr1 (Y184F/F1226Y), pfdhfr (N51I/59R/108N/I164L), pfdhps (S436A/K540N/E/A581G), and pfk13 (446I or 458Y;—indicates K13 WT). The four parasites with quadruple or triple dhfr/dhps mutations are highlighted in cyan and yellow color, respectively. Group 1—76T, quintuple–sextuple dhfr/dhps, and K13 mutations (MDR); Group 2—76T and quintuple–sextuple dhfr/dhps; Figure S11: Ring survival rates of parasite isolates in the two border regions. *, p < 0.05; Table S1: In vitro sensitivities (IC50, nM) to 11 antimalarial drugs and mutations in genes (pfdhfr, pfdhps, pfcrt, pfmdr1, pfmrp1, pfhne1,and pfk13) associated with altered drug sensitivities of parasite isolates from Laiza and Muse. Abbreviation: dihydroartemisinin (DHA), artesunate (AS), artesunate (AM), quinine (QN), naphthoquine (NQ), pyronaridine (PND), chloroquine (CQ), piperaquine (PQ), mefloquine (MFQ), pyrimethamine (PY), lumefantrine (LMF), and ring survival assay (RSA). Table S2: Ring survival rates of parasite isolates stratified by the K13 alleles.

Author Contributions

Conceptualization, Z.Y. and L.C.; methodology, Y.R.; data curation, X.L., X.W., W.Z. (Wei Zhao), H.Z., K.S., W.Z. (Wenya Zhu), and Y.W.; formal analysis, W.Z. (Weilin Zeng) and J.M.; funding acquisition, W.Z. (Weilin Zeng), Z.Y. and L.C.; investigation, M.D., Y.B., and S.D.; resources, M.P.K.; writing—original draft, M.D. All authors have read and agreed to the published version of the manuscript.

Funding

This research was funded by a grant (U19AI089672) from the National Institute of Allergy and Infectious Diseases (NIAID), NIH, USA. Z.Y. was supported by the National Science Foundation of China (31860604 and U1802286), major science and technology projects of Yunnan Province (2018ZF0081) and International Science and Technology Cooperation—Yunnan International Science and Technology Cooperation Base (202003AE140004). W.Z. was supported by the Education Department Fund of Yunnan Province (2019J1184).

Institutional Review Board Statement

The study protocol was approved by the Institutional Review Boards of local health bureaus and Kunming Medical University (Protocol code: IRB # kmc2011-01; approval date: 22 March 2013).

Informed Consent Statement

Informed consent was obtained from all subjects involved in the study.

Data Availability Statement

The data for this study are presented within this article and any further information regarding this study can be reasonably requested from the corresponding author.

Acknowledgments

We thank all the patients for volunteering to participate in this study.

Conflicts of Interest

The authors declare no conflict of interest.

References

  1. Kaehler, N.; Adhikari, B.; Cheah, P.Y.; von Seidlein, L.; Day, N.P.J.; Paris, D.H.; Tanner, M.; Pell, C. Prospects and strategies for malaria elimination in the Greater Mekong Sub-region: A qualitative study. Malar. J. 2019, 18, 203. [Google Scholar] [CrossRef] [PubMed] [Green Version]
  2. WHO|Regional Office for the Western Pacific. Strategy for Malaria Elimination in the Greater Mekong Subregion: 2015–2030. Available online: https://www.who.int/publications/i/item/9789290617181 (accessed on 21 May 2015).
  3. Zhou, X.N. China declared malaria-free: A milestone in the world malaria eradication and Chinese public health. Infect. Dis. Poverty 2021, 10, 98. [Google Scholar] [CrossRef] [PubMed]
  4. Cui, L.; Yan, G.; Sattabongkot, J.; Cao, Y.; Chen, B.; Chen, X.; Fan, Q.; Fang, Q.; Jongwutiwes, S.; Parker, D.; et al. Malaria in the Greater Mekong Subregion: Heterogeneity and complexity. Acta Trop. 2012, 121, 227–239. [Google Scholar] [CrossRef] [PubMed] [Green Version]
  5. Geng, J.; Malla, P.; Zhang, J.; Xu, S.; Li, C.; Zhao, Y.; Wang, Q.; Kyaw, M.P.; Cao, Y.; Yang, Z.; et al. Increasing trends of malaria in a border area of the Greater Mekong Subregion. Malar. J. 2019, 18, 309. [Google Scholar] [CrossRef] [PubMed] [Green Version]
  6. Lo, E.; Lam, N.; Hemming-Schroeder, E.; Nguyen, J.; Zhou, G.; Lee, M.C.; Yang, Z.; Cui, L.; Yan, G. Frequent Spread of Plasmodium vivax Malaria Maintains High Genetic Diversity at the Myanmar-China Border, without Distance and Landscape Barriers. J. Infect. Dis. 2017, 216, 1254–1263. [Google Scholar] [CrossRef] [Green Version]
  7. He, X.; Zhong, D.; Zou, C.; Pi, L.; Zhao, L.; Qin, Y.; Pan, M.; Wang, S.; Zeng, W.; Xiang, Z.; et al. Unraveling the Complexity of Imported Malaria Infections by Amplicon Deep Sequencing. Front Cell. Infect. Microbiol. 2021, 11, 725859. [Google Scholar] [CrossRef]
  8. Fairhurst, R.M.; Dondorp, A.M. Artemisinin-Resistant Plasmodium falciparum malaria. Microbiol. Spectr. 2016, 4, 10. [Google Scholar] [CrossRef] [Green Version]
  9. Zeng, W.; Bai, Y.; Wang, M.; Wang, Z.; Deng, S.; Ruan, Y.; Feng, S.; Yang, Z.; Cui, L. Significant Divergence in Sensitivity to Antimalarial Drugs between Neighboring Plasmodium falciparum Populations along the Eastern Border of Myanmar. Antimicrob. Agents Chemother. 2017, 61, e01689-16. [Google Scholar] [CrossRef] [Green Version]
  10. Wang, Y.; Yang, Z.; Yuan, L.; Zhou, G.; Parker, D.; Lee, M.C.; Yan, G.; Fan, Q.; Xiao, Y.; Cao, Y.; et al. Clinical Efficacy of Dihydroartemisinin-Piperaquine for the Treatment of Uncomplicated Plasmodium falciparum Malaria at the China-Myanmar Border. Am. J. Trop. Med. Hyg. 2015, 93, 577–583. [Google Scholar] [CrossRef]
  11. Malaria Clinical Management Guidelines, Ministry of Health, Myanmar. Available online: https://moh.nugmyanmar.org/wp-content/uploads/2022/07/Malaria_Clinical_Management_Guidelines__June_2022___Ver_1__MOH_NUG_of_Myanmar.pdf (accessed on 28 November 2022).
  12. Myint, M.K.; Rasmussen, C.; Thi, A.; Bustos, D.; Ringwald, P.; Lin, K. Therapeutic efficacy and artemisinin resistance in northern Myanmar: Evidence from in vivo and molecular marker studies. Malar. J. 2017, 16, 143. [Google Scholar] [CrossRef]
  13. Meng, H.; Zhang, R.; Yang, H.; Fan, Q.; Su, X.; Miao, J.; Cui, L.; Yang, Z. In vitro sensitivity of Plasmodium falciparum clinical isolates from the China-Myanmar border area to quinine and association with polymorphism in the NA+/H+ exchanger. Antimicrob. Agents Chemother. 2010, 54, 4306–4313. [Google Scholar] [CrossRef] [PubMed] [Green Version]
  14. Trager, W.; Jensen, J.B. Human malaria parasites in continuous culture. Science. 1976, 193, 673–675. [Google Scholar] [CrossRef] [PubMed]
  15. Smilkstein, M.; Sriwilaijaroen, N.; Kelly, J.X.; Wilairat, P.; Riscoe, M. Simple and inexpensive fluorescence-based technique for high-throughput antimalarial drug screening. Antimicrob. Agents Chemother. 2004, 48, 1803–1806. [Google Scholar] [CrossRef] [PubMed] [Green Version]
  16. Siddiqui, F.A.; Cabrera, M.; Wang, M.; Brashear, A.; Kemirembe, K.; Wang, Z.; Miao, J.; Chookajorn, T.; Yang, Z.; Cao, Y.; et al. Plasmodium falciparum falcipain-2a polymorphisms in Southeast Asia and Their Association with Artemisinin Resistance. J. Infect. Dis. 2018, 218, 434–442. [Google Scholar] [CrossRef] [PubMed]
  17. Witkowski, B.; Amaratunga, C.; Khim, N.; Sreng, S.; Chim, P.; Kim, S.; Lim, P.; Mao, S.; Sopha, C.; Sam, B.; et al. Novel phenotypic assays for the detection of artemisinin-resistant Plasmodium falciparum malaria in Cambodia: In-vitro and ex-vivo drug-response studies. Lancet Infect. Dis. 2013, 13, 1043–1049. [Google Scholar] [CrossRef] [Green Version]
  18. Zhang, J.; Feng, G.H.; Zou, C.Y.; Su, P.C.; Liu, H.E.; Yang, Z.Q. Overview of the improvement of the ring-stage survival assay-a novel phenotypic assay for the detection of artemisinin-resistant Plasmodium falciparum. Zool. Res. 2017, 38, 317–320. [Google Scholar]
  19. Amaratunga, C.; Witkowski, B.; Dek, D.; Try, V.; Khim, N.; Miotto, O.; Menard, D.; Fairhurst, R.M. Plasmodium falciparum founder populations in western Cambodia have reduced artemisinin sensitivity in vitro. Antimicrob. Agents Chemother. 2014, 58, 4935–4937. [Google Scholar] [CrossRef] [Green Version]
  20. Foguim, F.T.; Bogreau, H.; Gendrot, M.; Mosnier, J.; Fonta, I.; Benoit, N.; Amalvict, R.; Madamet, M.; Wein, S.; Pradines, B.; et al. Prevalence of mutations in the Plasmodium falciparum chloroquine resistance transporter, Pfcrt, and association with ex vivo susceptibility to common anti-malarial drugs against African Plasmodium falciparum isolates. Malar. J. 2020, 19, 201. [Google Scholar] [CrossRef]
  21. Yang, Z.; Li, C.; Miao, M.; Zhang, Z.; Sun, X.; Meng, H.; Li, J.; Fan, Q.; Cui, L. Multidrug-resistant genotypes of Plasmodium falciparum, Myanmar. Emerg. Infect. Dis. 2011, 17, 498–501. [Google Scholar] [CrossRef]
  22. Wang, Z.; Shrestha, S.; Li, X.; Miao, J.; Yuan, L.; Cabrera, M.; Grube, C.; Yang, Z.; Cui, L. Prevalence of K13-propeller polymorphisms in Plasmodium falciparum from China-Myanmar border in 2007–2012. Malar. J. 2015, 14, 168. [Google Scholar] [CrossRef] [Green Version]
  23. Gupta, B.; Xu, S.; Wang, Z.; Sun, L.; Miao, J.; Cui, L.; Yang, Z. Plasmodium falciparum multidrug resistance protein 1 (pfmrp1) gene and its association with in vitro drug susceptibility of parasite isolates from north-east Myanmar. J. Antimicrob. Chemother. 2014, 69, 2110–2117. [Google Scholar] [CrossRef] [PubMed]
  24. Ringwald, P.; Bickii, J.; Basco, L.K. In vitro activity of antimalarials against clinical isolates of Plasmodium falciparum in Yaounde, Cameroon. Am. J. Trop. Med. Hyg. 1996, 55, 254–258. [Google Scholar] [CrossRef] [PubMed]
  25. Pradines, B.; Tall, A.; Parzy, D.; Spiegel, A.; Fusai, T.; Hienne, R.; Trape, J.F.; Doury, J.C. In-vitro activity of pyronaridine and amodiaquine against African isolates (senegal) of Plasmodium falciparum in comparison with standard antimalarial agents. J. Antimicrob. Chemother. 1998, 42, 333–339. [Google Scholar] [CrossRef] [PubMed]
  26. Pradines, B.; Tall, A.; Fusai, T.; Spiegel, A.; Hienne, R.; Rogier, C.; Trape, J.F.; Le Bras, J.; Parzy, D. In vitro activities of benflumetol against 158 Senegalese isolates of Plasmodium falciparum in comparison with those of standard antimalarial drugs. Antimicrob. Agents Chemother. 1999, 43, 418–420. [Google Scholar] [CrossRef] [PubMed] [Green Version]
  27. Aubouy, A.; Jafari, S.; Huart, V.; Migot-Nabias, F.; Mayombo, J.; Durand, R.; Bakary, M.; Le Bras, J.; Deloron, P. DHFR and DHPS genotypes of Plasmodium falciparum isolates from Gabon correlate with in vitro activity of pyrimethamine and cycloguanil, but not with sulfadoxine-pyrimethamine treatment efficacy. J. Antimicrob. Chemother. 2003, 52, 43–49. [Google Scholar] [CrossRef]
  28. Hao, M.; Jia, D.; Li, Q.; He, Y.; Yuan, L.; Xu, S.; Chen, K.; Wu, J.; Shen, L.; Sun, L.; et al. In vitro sensitivities of Plasmodium falciparum isolates from the China-Myanmar border to piperaquine and association with polymorphisms in candidate genes. Antimicrob. Agents Chemother. 2013, 57, 1723–1729. [Google Scholar] [CrossRef] [Green Version]
  29. Bai, Y.; Zhang, J.; Geng, J.; Xu, S.; Deng, S.; Zeng, W.; Wang, Z.; NgassaMbenda, H.G.; Zhang, J.; Li, N.; et al. Longitudinal surveillance of drug resistance in Plasmodium falciparum isolates from the China-Myanmar border reveals persistent circulation of multidrug resistant parasites. Int. J. Parasitol. Drugs Drug Resist. 2018, 8, 320–328. [Google Scholar] [CrossRef]
  30. Cheruiyot, J.; Ingasia, L.A.; Omondi, A.A.; Juma, D.W.; Opot, B.H.; Ndegwa, J.M.; Mativo, J.; Cheruiyot, A.C.; Yeda, R.; Okudo, C.; et al. Polymorphisms in Pfmdr1, Pfcrt, and Pfnhe1 genes are associated with reduced in vitro activities of quinine in plasmodium falciparum isolates from western Kenya. Antimicrob. Agents Chemother. 2014, 58, 3737–3743. [Google Scholar] [CrossRef] [Green Version]
  31. Ariey, F.; Witkowski, B.; Amaratunga, C.; Beghain, J.; Langlois, A.C.; Khim, N.; Kim, S.; Duru, V.; Bouchier, C.; Ma, L.; et al. A molecular marker of artemisinin-resistant Plasmodium falciparum malaria. Nature 2014, 505, 50–55. [Google Scholar] [CrossRef]
  32. Fidock, D.A.; Nomura, T.; Talley, A.K.; Cooper, R.A.; Dzekunov, S.M.; Ferdig, M.T.; Ursos, L.M.; Sidhu, A.B.; Naude, B.; Deitsch, K.W.; et al. Mutations in the P. falciparum digestive vacuole transmembrane protein Pfcrt and evidence for their role in chloroquine resistance. Mol. Cell 2000, 6, 861–871. [Google Scholar] [CrossRef]
  33. Happi, T.C.; Thomas, S.M.; Gbotosho, G.O.; Falade, C.O.; Akinboye, D.O.; Gerena, L.; Hudson, T.; Sowunmi, A.; Kyle, D.E.; Milhous, W.; et al. Point mutations in the pfcrt and pfmdr-1 genes of Plasmodium falciparum and clinical response to chloroquine, among malaria patients from Nigeria. Ann. Trop. Med. Parasitol. 2003, 97, 439–451. [Google Scholar] [CrossRef] [PubMed]
  34. Khim, N.; Bouchier, C.; Ekala, M.T.; Incardona, S.; Lim, P.; Legrand, E.; Jambou, R.; Doung, S.; Puijalon, O.M.; Fandeur, T. Countrywide survey shows very high prevalence of Plasmodium falciparum multilocus resistance genotypes in Cambodia. Antimicrob. Agents Chemother. 2005, 49, 3147–3152. [Google Scholar] [CrossRef] [PubMed] [Green Version]
  35. Iyer, J.K.; Milhous, W.K.; Cortese, J.F.; Kublin, J.G.; Plowe, C.V. Plasmodium falciparum cross-resistance between trimethoprim and pyrimethamine. Lancet 2001, 358, 1066–1067. [Google Scholar] [CrossRef] [PubMed]
  36. Sugaram, R.; Suwannasin, K.; Kunasol, C.; Mathema, V.B.; Day, N.P.J.; Sudathip, P.; Prempree, P.; Dondorp, A.M.; Imwong, M. Molecular characterization of Plasmodium falciparum antifolate resistance markers in Thailand between 2008 and 2016. Malar. J. 2020, 19, 107. [Google Scholar] [CrossRef] [Green Version]
  37. Menard, D.; Khim, N.; Beghain, J.; Adegnika, A.A.; Shafiul-Alam, M.; Amodu, O.; Rahim-Awab, G.; Barnadas, C.; Berry, A.; Boum, Y.; et al. A Worldwide Map of Plasmodium falciparum K13-Propeller Polymorphisms. N. Engl. J. Med. 2016, 374, 2453–2464. [Google Scholar] [CrossRef]
  38. Huang, F.; Takala-Harrison, S.; Jacob, C.G.; Liu, H.; Sun, X.; Yang, H.; Nyunt, M.M.; Adams, M.; Zhou, S.; Xia, Z.; et al. A Single Mutation in K13 Predominates in Southern China and Is Associated with Delayed Clearance of Plasmodium falciparum Following Artemisinin Treatment. J. Infect. Dis. 2015, 212, 1629–1635. [Google Scholar] [CrossRef] [Green Version]
  39. Tun, K.M.; Imwong, M.; Lwin, K.M.; Win, A.A.; Hlaing, T.M.; Hlaing, T.; Lin, K.; Kyaw, M.P.; Plewes, K.; Faiz, M.A.; et al. Spread of artemisinin-resistant Plasmodium falciparum in Myanmar: A cross-sectional survey of the K13 molecular marker. Lancet Infect. Dis. 2015, 15, 415–421. [Google Scholar] [CrossRef] [Green Version]
  40. Wang, J.; Huang, Y.; Zhao, Y.; Ye, R.; Zhang, D.; Pan, W. Introduction of F446I mutation in the K13 propeller gene leads to increased ring survival rates in Plasmodium falciparum isolates. Malar. J. 2018, 17, 248. [Google Scholar] [CrossRef] [Green Version]
  41. Wang, Z.; Wang, Y.; Cabrera, M.; Zhang, Y.; Gupta, B.; Wu, Y.; Kemirembe, K.; Hu, Y.; Liang, X.; Brashear, A.; et al. Artemisinin resistance at the China-Myanmar border and association with mutations in the K13 propeller gene. Antimicrob. Agents Chemother. 2015, 59, 6952–6959. [Google Scholar] [CrossRef] [Green Version]
  42. Zhang, J.; Li, N.; Siddiqui, F.A.; Xu, S.; Geng, J.; Zhang, J.; He, X.; Zhao, L.; Pi, L.; Zhang, Y.; et al. In vitro susceptibility of Plasmodium falciparum isolates from the China-Myanmar border area to artemisinins and correlation with K13 mutations. Int. J. Parasitol. Drugs Drug Resist. 2019, 10, 20–27. [Google Scholar] [CrossRef]
  43. Siddiqui, F.A.; Boonhok, R.; Cabrera, M.; Mbenda, H.G.N.; Wang, M.; Min, H.; Liang, X.; Qin, J.; Zhu, X.; Miao, J.; et al. Role of Plasmodium falciparum Kelch 13 Protein Mutations in P. Falciparum Populations from Northeastern Myanmar in Mediating Artemisinin Resistance. mBio 2020, 11, e01134-19. [Google Scholar] [CrossRef] [PubMed]
  44. Mathieu, L.C.; Singh, P.; Monteiro, W.M.; Magris, M.; Cox, H.; Lazrek, Y.; Melo, G.C.; Marchesini, P.; Alexandre, J.S.F.; Alvarez, A.M.; et al. Kelch13 mutations in Plasmodium falciparum and risk of spreading in Amazon basin countries. J. Antimicrob. Chemother. 2021, 76, 2854–2862. [Google Scholar] [CrossRef] [PubMed]
  45. Torrentino-Madamet, M.; Fall, B.; Benoit, N.; Camara, C.; Amalvict, R.; Fall, M.; Dionne, P.; Ba Fall, K.; Nakoulima, A.; Diatta, B.; et al. Limited polymorphisms in k13 gene in Plasmodium falciparum isolates from Dakar, Senegal in 2012–2013. Malar. J. 2014, 13, 472. [Google Scholar] [CrossRef] [PubMed] [Green Version]
  46. Conrad, M.D.; Bigira, V.; Kapisi, J.; Muhindo, M.; Kamya, M.R.; Havlir, D.V.; Dorsey, G.; Rosenthal, P.J. Polymorphisms in k13 and falcipain-2 associated with artemisinin resistance are not prevalent in Plasmodium falciparum isolated from Ugandan children. PLoS ONE 2014, 9, e105690. [Google Scholar] [CrossRef] [PubMed]
  47. Boussaroque, A.; Fall, B.; Madamet, M.; Camara, C.; Benoit, N.; Fall, M.; Nakoulima, A.; Dionne, P.; Fall, K.B.; Diatta, B.; et al. Emergence of Mutations in the K13 Propeller Gene of Plasmodium falciparum Isolates from Dakar, Senegal, in 2013–2014. Antimicrob. Agents Chemother. 2016, 60, 624–627. [Google Scholar] [CrossRef] [PubMed] [Green Version]
  48. Group, W.K.G.-P.S. Association of mutations in the Plasmodium falciparum Kelch13 gene (Pf3d7_1343700) with parasite clearance rates after artemisinin-based treatments-a WWARN individual patient data meta-analysis. BMC Med. 2019, 17, 1. [Google Scholar]
  49. Wu, Y.; Soe, M.T.; Aung, P.L.; Zhao, L.; Zeng, W.; Menezes, L.; Yang, Z.; Kyaw, M.P.; Cui, L. Efficacy of artemether-lumefantrine for treating uncomplicated Plasmodium falciparum cases and molecular surveillance of drug resistance genes in Western Myanmar. Malar. J. 2020, 19, 304. [Google Scholar] [CrossRef]
  50. Ashley, E.A.; Dhorda, M.; Fairhurst, R.M.; Amaratunga, C.; Lim, P.; Suon, S.; Sreng, S.; Anderson, J.M.; Mao, S.; Sam, B.; et al. Spread of artemisinin resistance in Plasmodium falciparum malaria. N. Engl. J. Med. 2014, 371, 411–423. [Google Scholar] [CrossRef] [Green Version]
  51. Takala-Harrison, S.; Jacob, C.G.; Arze, C.; Cummings, M.P.; Silva, J.C.; Dondorp, A.M.; Fukuda, M.M.; Hien, T.T.; Mayxay, M.; Noedl, H. Independent emergence of artemisinin resistance mutations among Plasmodium falciparum in Southeast Asia. J. Infect. Dis. 2015, 211, 670–679. [Google Scholar] [CrossRef] [Green Version]
  52. Carrara, V.I.; Lwin, K.M.; Phyo, A.P.; Ashley, E.; Wiladphaingern, J.; Sriprawat, K.; Rijken, M.; Boel, M.; McGready, R.; Proux, S.; et al. Malaria burden and artemisinin resistance in the mobile and migrant population on the Thai-Myanmar border, 1999–2011: An observational study. PLoS Med. 2013, 10, e1001398. [Google Scholar] [CrossRef] [Green Version]
  53. Saunders, D.L.; Vanachayangkul, P.; Lon, C. Dihydroartemisinin-piperaquine failure in Cambodia. N. Engl. J. Med. 2014, 371, 484–485. [Google Scholar] [CrossRef] [PubMed]
  54. Spring, M.D.; Lin, J.T.; Manning, J.E.; Vanachayangkul, P.; Somethy, S.; Bun, R.; Se, Y.; Chann, S.; Ittiverakul, M.; Sia-ngam, P.; et al. Dihydroartemisinin-piperaquine failure associated with a triple mutant including kelch13 C580Y in Cambodia: An observational cohort study. Lancet Infect. Dis. 2015, 15, 683–691. [Google Scholar] [CrossRef] [PubMed]
  55. van der Pluijm, R.W.; Tripura, R.; Hoglund, R.M.; PyaePhyo, A.; Lek, D.; Ul Islam, A.; Anvikar, A.R.; Satpathi, P.; Satpathi, S.; Behera, P.K.; et al. Triple artemisinin-based combination therapies versus artemisinin-based combination therapies for uncomplicated Plasmodium falciparum malaria: A multicentre, open-label, randomised clinical trial. Lancet 2020, 395, 1345–1360. [Google Scholar] [CrossRef]
  56. Liu, H.; Yang, H.L.; Tang, L.H.; Li, X.L.; Huang, F.; Wang, J.Z.; Li, C.F.; Wang, H.Y.; Nie, R.H.; Guo, X.R.; et al. In vivo monitoring of dihydroartemisinin-piperaquine sensitivity in Plasmodium falciparum along the China-Myanmar border of Yunnan Province, China from 2007 to 2013. Malar. J. 2015, 14, 47. [Google Scholar] [CrossRef] [PubMed] [Green Version]
  57. Si, Y.; Zeng, W.; Li, N.; Wang, C.; Siddiqui, F.; Zhang, J.; Pi, L.; He, X.; Zhao, L.; Wang, S.; et al. In Vitro Susceptibility of Plasmodium falciparum Isolates from the China-Myanmar Border Area to Piperaquine and Association with Candidate Markers. Antimicrob. Agents Chemother. 2021, 65, e02305-20. [Google Scholar] [CrossRef]
  58. Witkowski, B.; Duru, V.; Khim, N.; Ross, L.S.; Saintpierre, B.; Beghain, J.; Chy, S.; Kim, S.; Ke, S.; Kloeung, N.; et al. A surrogate marker of piperaquine-resistant Plasmodium falciparum malaria: A phenotype-genotype association study. Lancet Infect. Dis. 2017, 17, 174–183. [Google Scholar] [CrossRef] [Green Version]
  59. Amato, R.; Lim, P.; Miotto, O.; Amaratunga, C.; Dek, D.; Pearson, R.D.; Almagro-Garcia, J.; Neal, A.T.; Sreng, S.; Suon, S.; et al. Genetic markers associated with dihydroartemisinin-piperaquine failure in Plasmodium falciparum malaria in Cambodia: A genotype-phenotype association study. Lancet Infect. Dis. 2017, 17, 164–173. [Google Scholar] [CrossRef] [Green Version]
  60. Dhingra, S.K.; Small-Saunders, J.L.; Menard, D.; Fidock, D.A. Plasmodium falciparum resistance to piperaquine driven by PfCRT. Lancet Infect. Dis. 2019, 19, 1168–1169. [Google Scholar] [CrossRef]
  61. Ross, L.S.; Dhingra, S.K.; Mok, S.; Yeo, T.; Wicht, K.J.; Kumpornsin, K.; Takala-Harrison, S.; Witkowski, B.; Fairhurst, R.M.; Ariey, F.; et al. Emerging Southeast Asian PfCRT mutations confer Plasmodium falciparum resistance to the first-line antimalarial piperaquine. Nat. Commun. 2018, 9, 3314. [Google Scholar] [CrossRef] [Green Version]
  62. Duru, V.; Khim, N.; Leang, R.; Kim, S.; Domergue, A.; Kloeung, N.; Ke, S.; Chy, S.; Eam, R.; Khean, C.; et al. Plasmodium falciparum dihydroartemisinin-piperaquine failures in Cambodia are associated with mutant K13 parasites presenting high survival rates in novel piperaquine in vitro assays: Retrospective and prospective investigations. BMC Med. 2015, 13, 305. [Google Scholar] [CrossRef] [Green Version]
  63. Miotto, O.; Amato, R.; Ashley, E.A.; MacInnis, B.; Almagro-Garcia, J.; Amaratunga, C.; Lim, P.; Mead, D.; Oyola, S.O.; Dhorda, M.; et al. Genetic architecture of artemisinin-resistant Plasmodium falciparum. Nat. Genet. 2015, 47, 226–234. [Google Scholar] [CrossRef] [PubMed] [Green Version]
  64. Sanchez, C.P.; Dave, A.; Stein, W.D.; Lanzer, M. Transporters as mediators of drug resistance in Plasmodium falciparum. Int. J. Parasitol. 2010, 40, 1109–1118. [Google Scholar] [CrossRef] [PubMed]
  65. Price, R.N.; Uhlemann, A.C.; Brockman, A.; McGready, R.; Ashley, E.; Phaipun, L.; Patel, R.; Laing, K.; Looareesuwan, S.; White, N.J.; et al. Mefloquine resistance in Plasmodium falciparum and increased pfmdr1 gene copy number. Lancet 2004, 364, 438–447. [Google Scholar] [CrossRef] [PubMed]
Figure 1. Dot plots of in vitro susceptibilities of parasite isolates from Laiza and Muse in eastern Myanmar to 11 antimalarial drugs. Asterisks indicate significant differences in drug sensitivity between the two regions (p < 0.05, Mann–Whitney U test). Red bars indicate the cutoff values used to define resistance: CQ, 100 nM; QN, 600 nM; PY, 100 nM; MFQ, 30 nM; PQ, 31.2 nM; LMF, 11.8 nM; AS, 14.1 nM; AM, 4.7 nM; NQ, 23.8 nM; and PND, 15 nM. DHA, dihydroartemisinin; AS, artesunate; AM, artemether; QN, quinine; NQ, naphthoquine; PND, pyronaridine; CQ, chloroquine; PPQ, piperaquine; MFQ, mefloquine; PY, pyrimethamine; LMF, lumefantrine.
Tropicalmed 07 00442 g001
Figure 2. Correlation between the IC50 values of cultured parasite isolates to 11 antimalarial drugs by Spearman’s test. The degree of correlation is color-coded, and coefficients are shown below the diagonal. *, **, ***, and **** indicate significance at 0.01 < p < 0.05, 0.001 < p < 0.01, 0.0001 < p < 0.001, and p < 0.0001, respectively. Abbreviations are the same as in Figure 1.
Tropicalmed 07 00442 g002
Table 1. In vitro susceptibilities (IC50 in nM) of culture-adapted field isolates from the China–Myanmar border sites to 11 antimalarial drugs.
DrugTotal (N = 52)
(Mean ± SD)
3D7 Control
(Mean ± SD)
p-Value *
Field Sites vs. Control
Laiza (N = 30)Muse (N = 22)p-Value #
Laiza vs. Muse
(Mean ± SD)Range(Mean ± SD)RangeMuse
CQ358 ±394.917.98 ± 0.53<0.0001303.3 ±241.632.14–903.23432.6 ±536.755.41–26160.4010
PPQ10.98 ±10.115.20 ± 0.26<0.00019.76 ±6.581.75–30.7112.64 ±13.551.74–66.650.5847
MFQ93.49 ±69.4415.40 ± 0.37<0.000189.51 ±66.7330.56–391.8798.92 ±74.2216.99–269.530.8869
NQ 9.93 ±6.945.36 ±2.39<0.000112.17 ±8.013.08–42.316.88 ±3.412.18–13.590.0053
PY1796 ±989.466.73 ± 1.28<0.00012259 ±763.8199.97–4058.01166 ±922258.3–2640.00.0003
AS7.46 ±3.345.43 ± 2.010.00028.92 ±2.984.22–14.375.48 ±2.781.51–11.320.0001
DHA2.70 ±1.050.73 ± 0.13<0.00012.90 ±1.041.05–5.492.42 ±1.021.48–5.050.0319
AM2.79 ±0.961.36 ± 1.59<0.00013.06 ±1.131.77–6.192.43 ±0.481.5–3.580.0244
QN103.6 ±159.986.75 ± 1.910.279074.59 ±65.58.65–314.7143.1 ±230.912.33–11130.5481
LMF4.58 ±3.604.60 ± 2.900.41935.60 ±3.771.08–14.933.18 ±2.890.83–12.710.0038
PND10.27 ±5.4458.51 ± 1.380.053311.69 ±4.965.31–27.878.34 ±5.592.94–23.880.0031
RSA a3.83% (1.83–7.26%)0.3%<0.00014.99% (1.87–8.4)2.4% (1.72–3.79)0.0495
* Comparison between total field isolates and 3D7 by the Wilcoxon matched-pairs signed-rank test. # Comparison between the two sites by the Mann–Whitney U test. a The ring survival assay (RSA) values are shown as median (interquartile range). Abbreviations: SD, standard deviation; CQ, chloroquine; PPQ, piperaquine; MFQ, mefloquine; NQ, naphthoquine; PY, pyrimethamine; AS, artesunate; DHA, dihydroartemisinin; AM, artemether; QN, quinine; LMF, lumefantrine; PND, pyronaridine.
Table 2. The prevalence of mutations (%) in genes associated with drug resistance in the two border regions.
GeneMutationsTotal (n = 52)Laiza (n = 30)Muse (n = 22)p-Value
PfdhfrN51I73.196.740.9<0.0001 *
C59R1001001001.0000
S108N1001001001.0000
I164L96.210090.90.1742
PfdhpsS436A48.133.368.20.0238 *
K540E/N96.296.795.51.0000
A581G55.873.331.80.0046 *
PfcrtC72S19.26.736.40.0117 *
M74I1001001001.0000
N75E1001001001.0000
K76T1001001001.0000
A220S98.110095.50.4231
I356T1001001001.0000
Pfmdr1N86Y1.93.301.0000
G130K5.8013.60.0697
Y184F40.4700<0.0001 *
S1034I1.904.50.4231
N1042D1.904.50.4231
F1226Y13.5031.80.0013 *
Pfmrp1H191Y90.486.795.50.3814
N325S5.83.39.10.5670
S437A90.486.795.50.3814
H785N71.283.354.50.0324 *
I876V76.98072.70.7402
T1007M73.183.359.10.0647
F1390I5.8013.61.0000
PfK13NN insert88.596.777.30.0716
K189T3.809.10.1742
F446I63.586.731.8<0.0001 *
N458Y3.809.10.1742
* p < 0.05 (χ2 test).
Table 3. The prevalence of haplotypes of resistance genes.
Gene (Codon Positions)HaplotypesTotal
(n = 52)
Laiza
(n = 30)
Muse
(n = 22)
p-Value
Pfdhfr (51/59/108/164)NRNI3.8 0 9.10.1742
NRNL23.1 3.3 50.0 0.0001 *
IRNL73.1 96.7 40.9 <0.0001 *
Pfdhps (436/540/581)SKA1.9 04.5 0.4231
SKG1.9 3.3 01.0000
SNG40.4 56.7 18.2 0.0093 *
SEG7.7 6.7 9.1 1.0000
ANA3.8 09.1 0.1742
AEA38.5 26.7 54.5 0.0499 *
AEG3.8 3.3 4.5 1.0000
ANG1.9 3.3 01.0000
Pfcrt (72/74/75/76/220)CIETA1.9 04.5 0.4231
CIETS78.8 93.3 59.1 0.0048 *
SIETS19.2 6.7 36.4 0.0117 *
Pfmdr1 (86/130/184/1042)NEYSNF36.5 26.7 50.0 0.1442
NEYSNY11.5 027.3 0.0037 *
NEYINF1.9 04.5 0.4231
NEFSNF40.4 70.0 0<0.0001 *
NKYSNF5.8 013.6 0.0697
YEYSNF1.9 3.3 01.0000
NEYSDY1.9 04.5 0.4231
Pfmrp1 (191/325/437/785/
876/1007/1390)
HNSHITF9.6 13.3 4.5 0.3814
YNAHITF5.8 013.6 0.0697
YSAHITF5.8 3.3 9.1 0.5670
YNAHVTI5.8 013.6 0.0697
YNAHVMF1.9 04.5 0.4231
YNANIMF1.9 3.3 01.0000
YNANVMF69.2 80.0 54.5 0.0701
PfK13 (189/446/458)KFN28.8 13.3 50.0 0.0057 *
KIN63.5 86.7 31.8 <0.0001 *
KFY3.8 09.1 0.1742
TFN3.8 09.1 0.1742
Pfnhe1MS-33.809.10.1742
MS-540.466.74.6<0.0001 *
MS-617.326.74.60.0618
MS-734.66.772.7<0.0001 *
MS-213.809.10.1742
* Significant difference (χ2 test). Letters in bold indicate mutant residues.
Publisher’s Note: MDPI stays neutral with regard to jurisdictional claims in published maps and institutional affiliations.

