Prevalence of Antimicrobial Resistance Genes in Salmonella Typhi: A Systematic Review and Meta-Analysis
Abstract
1. Introduction
2. Materials and Methods
2.1. Study Design and Protocol
2.2. Search Strategy
2.3. Inclusion and Exclusion Criteria
2.4. Data Extraction and Risk of Bias (RoB) Assessment
2.5. Data Synthesis and Analysis
3. Results
3.1. Overview of the Selected Studies
3.2. Characteristics of the Eligible Studies
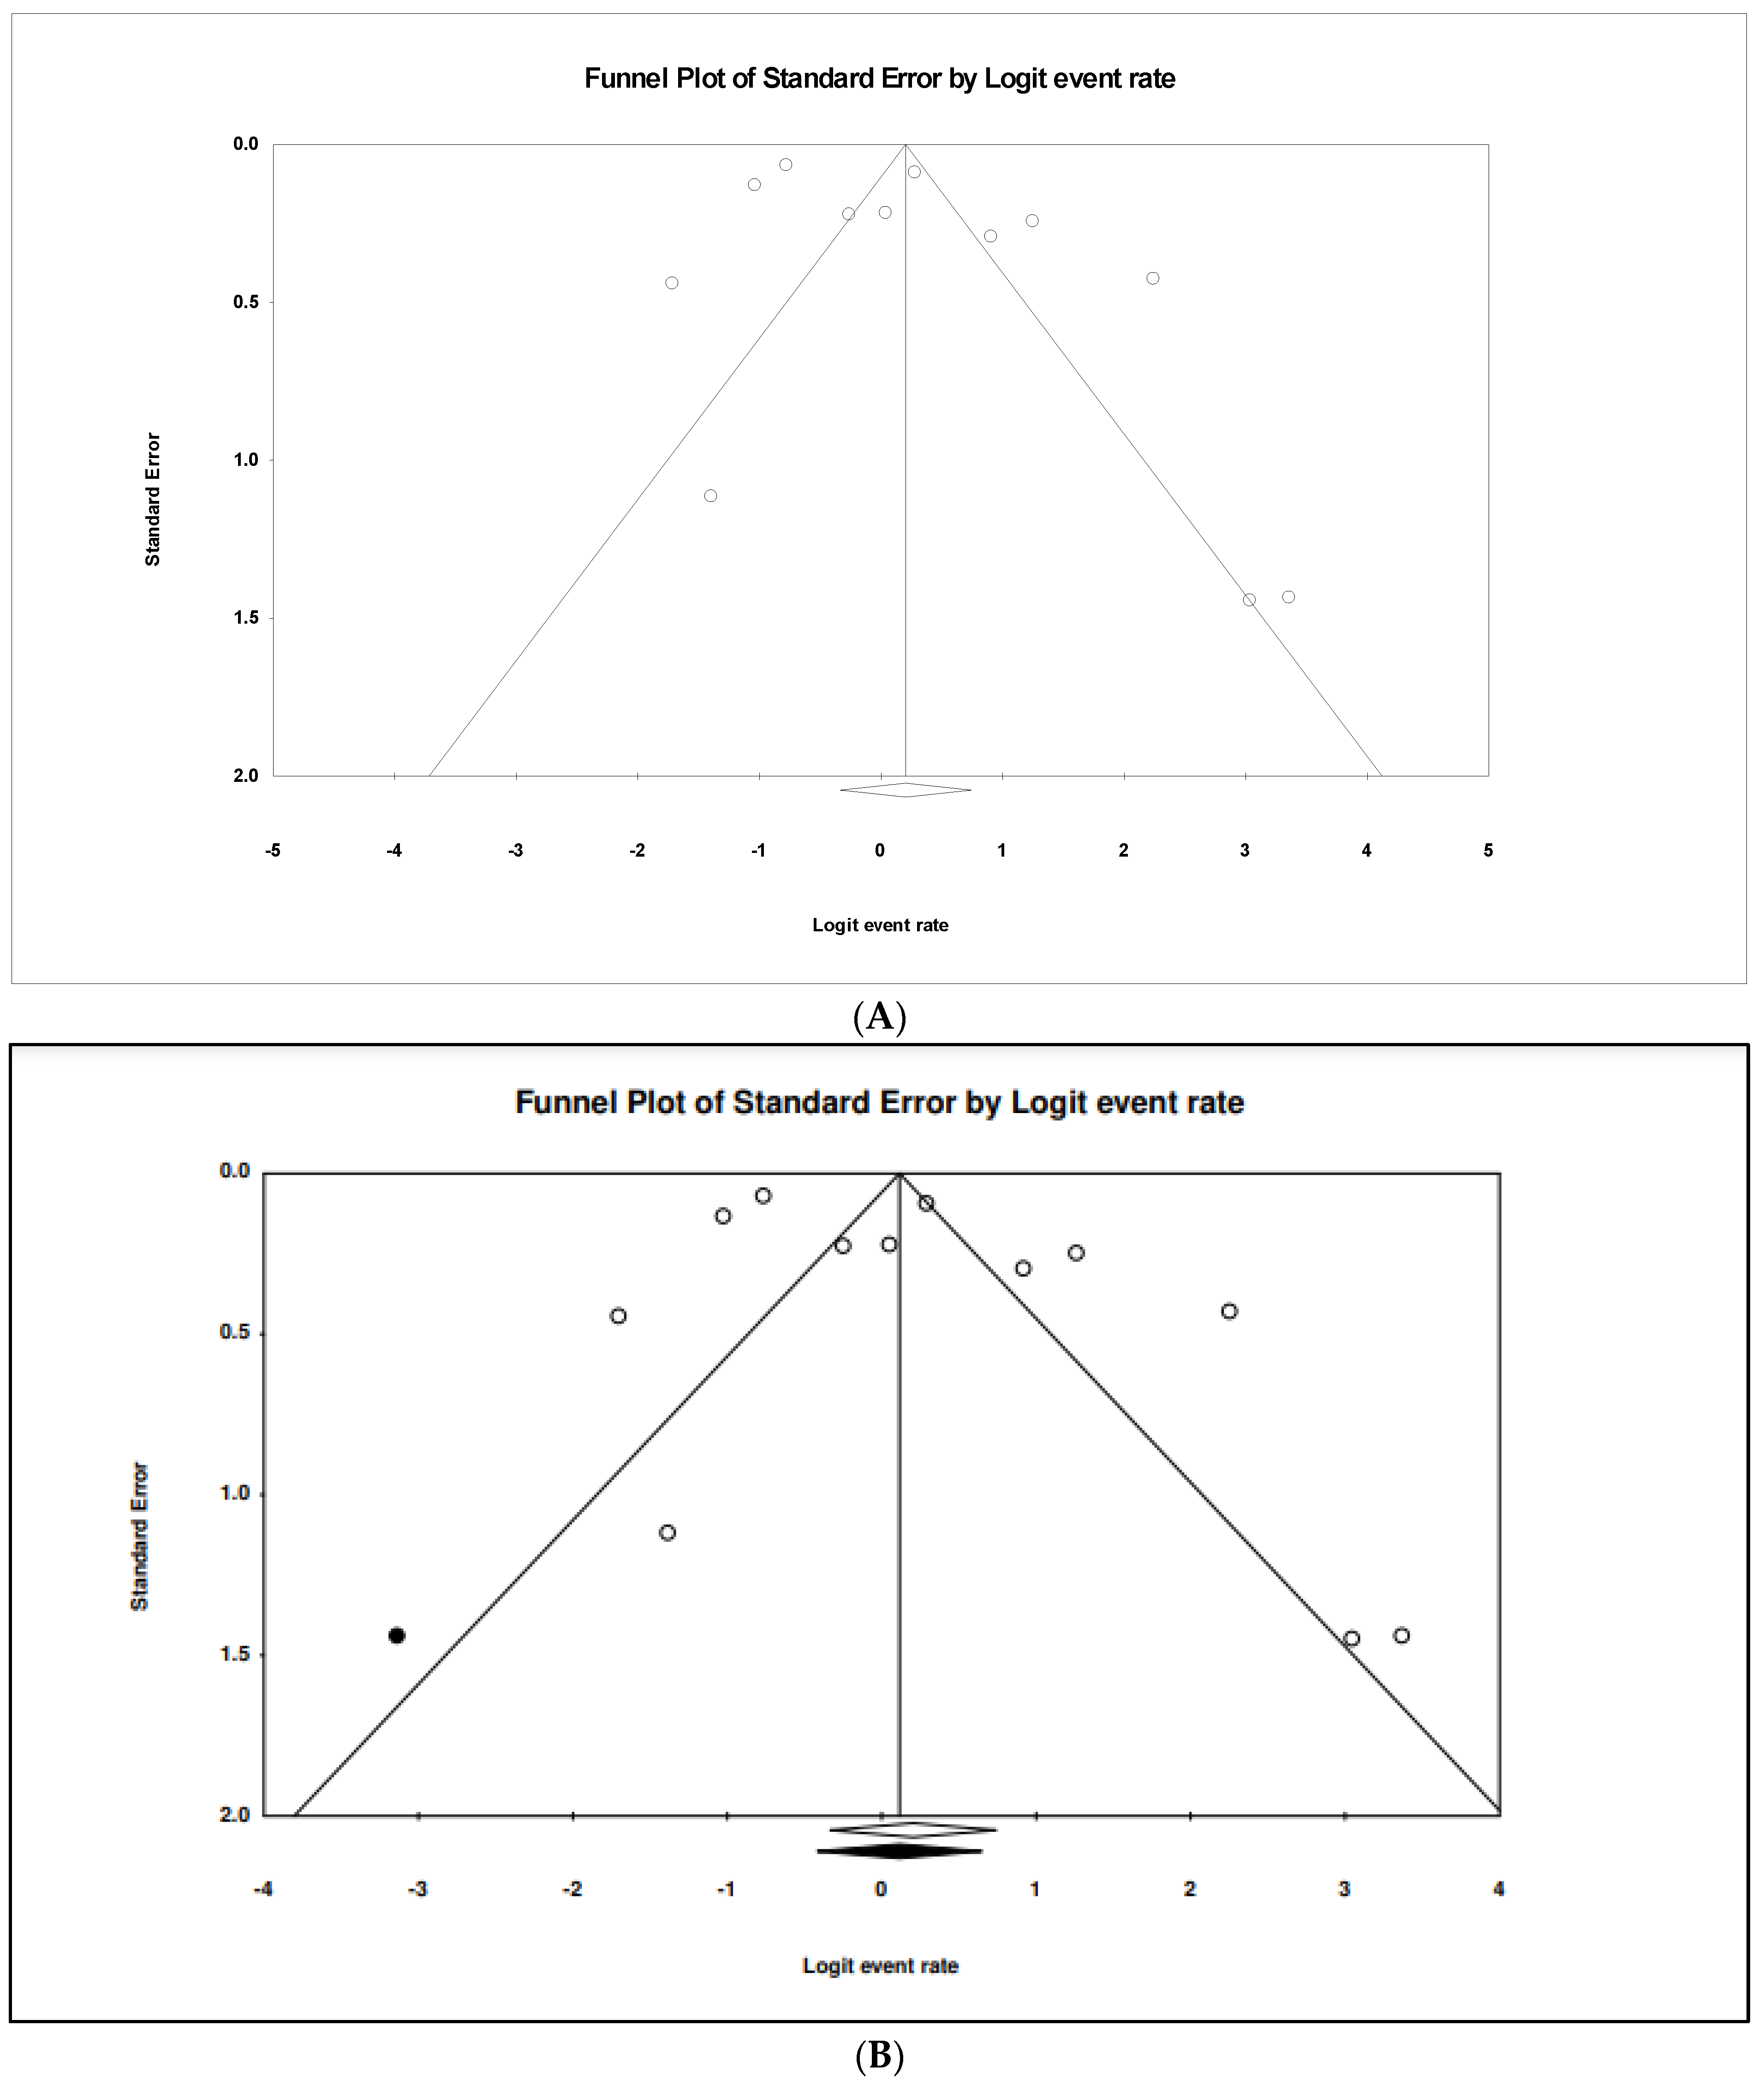
3.3. The Pooled Prevalence of Antimicrobial Resistant Strains in S. Typhi
3.4. The Pooled Prevalence of gyrA Gene in S. Typhi
3.5. The Pooled Prevalence of gyrB Gene in S. Typhi
3.6. The Pooled Prevalence of parC Gene in S. Typhi
3.7. The Pooled Prevalence of parE Gene in S. Typhi
3.8. The Pooled Prevalence of blaTEM Gene in S. Typhi
4. Discussion
5. Conclusions
Author Contributions
Funding
Institutional Review Board Statement
Informed Consent Statement
Data Availability Statement
Acknowledgments
Conflicts of Interest
Appendix A
| No. | Author | Checklist | Score | ||||||||
|---|---|---|---|---|---|---|---|---|---|---|---|
| 1 | 2 | 3 | 4 | 5 | 6 | 7 | 8 | 9 | |||
| 1 | Abbasi & Ghaznavi-Rad, 2021 [12] | YES | YES | YES | YES | YES | YES | NO | NO | YES | 7 |
| 2 | Afzal et al., 2012 [13] | YES | YES | YES | YES | NO | YES | YES | YES | NO | 7 |
| 3 | Afzal et al., 2013 [14] | YES | YES | YES | YES | NO | YES | YES | NO | YES | 7 |
| 4 | Ahsan & Rahman, 2019 [15] | YES | YES | YES | YES | NO | YES | YES | NO | YES | 7 |
| 5 | Akinyemi et al., 2011 [16] | YES | YES | YES | YES | YES | YES | YES | YES | YES | 9 |
| 6 | Akinyemi et al., 2017 [17] | YES | YES | YES | YES | YES | YES | YES | YES | YES | 9 |
| 7 | Al-Fatlawy & Al-Hadrawi, 2020 [18] | YES | YES | YES | NO | NO | YES | YES | YES | YES | 7 |
| 8 | Aljanaby & Medhat, 2017 [19] | YES | YES | YES | YES | YES | YES | YES | YES | YES | 9 |
| 9 | Al-Mayahi & Jaber, 2020 [20] | YES | YES | YES | YES | YES | YES | YES | YES | YES | 9 |
| 10 | Al-Muhanna et al., 2018 [21] | YES | YES | YES | YES | NO | YES | YES | NO | YES | 7 |
| 11 | Baucheron et al., 2014 [22] | YES | NO | YES | YES | YES | YES | YES | NO | YES | 7 |
| 12 | Brown et al., 1996 [23] | NO | NO | YES | YES | YES | YES | YES | YES | YES | 7 |
| 13 | Chattaway et al., 2021 [24] | YES | YES | YES | YES | NO | YES | YES | YES | YES | 8 |
| 14 | Dahiya et al., 2014 [25] | YES | YES | YES | NO | YES | YES | YES | YES | YES | 8 |
| 15 | Day et al., 2018 [26] | YES | YES | YES | YES | YES | YES | YES | YES | NO | 8 |
| 16 | El-Tayeb et al., 2017 [27] | YES | YES | YES | YES | YES | YES | YES | YES | YES | 9 |
| 17 | Eshaghi et al., 2020 [28] | YES | YES | YES | YES | NO | YES | YES | NO | YES | 7 |
| 18 | Gaind et al., 2006 [29] | YES | YES | YES | NO | YES | YES | YES | NO | YES | 7 |
| 19 | García et al., 2014 [30] | YES | NO | YES | YES | YES | YES | YES | NO | YES | 7 |
| 20 | García-Fernández et al., 2015 [31] | YES | YES | YES | YES | NO | YES | YES | YES | YES | 8 |
| 21 | Gopal et al., 2016 [32] | YES | YES | YES | NO | NO | YES | YES | YES | YES | 7 |
| 22 | Hassing et al., 2011 [33] | YES | YES | YES | YES | NO | YES | YES | YES | YES | 8 |
| 23 | Hassing et al., 2016 [34] | YES | YES | YES | YES | NO | YES | YES | YES | NO | 7 |
| 24 | Jacob et al., 2021 [35] | YES | YES | YES | YES | YES | YES | NO | YES | YES | 8 |
| 25 | Lima et al., 2019 [36] | YES | YES | YES | YES | YES | YES | YES | YES | YES | 9 |
| 26 | Lv, Zhang & Song, 2019 [37] | YES | YES | YES | YES | NO | YES | YES | YES | YES | 8 |
| 27 | Matono et al., 2017 [38] | YES | YES | YES | YES | YES | YES | YES | YES | YES | 9 |
| 28 | Nüesch-Inderbinen et al., 2015 [39] | YES | YES | YES | YES | NO | YES | YES | NO | YES | 7 |
| 29 | Okanda et al., 2018 [40] | YES | YES | YES | YES | NO | YES | YES | YES | YES | 8 |
| 30 | Oo et al., 2019 [41] | YES | YES | YES | YES | NO | YES | YES | NO | YES | 7 |
| 31 | Qian et al., 2020 [42] | YES | YES | YES | YES | NO | YES | YES | YES | YES | 8 |
| 32 | Saeed et al., 2020 [43] | YES | YES | YES | YES | NO | YES | YES | NO | YES | 7 |
| 33 | Shah et al., 2020 [44] | YES | YES | YES | YES | NO | YES | YES | NO | YES | 7 |
| 34 | Sharma et al., 2019 [45] | YES | YES | YES | YES | NO | YES | YES | YES | NO | 7 |
| 35 | Shirakawa et al., 2006 [46] | YES | YES | YES | YES | NO | YES | YES | YES | YES | 8 |
| 36 | Smith, Govender & Keddy, 2010 [47] | YES | YES | YES | YES | NO | YES | YES | NO | YES | 7 |
| 37 | Song et al., 2010 [48] | YES | YES | YES | YES | YES | YES | YES | YES | YES | 9 |
| 38 | Tanmoy et al., 2018 [49] | YES | YES | YES | YES | YES | YES | YES | YES | YES | 9 |
| 39 | Veeraraghavan et al., 2016 [50] | YES | YES | YES | YES | NO | YES | YES | YES | YES | 8 |
| 40 | Vlieghe et al., 2012 [51] | YES | YES | YES | YES | YES | YES | YES | YES | YES | 9 |
| 41 | Wu et al., 2010 [52] | YES | YES | YES | NO | NO | YES | YES | YES | YES | 7 |
| 42 | Yanagi et al., 2009 [53] | YES | YES | YES | YES | YES | YES | YES | NO | YES | 8 |
Appendix B
| No. | Study ID (Ref.) | Mutations (n) | |||
|---|---|---|---|---|---|
| gyrA Gene | gyrB Gene | parC Gene | parE Gene | ||
| 1 | Abbasi & Ghaznavi-Rad, 2021 [12] | S83L (3) | NA | S80I (3) | NA |
| 2 | Afzal et al., 2012 [13] | S83F (9) | NA | NA | NA |
| 3 | Baucheron et al., 2014 [22] | S83F (10), S83Y (2), D87G (1), D87N (2) | NA | S80I (1) | D420N (2) |
| 4 | Brown et al., 1996 [23] | S83F (10), D87Y (2) | NA | NA | NA |
| 5 | Chattaway et al., 2021 [24] | S83F (768), D87V (4), S83Y (119), D87G (8), D87N (131), E133G (6), A119E (1), V85A (1), D87X (1) | S464Y (9), S464F (22) | S80I (127), E84G (11), E84K (6), G78D (1), D79G (4), Y74X (1), P98X (1) | E460D (1), S458A (23) |
| 6 | Dahiya et al., 2014 [25] | S83F (13), S83Y (3), D87G (1), D87N (6) | NA | S80I (6) | NA |
| 7 | Day et al., 2018 [26] | S83F (205), S83Y (50), D87Y (4), D87G (5), D87N (42) | S464F (7) | S80I (33), E84G (2), E84K (3), G78D (2), D79G (5) | E460K (3), S458A (2), L502F (1) |
| 8 | Eshaghi et al., 2020 [28] | S83F (10) | NA | NA | NA |
| 9 | Gaind et al., 2006 [29] | S83F (5), D87N (3) | NA | S80I (4), D69E (1) | NA |
| 10 | García et al., 2014 [30] | S83F (3), D87N (3) | NA | NA | NA |
| 11 | García-Fernández et al., 2015 [31] | S83F (10), S83Y (1), D87N (3), D82N (1) | G435A (1), G435E (3), G435V (1) | S80I (2), T57S (1) | S493F (1) |
| 12 | Gopal et al., 2016 [32] | S83F (125) | NA | W106G (29) | NA |
| 13 | Hassing et al., 2011 [33] | S83F (6), S83Y (2) | NA | NA | NA |
| 14 | Hassing et al., 2016 [34] | S83F (6), S83Y (2) | NA | NA | NA |
| 15 | Jacob et al., 2021 [35] | S83F (5), D87N (4) | NA | S80I (4), E84K (1) | NA |
| 16 | Lima et al., 2019 [36] | S83F (27), S83Y (29), D87G (2), D87N (3), D538N (51), N529S (3) | S464F (4) | S80I (1), S80E (1), E84K (2) | A364V (5), L416F (1), S339L (1) |
| 17 | Lv, Zhang & Song, 2019 [37] | S83F (62), D87Y (25) | NA | NA | NA |
| 18 | Matono et al., 2017 [38] | S83F (47), D87N (33) | NA | S80I (33), E84G (4) | D420N (3) |
| 19 | Nüesch-Inderbinen et al., 2015 [39] | S83F (27), S83Y (8), D87N (7) | NA | S80I (7), E84G (1), E84K (1) | NA |
| 20 | Okanda et al., 2018 [40] | S83F (12), S83Y (6) | NA | D69A (1) | NA |
| 21 | Oo et al., 2019 [41] | S83F (39), D87N (16) | G342E (1) | S80I (16) | NA |
| 22 | Qian et al., 2020 [42] | S83F (39), S83Y (5), D87G (3), D87N (18), E133G (59), S87G (1), D79G (3) | S426G (1) | E84K (1) | I444S (5), Y434S (1) |
| 23 | Shirakawa et al., 2006 [46] | S83F (22) | NA | NA | NA |
| 24 | Smith, Govender & Keddy, 2010 [47] | S83F (1), D82G (3), A119S (1), S83A (2), S83M (1), D87C (1), A119G (1), G81S (1) | NA | S80I (1), S80F (1), S80K (1), T57A (1), T57G (1), T57S (1), S80R (3) | NA |
| 25 | Song et al., 2010 [48] | S83F (176), S83Y (27), D87G (10) | NA | NA | D420N (33) |
| 26 | Tanmoy et al., 2018 [49] | S83F (290), D87Y (2), S83Y (124), D87G (10), D87N (29), A119E (1), D538N (346), N529S (6) | S464Y (7), S464F (7) | S80I (1), E84G (1), E84K (10), D69A (2), S80R (2), T620M (1) | E460K (1), L502F (1), A364V (53), L416F (2), T447A (9), S339L (2), A365S (2) |
| 27 | Veeraraghavan et al., 2016 [50] | S83F (17), S83Y (5), D87Y (2), D87N (8) | NA | S80I (8), E84G (2), E84K (2), G72S (2) | NA |
| 28 | Vlieghe et al., 2012 [51] | S83F (18), E133G (18) | NA | NA | NA |
| 29 | Wu et al., 2010 [52] | S83F (9), D87G (1), D87N (3) | NA | NA | NA |
| 30 | Yanagi et al., 2009 [53] | D87Y (8) | NA | NA | NA |
References
- Bhandari, J.; Thada, P.K.; DeVos, E. Typhoid Fever. National Library of Medicine, 2022. Available online: https://www.ncbi.nlm.nih.gov/books/NBK557513/ (accessed on 28 May 2022).
- The Lancet Global Health. A bright future in typhoid vaccines. Lancet Glob. Health 2021, 9, e1623. [Google Scholar] [CrossRef]
- Faris, A.N.A.; Najib, M.A.; Nazri, M.N.M.; Hamzah, A.S.A.; Aziah, I.; Yusof, N.Y.; Mohamud, R.; Ismail, I.; Mustafa, F.H. Colorimetric Approach for Nucleic Acid Salmonella spp. Detection: A systematic review. Int. J. Environ. Res. Public Health 2022, 19, 10570. [Google Scholar] [CrossRef] [PubMed]
- Crump, J.A.; Sjölund-Karlsson, M.; Gordon, M.; Parry, C.M. Epidemiology, Clinical Presentation, Laboratory Diagnosis, Antimicrobial Resistance, and Antimicrobial Management of Invasive Salmonella Infections. Clin. Microbiol. Rev. 2015, 28, 901–937. [Google Scholar] [CrossRef] [PubMed]
- Asri, N.A.M.; Ahmad, S.; Mohamud, R.; Hanafi, N.M.; Zaidi, N.F.M.; Irekeola, A.A.; Shueb, R.H.; Yee, L.C.; Noor, N.M.; Mustafa, F.H.; et al. Global Prevalence of Nosocomial Multidrug-Resistant Klebsiella pneumoniae: A Systematic Review and Meta-Analysis. Antibiotics 2021, 10, 1508. [Google Scholar] [CrossRef] [PubMed]
- Ramatla, T.; Tawana, M.; Onyiche, T.E.; Lekota, K.E.; Thekisoe, O. Prevalence of antibiotic resistance in salmonella serotypes concurrently isolated from the environment, animals, and humans in South Africa: A systematic review and meta-analysis. Antibiotics 2021, 10, 1435. [Google Scholar] [CrossRef]
- Makhtar, W.R.W.W.; Bharudin, I.; Samsulrizal, N.H.; Yusof, N.Y. Whole Genome Sequencing Analysis of Salmonella enterica Serovar Typhi: History and Current Approaches. Microorganisms 2021, 9, 2155. [Google Scholar] [CrossRef]
- Ventola, C.L. The antibiotic resistance crisis: Part 1: Causes and threats. Pharm. Ther. 2015, 40, 277–283. [Google Scholar]
- Munita, J.M.; Arias, C.A. Mechanisms of Antibiotic Resistance. Microbiol. Spectrum. 2016, 4, 119–127. [Google Scholar] [CrossRef]
- Page, M.J.; Moher, D.; Bossuyt, P.M.; Boutron, I.; Hoffmann, T.C.; Mulrow, C.D.; Shamseer, L.; Tetzlaff, J.M.; Akl, E.A.; Brennan, S.E.; et al. PRISMA 2020 explanation and elaboration: Updated guidance and exemplars for reporting systematic reviews. BMJ 2021, 372, n160. [Google Scholar] [CrossRef]
- Higgins, J.P.T.; Thompson, S.G. Quantifying heterogeneity in a meta-analysis. Stat. Med. 2002, 21, 1539–1558. [Google Scholar] [CrossRef]
- Abbasi, E.; Ghaznavi-Rad, E. Quinolone resistant Salmonella species isolated from pediatric patients with diarrhea in central Iran. BMC Gastroenterol. 2021, 21, 140. [Google Scholar] [CrossRef] [PubMed]
- Afzal, A.; Sarwar, Y.; Ali, A.; Haque, A. Current status of fluoroquinolone and cephalosporin resistance in salmonella enterica serovar Typhi isolates from Faisalabad, Pakistan. Pak. J. Med. Sci. 2012, 28, 602–607. [Google Scholar]
- Afzal, A.; Sarwar, Y.; Ali, A.; Maqbool, A.; Salman, M.; Habeeb, M.A.; Haque, A. Molecular evaluation of drug resistance in clinical isolates of Salmonella enterica serovar Typhi from Pakistan. J. Infect. Dev. Ctries. 2013, 7, 929–940. [Google Scholar] [CrossRef] [PubMed][Green Version]
- Ahsan, S.; Rahman, S. Azithromycin Resistance in Clinical Isolates of Salmonella enterica Serovars Typhi and Paratyphi in Bangladesh. Microb. Drug Resist. 2019, 25, 8–13. [Google Scholar] [CrossRef]
- Akinyemi, K.; Iwalokun, B.; Foli, F.; Oshodi, K.; Coker, A. Prevalence of multiple drug resistance and screening of enterotoxin (stn) gene in Salmonella enterica serovars from water sources in Lagos, Nigeria. Public Health 2011, 125, 65–71. [Google Scholar] [CrossRef]
- Akinyemi, K.O.; Iwalokun, B.A.; Oyefolu, A.O.B.; Fakorede, C. Occurrence of extended-spectrum and AmpC β-lactamases in multiple drug resistant Salmonella isolates from clinical samples in Lagos, Nigeria. Infect. Drug Resist. 2017, 10, 19–25. [Google Scholar] [CrossRef]
- AL-Fatlawy, H.N.K.; AL-Hadrawi, H.A.N. Molecular profiling of class I integron gene in MDR Salmonella Typhi isolates. J. Pure Appl. Microbiol. 2020, 14, 1825–1833. [Google Scholar] [CrossRef]
- Aljanaby, A.A.J.; Medhat, A.R. Prevalence of Some Antimicrobials Resistance Associated-genes in Salmonella Typhi Isolated from Patients Infected with Typhoid Fever. J. Biol. Sci. 2017, 17, 171–184. [Google Scholar]
- Al-Mayahi, F.S.A.; Jaber, S.M. A preliminary study of multiple antibiotic resistance (Mar) and extensively drug-resistant (xdr) of bacterial causing typhoid fever isolated from stool specimens in al-diwaniya, iraq. EurAsian J. BioSci. 2020, 14, 2369–2378. [Google Scholar]
- Al-Muhanna, S.G.; Al-Kraety, I.A.A.; Tikki, K.A.; Zand, B. Molecular characterization of chromosomal and extra chromosomal elements related to antibiotics resistance genes in Salmonella typhi. Plant Arch. 2018, 18, 655–660. [Google Scholar]
- Baucheron, S.; Monchaux, I.; Le Hello, S.; Weill, F.-X.; Cloeckaert, A. Lack of efflux mediated quinolone resistance in Salmonella enterica serovars Typhi and Paratyphi A. Front. Microbiol. 2014, 5, 12. [Google Scholar] [CrossRef] [PubMed]
- Brown, J.C.; Shanahan, P.M.A.; Jesudason, M.V.; Thomson, C.J.; Amyes, S.G.B. Mutations responsible for reduced susceptibility to 4-quinolones in clinical isolates of multi-resistant Salmonella Typhi in India. J. Antimicrob. Chemother. 1996, 37, 891–900. [Google Scholar] [CrossRef] [PubMed]
- Chattaway, M.A.; Gentle, A.; Nair, S.; Tingley, L.; Day, M.; Mohamed, I.; Jenkins, C.; Godbole, G. Phylogenomics and antimicrobial resistance of Salmonella Typhi and Paratyphi A, B and C in England, 2016–2019. Microb. Genom. 2021, 7, 633. [Google Scholar] [CrossRef] [PubMed]
- Dahiya, S.; Kapil, A.; Lodha, R.; Kumar, R.; Das, B.K.; Sood, S.; Kabra, S. Induction of resistant mutants of Salmonella enterica serotype Typhi under ciprofloxacin selective pressure. Indian J. Med. Res. 2014, 139, 746–753. [Google Scholar]
- Day, M.R.; Doumith, M.; Nascimento, V.D.; Nair, S.; Ashton, P.M.; Jenkins, C.; Dallman, T.J.; Stevens, F.J.; Freedman, J.; Hopkins, K.; et al. Comparison of phenotypic and WGS-derived antimicrobial resistance profiles of Salmonella enterica serovars Typhi and Paratyphi. J. Antimicrob. Chemother. 2017, 73, 365–372. [Google Scholar] [CrossRef]
- El-Tayeb, M.A.; Ibrahim, A.S.S.; Al-Salamah, A.A.; Almaary, K.S.; Elbadawi, Y.B. Prevalence, serotyping and antimicrobials resistance mechanism of Salmonella enterica isolated from clinical and environmental samples in Saudi Arabia. Braz. J. Microbiol. 2017, 48, 499–508. [Google Scholar] [CrossRef]
- Eshaghi, A.; Zittermann, S.; Bharat, A.; Mulvey, M.R.; Allen, V.G.; Patel, S.N. Importation of extensively drug-resistant Salmonella enterica serovar typhi casess in Ontario, Canada. Antimicrob. Agents Chemother. 2020, 64, 2581–2619. [Google Scholar] [CrossRef]
- Gaind, R.; Paglietti, B.; Murgia, M.; Dawar, R.; Uzzau, S.; Cappuccinelli, P.; Deb, M.; Aggarwal, P.; Rubino, S. Molecular characterization of ciprofloxacin-resistant Salmonella enterica serovar Typhi and Paratyphi A causing enteric fever in India. J. Antimicrob. Chemother. 2006, 58, 1139–1144. [Google Scholar] [CrossRef]
- García, C.; Lejon, V.; Horna, G.; Astocondor, L.; Vanhoof, R.; Bertrand, S.; Jacobs, J. Intermediate Susceptibility to Ciprofloxacin among Salmonella enterica Serovar Typhi Isolates in Lima, Peru. J. Clin. Microbiol. 2014, 52, 968–970. [Google Scholar] [CrossRef]
- García-Fernández, A.; Gallina, S.; Owczarek, S.; Dionisi, A.M.; Benedetti, I.; Decastelli, L.; Luzzi, I. Emergence of Ciprofloxacin-Resistant Salmonella enterica Serovar Typhi in Italy. PLoS ONE 2015, 10, e0132065. [Google Scholar] [CrossRef]
- Gopal, M.; Elumalai, S.; Arumugam, S.; Durairajpandian, V.; Kannan, M.A.; Selvam, E.; Seetharaman, S. GyrA ser83 and ParC trp106 Mutations in Salmonella enterica Serovar Typhi Isolated from Typhoid Fever Patients in Tertiary Care Hospital. J. Clin. Diagn. Res. 2016, 10, DC14–DC18. [Google Scholar] [CrossRef] [PubMed]
- Hassing, R.-J.; Menezes, G.A.; van Pelt, W.; Petit, P.L.; van Genderen, P.J.; Goessens, W.H. Analysis of mechanisms involved in reduced susceptibility to ciprofloxacin in Salmonella enterica serotypes Typhi and Paratyphi A isolates from travellers to Southeast Asia. Int. J. Antimicrob. Agents 2011, 37, 240–243. [Google Scholar] [CrossRef] [PubMed][Green Version]
- Hassing, R.-J.; Goessens, W.H.; Zeneyedpour, L.; Sultan, S.; van Kampen, J.J.; Verbon, A.; van Genderen, P.J.; Hays, J.P.; Luider, T.M.; Dekker, L.J. Detection of amino acid substitutions in the GyrA protein of fluoroquinolone-resistant typhoidal Salmonella isolates using high-resolution mass spectrometry. Int. J. Antimicrob. Agents 2016, 47, 351–356. [Google Scholar] [CrossRef]
- Jacob, J.J.; Pragasam, A.K.; Vasudevan, K.; Veeraraghavan, B.; Kang, G.; John, J.; Nagvekar, V.; Mutreja, A. Salmonella Typhi acquires diverse plasmids from other Enterobacteriaceae to develop cephalosporin resistance. Genomics 2021, 113, 2171–2176. [Google Scholar] [CrossRef]
- Lima, N.C.B.; Tanmoy, A.M.; Westeel, E.; de Almeida, L.G.P.; Rajoharison, A.; Islam, M.; Endtz, H.P.; Saha, S.K.; de Vasconcelos, A.T.R.; Komurian-Pradel, F. Analysis of isolates from Bangladesh highlights multiple ways to carry resistance genes in Salmonella Typhi. BMC Genom. 2019, 20, 530. [Google Scholar] [CrossRef] [PubMed]
- Lv, D.; Zhang, D.; Song, Q. Expansion of Salmonella Typhi clonal lineages with ampicillin resistance and reduced ciprofloxacin susceptibility in Eastern China. Infect. Drug Resist. 2019, 12, 2215–2221. [Google Scholar] [CrossRef] [PubMed]
- Matono, T.; Morita, M.; Yahara, K.; Lee, K.-I.; Izumiya, H.; Kaku, M.; Ohnishi, M. Emergence of resistance mutations in salmonella enterica serovar typhi against fluoroquinolones. Open Forum Infect. Dis. 2017, 4, ofx230. [Google Scholar] [CrossRef]
- Nüesch-Inderbinen, M.; Abgottspon, H.; Sägesser, G.; Cernela, N.; Stephan, R. Antimicrobial susceptibility of travel-related Salmonella enterica serovar Typhi isolates detected in Switzerland (2002–2013) and molecular characterization of quinolone resistant isolates. BMC Infect. Dis. 2015, 15, 212. [Google Scholar] [CrossRef]
- Okanda, T.; Haque, A.; Ehara, T.; Huda, Q.; Ohkusu, K.; Miah, R.A.; Matsumoto, T. Characteristics of Resistance Mechanisms and Molecular Epidemiology of Fluoroquinolone-Nonsusceptible Salmonella enterica Serovar Typhi and Paratyphi A Isolates from a Tertiary Hospital in Dhaka, Bangladesh. Microb. Drug Resist. 2018, 24, 1460–1465. [Google Scholar] [CrossRef]
- Oo, K.M.; Myat, T.O.; Htike, W.W.; Biswas, A.; Hannaway, R.F.; Murdoch, D.R.; A Crump, J.; E Ussher, J. Molecular mechanisms of antimicrobial resistance and phylogenetic relationships of Salmonella enterica isolates from febrile patients in Yangon, Myanmar. Trans. R. Soc. Trop. Med. Hyg. 2019, 113, 641–648. [Google Scholar] [CrossRef]
- Qian, H.; Cheng, S.; Liu, G.; Tan, Z.; Dong, C.; Bao, J.; Hong, J.; Jin, D.; Bao, C.; Gu, B. Discovery of seven novel mutations of gyrB, parC and parE in Salmonella Typhi and Paratyphi strains from Jiangsu Province of China. Sci. Rep. 2020, 10, 7359. [Google Scholar] [CrossRef] [PubMed]
- Saeed, M.; Rasool, M.H.; Rasheed, F.; Saqalein, M.; Nisar, M.A.; Imran, A.A.; Tariq, S.; Amir, A.; Ikram, A.; Khurshid, M. Extended-spectrum beta-lactamases producing extensively drug-resistant Salmonella Typhi in Punjab, Pakistan. J. Infect. Dev. Ctries 2020, 14, 169–176. [Google Scholar] [CrossRef] [PubMed]
- Shah, A.; Anjum, A.; Yousaf, A.; Kabir, M.; Alam, S.; Siddique, S.; Hussain, A. Risk assessment of multidrug resistance in salmonella enterica serovar typhi associated with avian environment. Fresenius Environ. Bull. 2020, 29, 5540–5552. [Google Scholar]
- Sharma, P.; Kumari, B.; Dahiya, S.; Kulsum, U.; Kumar, S.; Manral, N.; Pandey, S.; Kaur, P.; Sood, S.; Das, B.K.; et al. Azithromycin resistance mechanisms in typhoidal salmonellae in India: A 25 years analysis. Indian J. Med. Res. 2019, 149, 404–411. [Google Scholar] [CrossRef] [PubMed]
- Shirakawa, T.; Acharya, B.; Kinoshita, S.; Kumagai, S.; Gotoh, A.; Kawabata, M. Decreased susceptibility to fluoroquinolones and gyrA gene mutation in the Salmonella enterica serovar Typhi and Paratyphi A isolated in Katmandu, Nepal, in 2003. Diagn. Microbiol. Infect. Dis. 2006, 54, 299–303. [Google Scholar] [CrossRef] [PubMed]
- Smith, A.M.; Govender, N.; Keddy, K.H. Quinolone-resistant Salmonella Typhi in South Africa, 2003–2007. Epidemiol. Infect. 2010, 138, 86–90. [Google Scholar] [CrossRef]
- Song, Y.; Roumagnac, P.; Weill, F.-X.; Wain, J.; Dolecek, C.; Mazzoni, C.J.; Holt, K.E.; Achtman, M. A multiplex single nucleotide polymorphism typing assay for detecting mutations that result in decreased fluoroquinolone susceptibility in Salmonella enterica serovars Typhi and Paratyphi A. J. Antimicrob. Chemother. 2010, 65, 1631–1641. [Google Scholar] [CrossRef]
- Tanmoy, A.M.; Westeel, E.; De Bruyne, K.; Goris, J.; Rajoharison, A.; Sajib, M.S.I.; van Belkum, A.; Saha, S.K.; Komurian-Pradel, F.; Endtz, H.P. Salmonella enterica Serovar Typhi in Bangladesh: Exploration of Genomic Diversity and Antimicrobial Resistance. mBio 2018, 9, e02112-18. [Google Scholar] [CrossRef]
- Veeraraghavan, B.; Anandan, S.; Muthuirulandi Sethuvel, D.P.; Puratchiveeran, N.; Walia, K.; Devanga Ragupathi, N.K. Molecular Characterization of Intermediate Susceptible Typhoidal Salmonella to Ciprofloxacin, and its Impact. Mol. Diagn. Ther. 2016, 20, 213–219. [Google Scholar] [CrossRef]
- Vlieghe, E.R.; Phe, T.; De Smet, B.; Veng, C.H.; Kham, C.; Bertrand, S.; Vanhoof, R.; Lynen, L.; Peetermans, W.E.; Jacobs, J.A. Azithromycin and Ciprofloxacin Resistance in Salmonella Bloodstream Infections in Cambodian Adults. PLoS Negl. Trop. Dis. 2012, 6, e1933. [Google Scholar] [CrossRef]
- Wu, W.; Wang, H.; Lu, J.; Wu, J.; Chen, M.; Xu, Y.; Lu, Y. Genetic Diversity of Salmonella enteric serovar Typhi and Paratyphi in Shenzhen, China from 2002 through 2007. BMC Microbiol. 2010, 10, 32. [Google Scholar] [CrossRef] [PubMed]
- Yanagi, D.; de Vries, G.C.; Rahardjo, D.; Alimsardjono, L.; Wasito, E.B.; De, I.; Kinoshita, S.; Hayashi, Y.; Hotta, H.; Osawa, R.; et al. Emergence of fluoroquinolone-resistant strains of Salmonella enterica in Surabaya, Indonesia. Diagn. Microbiol. Infect. Dis. 2009, 64, 422–426. [Google Scholar] [CrossRef] [PubMed]
- Page, M.J.; Higgins, J.P.; Sterne, J.A. Assessing risk of bias due to missing results in a synthesis. In Cochrane Handbook for Systematic Reviews of Interventions Version 6.3, 2nd ed.; Higgins, J., Thomas, J., Chandler, J., Cumpston, M., Li, T., Page, M., Welch, V., Eds.; John Wiley & Sons: Chichester, UK, 2020; Chapter 13; Available online: www.training.cochrane.org/handbook (accessed on 30 August 2022).
- Browne, A.J.; Kashef Hamadani, B.H.; Kumaran, E.A.P.; Rao, P.; Longbottom, J.; Harriss, E.; Moore, C.E.; Dunachie, S.; Basnyat, B.; Baker, S.; et al. Drug-resistant enteric fever worldwide, 1990 to 2018: A systematic review and meta-analysis. BMC Med. 2020, 18, 1. [Google Scholar] [CrossRef]
- Katiyar, A.; Sharma, P.; Dahiya, S.; Singh, H.; Kapil, A.; Kaur, P. Genomic profiling of antimicrobial resistance genes in clin-ical isolates of Salmonella Typhi from patients infected with Typhoid fever in India. Sci. Rep. 2020, 10, 8299. [Google Scholar] [CrossRef]
- Redgrave, L.S.; Sutton, S.B.; Webber, M.A.; Piddock, L.J.V. Fluoroquinolone resistance: Mechanisms, impact on bacteria, and role in evolutionary success. Trends Microbiol. 2014, 22, 438–445. [Google Scholar] [CrossRef] [PubMed]
- Aldred, K.J.; Kerns, R.J.; Osheroff, N. Mechanism of Quinolone Action and Resistance. Biochemistry 2014, 53, 1565–1574. [Google Scholar] [CrossRef]
- Nouri, R.; Rezaee, M.A.; Hasani, A.; Aghazadeh, M. The role of gyrA and parC mutations in fluoroquinolones-resistant Pseudomonas aeruginosa isolates from Iran. Braz. J. Microbiol. 2016, 47, 925–930. [Google Scholar] [CrossRef] [PubMed]
- Ghazaei, C. Phenotypic and Molecular Detection of β-lactamase Genes blaTEM, blaCTX, and blaSHV Produced by Salmonella spp. Isolated from Poultry Meat. Gene Cell Tissue 2018, 5, e84367. [Google Scholar] [CrossRef]
- Rice, L.B. Mechanisms of Resistance and Clinical Relevance of Resistance to β-Lactams, Glycopeptides, and Fluoroquinolones. Mayo Clin. Proc. 2012, 87, 198–208. [Google Scholar] [CrossRef]
- Tang, S.S.; Apisarnthanarak, A.; Hsu, L.Y. Mechanisms of β-lactam antimicrobial resistance and epidemiology of major community- and healthcare-associated multidrug-resistant bacteria. Adv. Drug Deliv. Rev. 2014, 78, 3–13. [Google Scholar] [CrossRef]
- Tadesse, G.; Tessema, T.S.; Beyene, G.; Aseffa, A. Molecular epidemiology of fluoroquinolone resistant Salmonella in Africa: A systematic review and meta-analysis. PLoS ONE 2018, 13, e0192575. [Google Scholar] [CrossRef]
- Nguyen, K.V.; Nguyen, T.V.; Nguyen, H.T.T.; Le, D.V. Mutations in the gyrA, parC, and mexR genes provide functional insights into the fluoroquinolone-resistant Pseudomonas aeruginosa isolated in Vietnam. Infect. Drug Resist. 2018, 11, 275–282. [Google Scholar] [CrossRef] [PubMed]
- Fukushima, K.; Saito, T.; Kohyama, A.; Watanabe, K. Increased Quinolone-Resistant Mutations of gyrA and parC Genes after Pouchitis Treatment with Ciprofloxacin. Dig. Surg. 2020, 37, 321–330. [Google Scholar] [CrossRef] [PubMed]
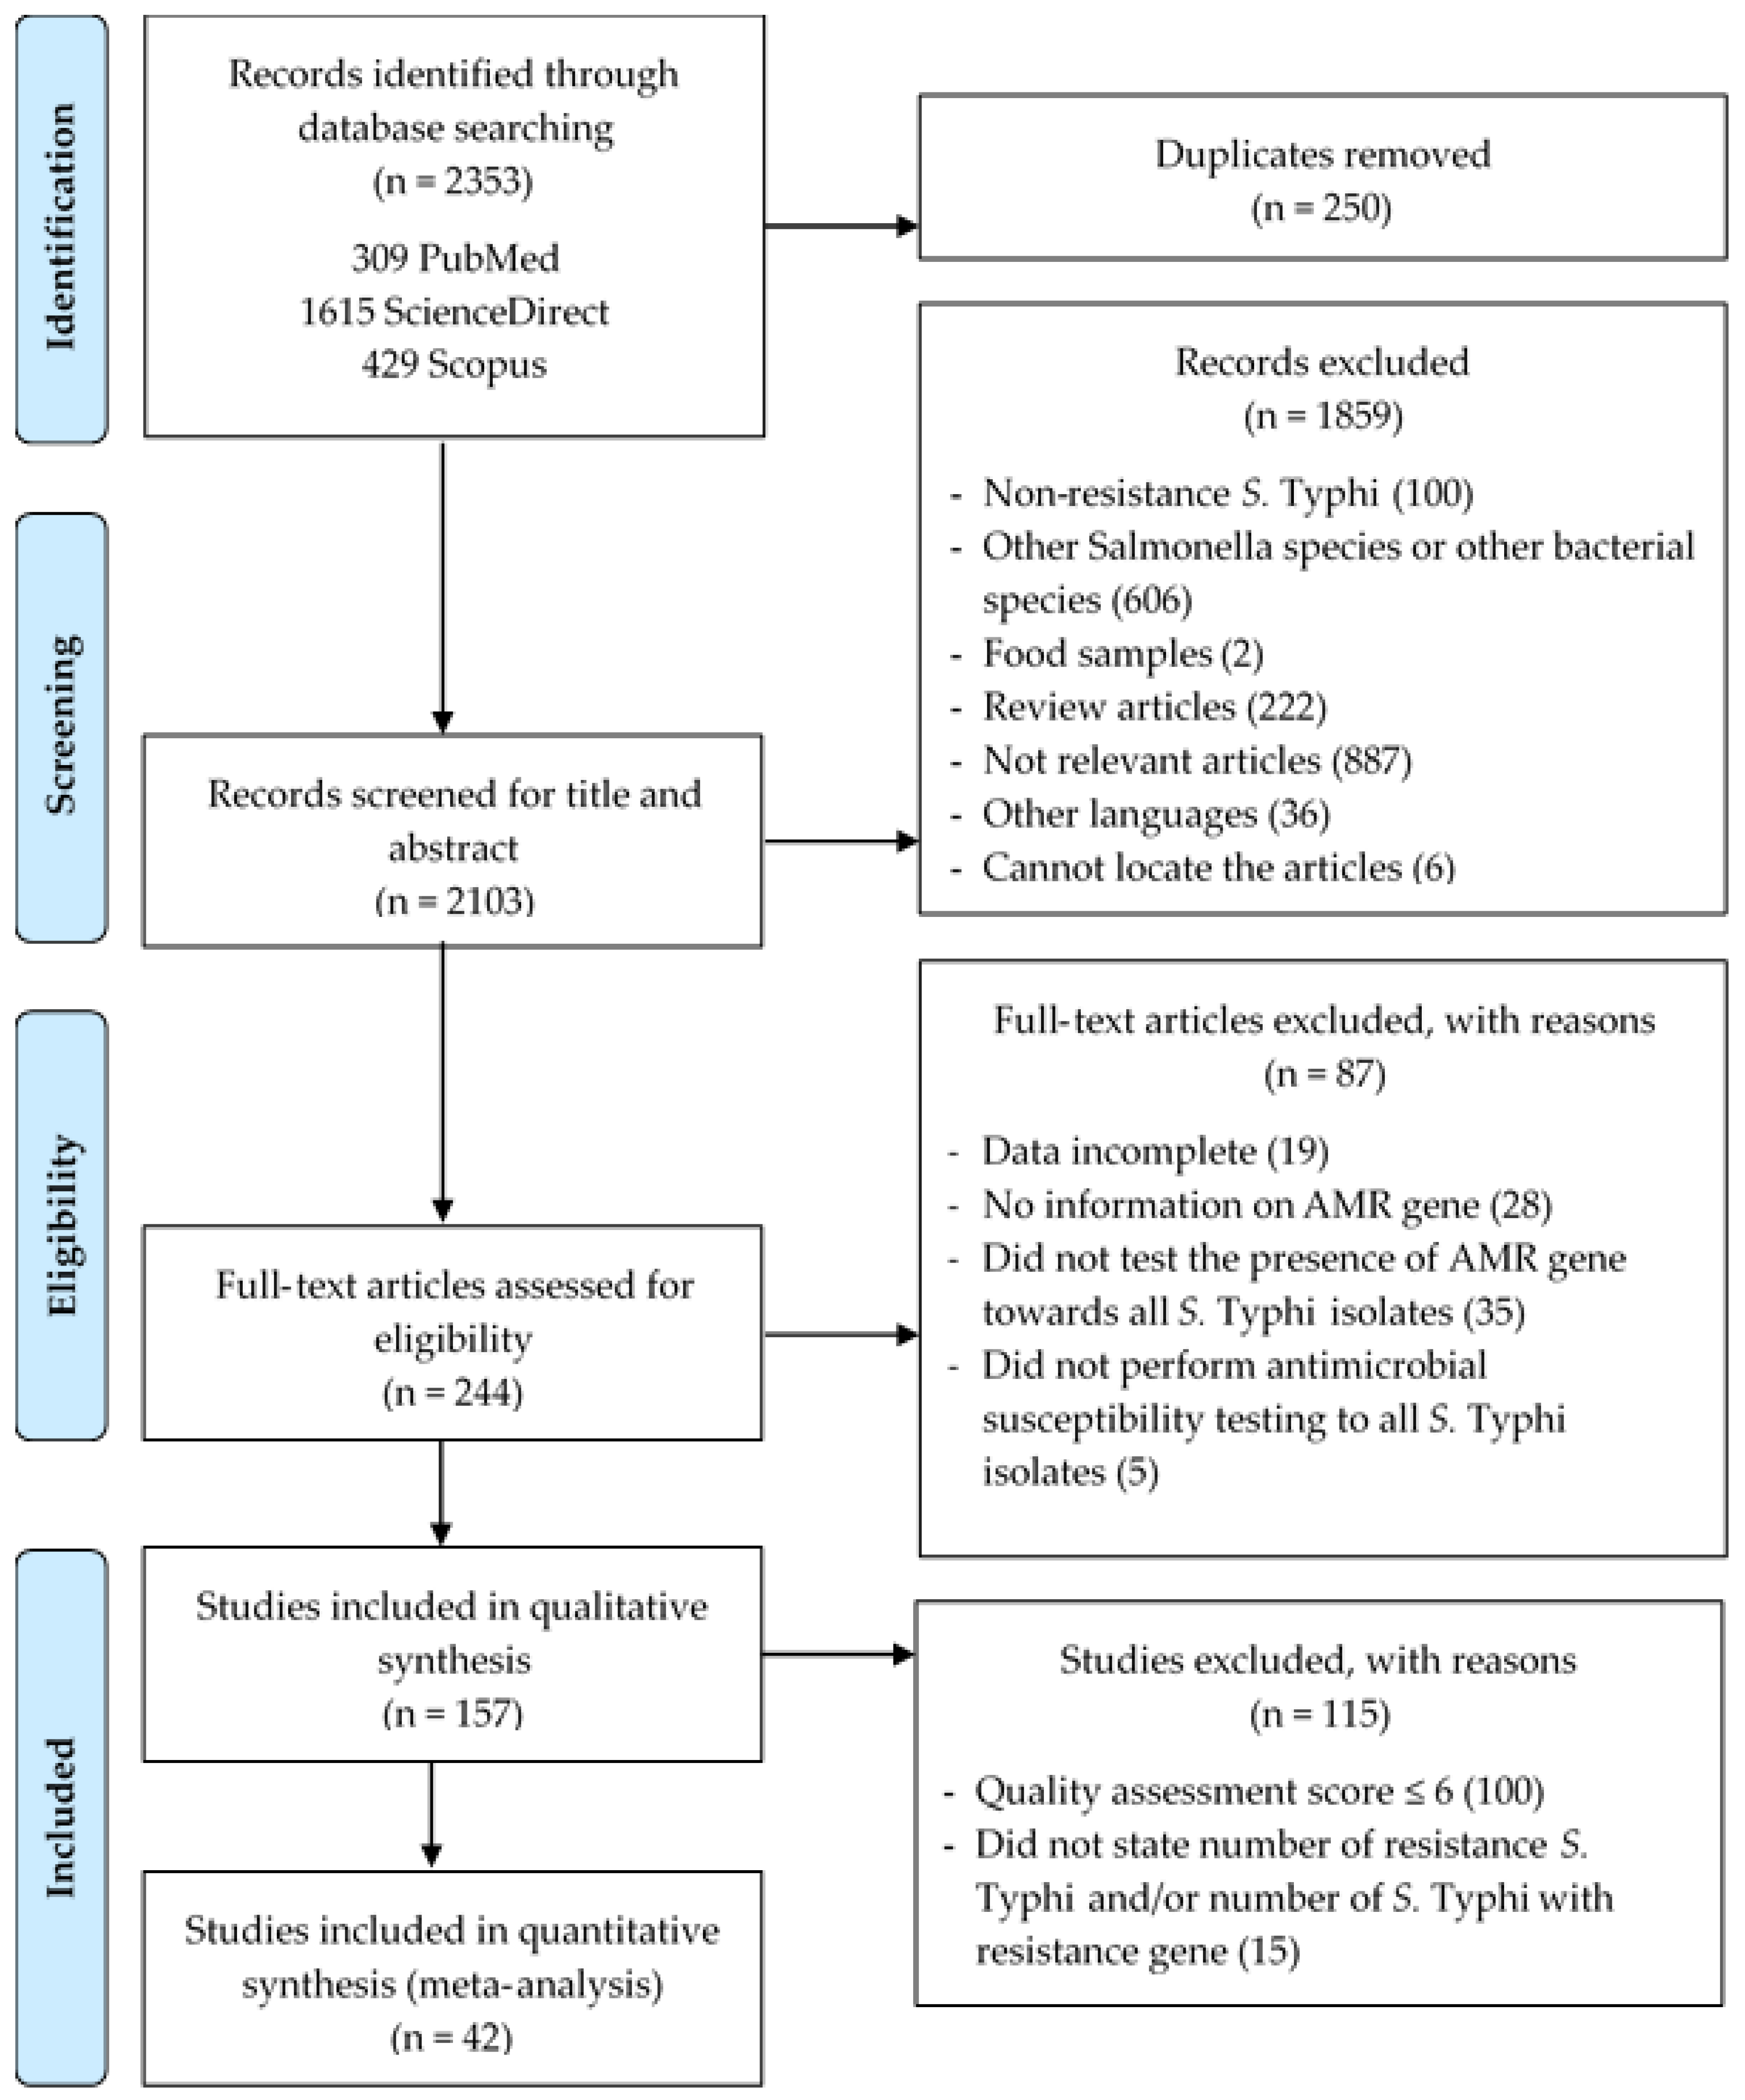
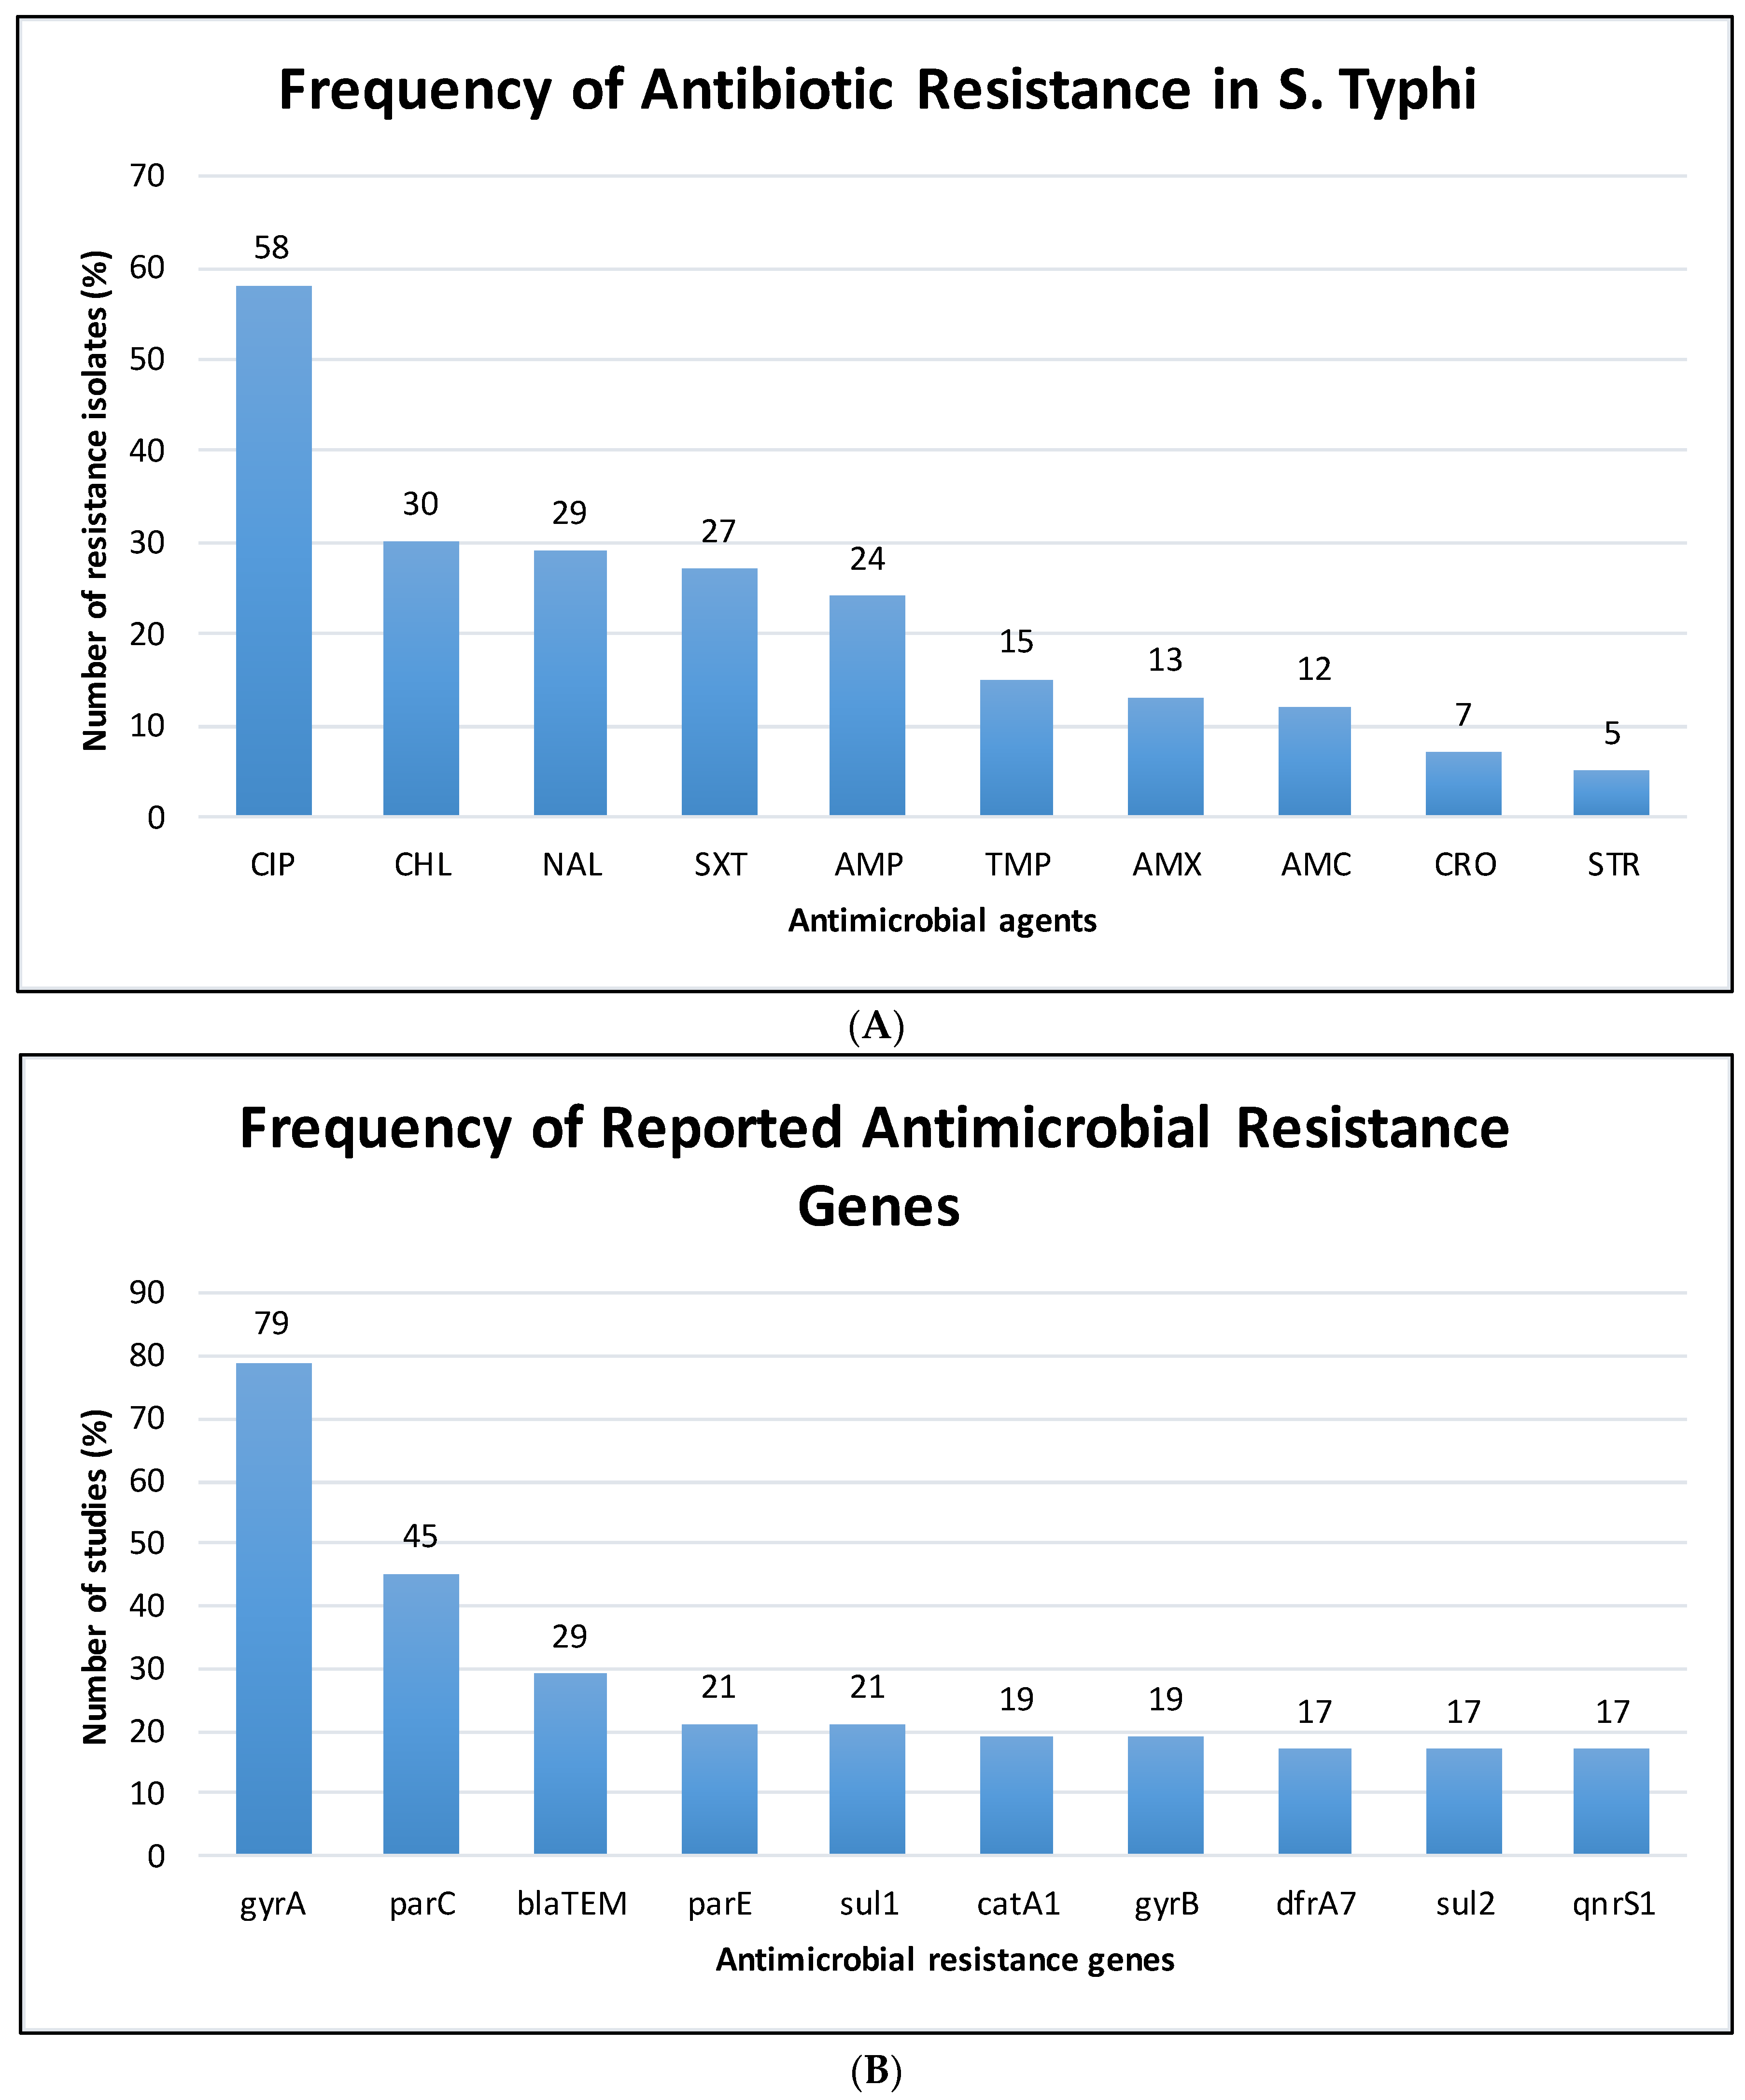


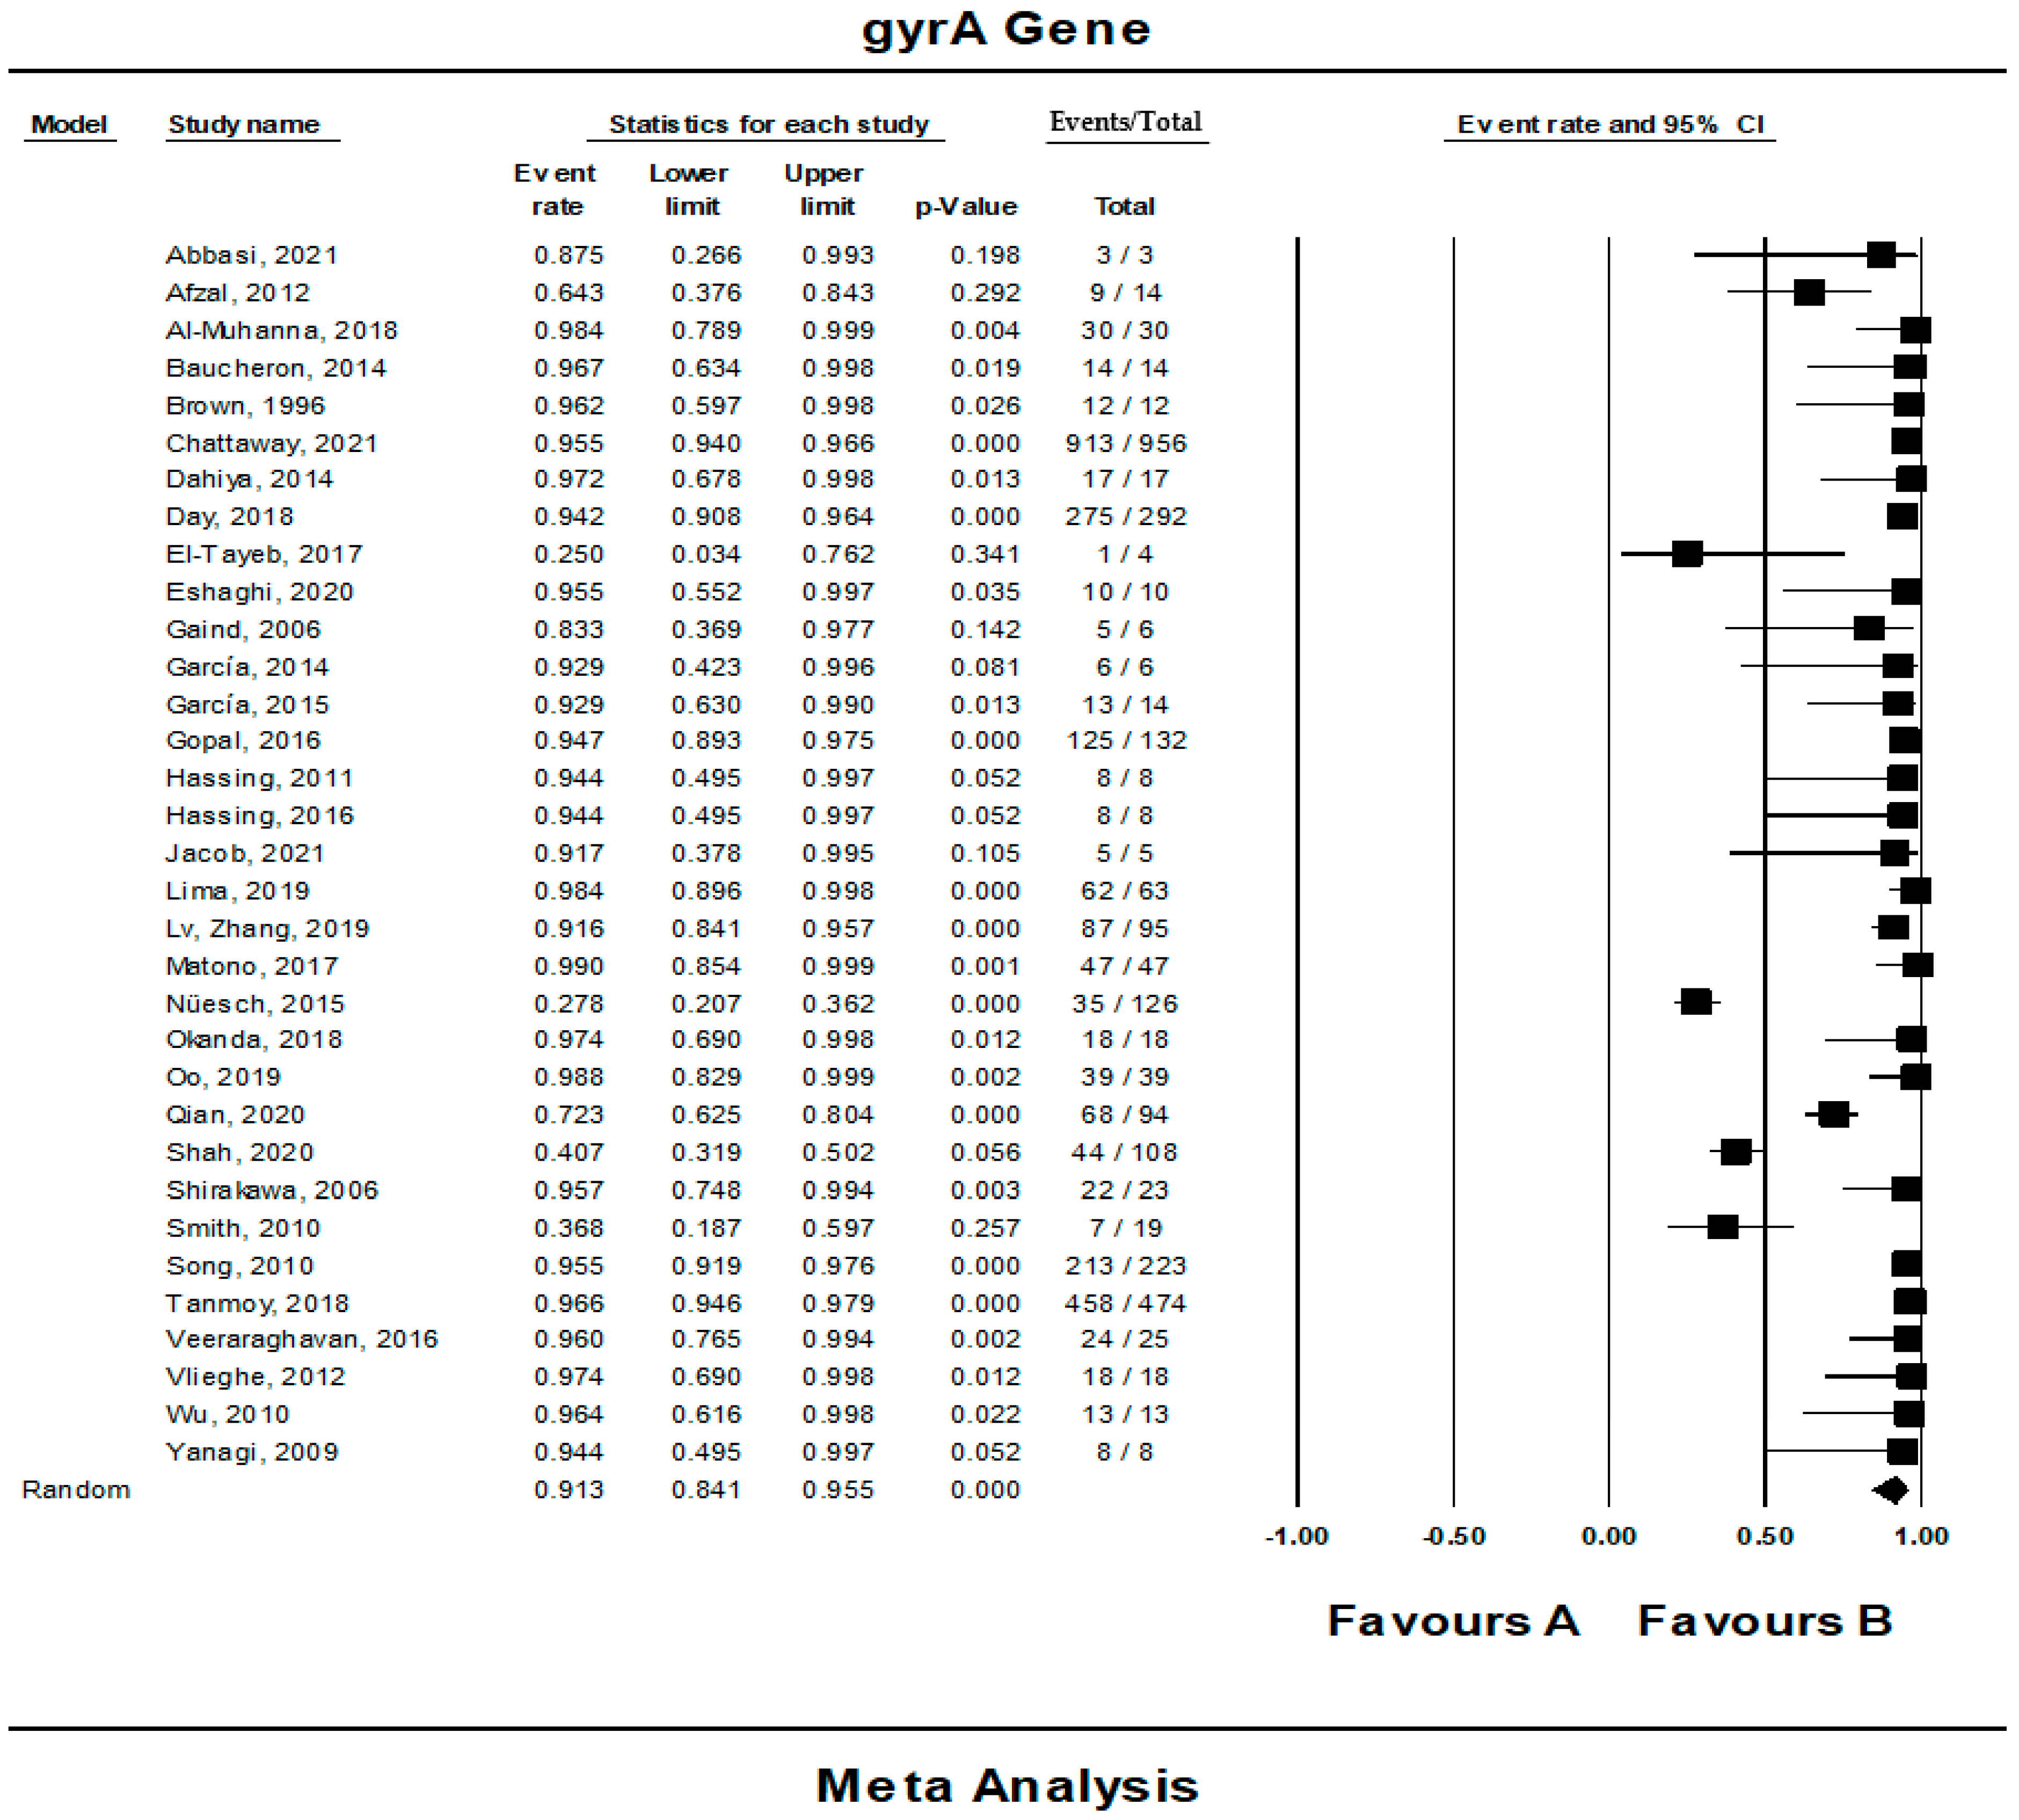
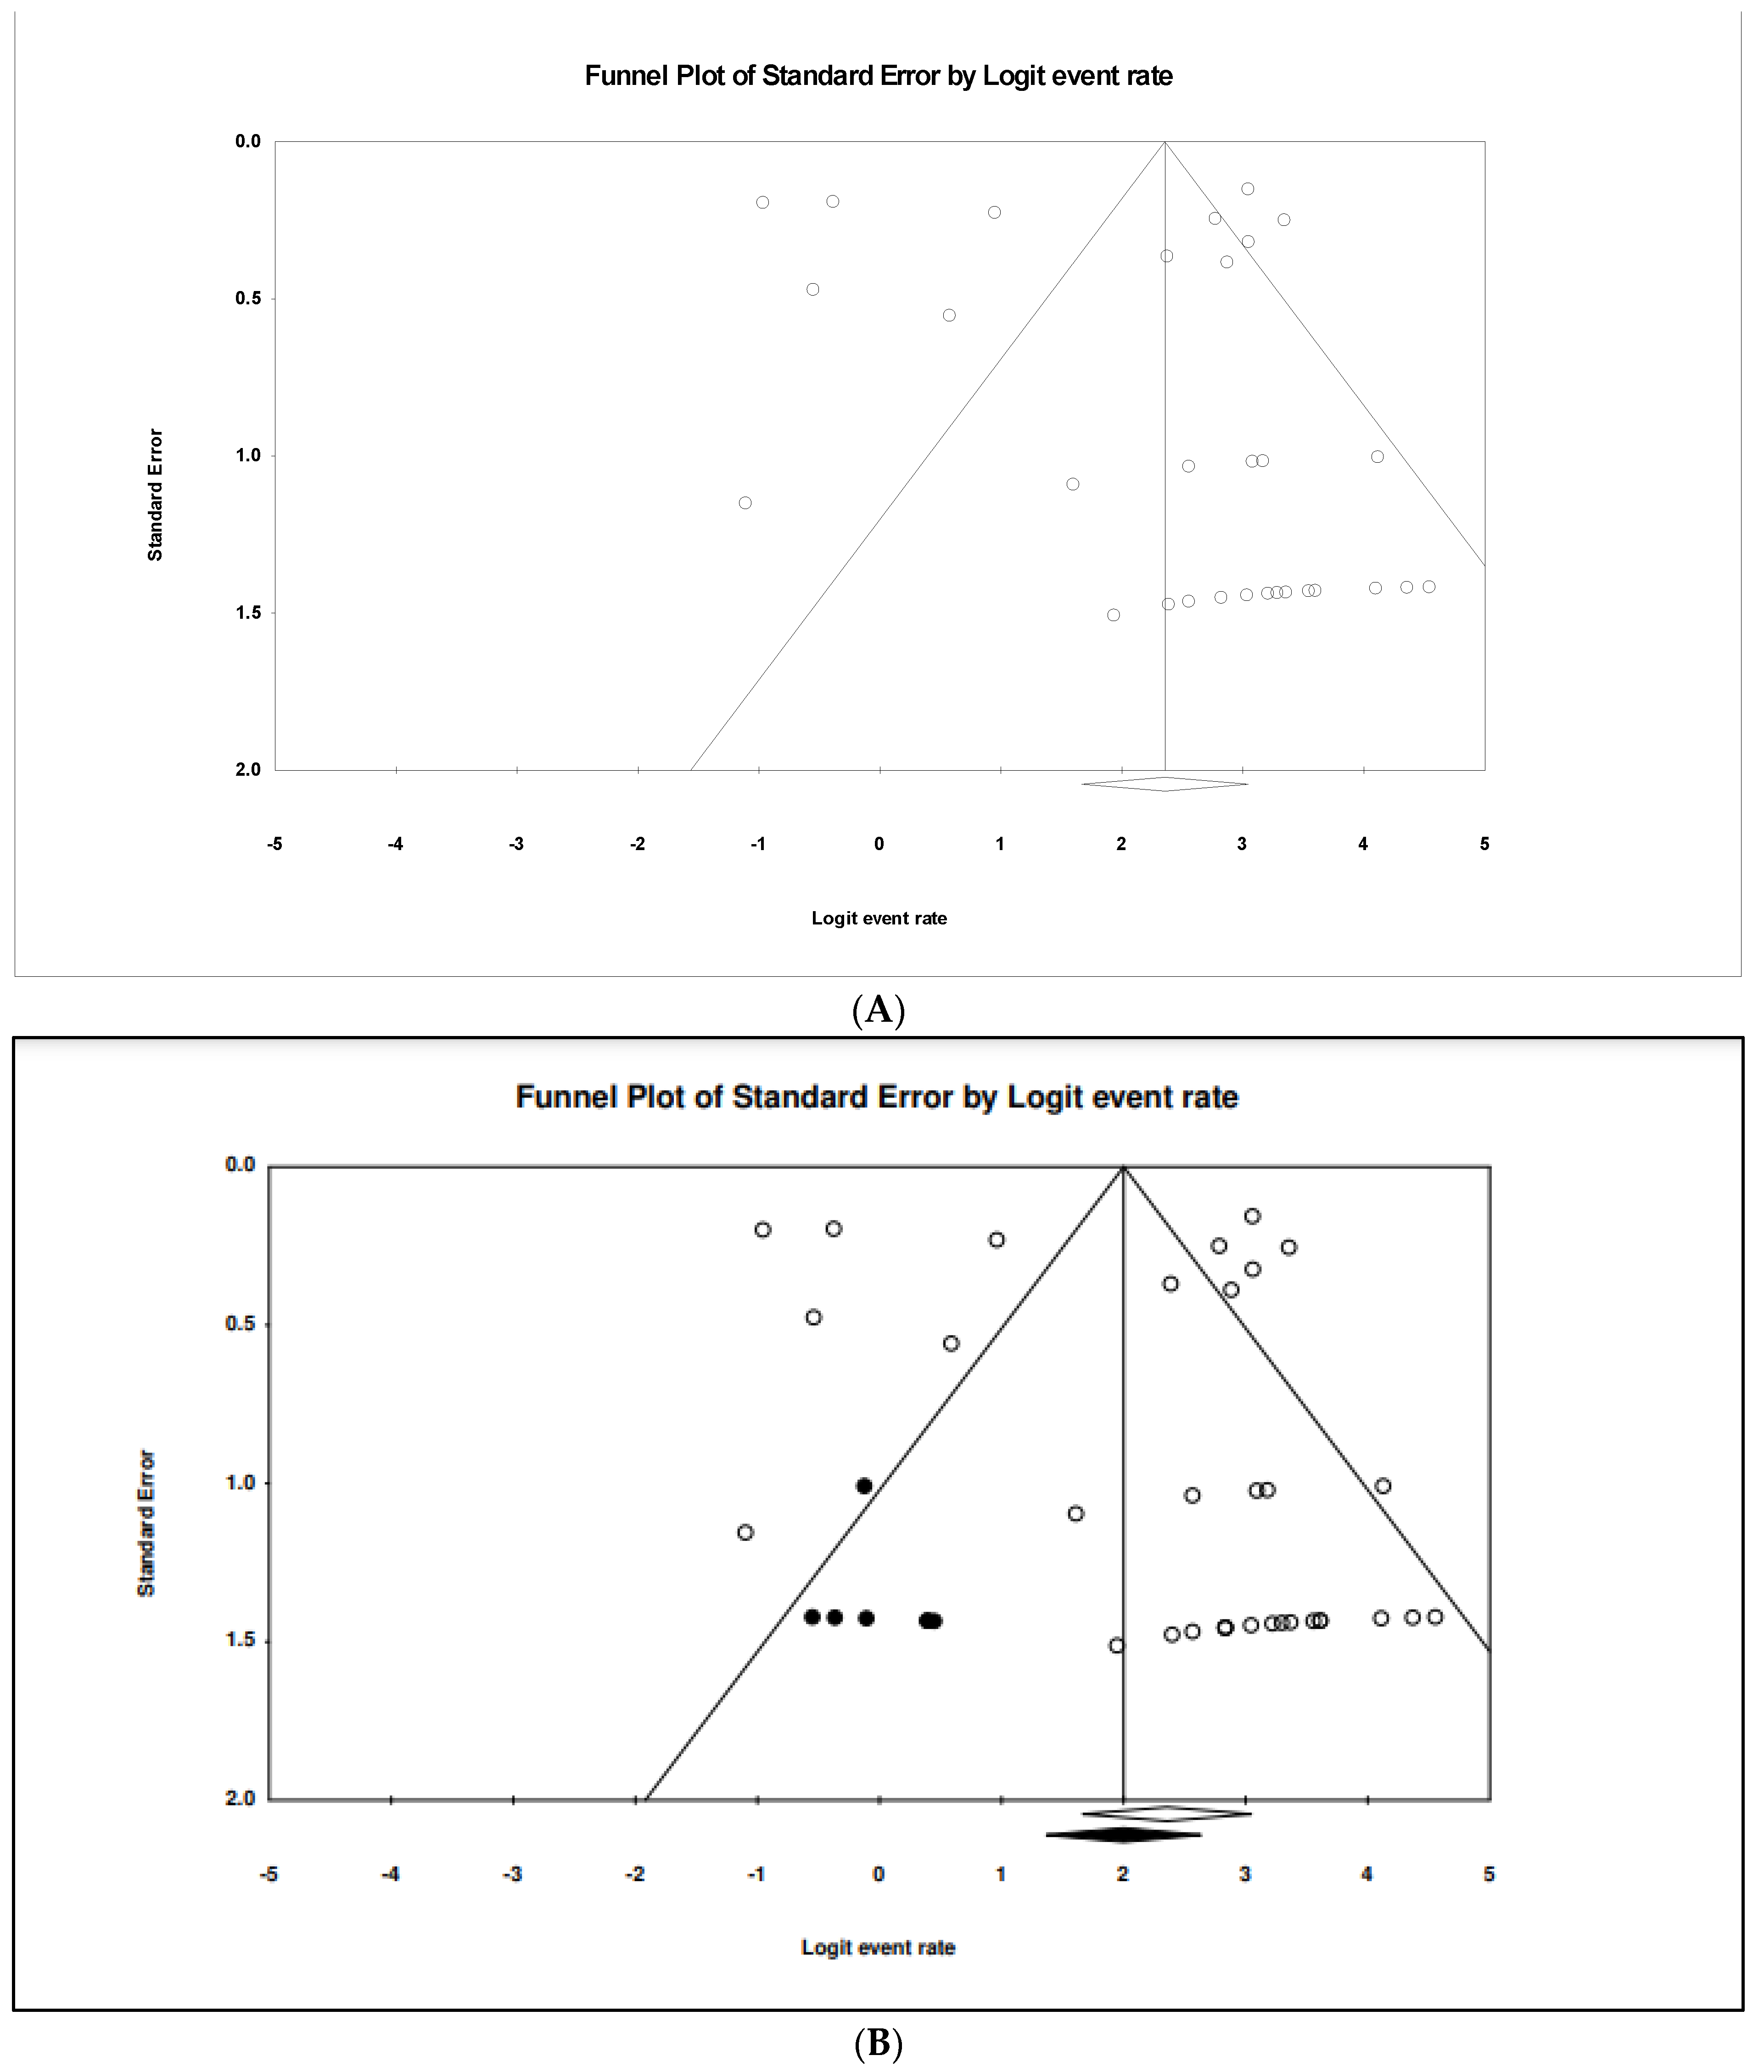

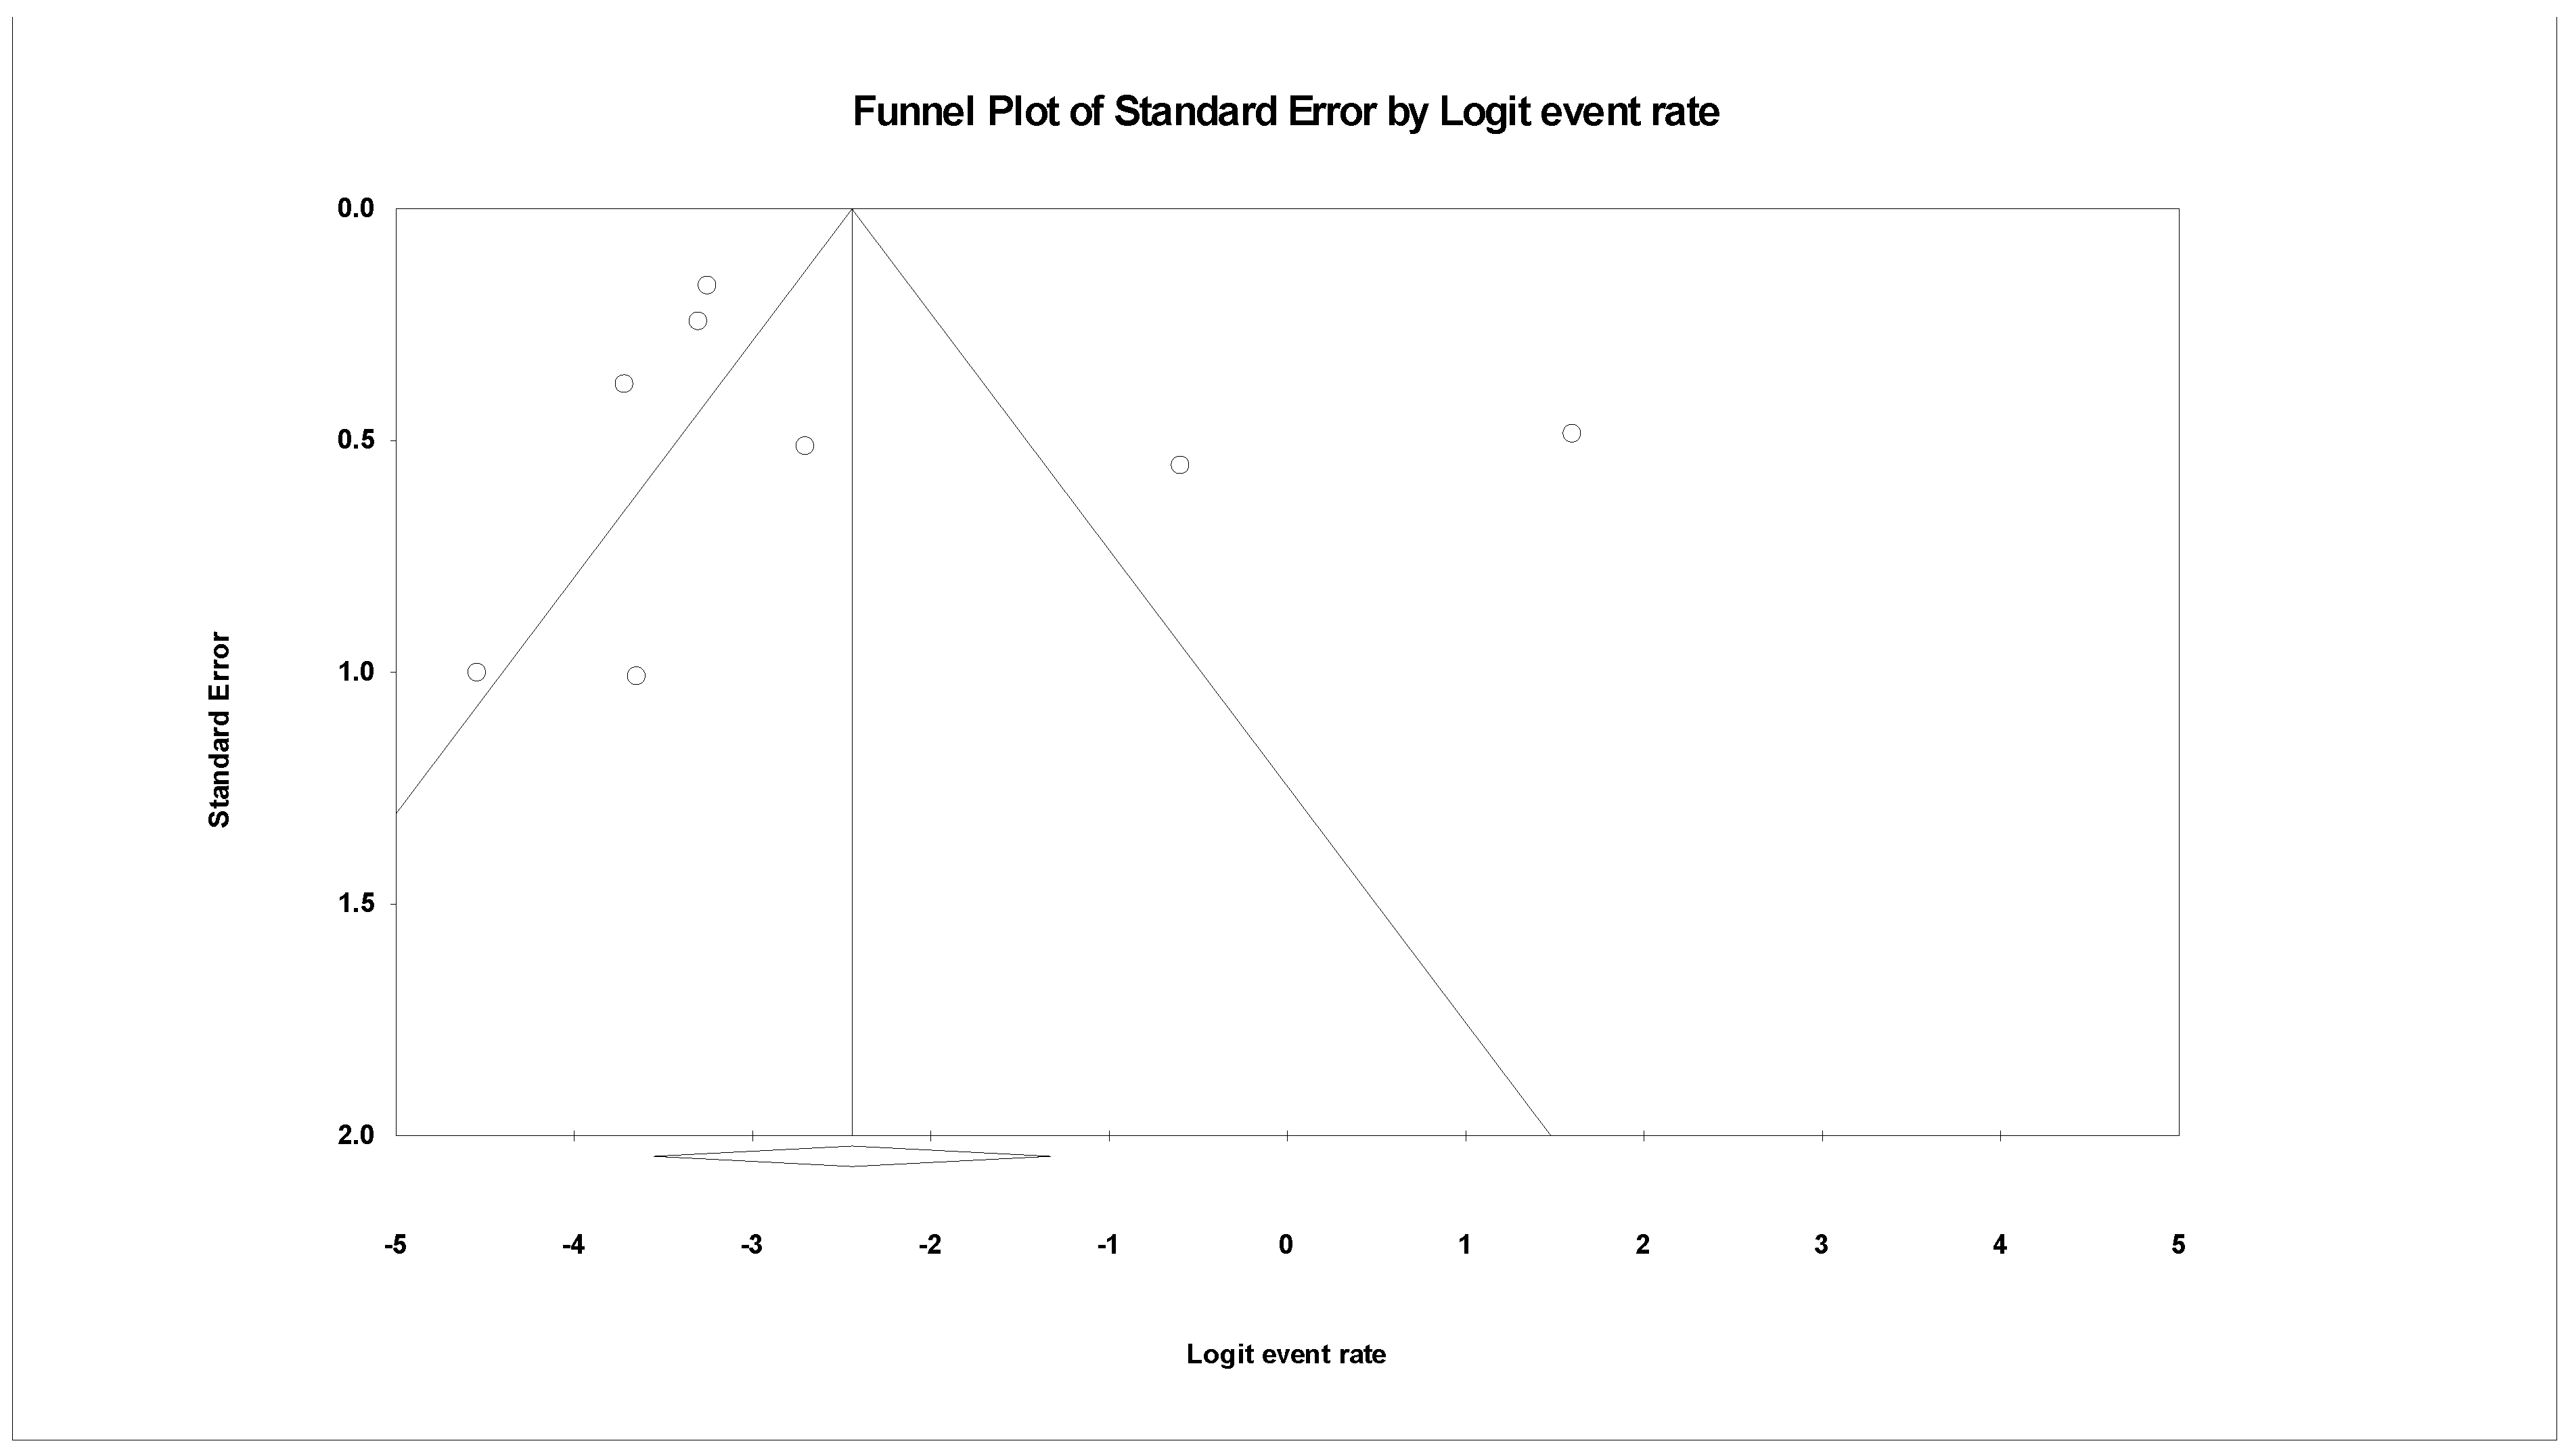

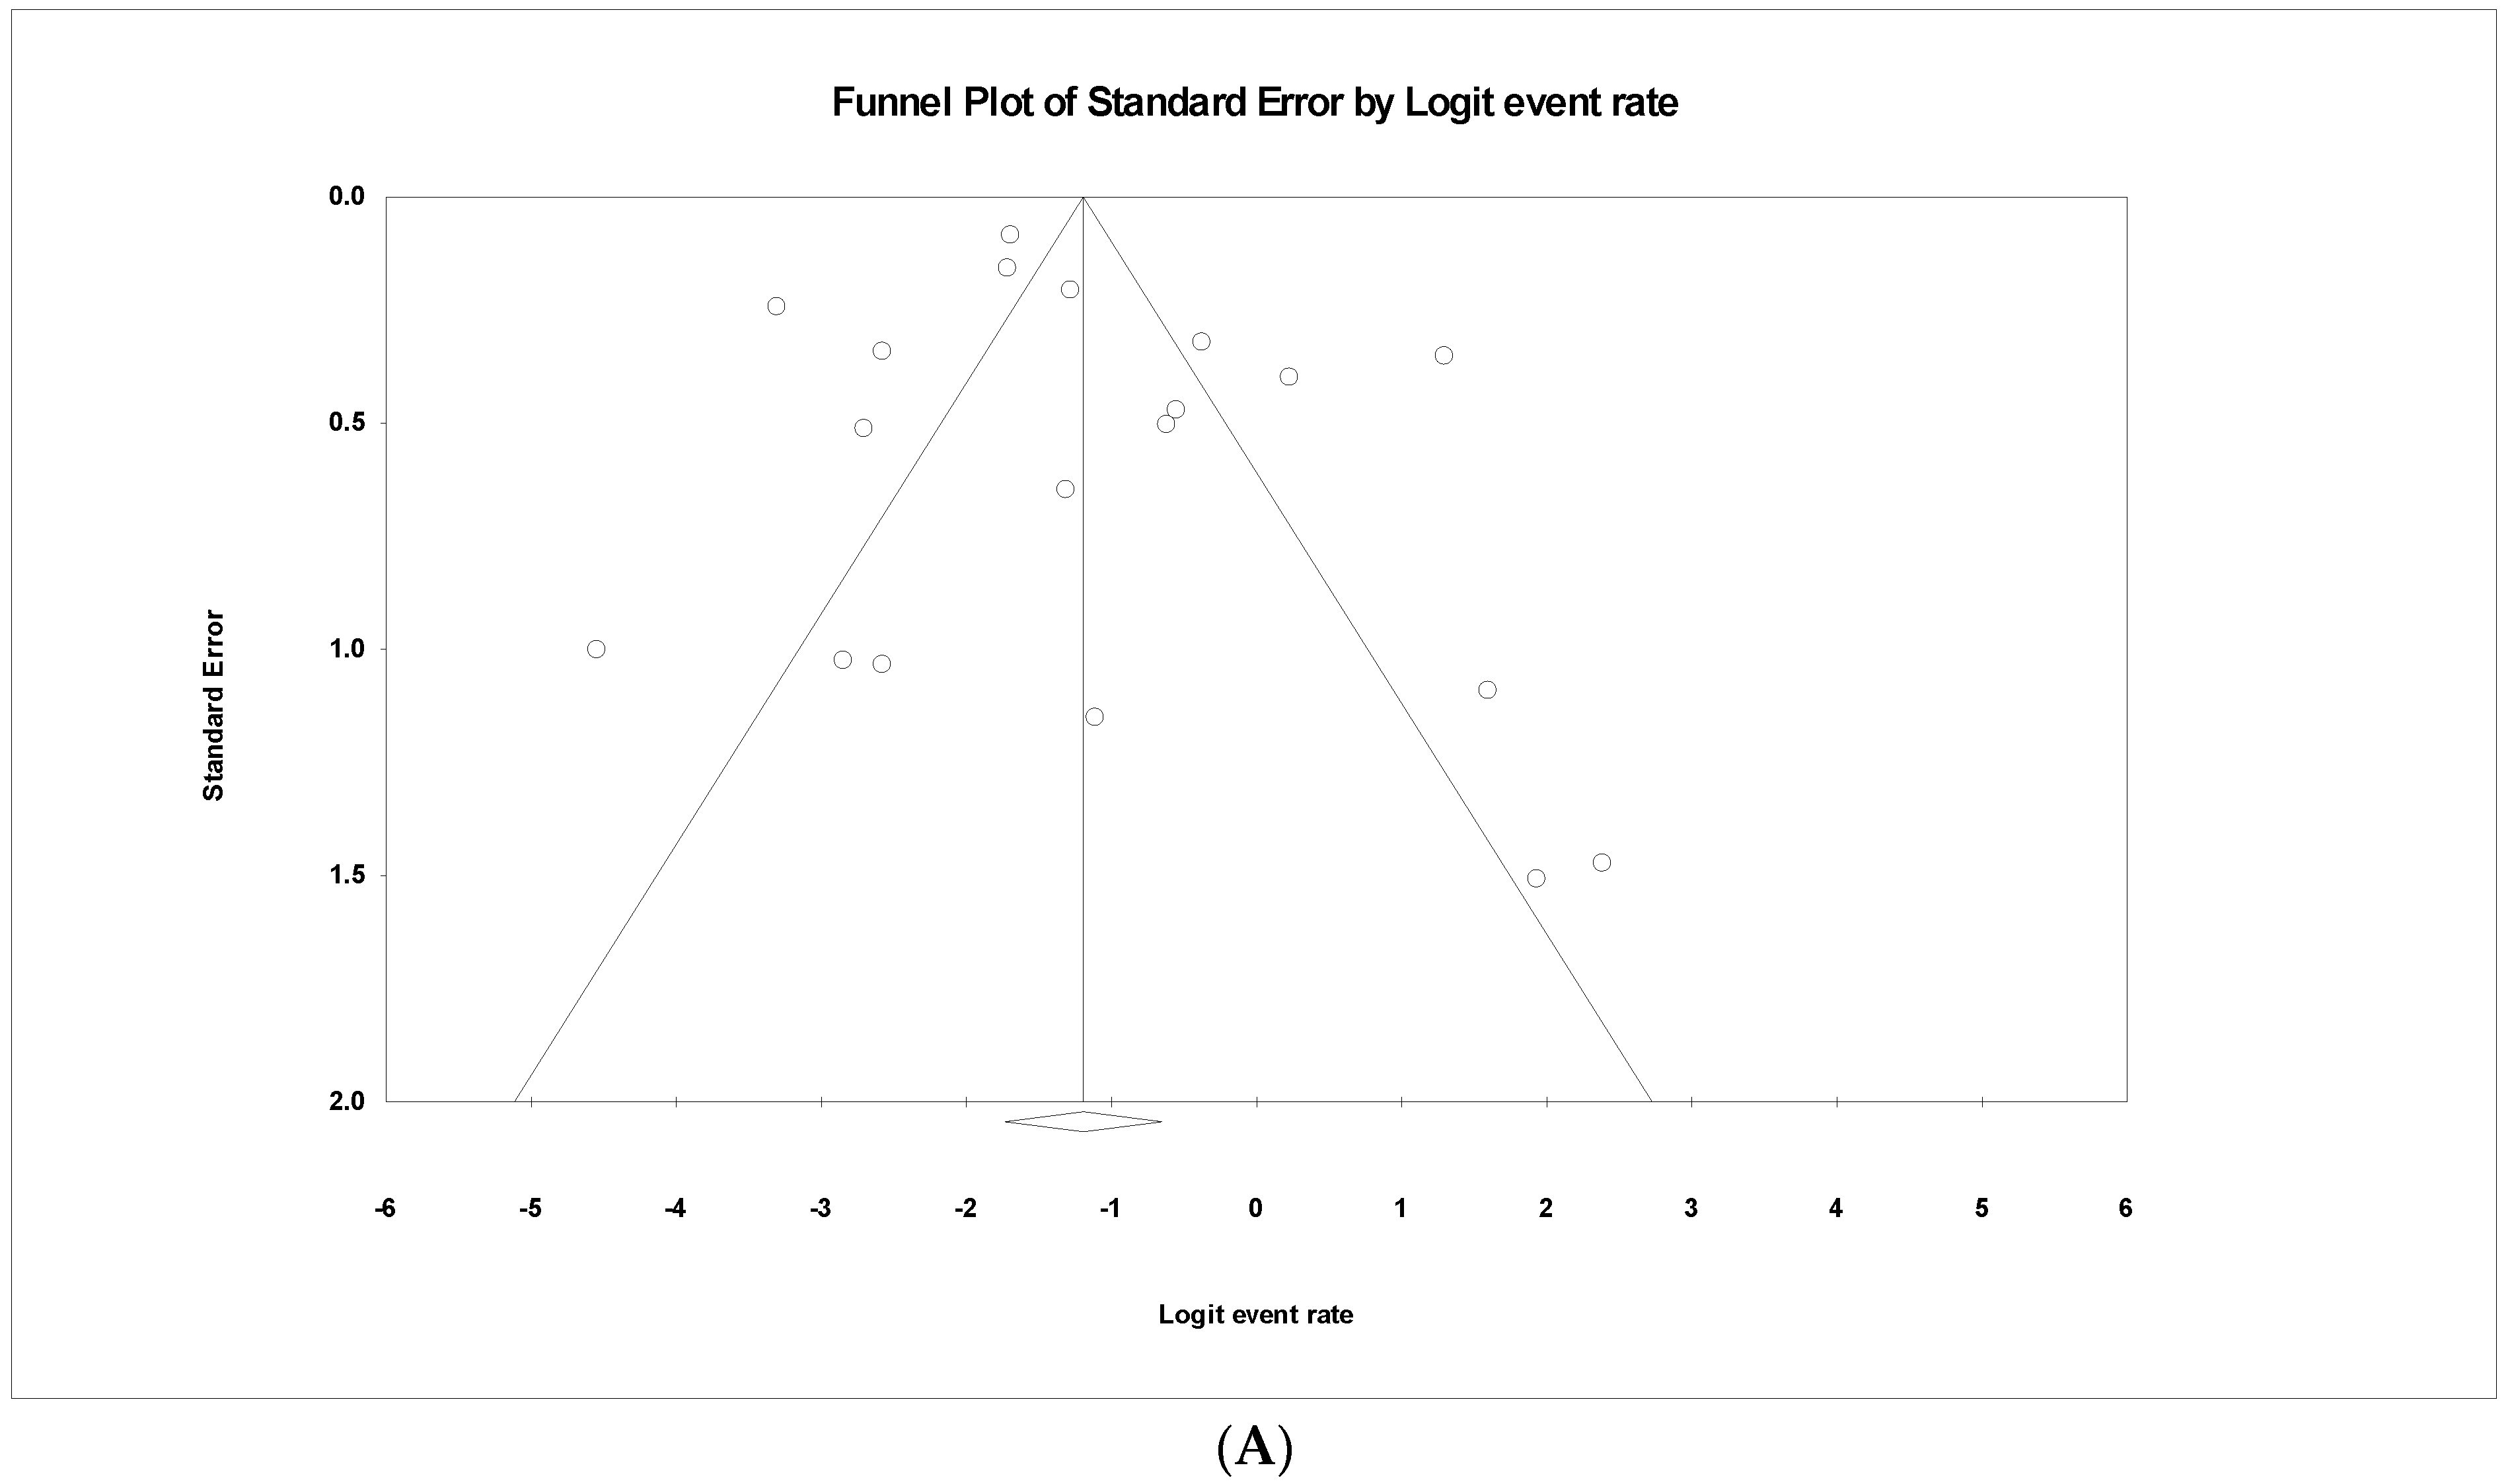
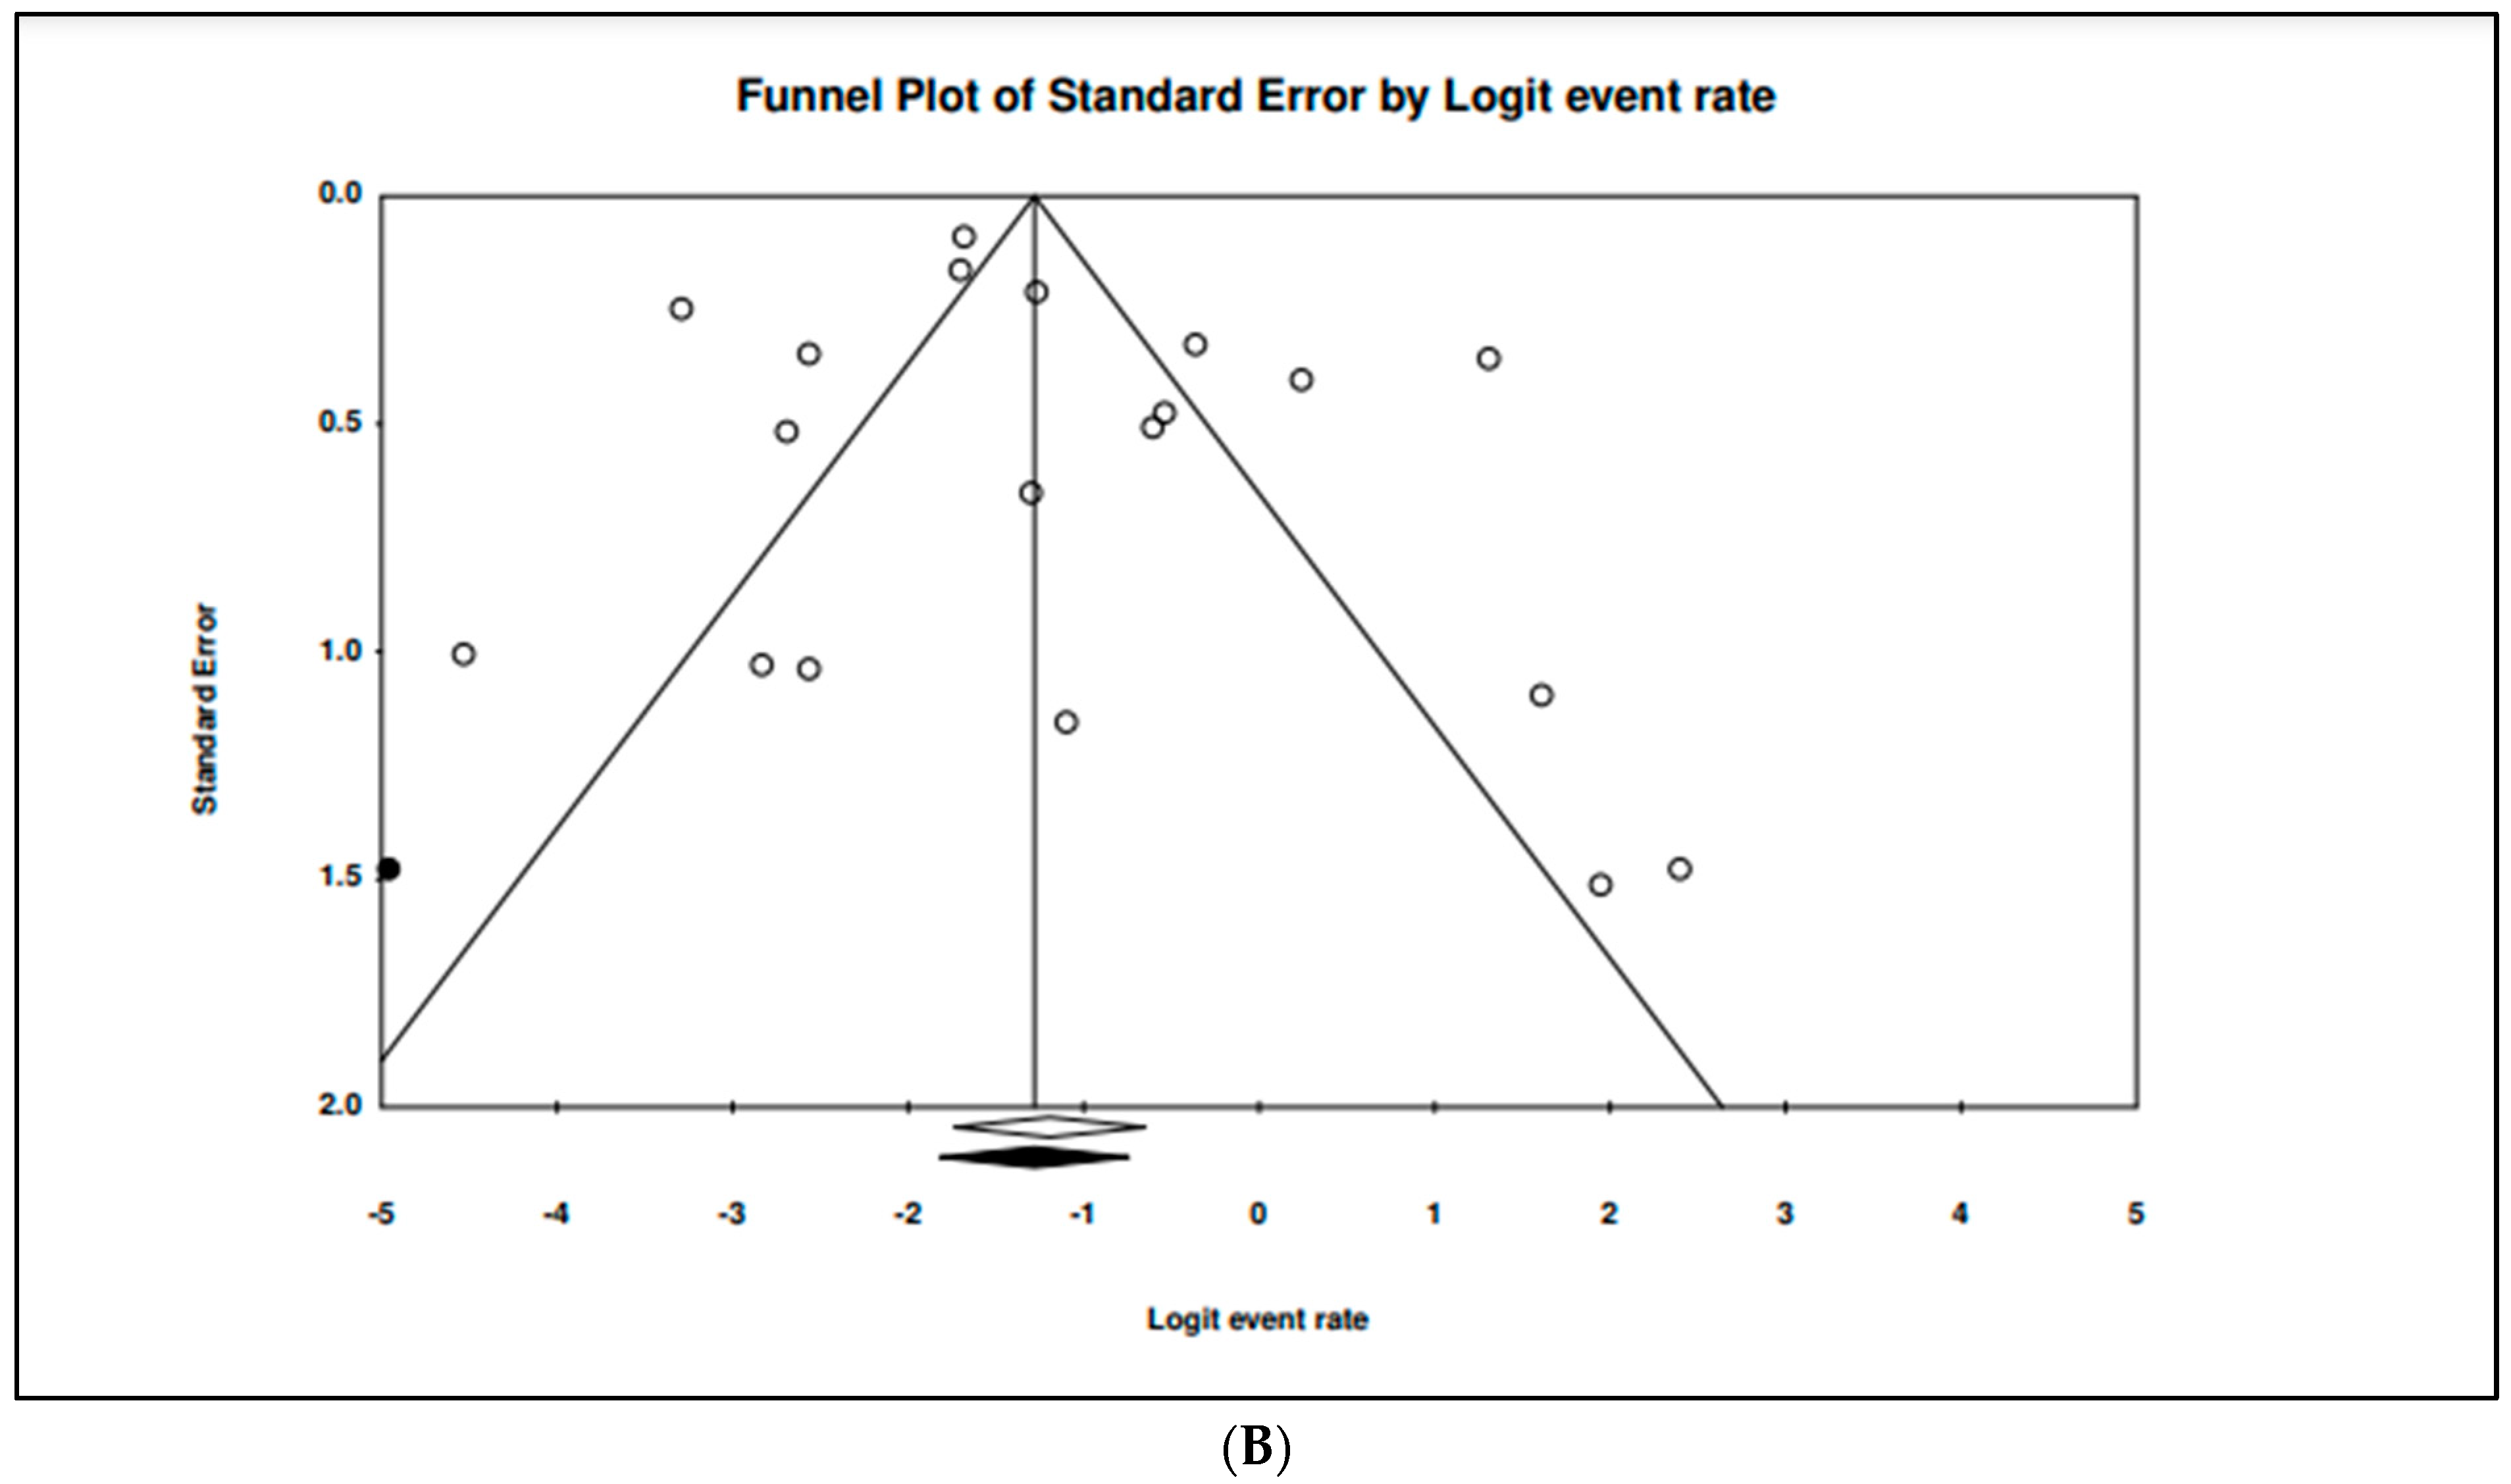
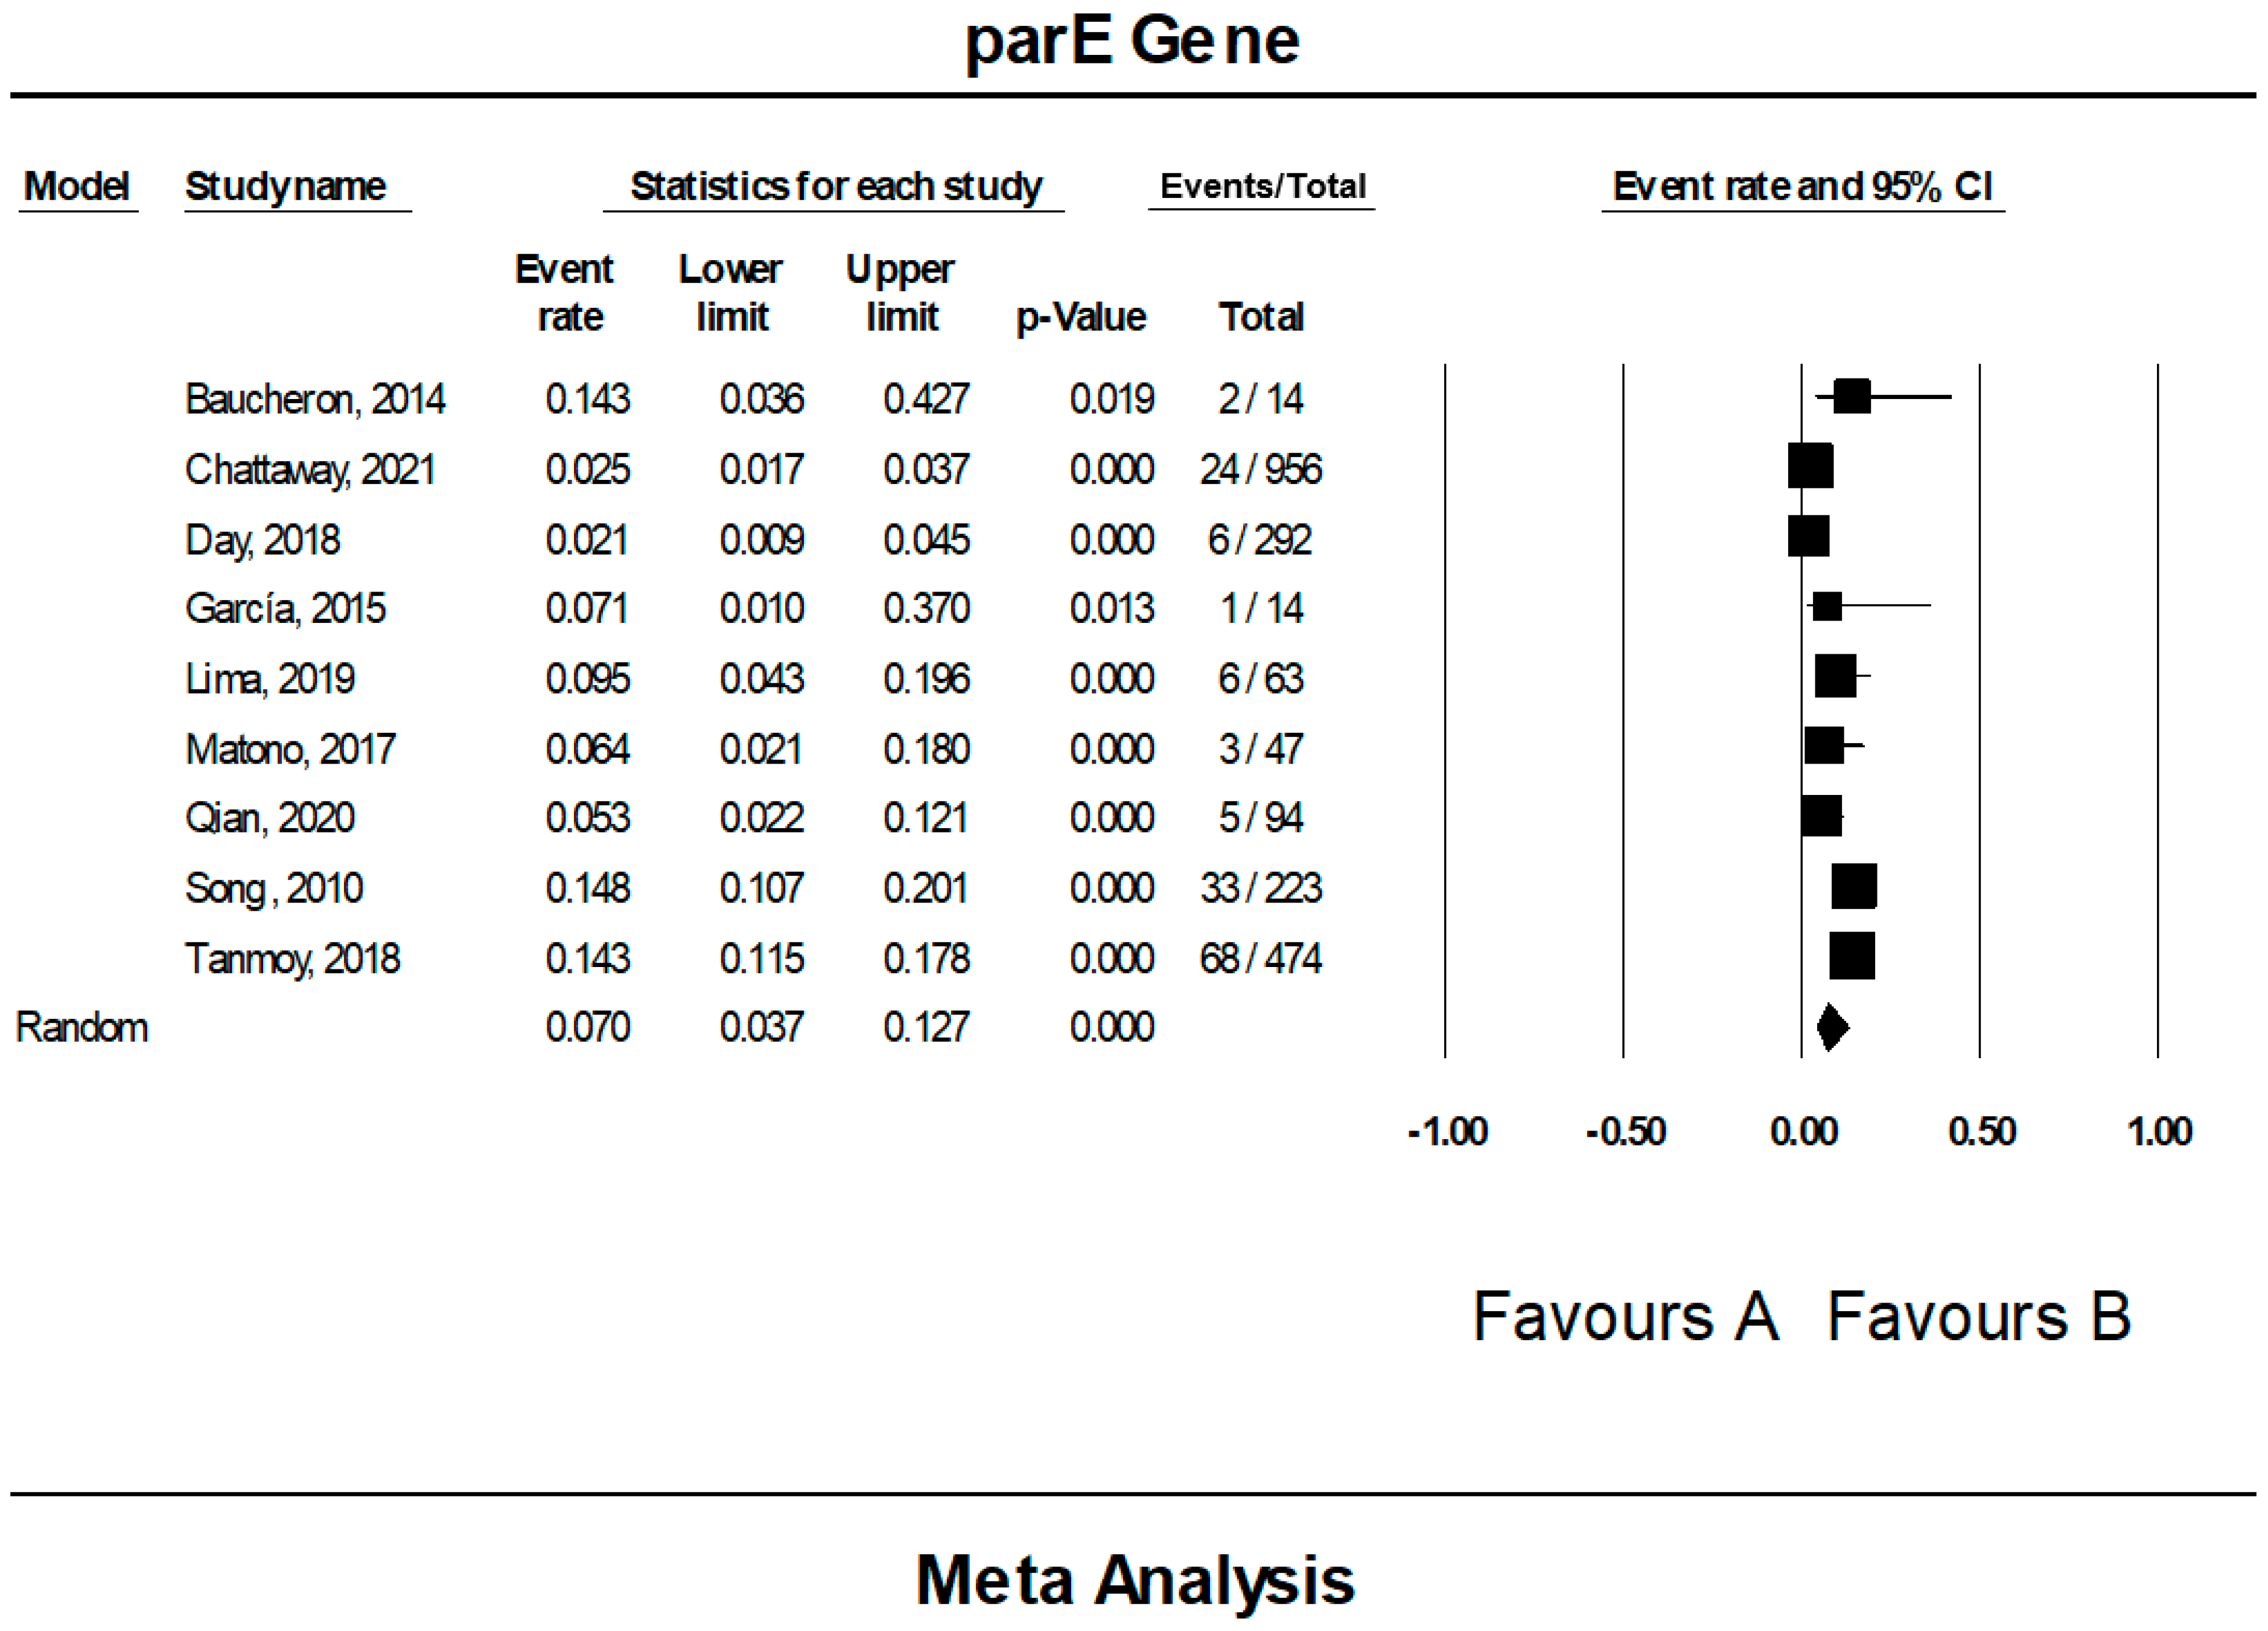


| No. | Study ID (Ref.) | Country of Study | Period of Study | Source of Samples | No. of S. Typhi Isolates | No. of Resistant S. Typhi | Phenotypic Resistance (n) | Genotypic Resistance (n) |
|---|---|---|---|---|---|---|---|---|
| 1 | Abbasi & Ghaznavi-Rad, 2021 [12] | Iran | 2015–2016 | Patient/clinical | 3 | 3 | AMP (1), CHL (1), NAL (3), SXT (1), TET (2) | gyrA (3), parC (3), int1 (2), qac (1), qnrS1 (3), qnrA (3), qnrB (1), sul1 (1) |
| 2 | Afzal et al., 2012 [13] | Pakistan | 2011 | Patient/clinical | 30 | 14 | CFM (4), CIP (3), CPD (5), CRO (1), NAL (9), RAD (14), | gyrA (9), blaTEM (14) |
| 3 | Afzal et al., 2013 [14] | Pakistan | 2010–2011 | Patient/clinical | 80 | 80 | AMK (12), AMP (45), ATM (12), CFM (10), CFP-SUL (2), CHL (26), CIP (10), CRO (9), GEN (5), NAL (19), RAD (31), STR (42), SXT (24), TET (23), TMP (23) | blaTEM (35), catA1 (21), dfrA7 (30), strA (21), strB (21), sul1 (24), sul2 (54), tetB (28) |
| 4 | Ahsan & Rahman, 2019 [15] | Bangladesh | 2015–2016 | Patient/clinical | 33 | 33 | AZM (31), CLI (33), | ermB (21), int1 (29) |
| 5 | Akinyemi et al., 2011 [16] | Nigeria | NA | Environmental | 3 | 3 | AMP (3), AMX (1), CHL (2), GEN (2), STR (3), SXT (1), TET (3) | stn (3) |
| 6 | Akinyemi et al., 2017 [17] | Western Africa | 2014–2015 | Patient/clinical | 13 | 12 | FOX (12) | ampC fox (7) |
| 7 | AL-Fatlawy & AL-Hadrawi, 2020 [18] | Iraq | 2018–2019 | Patient/clinical | 59 | 59 | AMC (59), AMP (52), AMX (50), ATM (59), CAR (40), CHL (47), CLA (59), CLR (59), CPR (44), CTX (59), FOX (59), GEN (48), IPM (53), MEM (59), NIT (59), PEN (59), TET (59), | int1 (43) |
| 8 | Aljanaby & Medhat, 2017 [19] | Iraq | 2016–2017 | Patient/clinical | 39 | 39 | AMK (5), AMP (24), AMX (18), CHL (20), CIP (2), CTX (1), GEN (4), STR (9), TET (17), TOB (9) | ant (3″)-Ia (1), blaTEM (6), blaSHV (5), catA1 (24), catA2 (8), cmIA (4), floR (29), pse-1 (18), tetA (19), tetB (11) |
| 9 | Al-Mayahi & Jaber, 2020 [20] | Iraq | 2018 | Patient/clinical | 56 | 56 | AMC (31), AMK (21), AMP (56), ATM (18), AZM (51), CAZ (28), CFM (51), CHL (56), CIP (30), CPD (56), CRO (22), CTX (39), CXM (56), DOX (35), FEP (14), FOX (56), GEN (17), LEX (56), LVX (10), MIN (35), NAL (56), NET (8), NIT (56), NOR (16), OFX (10), PIP (30), SAM (50), SXT (18), TET (56), TIC (24), TIM (13), TMP (22), TOB (17), TZP (14) | blaTEM (40), blaCTX-M1 (27), blaSHV (11) |
| 10 | Al-Muhanna et al., 2018 [21] | Iraq | NA | Patient/clinical | 30 | 30 | NA | gyrA (30), gyrB (25), catA1 (19), dfrA7 (18), sul1 (12), sul2 (6) |
| 11 | Baucheron et al., 2014 [22] | France | 1997–2008 | Patient/clinical | 16 | 14 | AMX (7), CHL (7), CIP (1), NAL (14), SPT (1), STR (8), SXT (8), TET (8), TMP (8) | gyrA (14), parC (1), parE (2) |
| 12 | Brown et al., 1996 [23] | India | 1992–1994 | Patient/clinical | 15 | 12 | NAL (12) | gyrA (12) |
| 13 | Chattaway et al., 2021 [24] | England | 2016–2019 | Patient/clinical | 1034 | 956 | AMC (308), AMX (308), CAZ (51), CHL (323), CIP (950), CRO (51), FOF (1), SXT (336), TET (28), TMP (328) | gyrA (913), gyrB (36), parC (150), parE (24), blaTEM (303), blaCTX-M15 (49), blaSHV (1), catA1 (323), dfrA7(317), dfrA14 (12), dfrA15 (8), fosA-v3 (1), qnrS1 (55), strA (301), strB (298), sul1 (327), sul2 (302) |
| 14 | Dahiya et al., 2014 [25] | India | 2005–2010 | Patient/clinical | 22 | 17 | CIP (6), NAL (17) | gyrA (17), parC (6) |
| 15 | Day et al., 2018 [26] | United Kingdom | 2014–2016 | Patient/clinical | 332 | 292 | AMP (77), CHL (79), CIP (36), STR (76), SXT (83), TET (6), TMP (82) | gyrA (275), gyrB (7), parC (45), parE (6), blaTEM (77), catA1 (79), dfrA1 (1), dfrA7 (74), dfrA14 (1), dfrA15 (6), qnrB (1), strA (76), strB (76), sul1 (81), sul2 (76), tetA (6) |
| 16 | El-Tayeb et al., 2017 [27] | Saudi Arabia | NA | Patient/clinical and environmental | 4 | 4 | AMK (4), CEF (4), CXM (4), FOX (4), GEN (4), NIT (4), SXT (4), TOB (4) | gyrA (1), parC (1), carb (3), dfrA1 (2), floR (4), tetA (1), tetG (4) |
| 17 | Eshaghi et al., 2020 [28] | Canada | 2018–2019 | Patient/clinical | 10 | 10 | AMP (10), CHL (10), CIP (10), CRO (10), STR (10), SXT (10) | gyrA (10), aac (6′)-Iaa (10), aph (3″)-Ib (10), aph (6)-Id (10), blaTEM (10), blaCTX-M15 (10), catA1 (10), dfrA7 (10), qnrS1 (10), sul1 (10), sul2 (10), tetA (1) |
| 18 | Gaind et al., 2006 [29] | India | 2003–2004 | Patient/clinical | 8 | 6 | CIP (3), NAL (6), SXT (4), TET (4) | gyrA (5), parC (5), aadA1 (4), dfrA15 (4), int1 (4) |
| 19 | García et al., 2014 [30] | Peru | 2008–2012 | Patient/clinical | 33 | 6 | NAL (6) | gyrA (6) |
| 20 | García-Fernández et al., 2015 [31] | Italy | 2011–2013 | Patient/clinical | 19 | 14 | AMP (3), CHL (3), CIP (13), NAL (13), STR (4), SXT (2), TET (1), TMP (3) | gyrA (13), gyrB (5), parC (3), parE (1) |
| 21 | Gopal et al., 2016 [32] | India | 2007–2009 | Patient/clinical | 133 | 132 | AMP (4), CIP (28), NAL (132) | gyrA (125), parC (29) |
| 22 | Hassing et al., 2011 [33] | Netherland | 2002–2008 | Patient/clinical | 11 | 8 | AMP (2), CHL (2), CIP (1), NAL (8), TET (2), TMP (2) | gyrA (8) |
| 23 | Hassing et al., 2016 [34] | Netherland | 2002–2008 | Patient/clinical | 11 | 8 | CIP (8), NAL (8) | gyrA (8) |
| 24 | Jacob et al., 2021 [35] | India | 2015–2018 | Patient/clinical | 5 | 5 | AMP (5), CIP (5), CRO (5) | gyrA (5), parC (5), aac (6′)-Iaa (1), blaTEM (1), blaDHA (1), blaSHV (4), qnrB (5), sul1 (1) |
| 25 | Lima et al., 2019 [36] | Bangladesh | NA | Patient/clinical | 73 | 63 | AMP (38), CHL (39), CIP (59), CRO (1), SXT (35) | gyrA (62), gyrB (4), parC (4), parE (6), blaTEM (57), blaCTX-M15 (1), catA1 (39), dfrA7 (40), qnrS1 (7), sul1 (39), sul2 (36) |
| 26 | Lv, Zhang & Song, 2019 [37] | China | 2005–2017 | Patient/clinical | 140 | 95 | AMP (74), NAL (95) | gyrA (87), blaTEM (74) |
| 27 | Matono et al., 2017 [38] | Japan | 2001–2016 | Patient/clinical | 107 | 47 | CIP (47) | gyrA (47), parC (37), parE (3) |
| 28 | Nüesch-Inderbinen et al., 2015 [39] | Switzerland | 2002–2013 | Patient/clinical | 192 | 126 | AMC (1), AMP (27), CEF (8), CHL (24), CIP (39), NAL (113), STR (25), SXT (35), TET (15), TMP (28) | gyrA (35), parC (9), qnrS1 (2) |
| 29 | Okanda et al., 2018 [40] | Bangladesh | 2015 | Patient/clinical | 18 | 18 | AMP (7), CHL (7), NAL (18), SXT (7), TET (5) | gyrA (18), parC (1) |
| 30 | Oo et al., 2019 [41] | Myanmar | 2015–2016 | Patient/clinical | 39 | 39 | CIP (39) | gyrA (39), gyrB (1), parC (16) |
| 31 | Qian et al., 2020 [42] | China | 2013–2017 | Patient/clinical | 164 | 94 | AMC (3), AMP (16), CAZ (2), CIP (4), CRO (3), CTF (10), CTX (2), GEN (2), NAL (94), SXT (2), TET (5) | gyrA (68), gyrB (1), parC (1), parE (5), qnrS1 (1), qnrB (1) |
| 32 | Saeed et al., 2020 [43] | Pakistan | 2018 | Patient/clinical | 82 | 82 | AMP (61), AMX (61), CFM (35), CHL (79), CIP (74), CRO (35), CTX (35), FEP (35), SXT (79), TZP (31) | blaTEM (42), blaCTX-M1 (27), blaCTX-M15 (21) |
| 33 | Shah et al., 2020 [44] | Pakistan | NA | Environmental | 110 | 108 | AMK (108), ATM (107), CIP (66), CRO (108), ETP (108), IPM (107), MEM (108), PEN (108), VAN (108) | gyrA (44) |
| 34 | Sharma et al., 2019 [45] | India | 1993–2016 | Patient/clinical | 469 | 32 | AZM (32) | acrR (1), rpIV (2) |
| 35 | Shirakawa et al., 2006 [46] | Nepal | 2003 | Patient/clinical | 30 | 23 | AMP (9), CHL (7), NAL (22), SXT (7), TET (5) | gyrA (22) |
| 36 | Smith, Govender & Keddy, 2010 [47] | South Africa | 2003–2007 | Patient/clinical | 19 | 19 | NAL (19) | gyrA (7), parC (7) |
| 37 | Song et al., 2010 [48] | Worldwide | 1991–2006 | Patient/clinical | 292 | 223 | NAL (223) | gyrA (213), parE (33) |
| 38 | Tanmoy et al., 2018 [49] | Bangladesh | 1999–2013 | Patient/clinical | 536 | 474 | AMP (263), CHL (250), CIP (467), CRO (1), SXT (233) | gyrA (458), gyrB (17), parC (17), parE (68), blaTEM (271), blaCTX-M1 (1), catA1 (256), dfrA7 (257), qnrS1 (255), strA (210), strB (210), sul1 (257), sul2 (265), tetA (51), tetB (46) |
| 39 | Veeraraghavan et al., 2016 [50] | India | 2014 | Patient/clinical | 27 | 25 | AMP (2), CIP (10), NAL (24), PEF (25), SXT (2) | gyrA (24), parC (14), qnrB (1) |
| 40 | Vlieghe et al., 2012 [51] | Cambodia | 2007–2010 | Patient/clinical | 20 | 18 | AZM (1), NAL (18), | gyrA (18) |
| 41 | Wu et al., 2010 [52] | China | 2002–2007 | Patient/clinical | 25 | 13 | AMP (1), NAL (13) | gyrA (13) |
| 42 | Yanagi et al., 2009 [53] | Indonesia | 2006–2008 | Patient/clinical | 17 | 8 | AMP (8), CHL (3), CIP (3), CRO (1), LVX (1), NAL (8), SXT (3), TET (1) | gyrA (8) |
| Country or Region of Study | No. of Studies | Prevalence (%) | 95% CI | I2 | Q | Heterogeneity Test | |
|---|---|---|---|---|---|---|---|
| DF | p | ||||||
| Country | |||||||
| Bangladesh | 4 | 88.7 | 83.7–92.3 | 22.168 | 3.854 | 3 | 0.278 |
| Cambodia | 1 | 90.0 | 67.6–97.5 | 0.000 | 0.000 | 0 | 1.000 |
| Canada | 1 | 95.5 | 55.2–99.7 | 0.000 | 0.000 | 0 | 1.000 |
| China | 3 | 60.8 | 51.7–69.3 | 55.694 | 4.514 | 2 | 0.105 |
| England | 1 | 92.5 | 90.7–93.9 | 0.000 | 0.000 | 0 | 1.000 |
| France | 1 | 87.5 | 61.4–96.9 | 0.000 | 0.000 | 0 | 1.000 |
| India | 7 | 81.5 | 30.4–97.8 | 96.529 | 172.877 | 6 | 0.000 |
| Indonesia | 1 | 47.1 | 25.5–69.7 | 0.000 | 0.000 | 0 | 1.000 |
| Iran | 1 | 87.5 | 26.6–99.3 | 0.000 | 0.000 | 0 | 1.000 |
| Iraq | 4 | 98.9 | 95.7–99.7 | 0.000 | 0.147 | 3 | 0.986 |
| Italy | 1 | 73.7 | 50.2–88.6 | 0.000 | 0.000 | 0 | 1.000 |
| Japan | 1 | 43.9 | 34.8–53.4 | 0.000 | 0.000 | 0 | 1.000 |
| Myanmar | 1 | 98.8 | 82.9–99.9 | 0.000 | 0.000 | 0 | 1.000 |
| Nepal | 1 | 76.7 | 58.5–88.4 | 0.000 | 0.000 | 0 | 1.000 |
| Netherland | 2 | 72.7 | 51.1–87.2 | 0.000 | 0.000 | 1 | 1.000 |
| Nigeria | 2 | 91.0 | 65.3–98.2 | 0.000 | 0.086 | 1 | 0.769 |
| Pakistan | 4 | 94.8 | 59.5–99.6 | 93.686 | 47.513 | 3 | 0.000 |
| Peru | 1 | 18.2 | 8.4–35.0 | 0.000 | 0.000 | 0 | 1.000 |
| Saudi Arabia | 1 | 90.0 | 32.6–99.4 | 0.000 | 0.000 | 0 | 1.000 |
| South Africa | 1 | 97.5 | 70.2–99.8 | 0.000 | 0.000 | 0 | 1.000 |
| Switzerland | 1 | 65.6 | 58.6–72.0 | 0.000 | 0.000 | 0 | 1.000 |
| United Kingdom | 1 | 88.0 | 84.0–91.0 | 0.000 | 0.000 | 0 | 1.000 |
| Worldwide | 1 | 76.4 | 71.2–80.9 | 0.000 | 0.000 | 0 | 1.000 |
| Region | |||||||
| Africa | 3 | 93.5 | 77.3–98.4 | 0.000 | 0.742 | 2 | 0.690 |
| America | 2 | 63.7 | 2.0–99.3 | 88.889 | 9.000 | 1 | 0.003 |
| Asia | 23 | 83.5 | 70.7–91.4 | 96.156 | 572.296 | 22 | 0.000 |
| Europe | 7 | 81.4 | 66.9–90.4 | 93.997 | 99.949 | 6 | 0.000 |
| Middle East | 6 | 97.7 | 93.0–99.3 | 0.000 | 3.761 | 5 | 0.584 |
| Worldwide | 1 | 76.4 | 71.2–80.9 | 0.000 | 0.000 | 0 | 1.000 |
| Country or Region of Study | No. of Studies | Prevalence (%) | 95% CI | I2 | Q | Heterogeneity Test | |
|---|---|---|---|---|---|---|---|
| DF | p | ||||||
| Country | |||||||
| Bangladesh | 3 | 96.8 | 94.9–98.0 | 0.000 | 0.574 | 2 | 0.751 |
| Cambodia | 1 | 97.4 | 69.0–99.8 | 0.000 | 0.000 | 0 | 1.000 |
| Canada | 1 | 95.5 | 55.2–99.7 | 0.000 | 0.000 | 0 | 1.000 |
| China | 3 | 86.8 | 64.3–96.0 | 83.974 | 12.480 | 2 | 0.002 |
| England | 1 | 95.5 | 94.0–96.6 | 0.000 | 0.000 | 0 | 1.000 |
| France | 1 | 96.7 | 63.4–99.8 | 0.000 | 0.000 | 0 | 1.000 |
| India | 6 | 94.4 | 90.1–96.9 | 0.000 | 1.790 | 5 | 0.877 |
| Indonesia | 1 | 94.4 | 49.5–99.7 | 0.000 | 0.000 | 0 | 1.000 |
| Iran | 1 | 87.5 | 26.6–99.3 | 0.000 | 0.000 | 0 | 1.000 |
| Iraq | 1 | 98.4 | 78.9–99.9 | 0.000 | 0.000 | 0 | 1.000 |
| Italy | 1 | 92.9 | 63.0–99.0 | 0.000 | 0.000 | 0 | 1.000 |
| Japan | 1 | 99.0 | 85.4–99.9 | 0.000 | 0.000 | 0 | 1.000 |
| Myanmar | 1 | 98.8 | 82.0–99.9 | 0.000 | 0.000 | 0 | 1.000 |
| Nepal | 1 | 95.7 | 74.8–99.4 | 0.000 | 0.000 | 0 | 1.000 |
| Netherland | 2 | 94.4 | 69.3–99.2 | 0.000 | 0.000 | 1 | 1.000 |
| Pakistan | 2 | 49.1 | 28.2–70.4 | 62.276 | 2.651 | 1 | 0.103 |
| Peru | 1 | 92.9 | 42.3–99.6 | 0.000 | 0.000 | 0 | 1.000 |
| Saudi Arabia | 1 | 25.0 | 3.4–76.2 | 0.000 | 0.000 | 0 | 1.000 |
| South Africa | 1 | 36.8 | 18.7–59.7 | 0.000 | 0.000 | 0 | 1.000 |
| Switzerland | 1 | 27.8 | 20.7–36.2 | 0.000 | 0.000 | 0 | 1.000 |
| United Kingdom | 1 | 94.2 | 90.8–96.4 | 0.000 | 0.000 | 0 | 1.000 |
| Worldwide | 1 | 95.5 | 91.9–97.6 | 0.000 | 0.000 | 0 | 1.000 |
| Region | |||||||
| Africa | 1 | 36.8 | 18.7–59.7 | 0.000 | 0.000 | 0 | 1.000 |
| America | 2 | 94.3 | 68.7–99.2 | 0.000 | 0.054 | 1 | 0.816 |
| Asia | 19 | 93.2 | 85.2–97.0 | 91.108 | 202.421 | 18 | 0.000 |
| Europe | 7 | 90.5 | 61.2–98.3 | 97.817 | 274.892 | 6 | 0.000 |
| Middle East | 3 | 82.7 | 17.0–99.1 | 76.116 | 8.374 | 2 | 0.015 |
| Worldwide | 1 | 95.5 | 91.9–97.6 | 0.000 | 0.000 | 0 | 1.000 |
| Country or Region of Study | No. of Studies | Prevalence (%) | 95% CI | I2 | Q | Heterogeneity Test | |
|---|---|---|---|---|---|---|---|
| DF | p | ||||||
| Country | |||||||
| Bangladesh | 2 | 4.1 | 2.5–6.4 | 8.969 | 1.099 | 1 | 0.295 |
| China | 1 | 1.1 | 0.1–7.2 | 0.000 | 0.000 | 0 | 1.000 |
| England | 1 | 3.8 | 2.7–5.2 | 0.000 | 0.000 | 0 | 1.000 |
| Iraq | 1 | 83.3 | 65.7–92.9 | 0.000 | 0.000 | 0 | 1.000 |
| Italy | 1 | 35.7 | 15.7–62.4 | 0.000 | 0.000 | 0 | 1.000 |
| Myanmar | 1 | 2.6 | 0.4–16.1 | 0.000 | 0.000 | 0 | 1.000 |
| United Kingdom | 1 | 2.4 | 1.1–4.9 | 0.000 | 0.000 | 0 | 1.000 |
| Region | |||||||
| Asia | 4 | 3.7 | 2.5–5.5 | 0.000 | 2.969 | 3 | 0.396 |
| Europe | 3 | 6.9 | 1.9–22.5 | 91.477 | 23.467 | 2 | 0.000 |
| Middle East | 1 | 83.3 | 65.7–92.9 | 0.000 | 0.000 | 0 | 1.000 |
| Country or Region of Study | No. of Studies | Prevalence (%) | 95% CI | I2 | Q | Heterogeneity Test | |
|---|---|---|---|---|---|---|---|
| DF | p | ||||||
| Country | |||||||
| Bangladesh | 3 | 4.1 | 2.7–6.1 | 0.000 | 1.207 | 2 | 0.547 |
| China | 1 | 1.1 | 0.1–7.2 | 0.000 | 0.000 | 0 | 1.000 |
| England | 1 | 15.7 | 13.5–18.1 | 0.000 | 0.000 | 0 | 1.000 |
| France | 1 | 7.1 | 1.0–37.0 | 0.000 | 0.000 | 0 | 1.000 |
| India | 5 | 50.0 | 25.6–74.4 | 81.214 | 21.293 | 4 | 0.000 |
| Iran | 1 | 87.5 | 26.6–99.3 | 0.000 | 0.000 | 0 | 1.000 |
| Italy | 1 | 21.4 | 7.1–49.4 | 0.000 | 0.000 | 0 | 1.000 |
| Japan | 1 | 78.7 | 64.8–88.2 | 0.000 | 0.000 | 0 | 1.000 |
| Myanmar | 1 | 41.0 | 26.9–56.8 | 0.000 | 0.000 | 0 | 1.000 |
| Saudi Arabia | 1 | 25.0 | 3.4–76.2 | 0.000 | 0.000 | 0 | 1.000 |
| Region | |||||||
| Asia | 11 | 27.1 | 11.3–52.0 | 94.328 | 176.293 | 10 | 0.000 |
| Europe | 5 | 14.0 | 10.8–18.0 | 44.721 | 7.236 | 4 | 0.124 |
| Middle East | 2 | 56.6 | 6.3–96.2 | 60.956 | 2.561 | 1 | 0.110 |
| Africa | 1 | 36.8 | 18.7–59.7 | 0.000 | 0.000 | 0 | 1.000 |
| South Africa | 1 | 36.8 | 18.7–59.7 | 0.000 | 0.000 | 0 | 1.000 |
| Switzerland | 1 | 7.1 | 3.8–13.2 | 0.000 | 0.000 | 0 | 1.000 |
| United Kingdom | 1 | 15.4 | 11.7–20.0 | 0.000 | 0.000 | 0 | 1.000 |
| Country or Region of Study | No. of Studies | Prevalence (%) | 95% CI | I2 | Q | Heterogeneity Test | |
|---|---|---|---|---|---|---|---|
| DF | p | ||||||
| Country | |||||||
| Bangladesh | 2 | 13.7 | 10.6–17.5 | 6.644 | 1.071 | 1 | 0.301 |
| China | 1 | 5.3 | 2.2–12.1 | 0.000 | 0.000 | 0 | 1.000 |
| England | 1 | 2.5 | 1.7–3.7 | 0.000 | 0.000 | 0 | 1.000 |
| France | 1 | 14.3 | 3.6–42.7 | 0.000 | 0.000 | 0 | 1.000 |
| Italy | 1 | 7.1 | 1.0–37.0 | 0.000 | 0.000 | 0 | 1.000 |
| Japan | 1 | 6.4 | 2.1–18.0 | 0.000 | 0.000 | 0 | 1.000 |
| United Kingdom | 1 | 2.1 | 0.9–4.5 | 0.000 | 0.000 | 0 | 1.000 |
| Worldwide | 1 | 14.8 | 10.7–20.1 | 0.000 | 0.000 | 0 | 1.000 |
| Region | |||||||
| Asia | 4 | 9.4 | 5.5–15.6 | 60.644 | 7.623 | 3 | 0.054 |
| Europe | 4 | 3.6 | 1.7–7.2 | 57.466 | 7.053 | 3 | 0.070 |
| Worldwide | 1 | 14.8 | 10.7–20.1 | 0.000 | 0.000 | 0 | 1.000 |
| Country or Region of Study | No. of Studies | Prevalence (%) | 95% CI | I2 | Q | Heterogeneity Test | |
|---|---|---|---|---|---|---|---|
| DF | p | ||||||
| Country | |||||||
| Bangladesh | 2 | 77.3 | 33.3–95.9 | 94.993 | 19.971 | 1 | 0.000 |
| Canada | 1 | 95.5 | 55.2–99.7 | 0.000 | 0.000 | 0 | 1.000 |
| China | 1 | 77.9 | 68.5–85.1 | 0.000 | 0.000 | 0 | 1.000 |
| England | 1 | 31.7 | 28.8–34.7 | 0.000 | 0.000 | 0 | 1.000 |
| India | 1 | 20.0 | 2.7–69.1 | 0.000 | 0.000 | 0 | 1.000 |
| Iraq | 2 | 40.8 | 5.0–90.0 | 95.859 | 24.150 | 1 | 0.000 |
| Pakistan | 3 | 52.4 | 35.2–68.9 | 69.880 | 6.640 | 2 | 0.036 |
| United Kingdom | 1 | 26.4 | 21.6–31.7 | 0.000 | 0.000 | 0 | 1.000 |
| Region | |||||||
| Asia | 7 | 65.3 | 50.9–77.3 | 87.849 | 49.379 | 6 | 0.000 |
| Europe | 2 | 29.5 | 24.6–34.9 | 66.500 | 2. 985 | 1 | 0.084 |
| Middle East | 2 | 40.8 | 5.0–90.0 | 95.859 | 24.150 | 1 | 0.000 |
| America | 1 | 95.5 | 55.2–99.7 | 0.000 | 0.000 | 0 | 1.000 |
Publisher’s Note: MDPI stays neutral with regard to jurisdictional claims in published maps and institutional affiliations. |
© 2022 by the authors. Licensee MDPI, Basel, Switzerland. This article is an open access article distributed under the terms and conditions of the Creative Commons Attribution (CC BY) license (https://creativecommons.org/licenses/by/4.0/).
Share and Cite
Yusof, N.Y.; Norazzman, N.I.I.; Zaidi, N.F.M.; Azlan, M.M.; Ghazali, B.; Najib, M.A.; Malik, A.H.A.; Halim, M.A.H.A.; Sanusi, M.N.S.M.; Zainal, A.A.; et al. Prevalence of Antimicrobial Resistance Genes in Salmonella Typhi: A Systematic Review and Meta-Analysis. Trop. Med. Infect. Dis. 2022, 7, 271. https://doi.org/10.3390/tropicalmed7100271
Yusof NY, Norazzman NII, Zaidi NFM, Azlan MM, Ghazali B, Najib MA, Malik AHA, Halim MAHA, Sanusi MNSM, Zainal AA, et al. Prevalence of Antimicrobial Resistance Genes in Salmonella Typhi: A Systematic Review and Meta-Analysis. Tropical Medicine and Infectious Disease. 2022; 7(10):271. https://doi.org/10.3390/tropicalmed7100271
Chicago/Turabian StyleYusof, Nik Yusnoraini, Nur Iffah Izzati Norazzman, Nur Fatihah Mohd Zaidi, Mawaddah Mohd Azlan, Basyirah Ghazali, Mohamad Ahmad Najib, Abdul Hafiz Abdul Malik, Mohamad Aideil Helmy Abdul Halim, Muhammad Nor Syamim Mohd Sanusi, Annur Ashyqin Zainal, and et al. 2022. "Prevalence of Antimicrobial Resistance Genes in Salmonella Typhi: A Systematic Review and Meta-Analysis" Tropical Medicine and Infectious Disease 7, no. 10: 271. https://doi.org/10.3390/tropicalmed7100271
APA StyleYusof, N. Y., Norazzman, N. I. I., Zaidi, N. F. M., Azlan, M. M., Ghazali, B., Najib, M. A., Malik, A. H. A., Halim, M. A. H. A., Sanusi, M. N. S. M., Zainal, A. A., & Aziah, I. (2022). Prevalence of Antimicrobial Resistance Genes in Salmonella Typhi: A Systematic Review and Meta-Analysis. Tropical Medicine and Infectious Disease, 7(10), 271. https://doi.org/10.3390/tropicalmed7100271


