
Data-Driven Adaptive Course Framework—Case Study: Impact on Success and Engagement


Abstract
1. Introduction
- How does adaptivity impact student engagement with the LMS and student success in formal education?
- How do time and score constraints affect student success and engagement in adaptive learning?
- How do changes in the workload and rules (e.g., number of activities, deadlines) affect dropout and failure rates in adaptive learning?
2. Current Research
3. Materials and Methods
3.1. Data Collection and Pre-Processing
3.2. Modeling Techniques
3.2.1. Engagement and Study Habits Analysis
3.2.2. Profiling Student Behavior
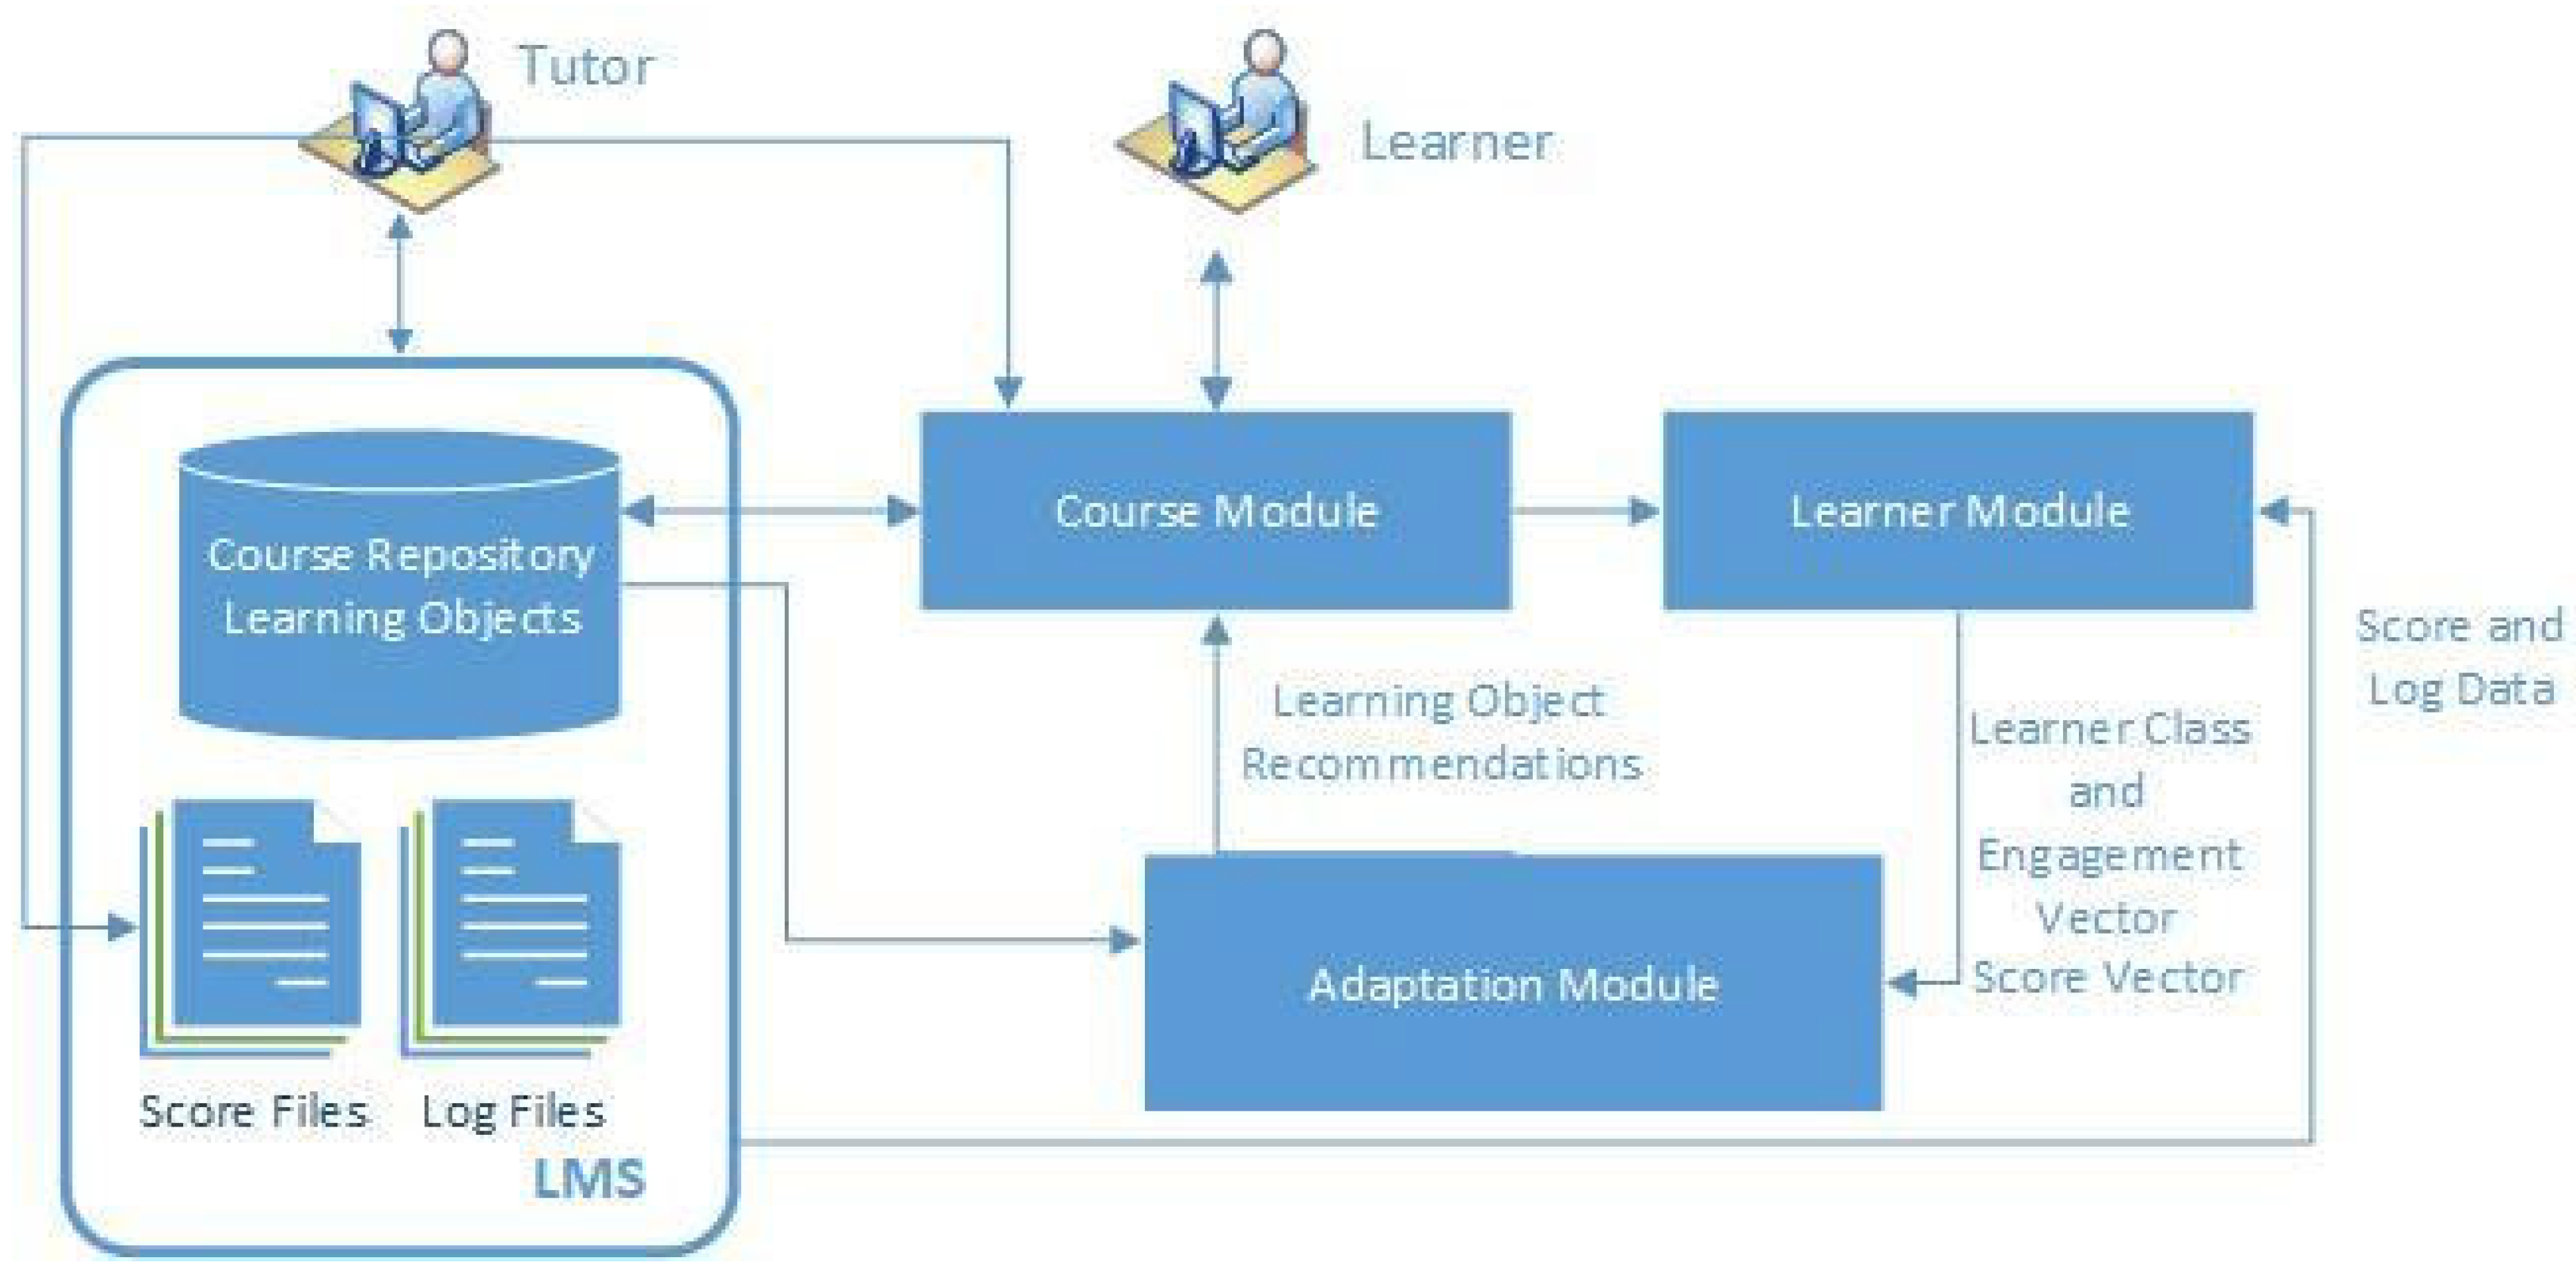
3.3. Intervention Design
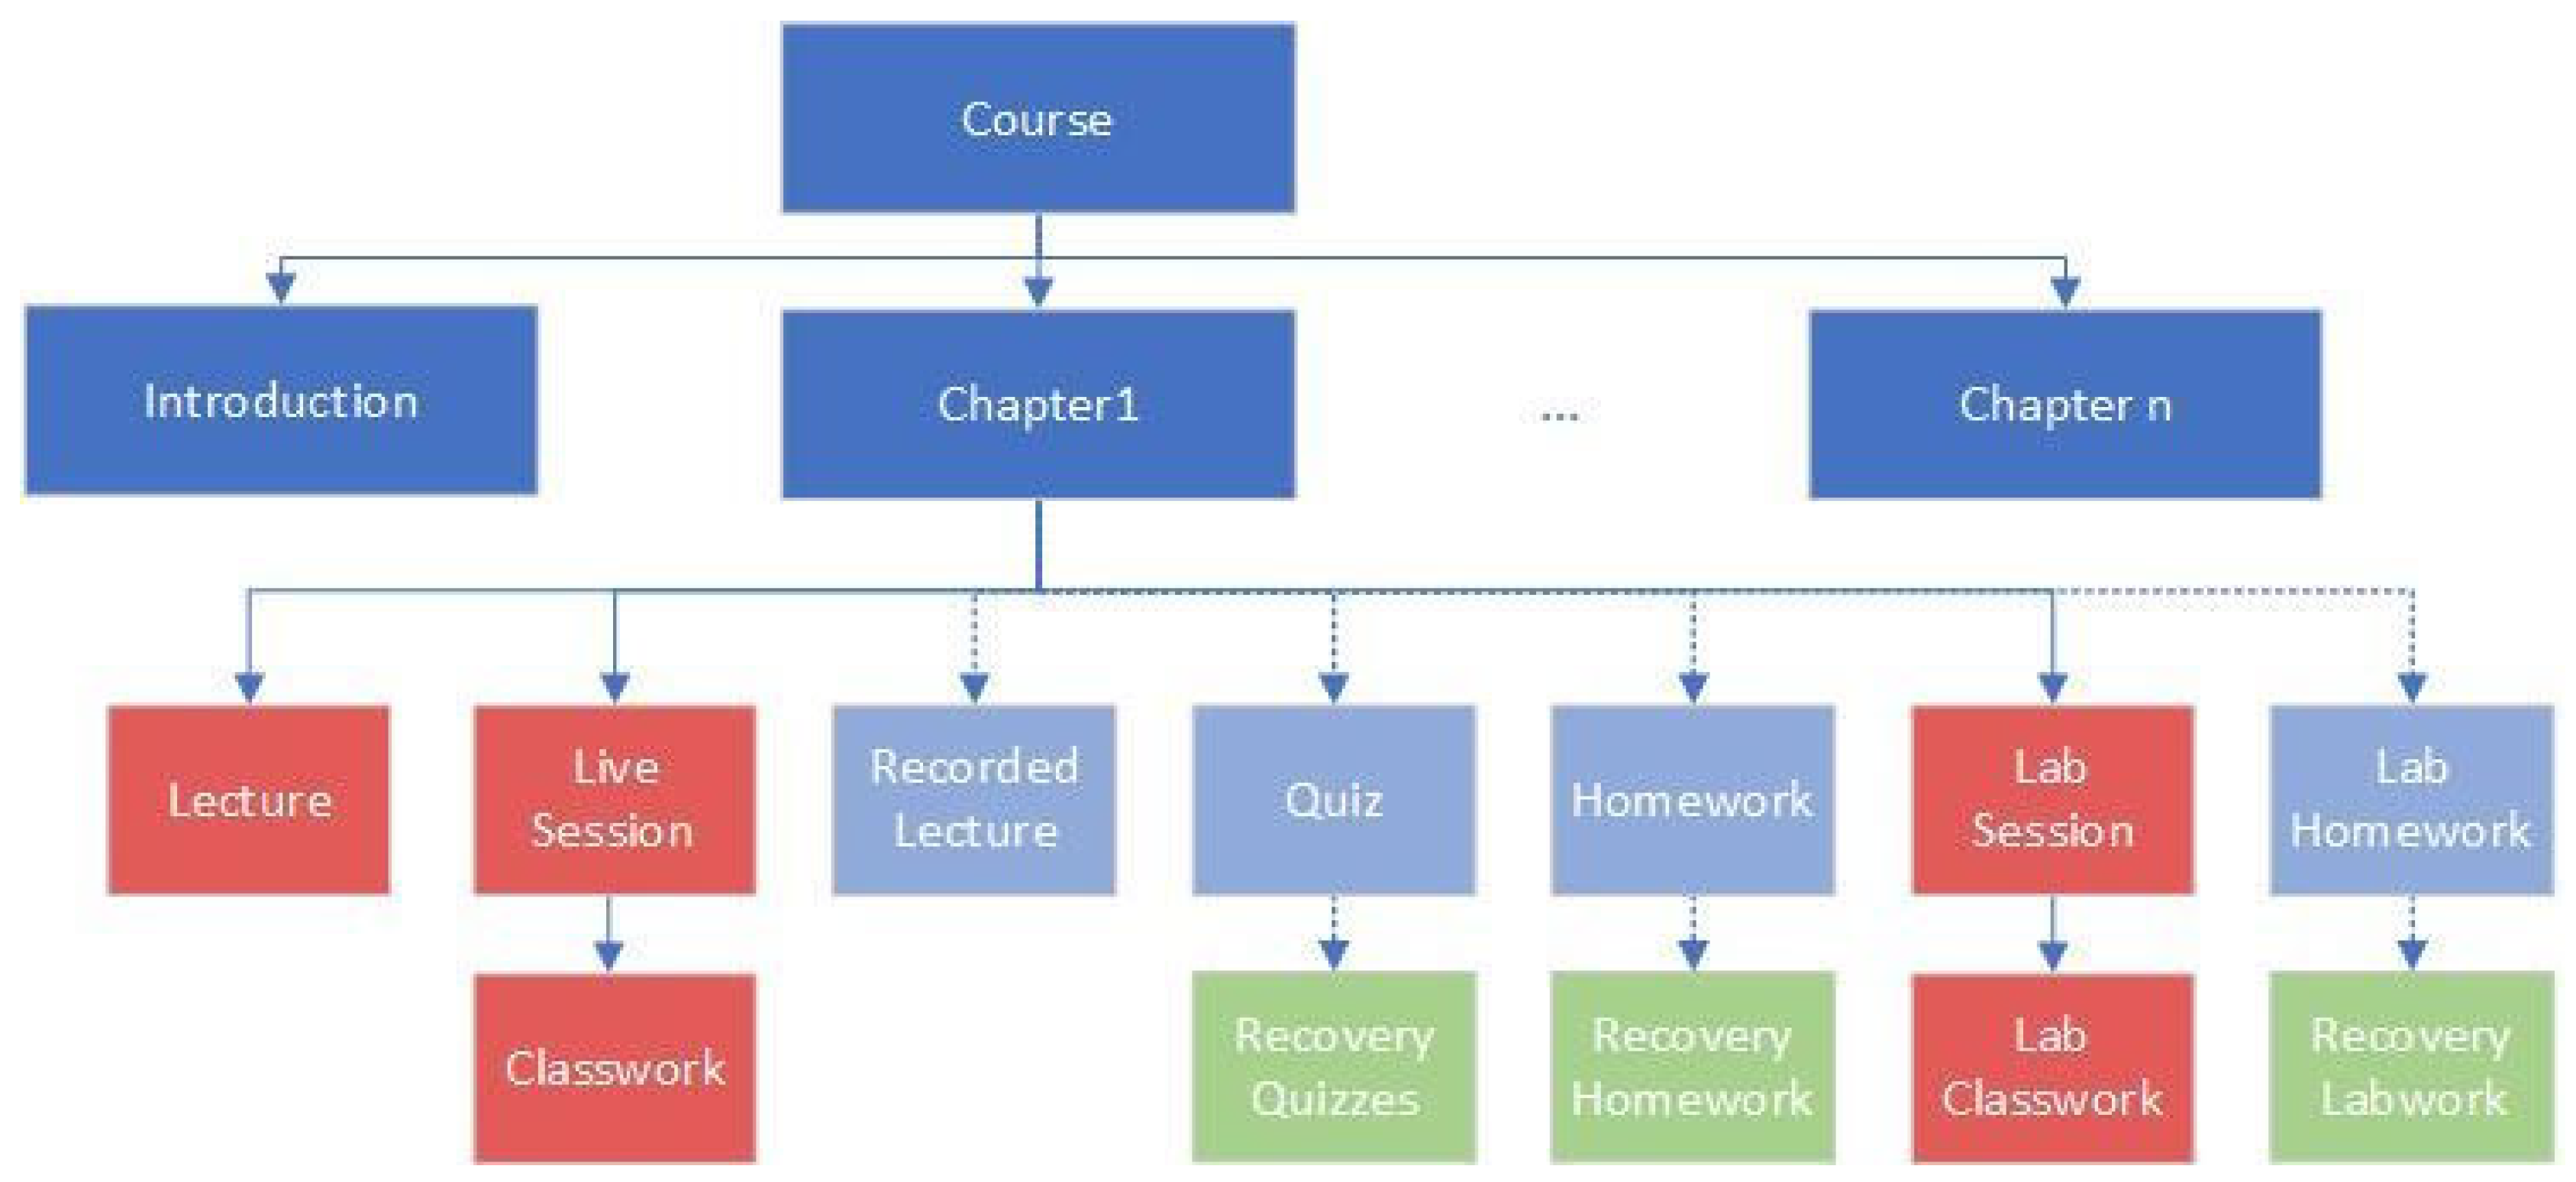
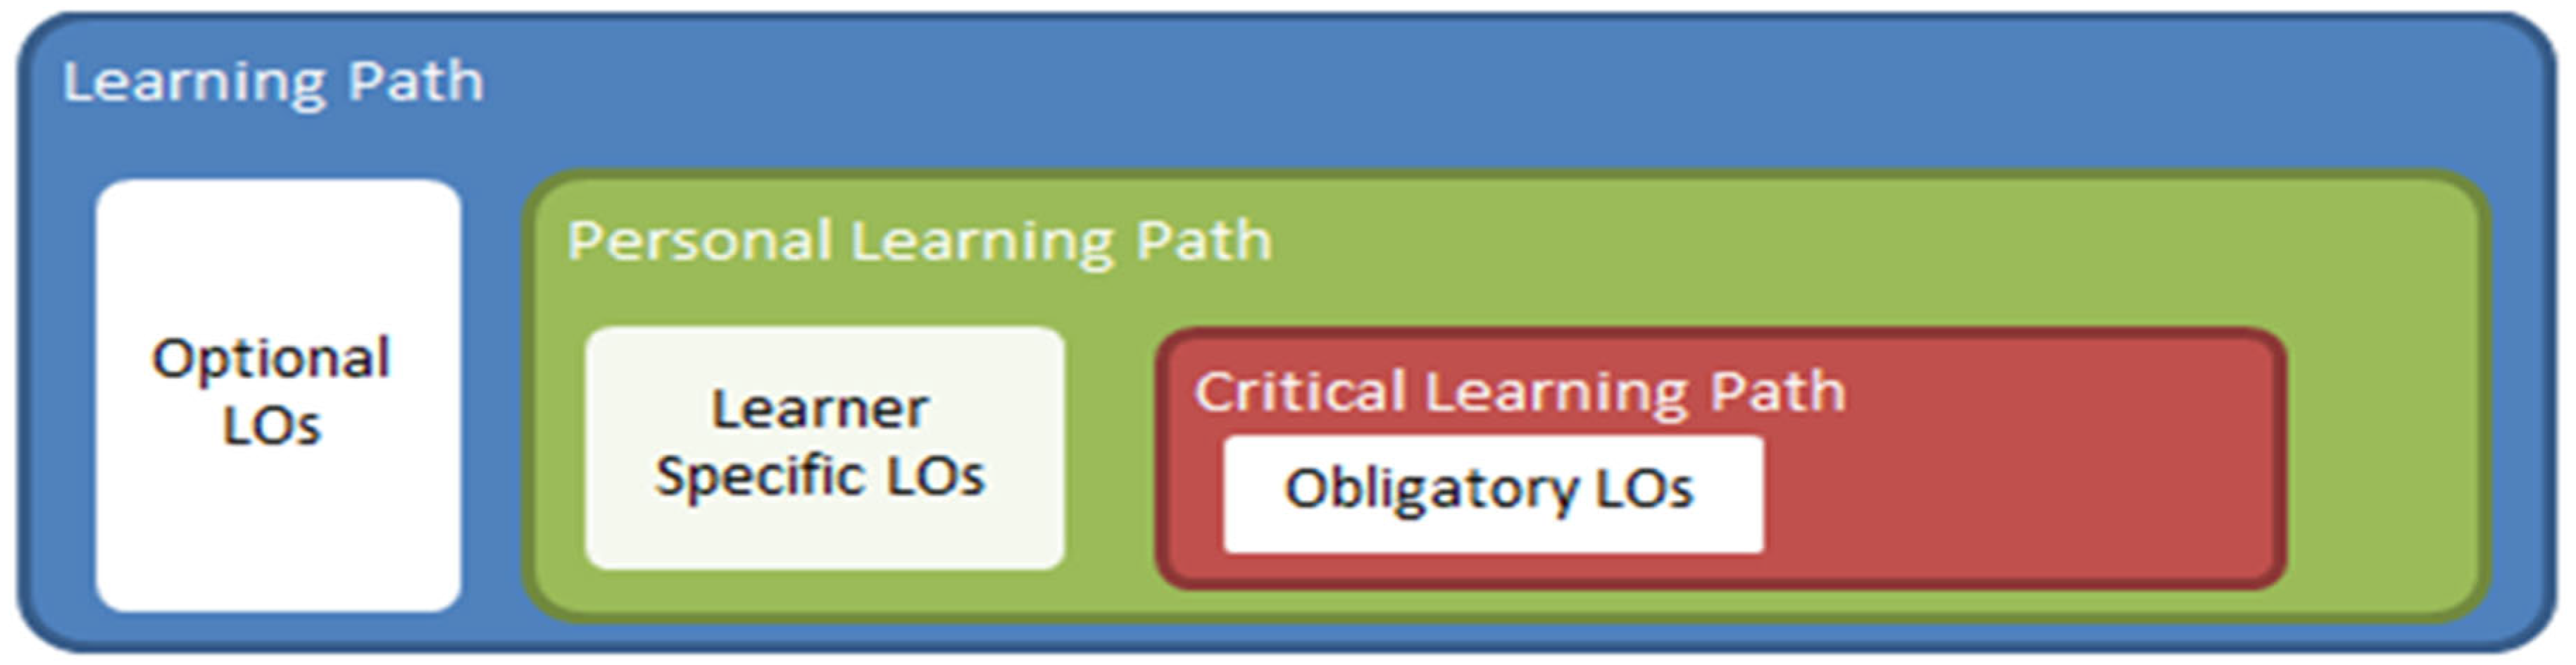
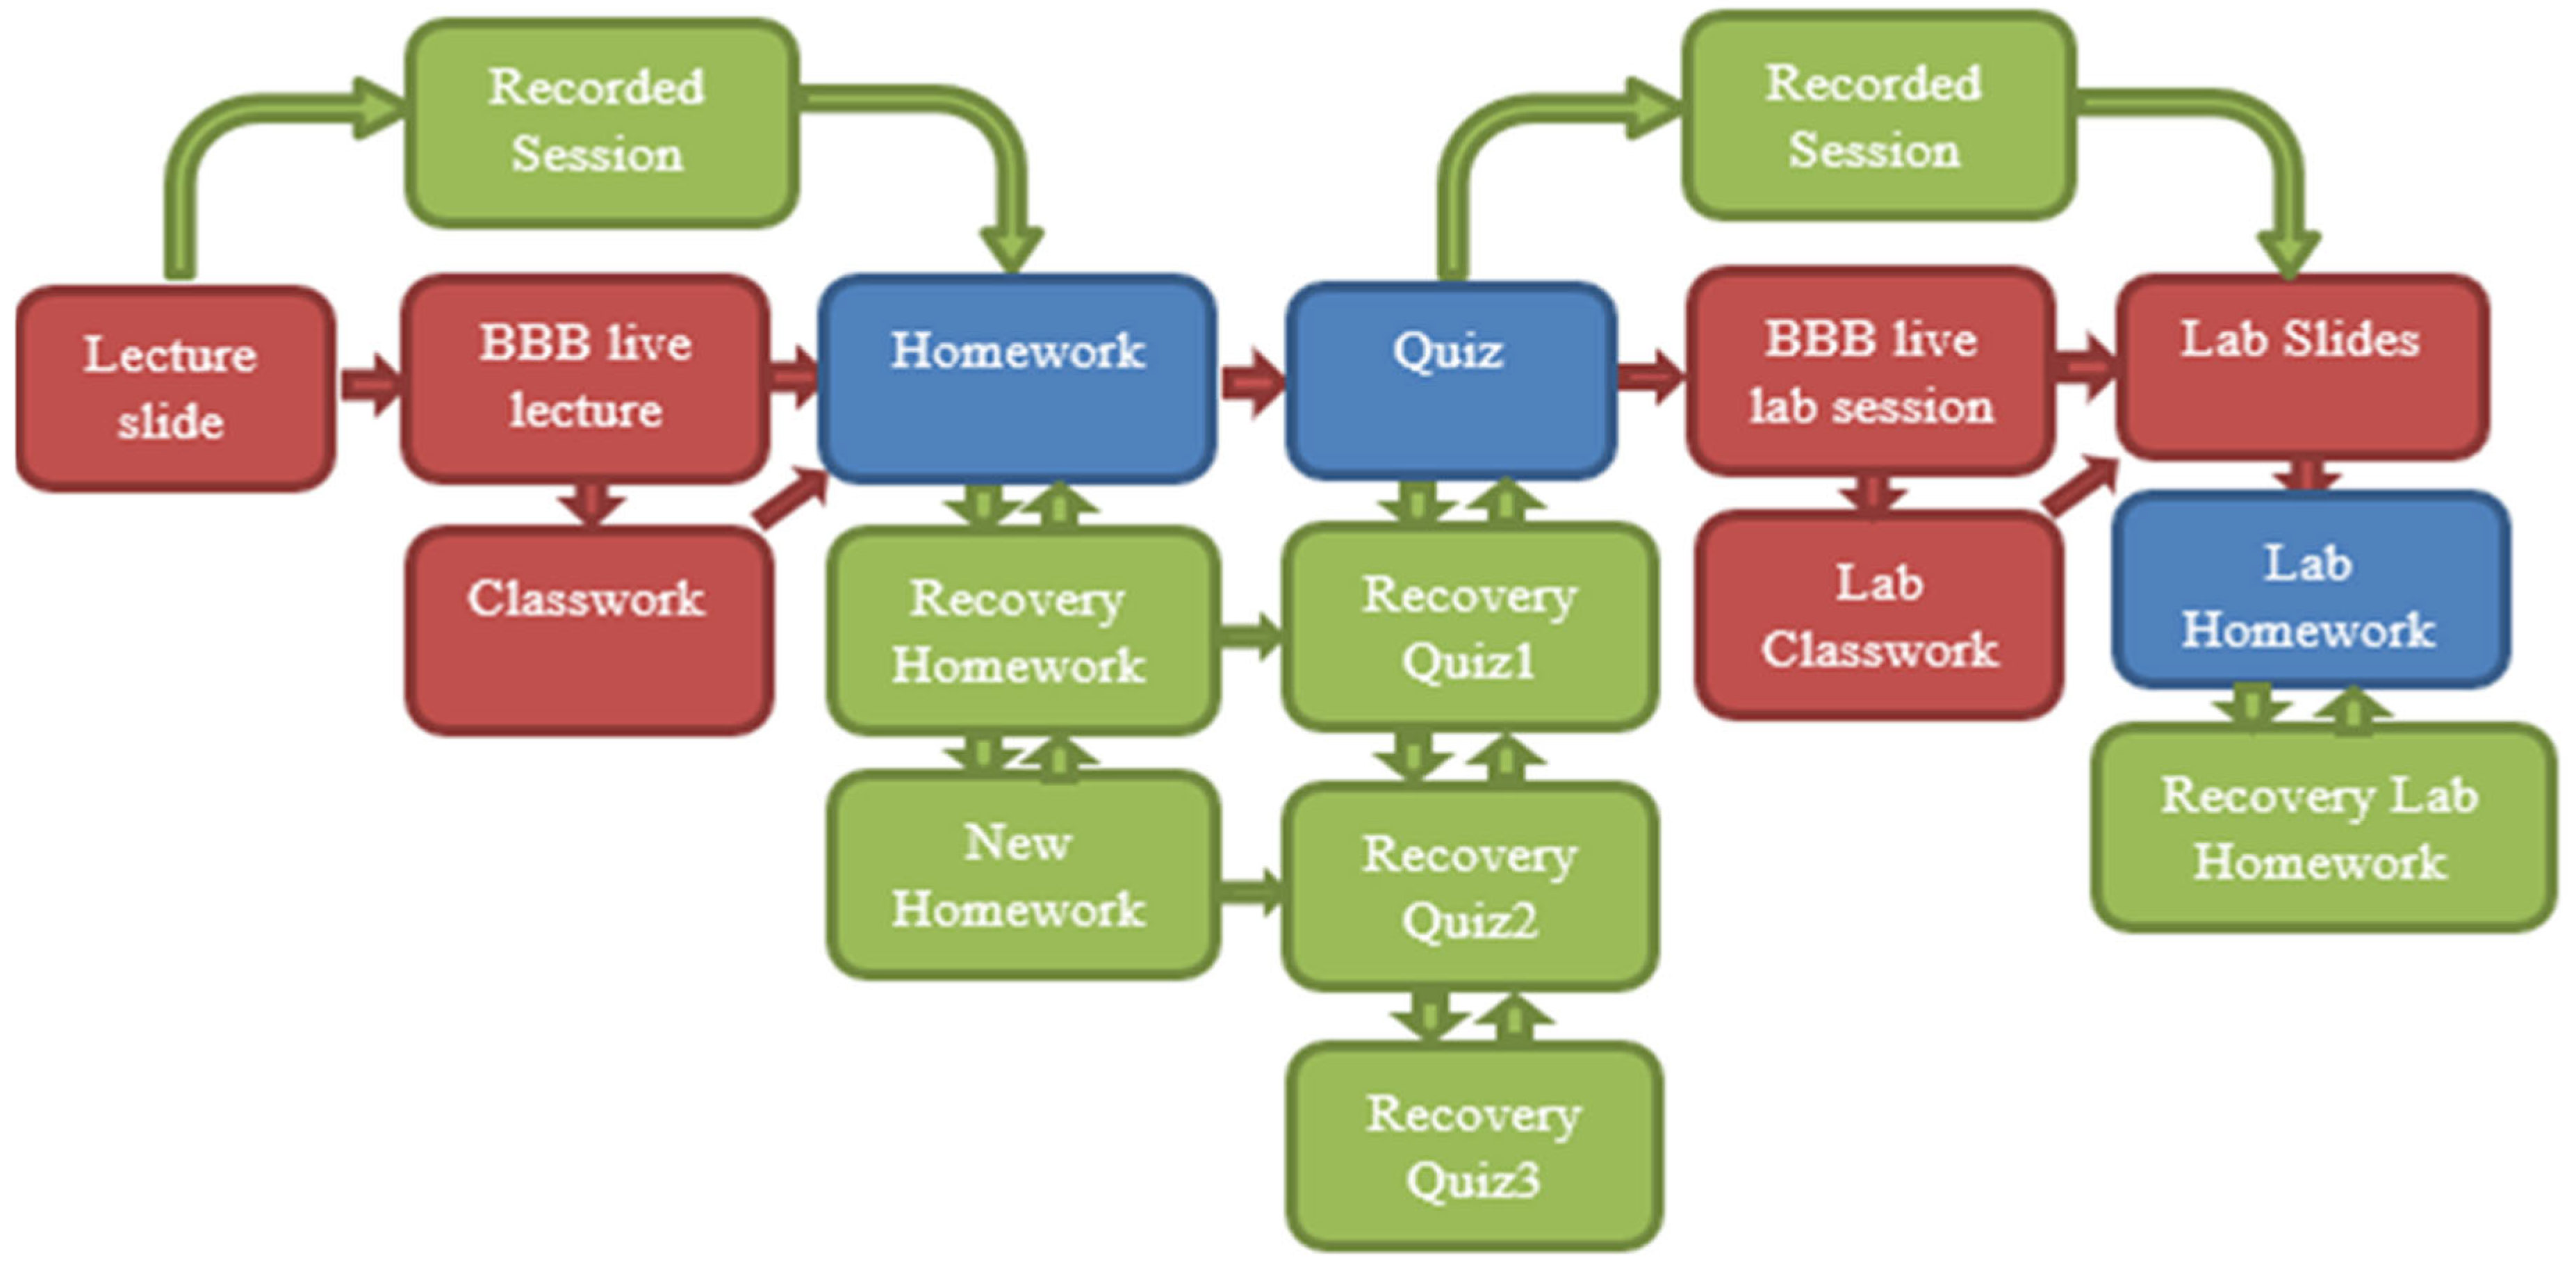
3.3.1. Course Module and Learning Path
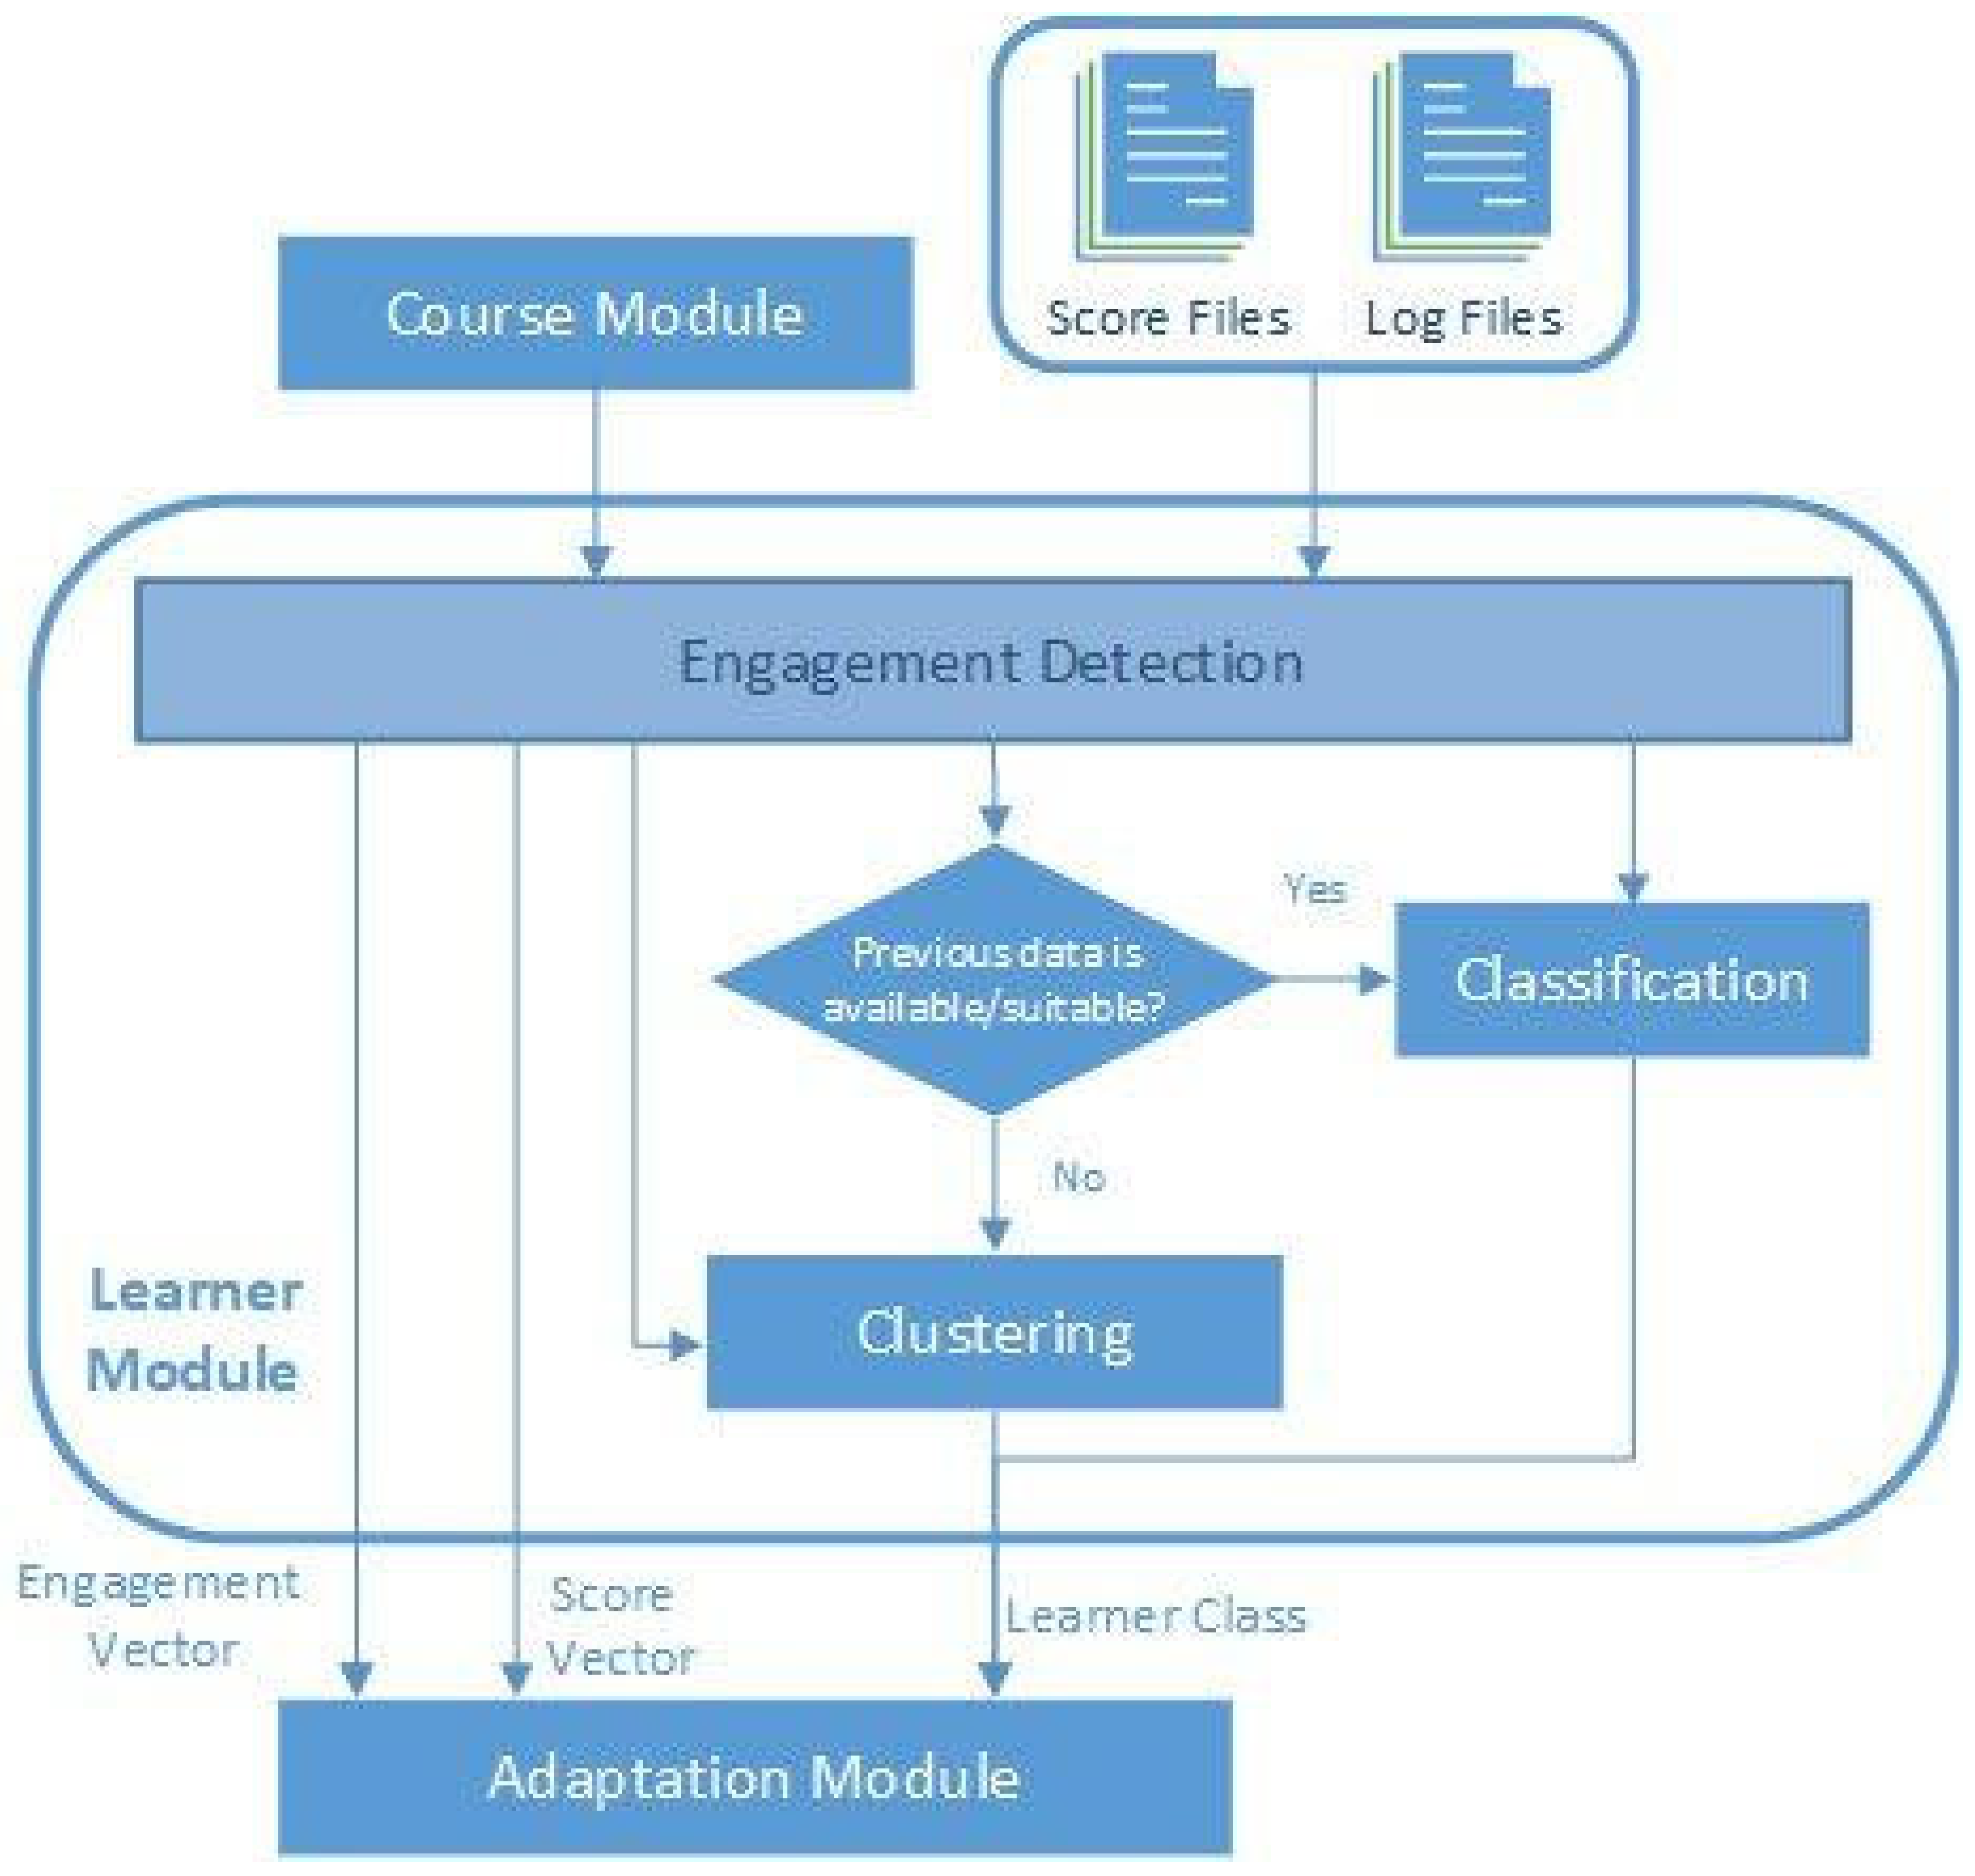
3.3.2. Learner Module
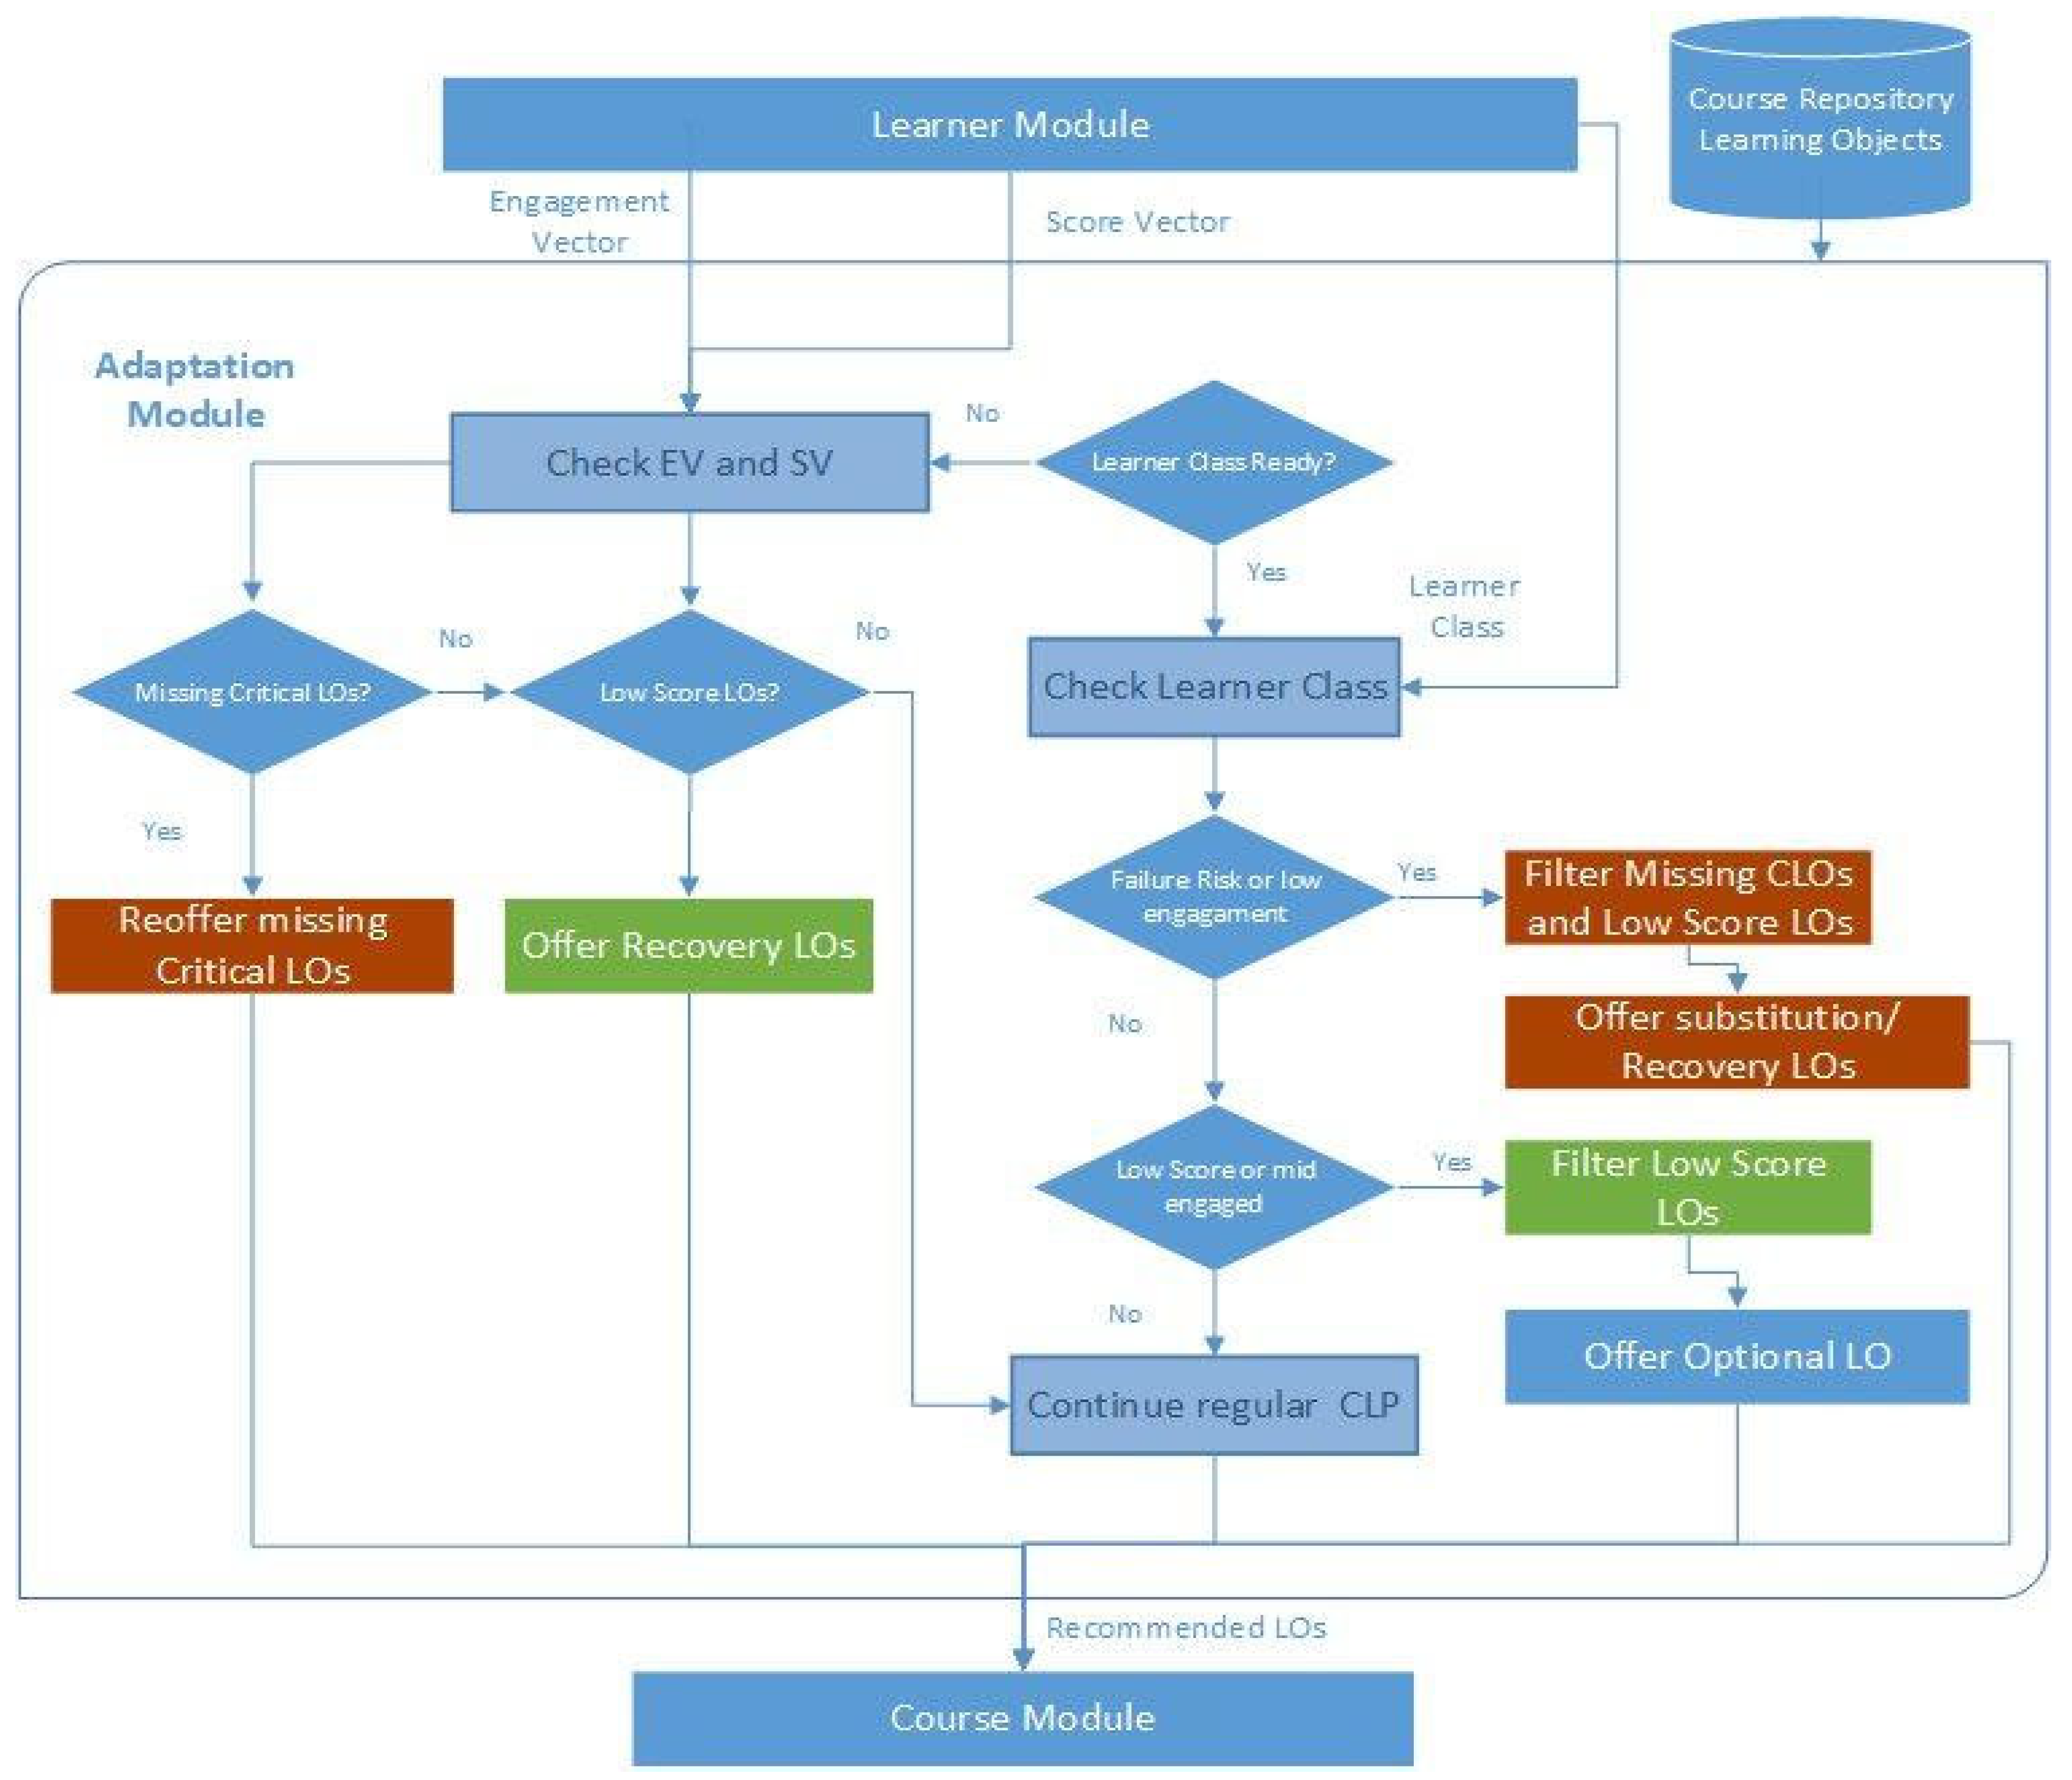
3.3.3. Adaptation Module
3.4. Experimental Setup
3.4.1. Participants
3.4.2. Course Organization
4. Results
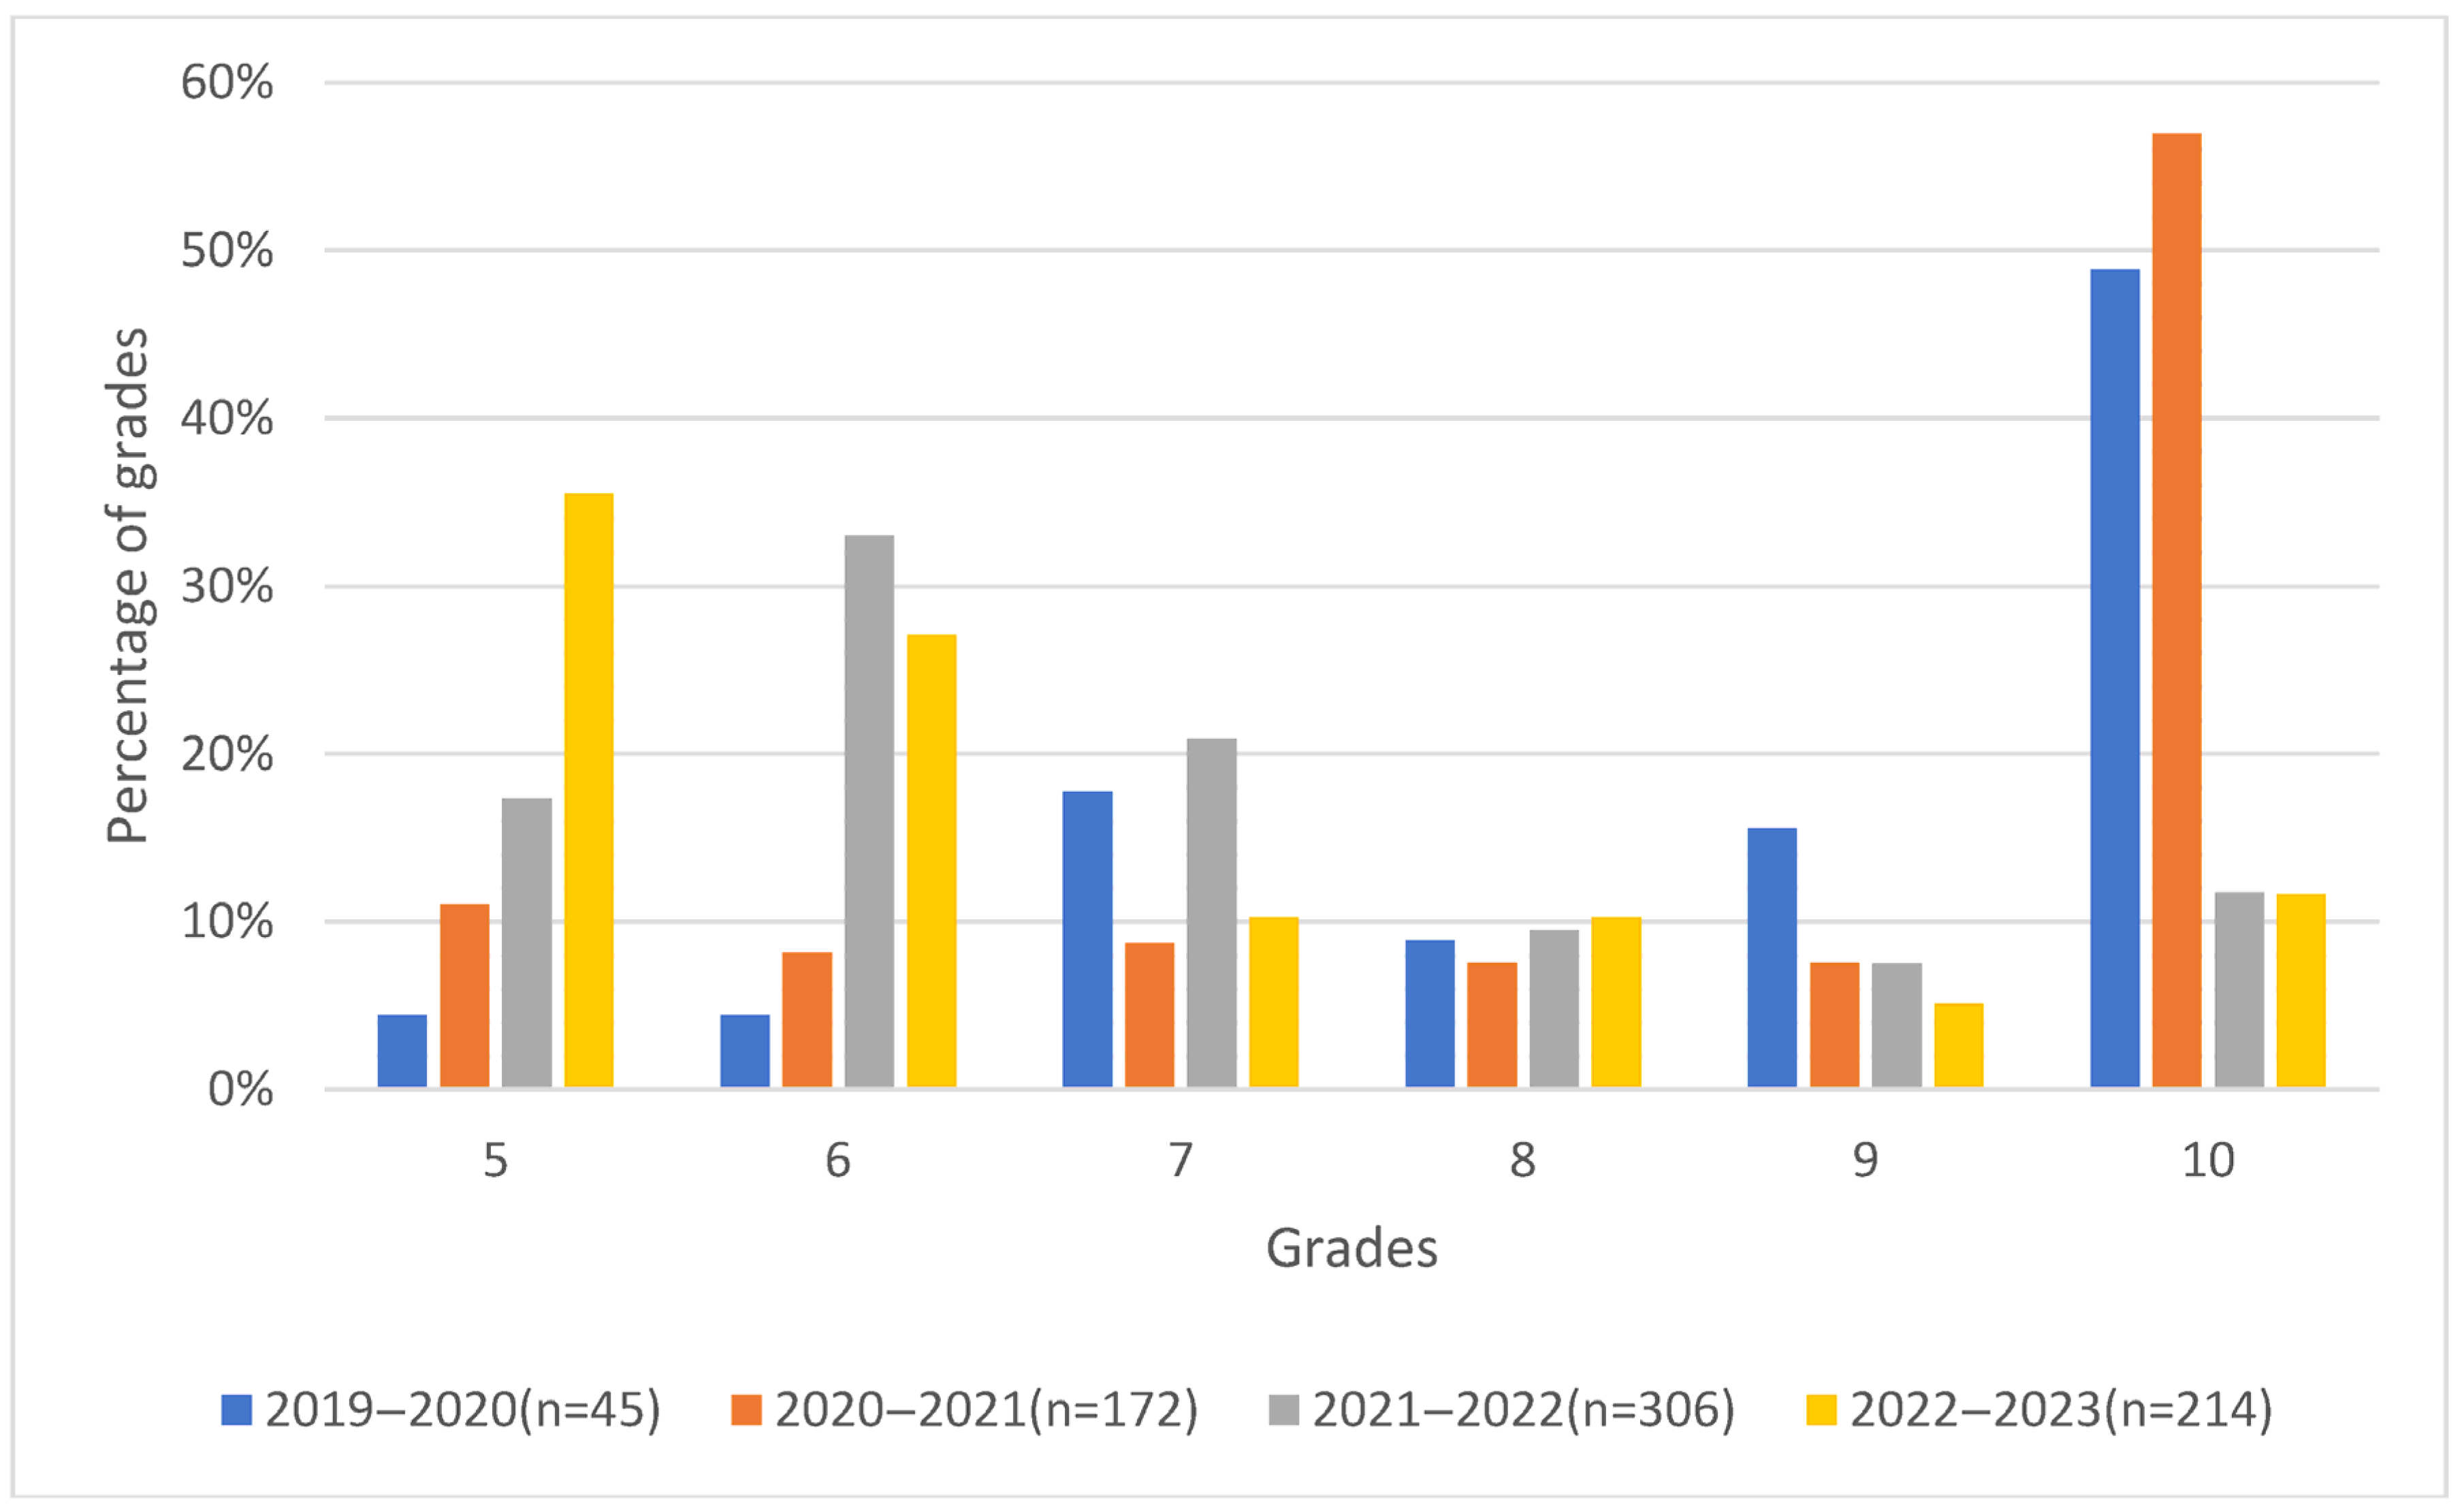
4.1. Impact of Adaptive Framework on Course Success and Student Grades
4.2. Students’ LMS Engagement
4.3. Behavioral Patterns of Failing Students
5. Discussion
- Integrate AI-based content recommenders that auto-suggest resources based on learner profiles.
- Automate grading using NLP and rubrics for open-ended tasks.
- Embed dashboards to visualize EV/SV trends for tutors.
- Develop autonomous decision engines capable of adjusting course rules in real time.
6. Conclusions
6.1. Limitations and Future Work
6.2. Key Contributions and Takeaways
Author Contributions
Funding
Institutional Review Board Statement
Informed Consent Statement
Data Availability Statement
Acknowledgments
Conflicts of Interest
Abbreviations
| AI | Artificial Intelligence |
| ALS | Adaptive Learning Systems |
| BBB | Big Blue Button |
| CLP | Critical Learning Path |
| EDM | Educational Data Mining |
| EV | Engagement Vector |
| LA | Learning Analytics |
| LMS | Learning Management Systems |
| LO | Learning Object |
| PLP | Personal Learning Path |
| SV | Score Vector |
References
- Luna-Urquizo, J. Learning Management System Personalization Based on Multi-Attribute Decision Making Techniques and Intuitionistic Fuzzy Numbers. Int. J. Adv. Comput. Sci. Appl. 2019, 10, 669–676. [Google Scholar] [CrossRef]
- Ean Heng, L.; Pei Voon, W.; Jalil, N.A.; Lee Kwun, C.; Chee Chieh, T.; Fatiha Subri, N. Personalization of Learning Content in Learning Management System. In ICSCA ’21, Proceedings of the 2021 10th International Conference on Software and Computer Applications, Kuala Lumpur, Malaysia, 23–26 February 2021; Association for Computing Machinery: New York, NY, USA, 2021; pp. 219–223. [Google Scholar] [CrossRef]
- Ahmad, S.F.; Alam, M.M.; Rahmat, M.K.; Mubarik, M.S.; Hyder, S.I. Academic and Administrative Role of Artificial Intelligence in Education. Sustainability 2022, 14, 1101. [Google Scholar] [CrossRef]
- Xie, H.; Chu, H.C.; Hwang, G.J.; Wang, C.C. Trends and Development in Technology-Enhanced Adaptive/Personalized Learning: A Systematic Review of Journal Publications from 2007 to 2017. Comput. Educ. 2019, 140, 103599. [Google Scholar] [CrossRef]
- Wu, C.H.; Chen, Y.S.; Chen, T.C. An Adaptive E-Learning System for Enhancing Learning Performance: Based on Dynamic Scaffolding Theory. EURASIA J. Math. Sci. Technol. Educ. 2017, 14, 903–913. [Google Scholar] [CrossRef]
- McCarthy, K.S.; Watanabe, M.; Dai, J.; McNamara, D.S. Personalized Learning in ISTART: Past Modifications and Future Design. J. Res. Technol. Educ. 2020, 52, 301–321. [Google Scholar] [CrossRef]
- Jing, Y.; Zhao, L.; Zhu, K.; Wang, H.; Wang, C.; Xia, Q. Research Landscape of Adaptive Learning in Education: A Bibliometric Study on Research Publications from 2000 to 2022. Sustainability 2023, 15, 3115. [Google Scholar] [CrossRef]
- Kabudi, T.; Pappas, I.; Olsen, D.H. AI-Enabled Adaptive Learning Systems: A Systematic Mapping of the Literature. Comput. Educ. Artif. Intell. 2021, 2, 100017. [Google Scholar] [CrossRef]
- Dziuban, C.; Moskal, P.; Johnson, C.; Evans, D. Adaptive Learning: A Tale of Two Contexts. Curr. Issues Emerg. Elearn. 2017, 4, 3. [Google Scholar]
- Brown, A.H.; Green, T.D. The Essentials of Instructional Design: Connecting Fundamental Principles with Process and Practice. In The Essentials of Instructional Design: Connecting Fundamental Principles with Process and Practice; Routledge: Abingdon-on-Thames, UK, 2019; pp. 1–274. [Google Scholar] [CrossRef]
- Castro, R. Blended Learning in Higher Education: Trends and Capabilities. Educ. Inf. Technol. 2019, 24, 2523–2546. [Google Scholar] [CrossRef]
- Faghir Ganji, M.; Jafari Malvajerd, A.; Moradi, A.; Amanollahi, A.; Ansari-Moghaddam, A.; Basir Ghafouri, H. Teachers and Managers Experiences of Virtual Learning during the COVID-19 Pandemic: A Qualitative Study. Heliyon 2024, 10, e24118. [Google Scholar] [CrossRef] [PubMed]
- Rosen, Y.; Rushkin, I.; Rubin, R.; Munson, L.; Ang, A.; Weber, G.; Lopez, G.; Tingley, D. Adaptive Learning Open Source Initiative for MOOC Experimentation. In Artificial Intelligence in Education, Proceedings of the 19th International Conference, AIED 2018, London, UK, 27–30 June 2018; Springer: Berlin/Heidelberg, Germany, 2018; Volume 10948, pp. 307–311. [Google Scholar] [CrossRef]
- Zhao, S.; Hai, G.; Ma, H. Adaptive Learning Systems: Exploring Personalized Paths in Vocational Education. Curric. Learn. Explor. 2024, 2. [Google Scholar] [CrossRef]
- Liu, X.; Du, Y.; Sun, F.; Zhai, L. Design of Adaptive Learning System Based on Big Data. In ICIE ’17, Proceedings of the 6th International Conference on Information Engineering, Dalian, China, 17–18 August 2017; Association for Computing Machinery: New York, NY, USA, 2017. [Google Scholar] [CrossRef]
- Graf, A. Exploring the Role of Personalization in Adaptive Learning Environments. Int. J. Softw. Eng. Comput. Sci. IJSECS 2023, 3, 50–56. [Google Scholar] [CrossRef]
- Sabeima, M.; Lamolle, M.; Nanne, M.F. Towards Personalized Adaptive Learning in E-Learning Recommender Systems. Int. J. Adv. Comput. Sci. Appl. 2022, 13, 14–20. [Google Scholar] [CrossRef]
- Diaz, F.S.; Rubilar, T.P.; Figueroa, C.C.; Silva, R.M. An Adaptive E-Learning Platform with VARK Learning Styles to Support the Learning of Object Orientation. In Proceedings of the 2018 IEEE World Engineering Education Conference (EDUNINE), Buenos Aires, Argentina, 11–14 March 2018; pp. 1–6. [Google Scholar]
- Nafea, S.M.; Siewe, F.; He, Y. An Adaptive Learning Ontological Framework Based on Learning Styles and Teaching Strategies. Proceedings of 85th ISERD International Conference, Cairo, Egypt, 11–12 September 2017; pp. 11–12. [Google Scholar]
- Rasheed, F.; Wahid, A. Learning Style Recognition: A Neural Network Approach. In First International Conference on Artificial Intelligence and Cognitive Computing; Advances in Intelligent Systems and Computing; Springer: Berlin/Heidelberg, Germany, 2019; pp. 301–312. [Google Scholar]
- El-Sabagh, H.A. Adaptive E-Learning Environment Based on Learning Styles and Its Impact on Development Students’ Engagement. Int. J. Educ. Technol. High. Educ. 2021, 18, 53. [Google Scholar] [CrossRef]
- Afini Normadhi, N.B.; Shuib, L.; Md Nasir, H.N.; Bimba, A.; Idris, N.; Balakrishnan, V. Identification of Personal Traits in Adaptive Learning Environment: Systematic Literature Review. Comput. Educ. 2019, 130, 168–190. [Google Scholar] [CrossRef]
- Sachan, D.; Saroha, K. A Review of Adaptive and Intelligent Online Learning Systems. Lect. Notes Netw. Syst. 2022, 314, 251–262. [Google Scholar] [CrossRef]
- Motz, B.; Quick, J.; Schroeder, N.; Zook, J.; Gunkel, M. The Validity and Utility of Activity Logs as a Measure of Student Engagement. In LAK19, Proceedings of the 9th International Conference on Learning Analytics & Knowledge, Tempe, AZ, USA, 4–8 March 2019; Association for Computing Machinery: New York, NY, USA, 2019; pp. 300–309. [Google Scholar] [CrossRef]
- Henrie, C.R.; Bodily, R.; Larsen, R.; Graham, C.R. Exploring the Potential of LMS Log Data as a Proxy Measure of Student Engagement. J. Comput. High. Educ. 2018, 30, 344–362. [Google Scholar] [CrossRef]
- Conde, M.Á.; Hérnandez-García, Á.; García-Peñalvo, F.J.; Séin-Echaluce, M.L. Exploring Student Interactions: Learning Analytics Tools for Student Tracking. Lect. Notes Comput. Sci. Incl. Subser. Lect. Notes Artif. Intell. Lect. Notes Bioinform. 2015, 9192, 50–61. [Google Scholar] [CrossRef]
- Figueira, Á. Mining Moodle Logs for Grade Prediction: A Methodology Walk-Through. In Proceedings of the 5th International Conference on Technological Ecosystems for Enhancing Multiculturality, Cádiz, Spain, 18–20 October 2017; pp. 1–8. [Google Scholar]
- Käser, T.; Hallinen, N.R.; Schwartz, D.L. Modeling Exploration Strategies to Predict Student Performance within a Learning Environment and Beyond. In LAK ’17, Proceedings of the Seventh International Learning Analytics & Knowledge Conference, Vancouver, BC, Canada, 13–17 March 2017; Association for Computing Machinery: New York, NY, USA, 2017; pp. 31–40. [Google Scholar] [CrossRef]
- Gupta, P.; Kulkarni, T.; Toksha, B. AI-Based Predictive Models for Adaptive Learning Systems. In Artificial Intelligence in Higher Education; CRC Press: Boca Raton, FL, USA, 2022; pp. 113–136. [Google Scholar] [CrossRef]
- De Bra, P.; Smits, D.; van der Sluijs, K.; Cristea, A.I.; Foss, J.; Glahn, C.; Steiner, C.M. GRAPPLE: Learning Management Systems Meet Adaptive Learning Environments. In Intelligent and Adaptive Educational-Learning Systems; Springer: Berlin/Heidelberg, Germany, 2013; pp. 133–160. [Google Scholar]
- Wang, S.; Christensen, C.; Cui, W.; Tong, R.; Yarnall, L.; Shear, L.; Feng, M. When Adaptive Learning Is Effective Learning: Comparison of an Adaptive Learning System to Teacher-Led Instruction. Interact. Learn. Environ. 2023, 31, 793–803. [Google Scholar] [CrossRef]
- Arsovic, B.; Stefanovic, N. E-Learning Based on the Adaptive Learning Model: Case Study in Serbia. Sadhana—Acad. Proc. Eng. Sci. 2020, 45, 266. [Google Scholar] [CrossRef]
- Alsadoon, E. The Impact of an Adaptive E-Course on Students’ Achievements Based on the Students’ Prior Knowledge. Educ. Inf. Technol. 2020, 25, 3541–3551. [Google Scholar] [CrossRef]
- Shamsutdinova, T.M. Formation of Individual Educational Trajectory in Adaptive Learning Management Systems. Open Educ. 2021, 25, 36–44. [Google Scholar] [CrossRef]
- Bloom, B.S. Taxonomy of Educational Objectives Book 1: Cognitive Domain; Addison-Wesley Longman Ltd.: Boston, MA, USA, 1984. [Google Scholar]
- Wambsganss, T.; Janson, A.; Söllner, M.; Koedinger, K.; Marco, J.; Leimeister, J.M. Improving Students’ Argumentation Skills Using Dynamic Machine-Learning–Based Modeling. Inf. Syst. Res. 2024, 36, 474–507. [Google Scholar] [CrossRef]
- Tenório, K.; Dermeval, D.; Monteiro, M.; Peixoto, A.; Silva, A.P. da Exploring Design Concepts to Enable Teachers to Monitor and Adapt Gamification in Adaptive Learning Systems: A Qualitative Research Approach. Int. J. Artif. Intell. Educ. 2022, 32, 867–891. [Google Scholar] [CrossRef]
- Hamari, J. Do Badges Increase User Activity? A Field Experiment on the Effects of Gamification. Comput. Hum. Behav. 2017, 71, 469–478. [Google Scholar] [CrossRef]
- Denny, P. The Effect of Virtual Achievements on Student Engagement. In CHI ’13, Proceedings of the SIGCHI Conference on Human Factors in Computing Systems, Paris France, 27 April–2 May 2013; Association for Computing Machinery: New York, NY, USA, 2013; pp. 763–772. [Google Scholar] [CrossRef]
- Chiu, M.C.; Moss, E.; Richards, T. Effect of Deadlines on Student Submission Timelines and Success in a Fully-Online Self-Paced Course. In SIGCSE 2024, Proceedings of the 55th ACM Technical Symposium on Computer Science Education, Portland, OR, USA, 20–23 March 2024; Association for Computing Machinery: New York, NY, USA, 2024; Volume 1, pp. 207–213. [Google Scholar] [CrossRef]
- Ariely, D.; Wertenbroch, K. Procrastination, Deadlines, and Performance: Self-Control by Precommitment. Psychol. Sci. 2002, 13, 219–224. [Google Scholar] [CrossRef] [PubMed]
- Allaire, J.J. RStudio: Integrated Development Environment for R; R Foundation for Statistical Computing: Vienna, Austria, 2016. [Google Scholar]
- Ademi, N.; Loshkovska, S. Exploratory Analysis of Student Activities and Success Based on Moodle Log Data. In Proceedings of the 16th International Conference on Informatics and Information Technologies, Mavrovo, North Macedonia, 10–12 May 2019. [Google Scholar]
- Ademi, N.; Loshkovska, S.; Kalajdziski, S. Prediction of Student Success Through Analysis of Moodle Logs: Case Study. In ICT Innovations 2019. Big Data Processing and Mining, Proceedings of the 11th International Conference, Ohrid, North Macedonia, 17–19 October 2019; Gievska, S., Madzarov, G., Eds.; Springer: Cham, Switzerland, 2019; pp. 27–40. [Google Scholar]
- Ademi, N.; Loshkovska, S. Weekly Analysis of Moodle Log Data for Future Use in Prediction. In Proceedings of the 17th International Conference on Informatics and Information Technologies—CIIT 2020, Mavrovo, North Macedonia, 8 May 2020. [Google Scholar]
- Ademi, N.; Loshkovska, S. Clustering Learners in a Learning Management System to Provide Adaptivity. In Proceedings of the ICT Innovations 2020, Skopje, North Macedonia, 24–26 September 2020; pp. 82–95. [Google Scholar]
- Anderson, L.W. Objectives, evaluation, and the improvement of education. Stud. Educ. Eval. 2005, 31, 102–113. [Google Scholar] [CrossRef]


| Learning Objects | Type | Type of Learning Outcomes/Aims of LOs |
|---|---|---|
| Lecture Notes (L) | Asynchronous, Critical | Presentation slides are available during the course timeline and can be accessed anytime. |
| Online lectures (OL) | Synchronous, Critical | Video-conferencing (BigBlueButton) Online Sessions with the instructor are organized within the faculty schedule’s timeframes, and repetition is not considered. |
| Recorded views (R) | Asynchronous, Optional, Recovery | Video-conferencing online session recordings. They are made during online lectures and are available any time after the lecture. There are no restrictions or limitations on their access. |
| Classwork (C) | Synchronous, Optional, Assessment | Coached activities during the online lectures to remember and apply the course content. They are graded only if finished within a defined deadline and without a recovery option. Classwork is available to all students. |
| Homework (H) | Asynchronous, Critical, Assessment | Small tasks based on a specific topic to understand and apply concepts. Tasks are graded. Recovery actions are considered and usually consist of new homework. The selection of the recovery activity is part of the adaptation module. |
| Quizzes (Q) | Asynchronous, Optional, Assessment, Recovery | Quizzes (SEQ) with multiple choice questions aimed to help remember terminology. Quizzes are graded, and the rules and restrictions regarding the quizzes are defined for each academic year. |
| Lab Exercises (L) | Synchronous, Optional, Assessment | Lab exercises aim to develop practical problem-solving skills by applying the topic knowledge. They follow the format of classwork with online guidance. They must be submitted by a predefined deadline, and the recovery action is not considered. In certain academic years, this activity is wholly omitted. |
| Lab Homework (LH) | Asynchronous, Critical, Assessment | Problems that help students apply, analyze, and evaluate the learned topics. The activities are graded, and recovery is considered. Rules and restrictions are previously defined and are used by the adaptation module. |
| Project (P) | Asynchronous, Optional, Assessment | A final project where students apply acquired knowledge to solve real problems and create a unique product. This LO is optional; the project is graded, but recovery is not considered. |
| Group | Teaching Style | Rules | Number of the Students |
|---|---|---|---|
| 2019–2020 | Non-adaptive blended | time limits; no lab exercises, repetition allowed during exam periods | 45 |
| 2020–2021 (Group A) | Adaptive with live sessions | time limits, no repetition limits, all points scored | 172 |
| 2021–2022 (Group B) | Adaptive with live sessions | time limits, repetition limits on quizzes, limitations on scores | 306 |
| 2022–2023 (Group C) | Adaptive with live sessions | no time limits, repetition limits on quizzes, and constraints on scores. | 214 |
| Activity Type | Maximum Number of Activities During One Semester | Minimum Number of Points per Activity | Total Points from All Activities in One Semester |
|---|---|---|---|
| Self-Evaluation Quiz | 10 | 5 | 70 |
| Classwork | 10 | 30 | 200 |
| Homework | 10 | 30 | 500 |
| Lab Classwork | 10 | 30 | 200 |
| Lab Homework | 10 | 30 | 330 |
| Badges | 9 | 10 | 90 |
| Project | 1 | 100 | 150 |
| Total Score | above points are calculated each year with a limit of 1000 | ||
| Adaptation | Participants | Average Grade | Percentage of the Total Number of Students Passed During the Semester | Total Percentage of Students Passed at the End of the Year | Overall Failure Rate |
|---|---|---|---|---|---|
| Non-adaptive | 45 | 8.90 | 29.73% | 95% | 5% |
| Adaptive Group A | 172 | 9.08 | 86.18% | 89% | 11% |
| Adaptive Group B | 306 | 7.32 | 72.91% | 83% | 17% |
| Adaptive Group C | 214 | 7.44 | 48.00% | 64% | 36% |
| Adaptation | Total LMS Course Visits | Online Class Attendance | Recording Views | Course Views |
|---|---|---|---|---|
| Non-adaptive | 414.91 | 10.04 | * 15.24 | 102.21 |
| Adaptive Group A | 442.36 | 8.50 | 4.52 | 118.28 |
| Adaptive Group B | 619.36 | 19.79 | 12.54 | 173.83 |
| Adaptive Group C | 369.75 | 22.05 | 7.99 | 94.78 |
| Groups | Quiz M ± SD | Classwork M ± SD | Homework M ± SD | Lab Classwork M ± SD | Lab Homework M ± SD | Project M ± SD | Total M ± SD |
|---|---|---|---|---|---|---|---|
| Non-adaptive | 6.84 ± 1.24 | 6.49 ± 3.07 | 8.33 ± 2.76 | 2.51 ± 1.08 | NA | 0.07 ± 0.25 | 24.07 ± 5.67 |
| Adaptive Group A | 7.13 ± 1.43 | 6.17 ± 2.88 | 6.52 ± 2.08 | 4.23 ± 2.87 | 5.54 ± 2.51 | 0.10 ± 0.30 | 29.59 ± 8.10 |
| Adaptive Group B | 6.98 ± 1.41 | 7.65 ± 3.14 | 8.57 ± 2.99 | 7.47 ± 3.35 | 7.93 ± 2.58 | 0.30 ± 0.45 | 38.6 ± 10.08 |
| Adaptive Group C | 8.16 ± 2.17 | 5.37 ± 3.58 | 7.84 ± 3.67 | 6.59 ± 2.28 | NA | 0.10 ± 0.40 | 27.97 ± 11.71 |
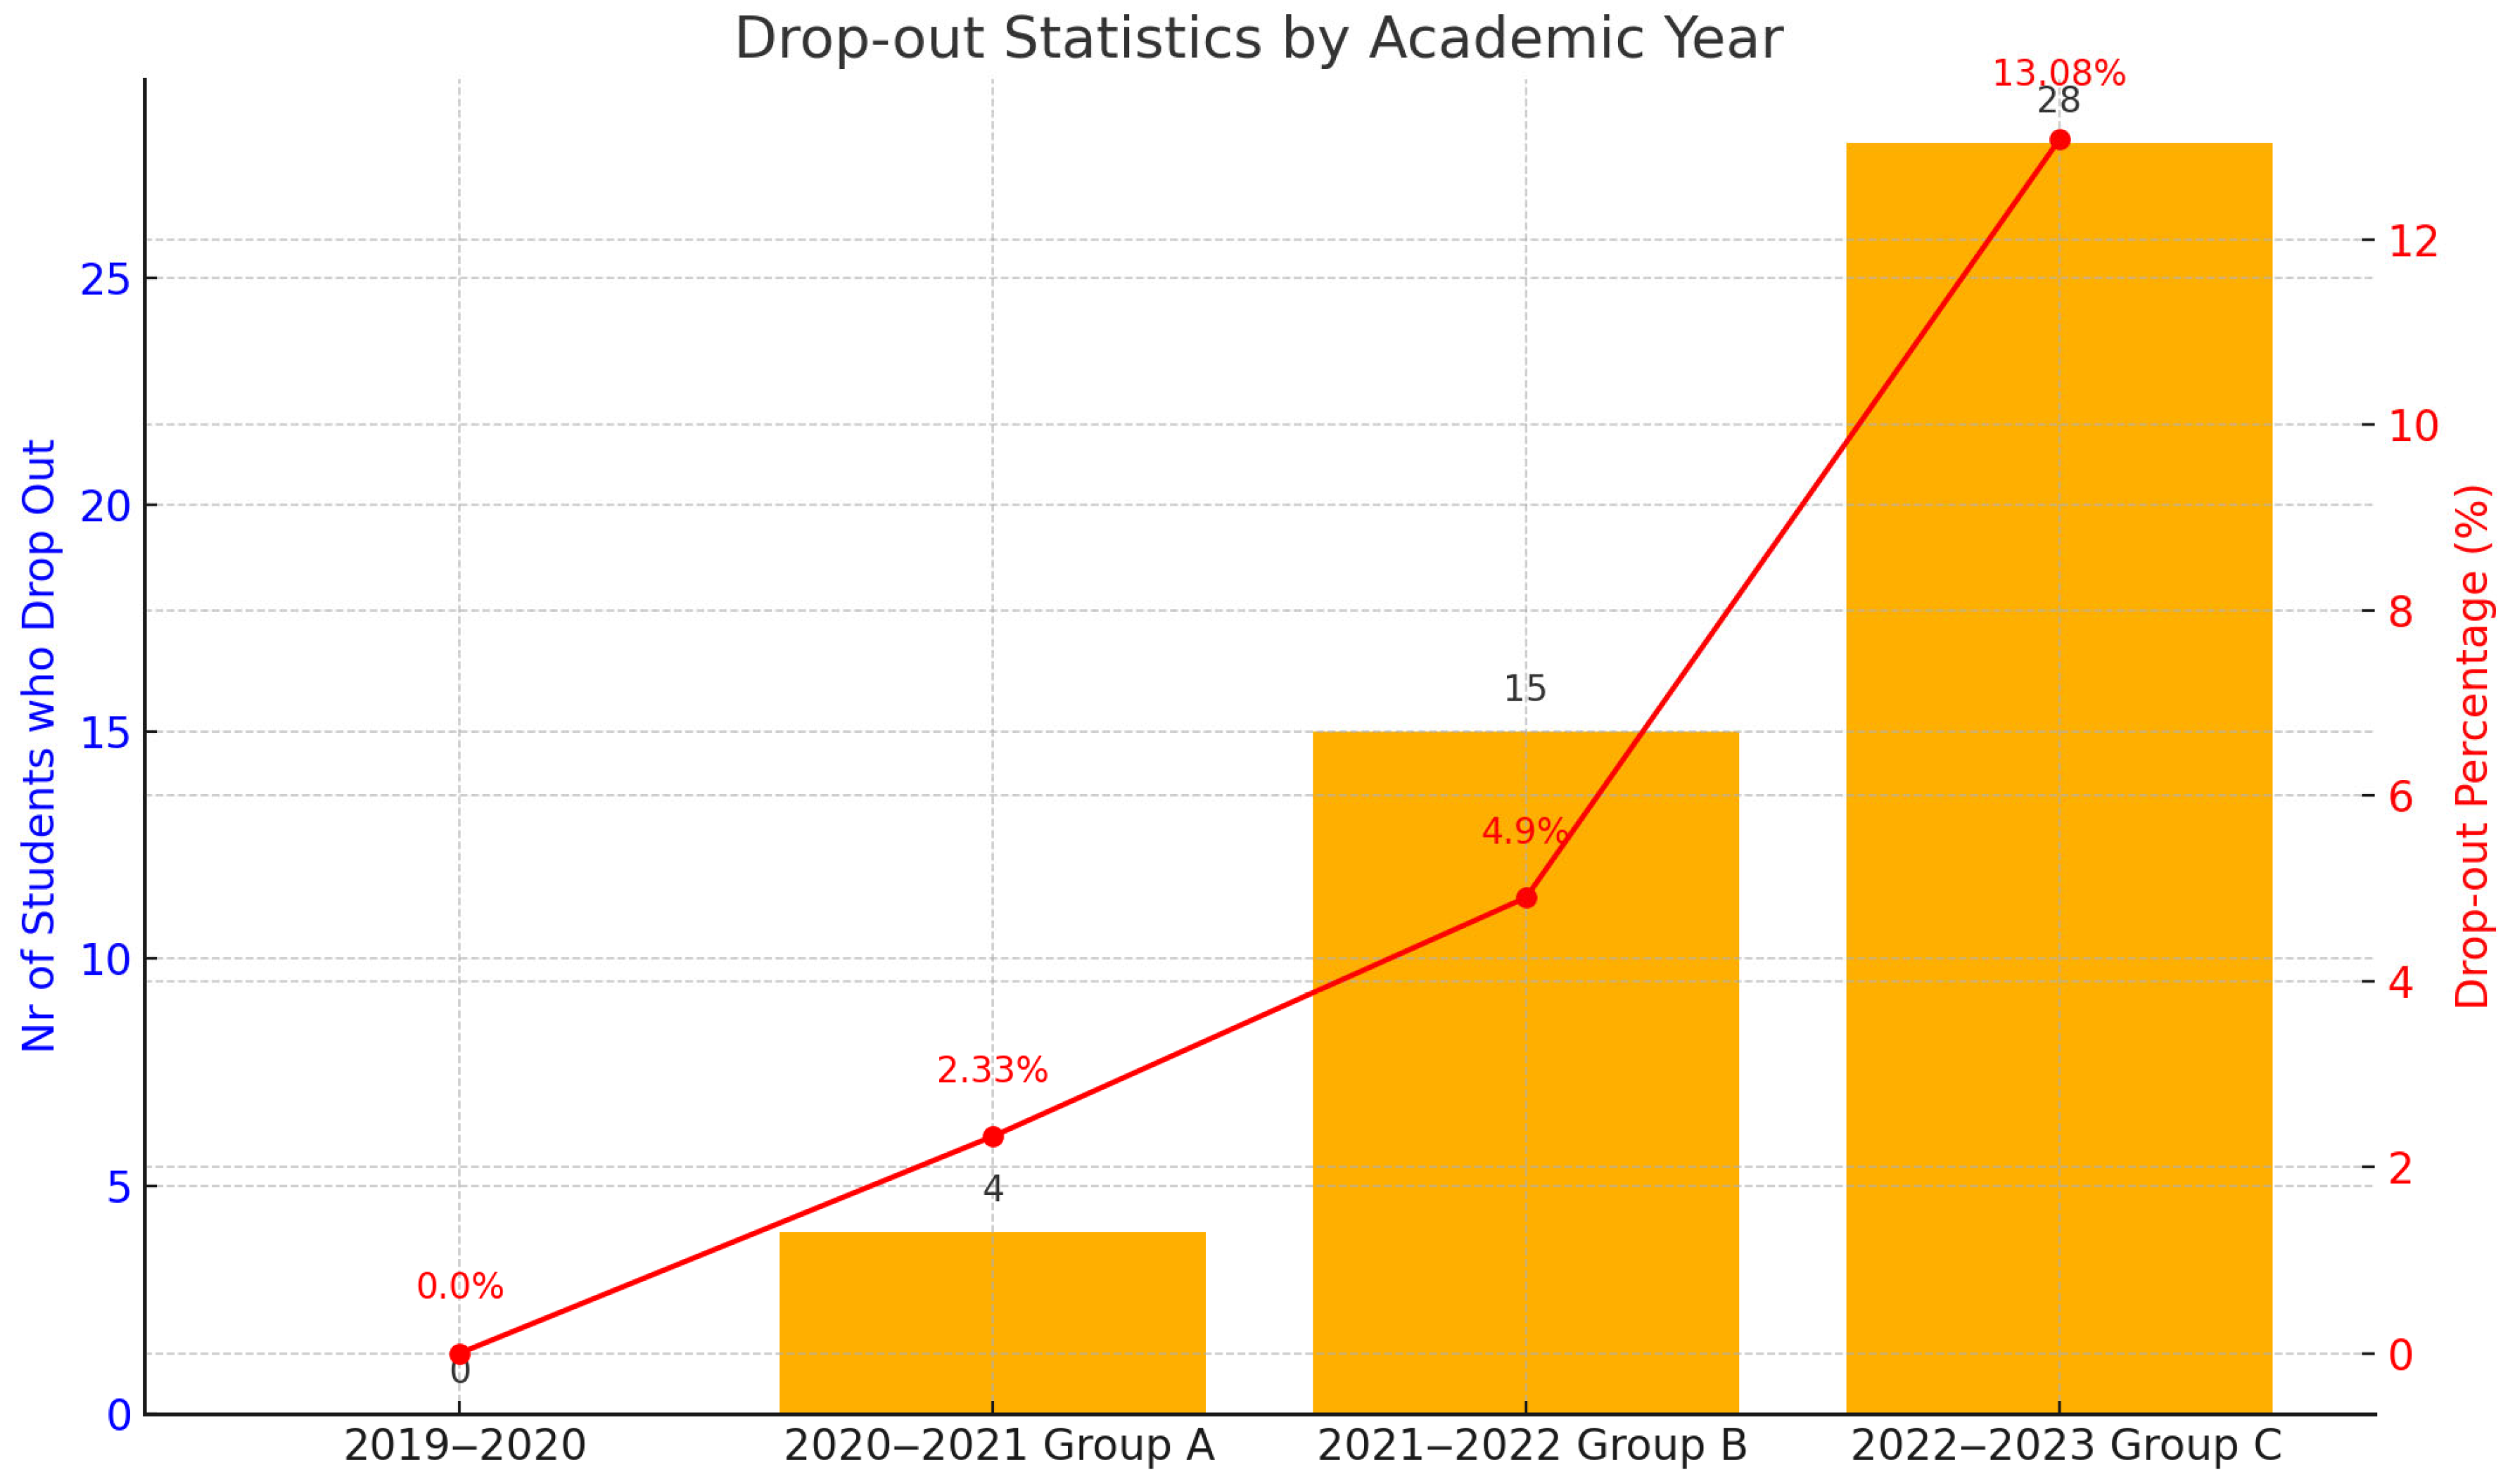
| Academic Year | Failure Rate | Nr of Students Who Drop Out | Percentage of Drop-Outs |
|---|---|---|---|
| 2019–2020 | 5% | 0 | 0.00% |
| 2020–2021 Group A | 11% | 4 | 2.33% |
| 2021–2022 Group B | 17% | 15 | 4.90% |
| 2022–2023 Group C | 36% | 28 | 13.08% |
| Number of Students | Percentages | Behavior Pattern | |
|---|---|---|---|
| Drop-out | 4 | 21% | None of the activities are performed |
| Failed | 13 | 68% | No classwork submission, no BBB attendance only quizzes repeated |
| 2 | 11% | Only one classwork submission | |
| Total | 19 |
| Clusters | Nr of Students | Mean Grade | Standard Deviation (Grade) |
|---|---|---|---|
| Cluster0 | 108 (50%) | 7.72 | 1.60 |
| Cluster1 | 52 (24%) | 5.83 | 0.76 |
| Cluster2 | 54 (25%) | 5 | 0.0019 |
| Average Number of Lab Work Repetitions | Not Submitted | Submitted, Submitted and Resubmitted | Resubmitted Three Times |
|---|---|---|---|
| Percentage of students | 38% | 73% | 1% |
Disclaimer/Publisher’s Note: The statements, opinions and data contained in all publications are solely those of the individual author(s) and contributor(s) and not of MDPI and/or the editor(s). MDPI and/or the editor(s) disclaim responsibility for any injury to people or property resulting from any ideas, methods, instructions or products referred to in the content. |
© 2025 by the authors. Licensee MDPI, Basel, Switzerland. This article is an open access article distributed under the terms and conditions of the Creative Commons Attribution (CC BY) license (https://creativecommons.org/licenses/by/4.0/).
Share and Cite
Ademi, N.; Loshkovska, S. Data-Driven Adaptive Course Framework—Case Study: Impact on Success and Engagement. Multimodal Technol. Interact. 2025, 9, 74. https://doi.org/10.3390/mti9070074
Ademi N, Loshkovska S. Data-Driven Adaptive Course Framework—Case Study: Impact on Success and Engagement. Multimodal Technologies and Interaction. 2025; 9(7):74. https://doi.org/10.3390/mti9070074
Chicago/Turabian StyleAdemi, Neslihan, and Suzana Loshkovska. 2025. "Data-Driven Adaptive Course Framework—Case Study: Impact on Success and Engagement" Multimodal Technologies and Interaction 9, no. 7: 74. https://doi.org/10.3390/mti9070074
APA StyleAdemi, N., & Loshkovska, S. (2025). Data-Driven Adaptive Course Framework—Case Study: Impact on Success and Engagement. Multimodal Technologies and Interaction, 9(7), 74. https://doi.org/10.3390/mti9070074