
The Influence of the Labeling Effect on the Perception of Command Execution Delay in Gaming


Abstract
1. Introduction
2. Related Work
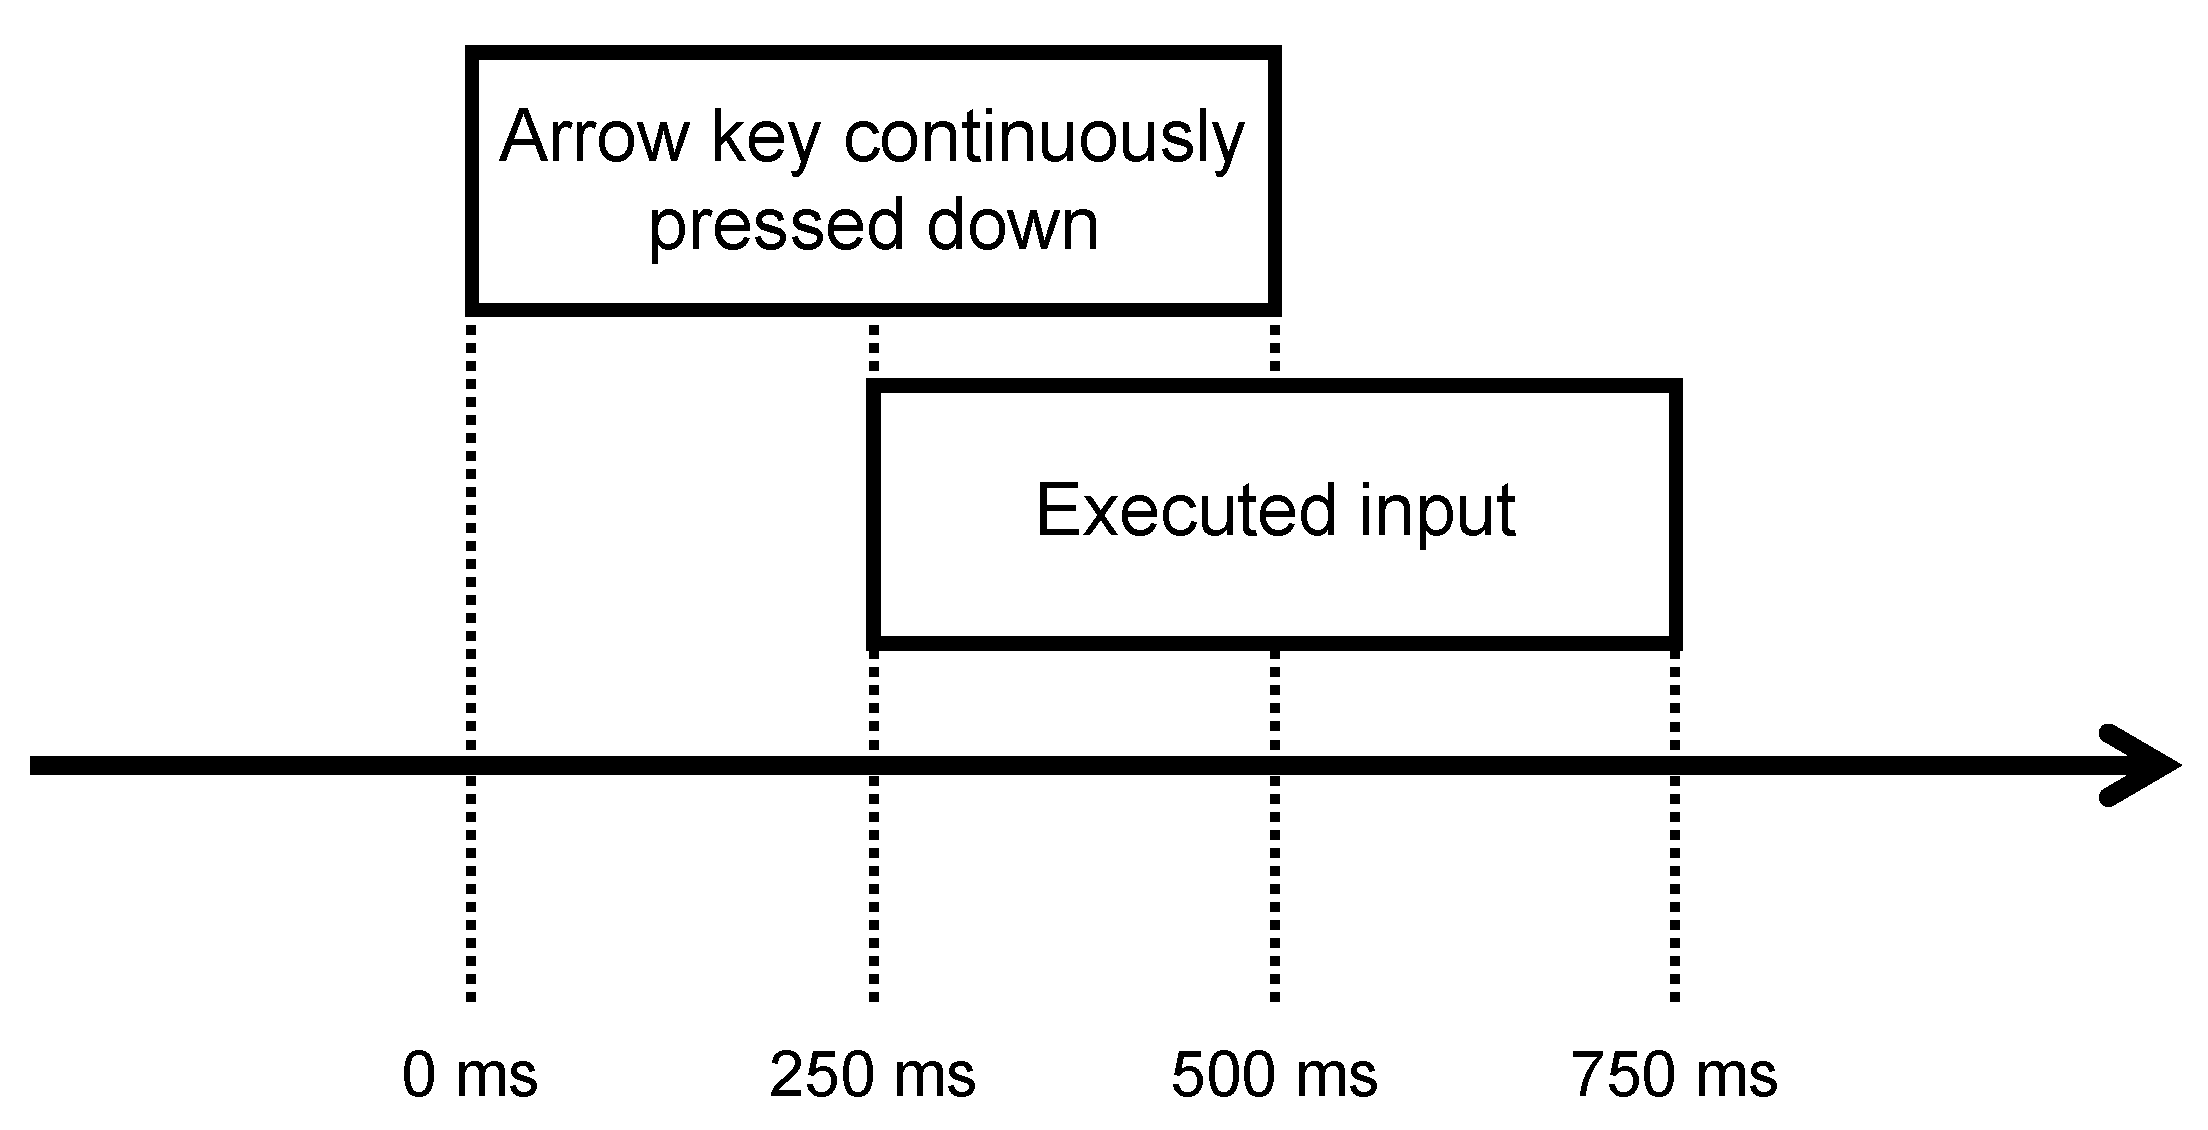
2.1. Command Execution Delay

| Scientific Work | Game Genre | Perceptual Threshold | Tolerance Threshold |
|---|---|---|---|
| Beigbeder et al. [28] | FPS | 75 ms | 200 ms |
| Quax et al. [63] | FPS | 60 ms | – |
| Xu et al. [64] | FTG | 67 ms | – |
| Fritsch et al. [15] | MMORPG | – | 1250 ms |
| Tan et al. [65] | MOBA | 50 ms | 200 ms |
| Beznosyk et al. [48] | Puzzle platform | 60 ms | 200 ms |
| Pantel et al. [12] | Racing | 50 ms | 500 ms |
| Claypool [50] | RTS | 100 ms | 500–800 ms |
| Hohlfeld et al. [66] | Survival RPG | 170 ms | – |
| Nichols and Claypool [67] | Team sports | 500 ms | – |
2.2. Cognitive Bias
3. Experimental Setup
3.1. Test Environment
3.2. Apparatus and Viewing Conditions
3.3. Test Variables
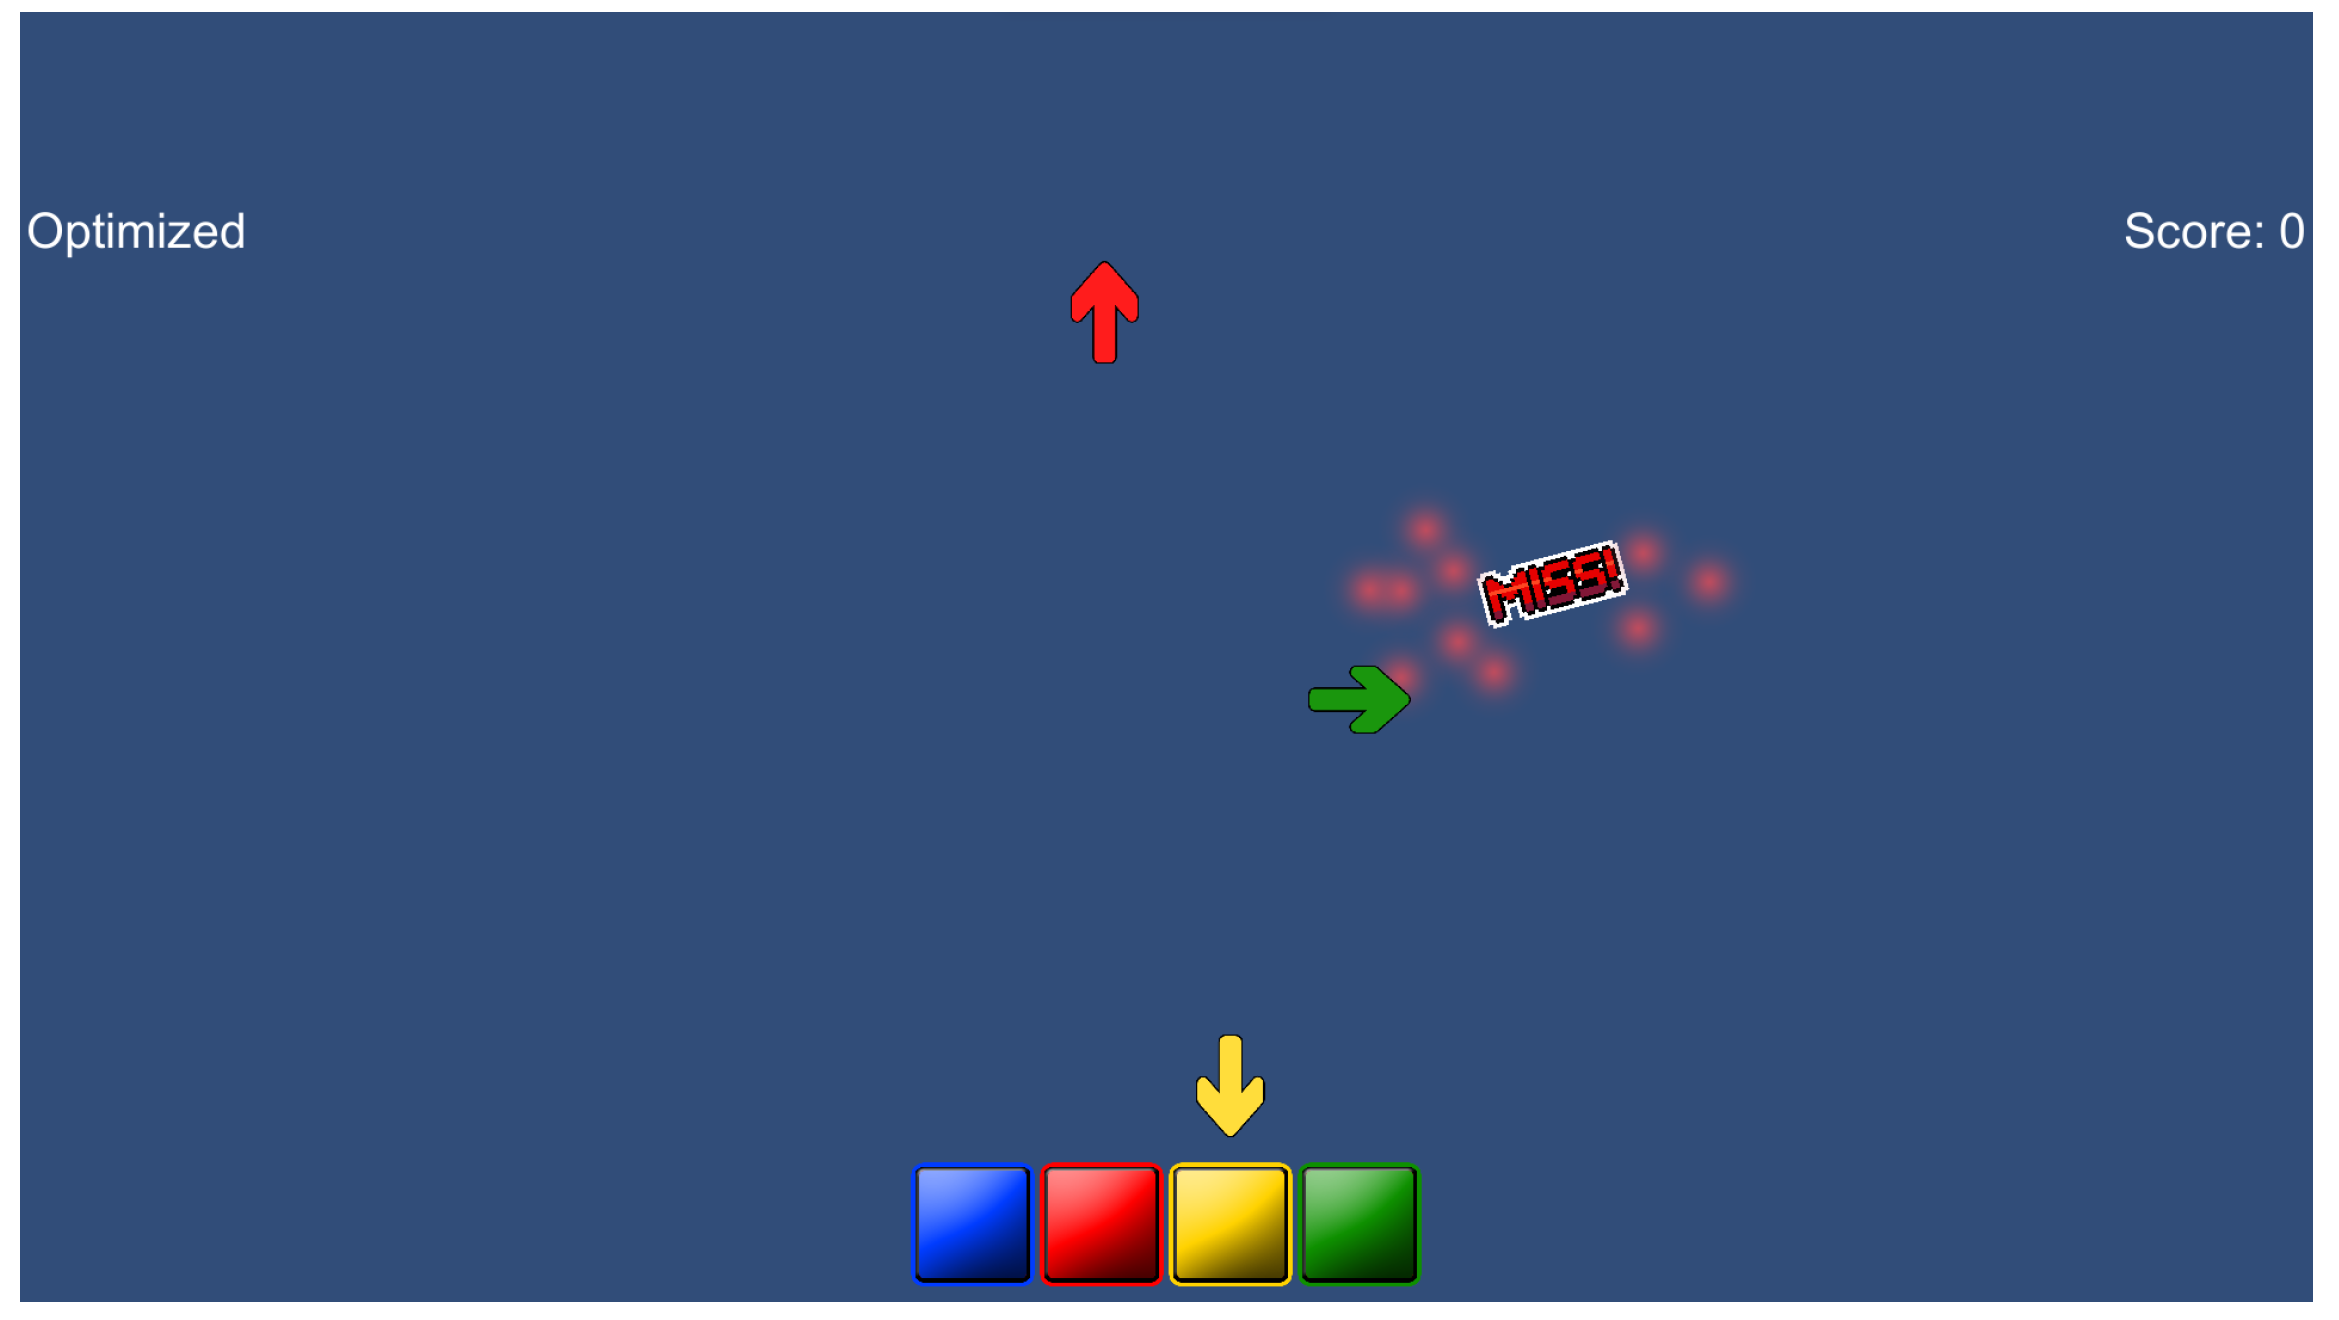
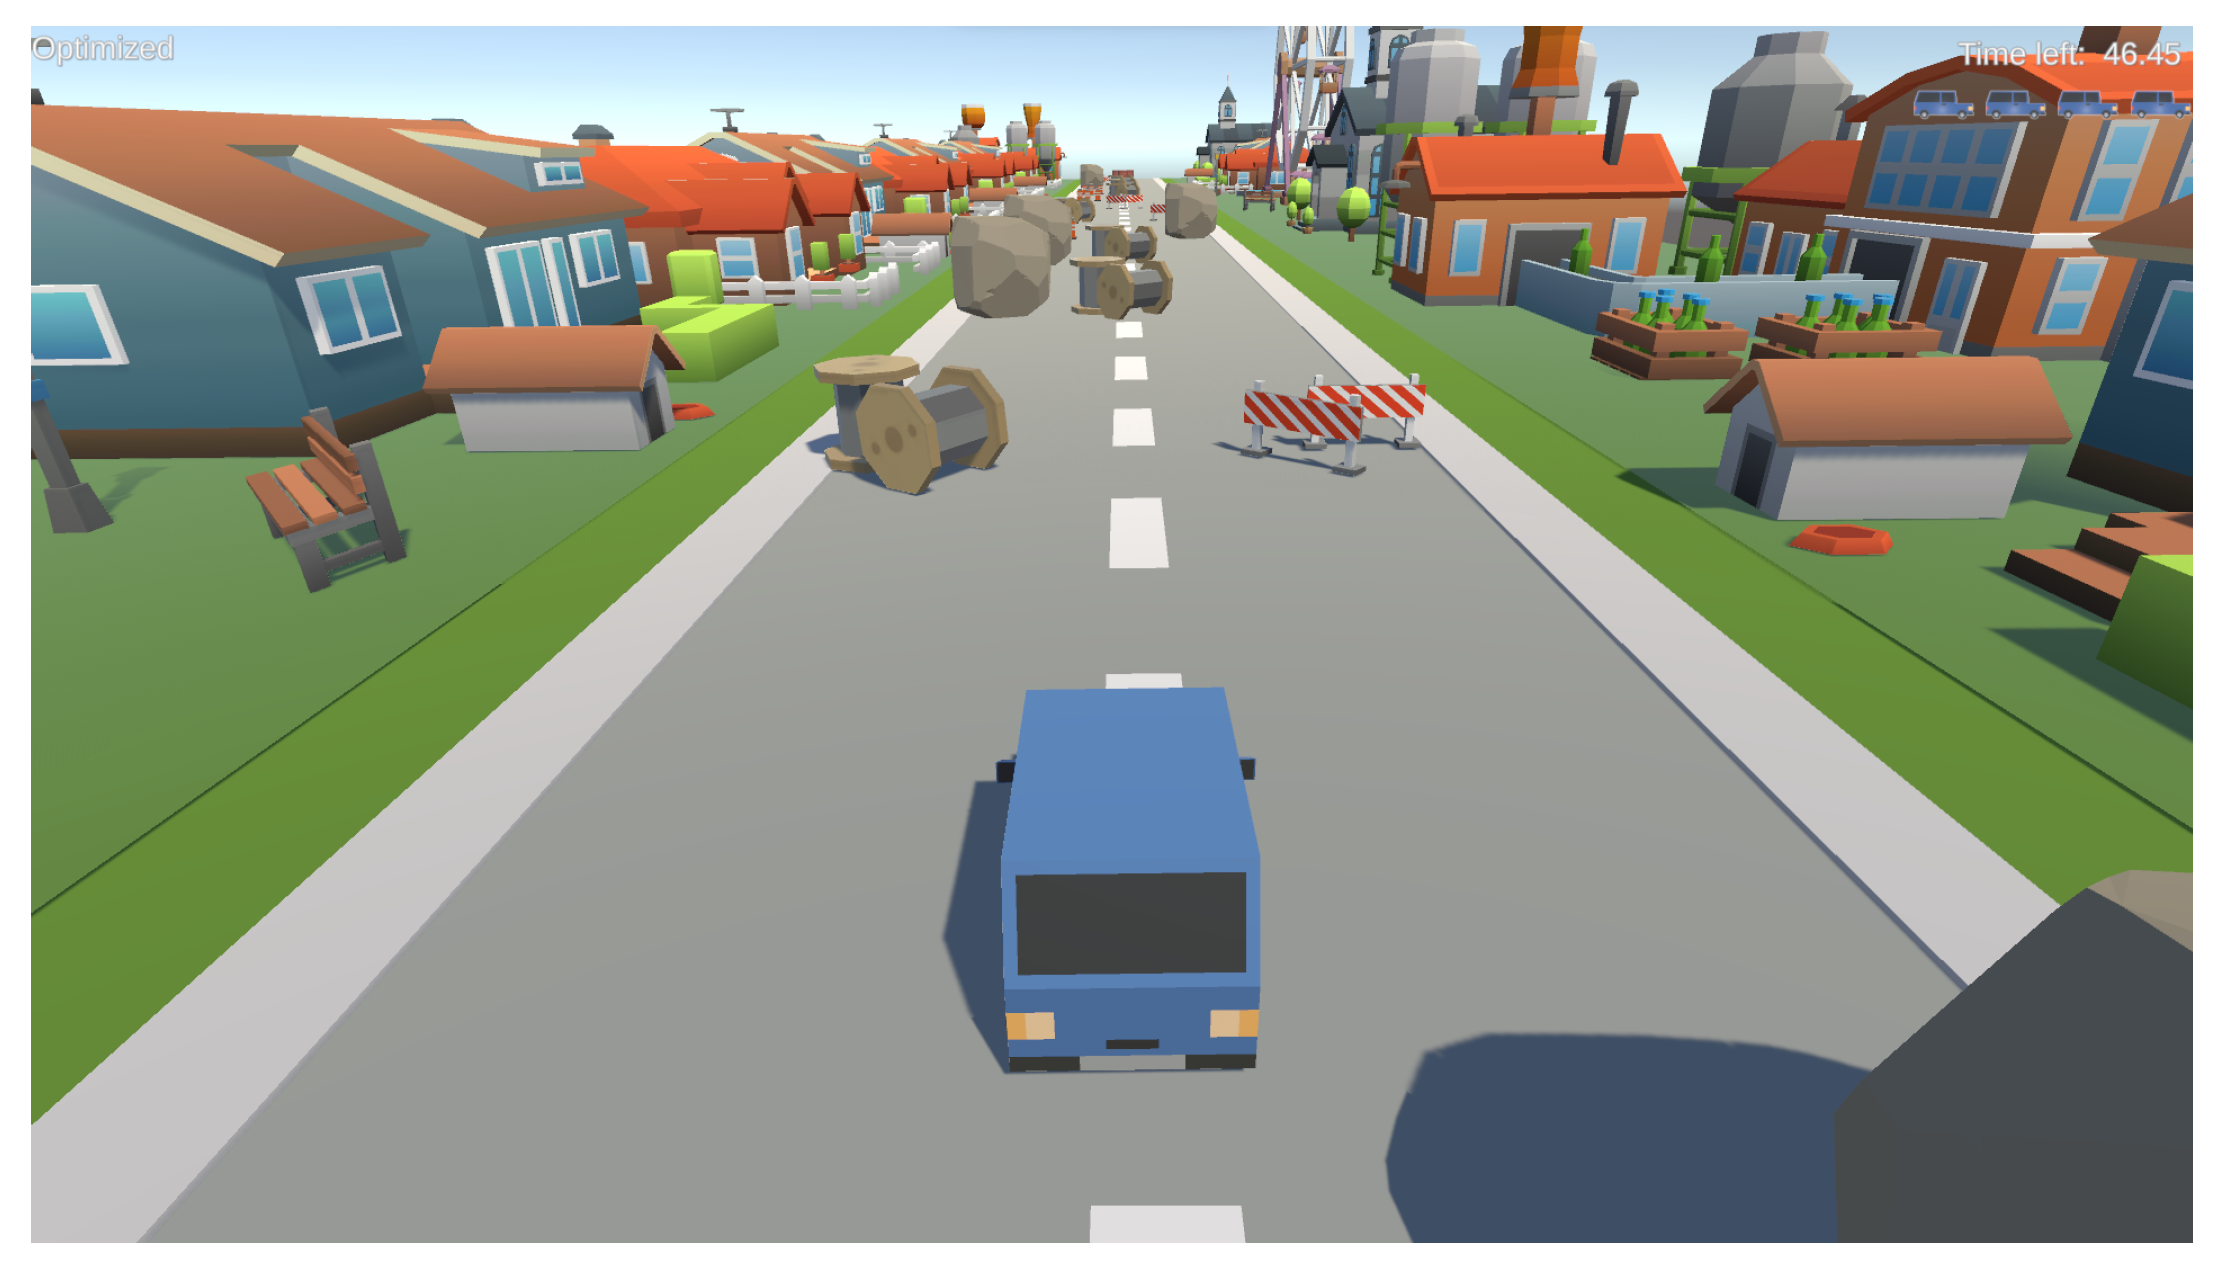
3.4. Software
3.5. Test Conditions
3.6. Test Protocol
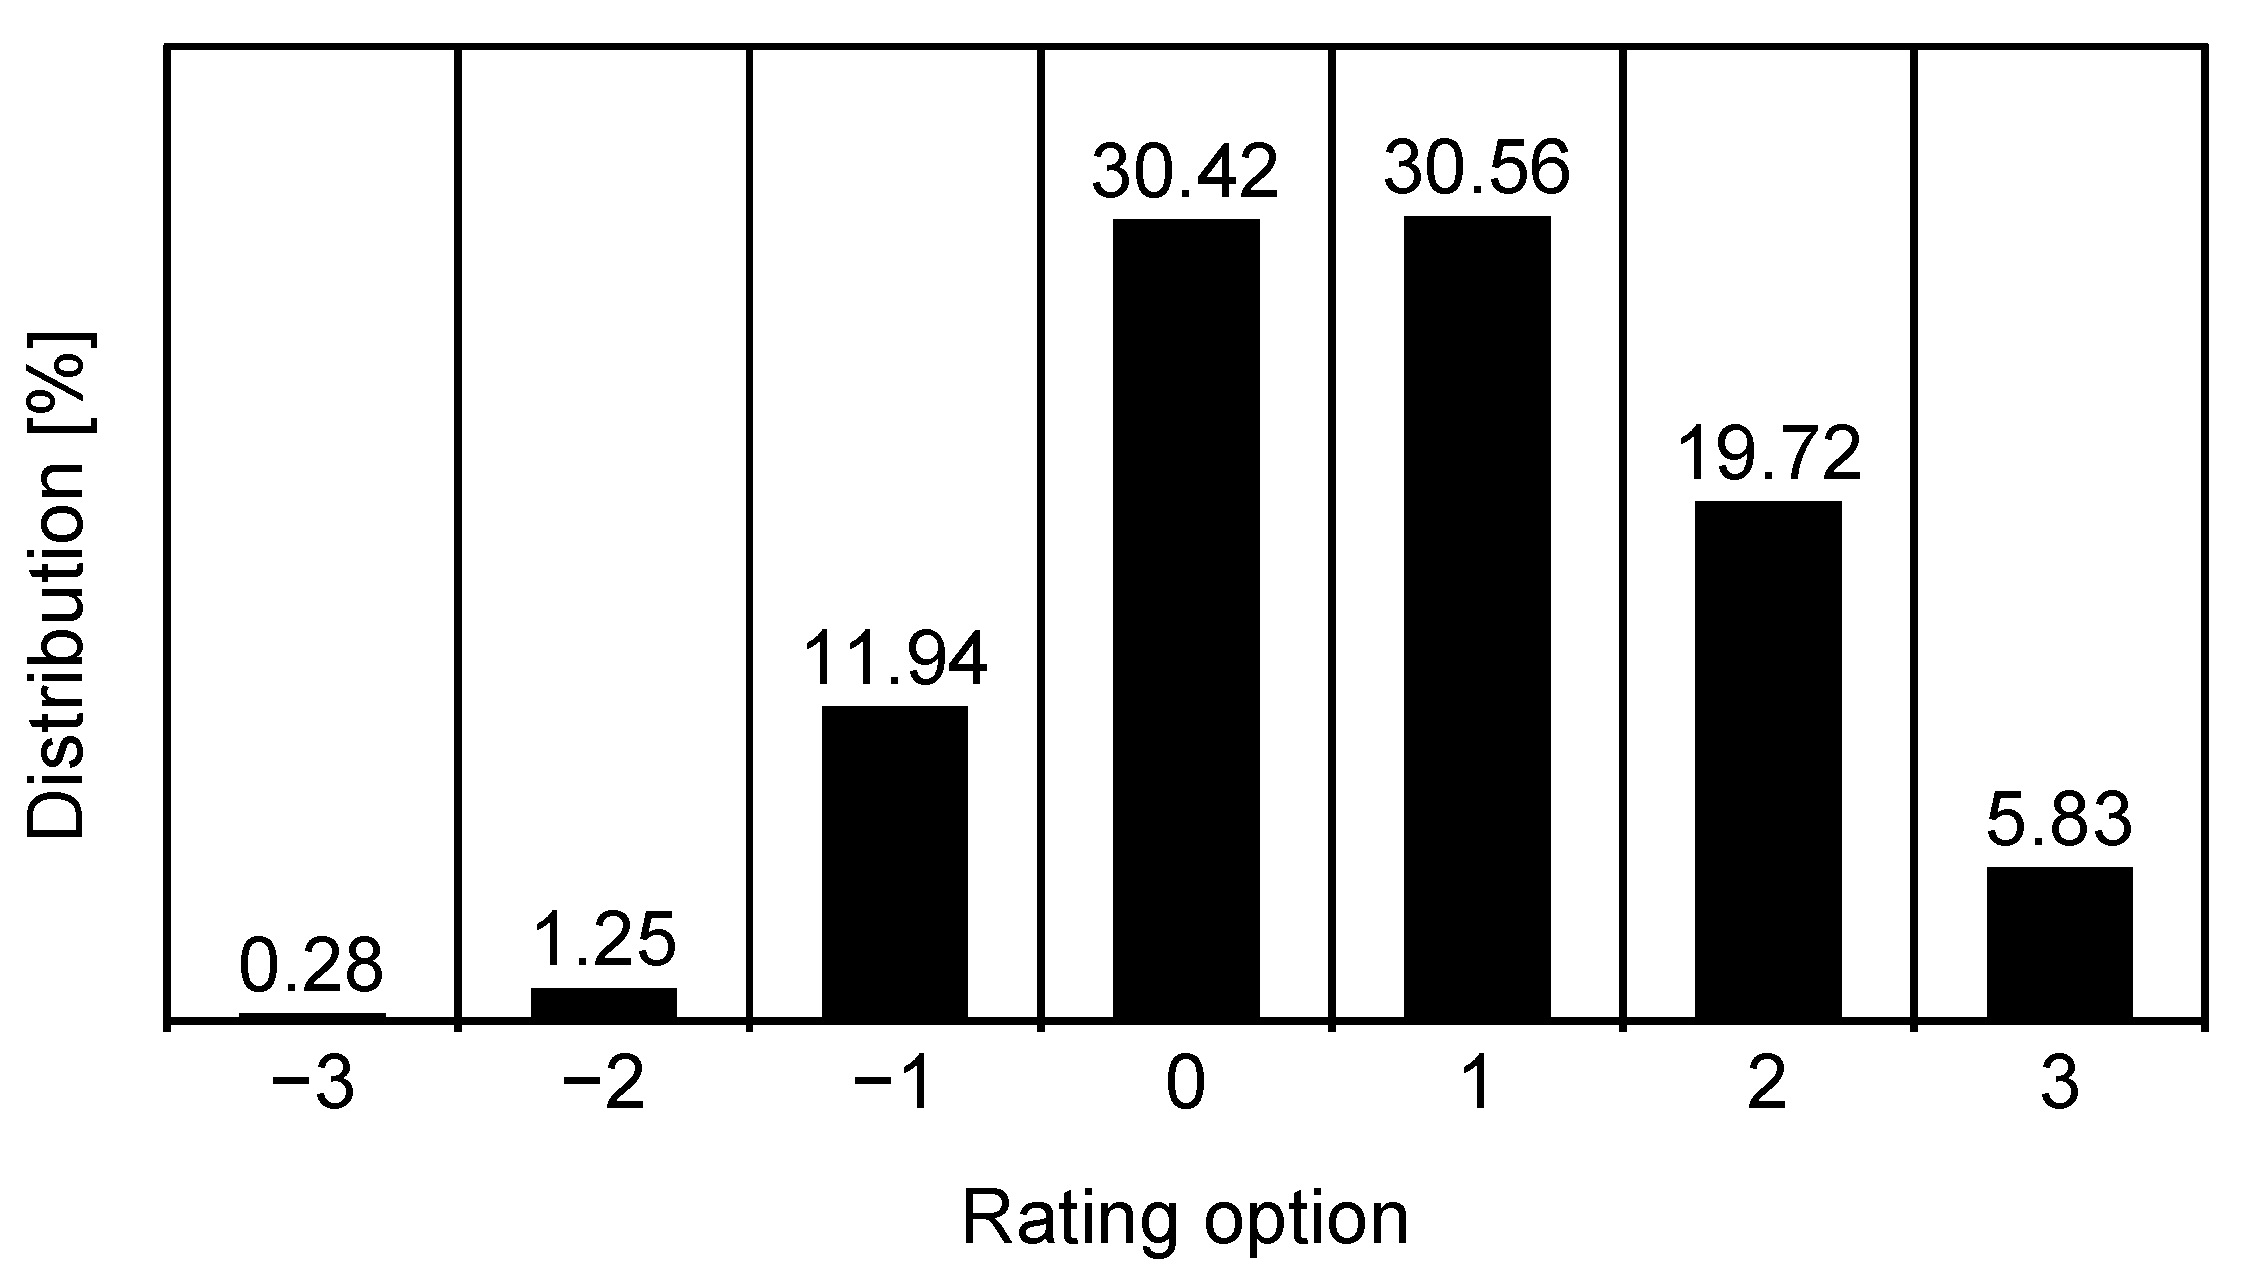
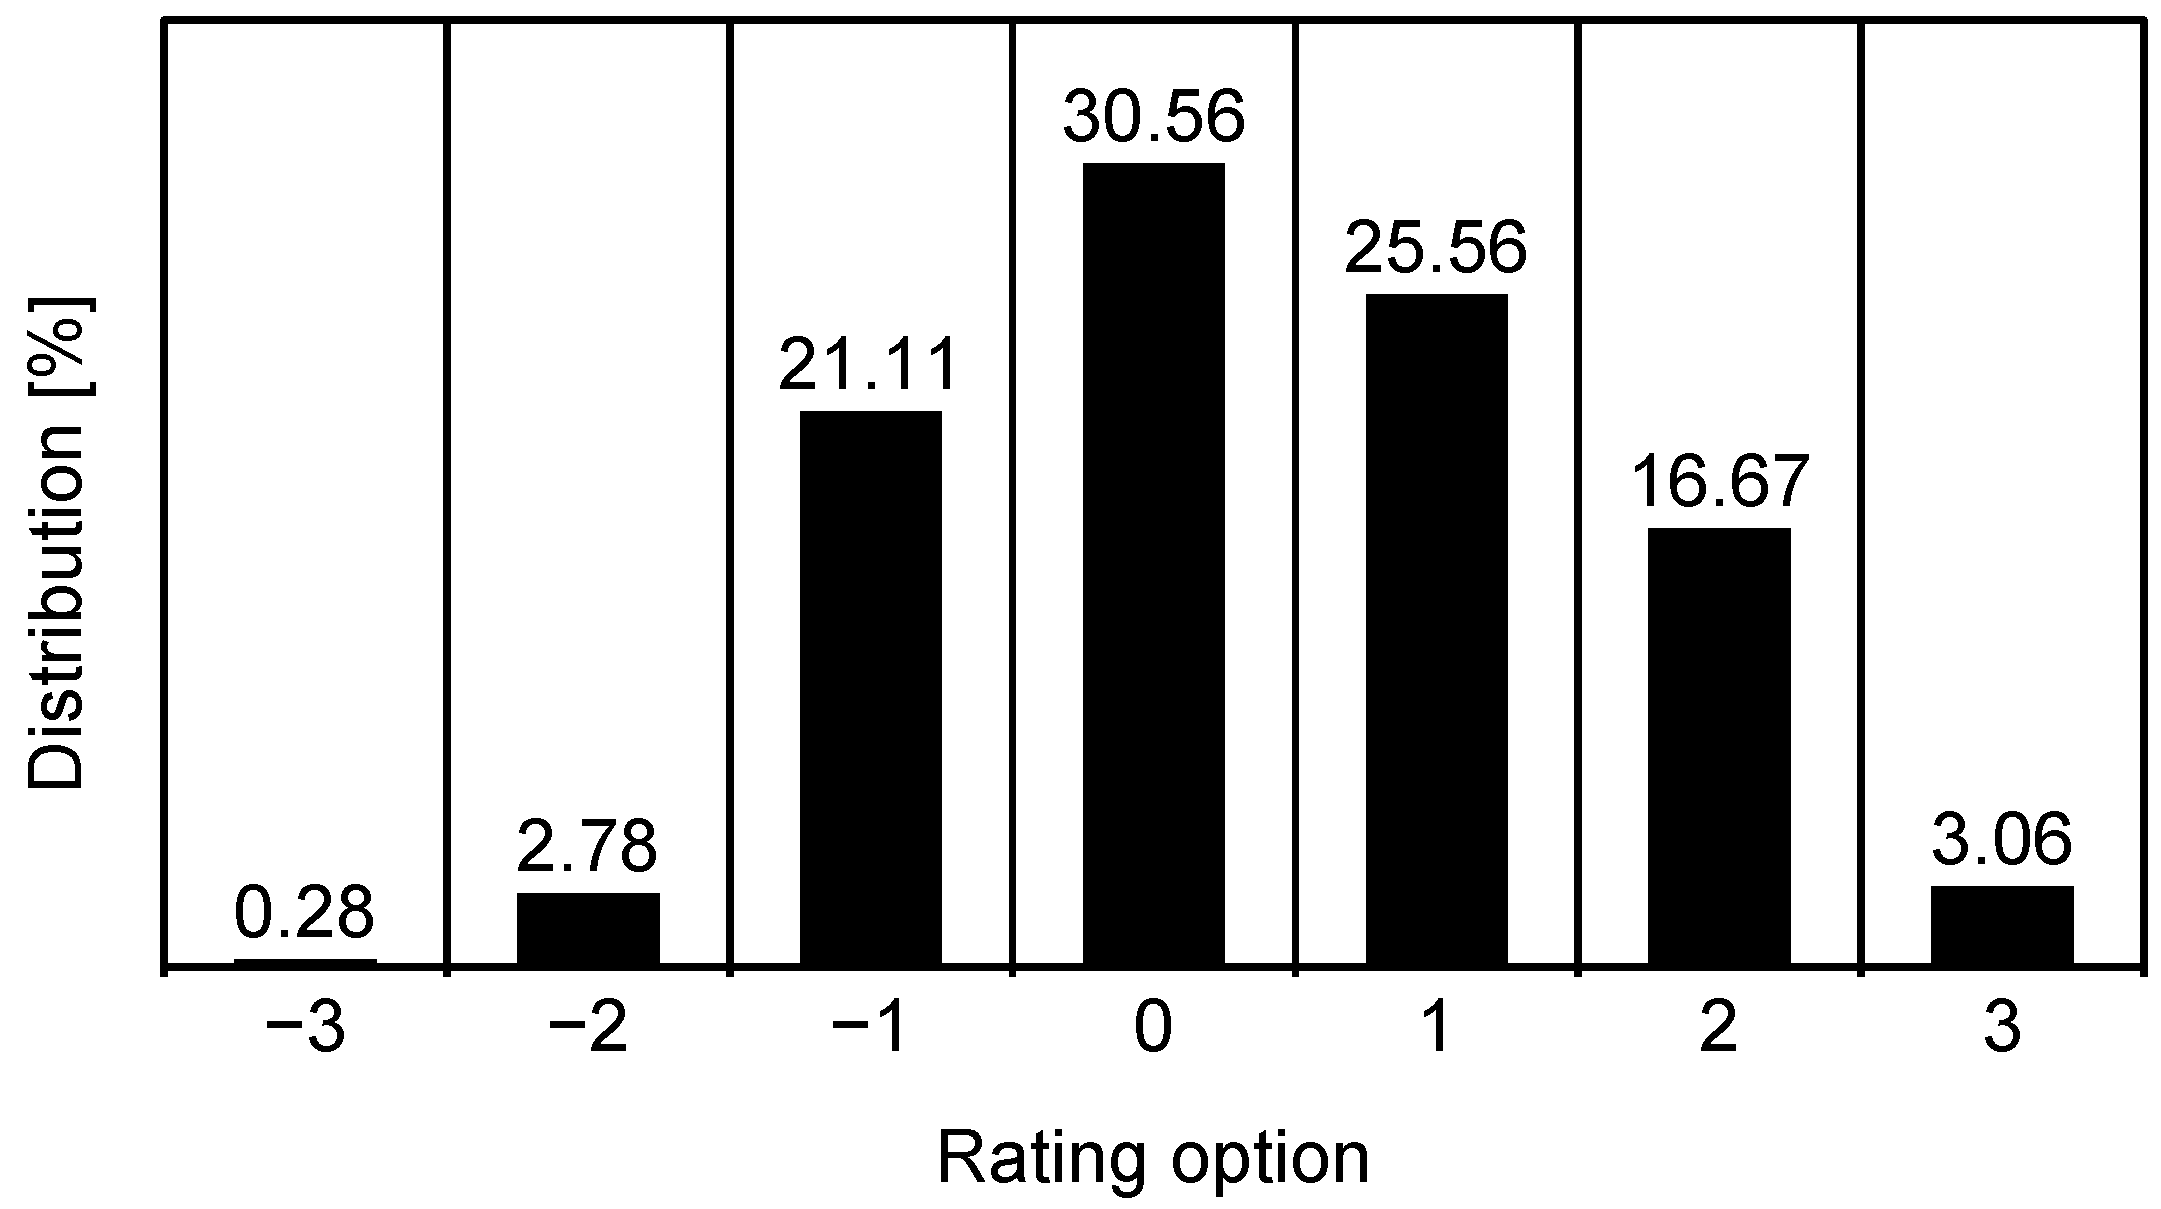
4. Results
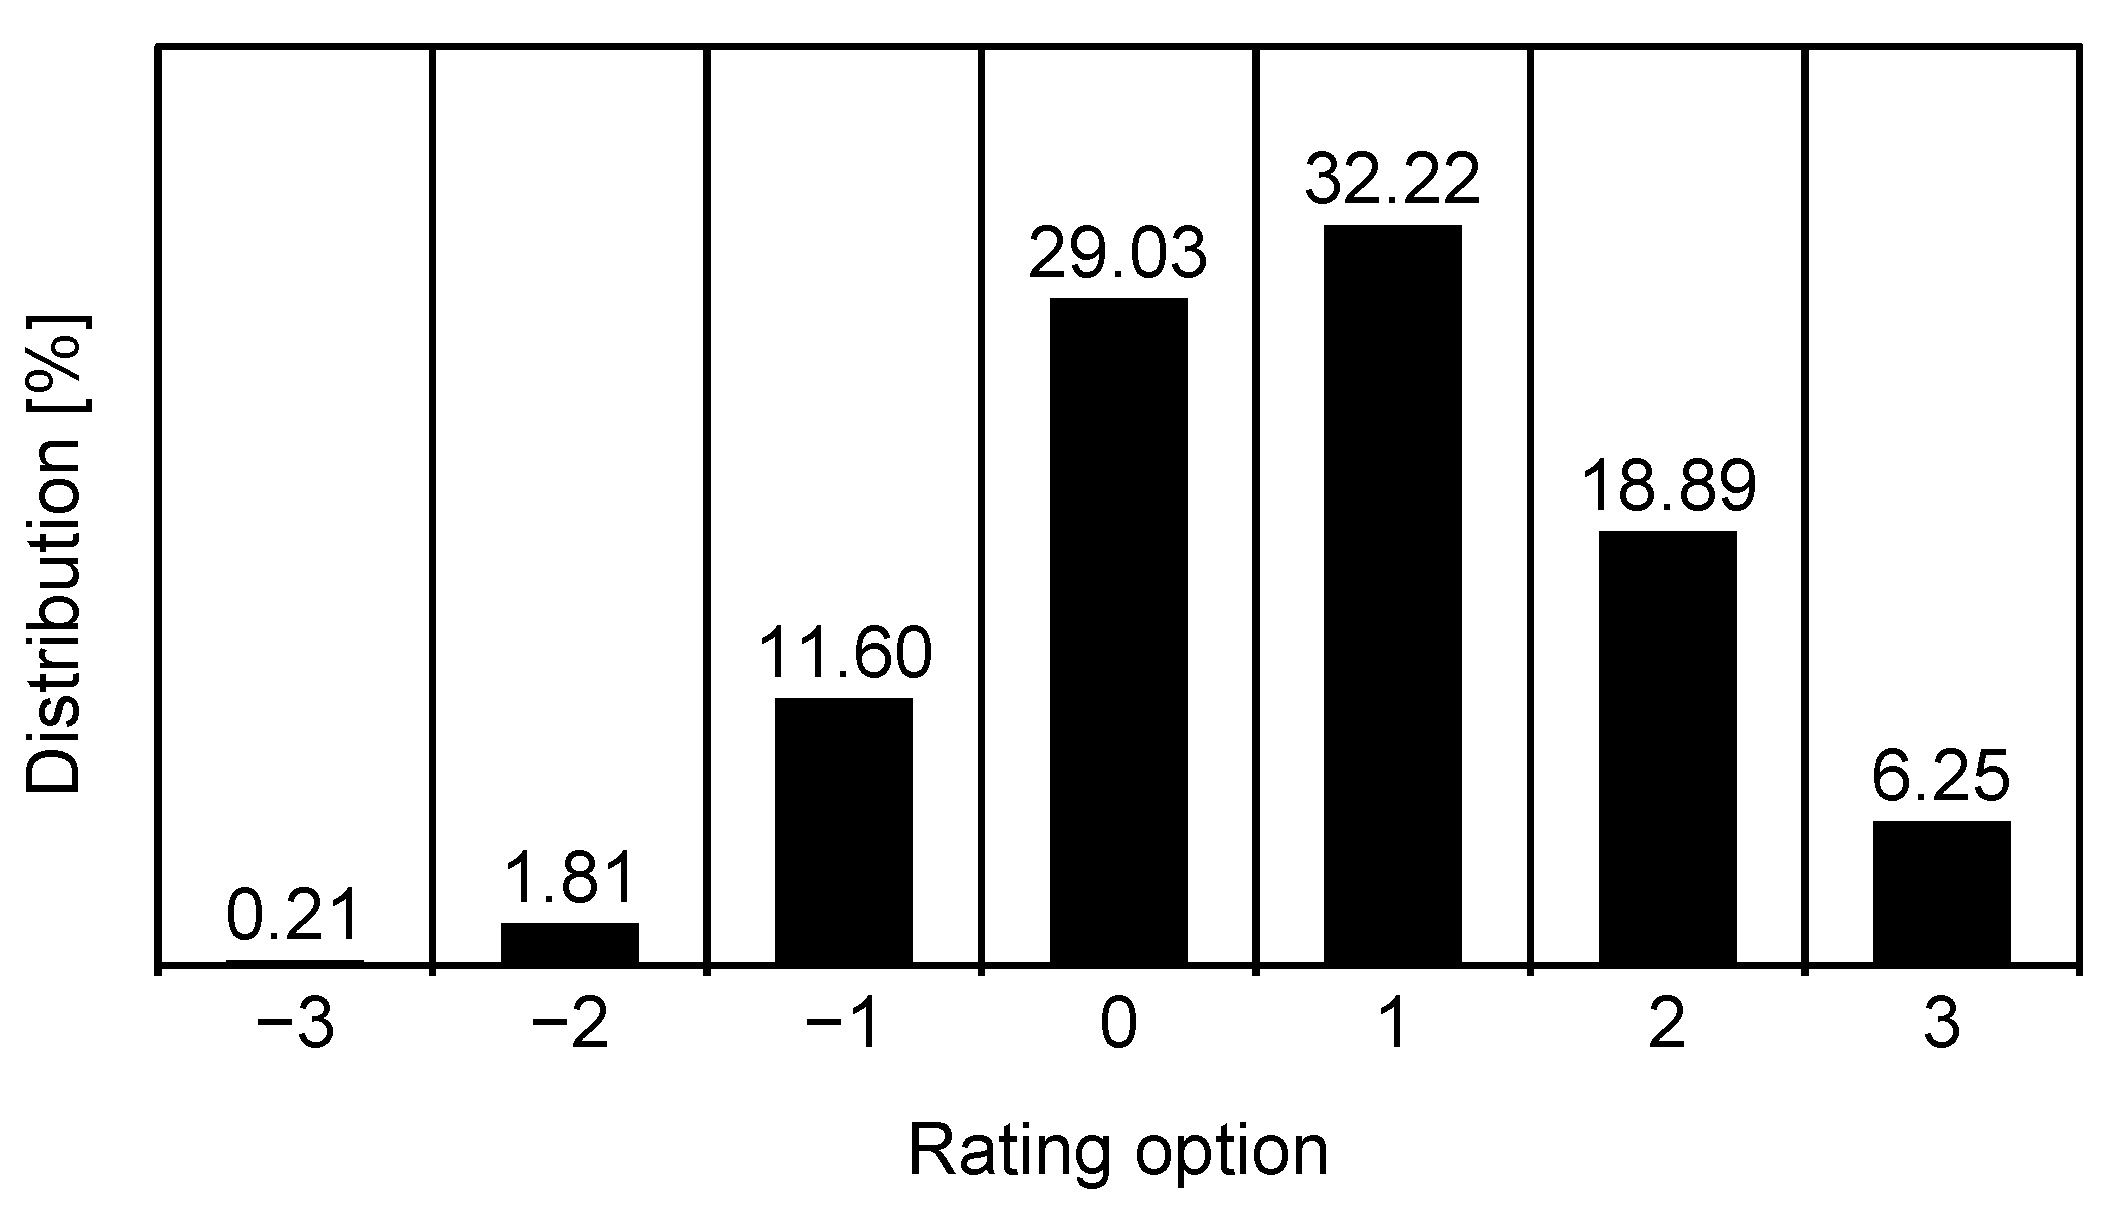
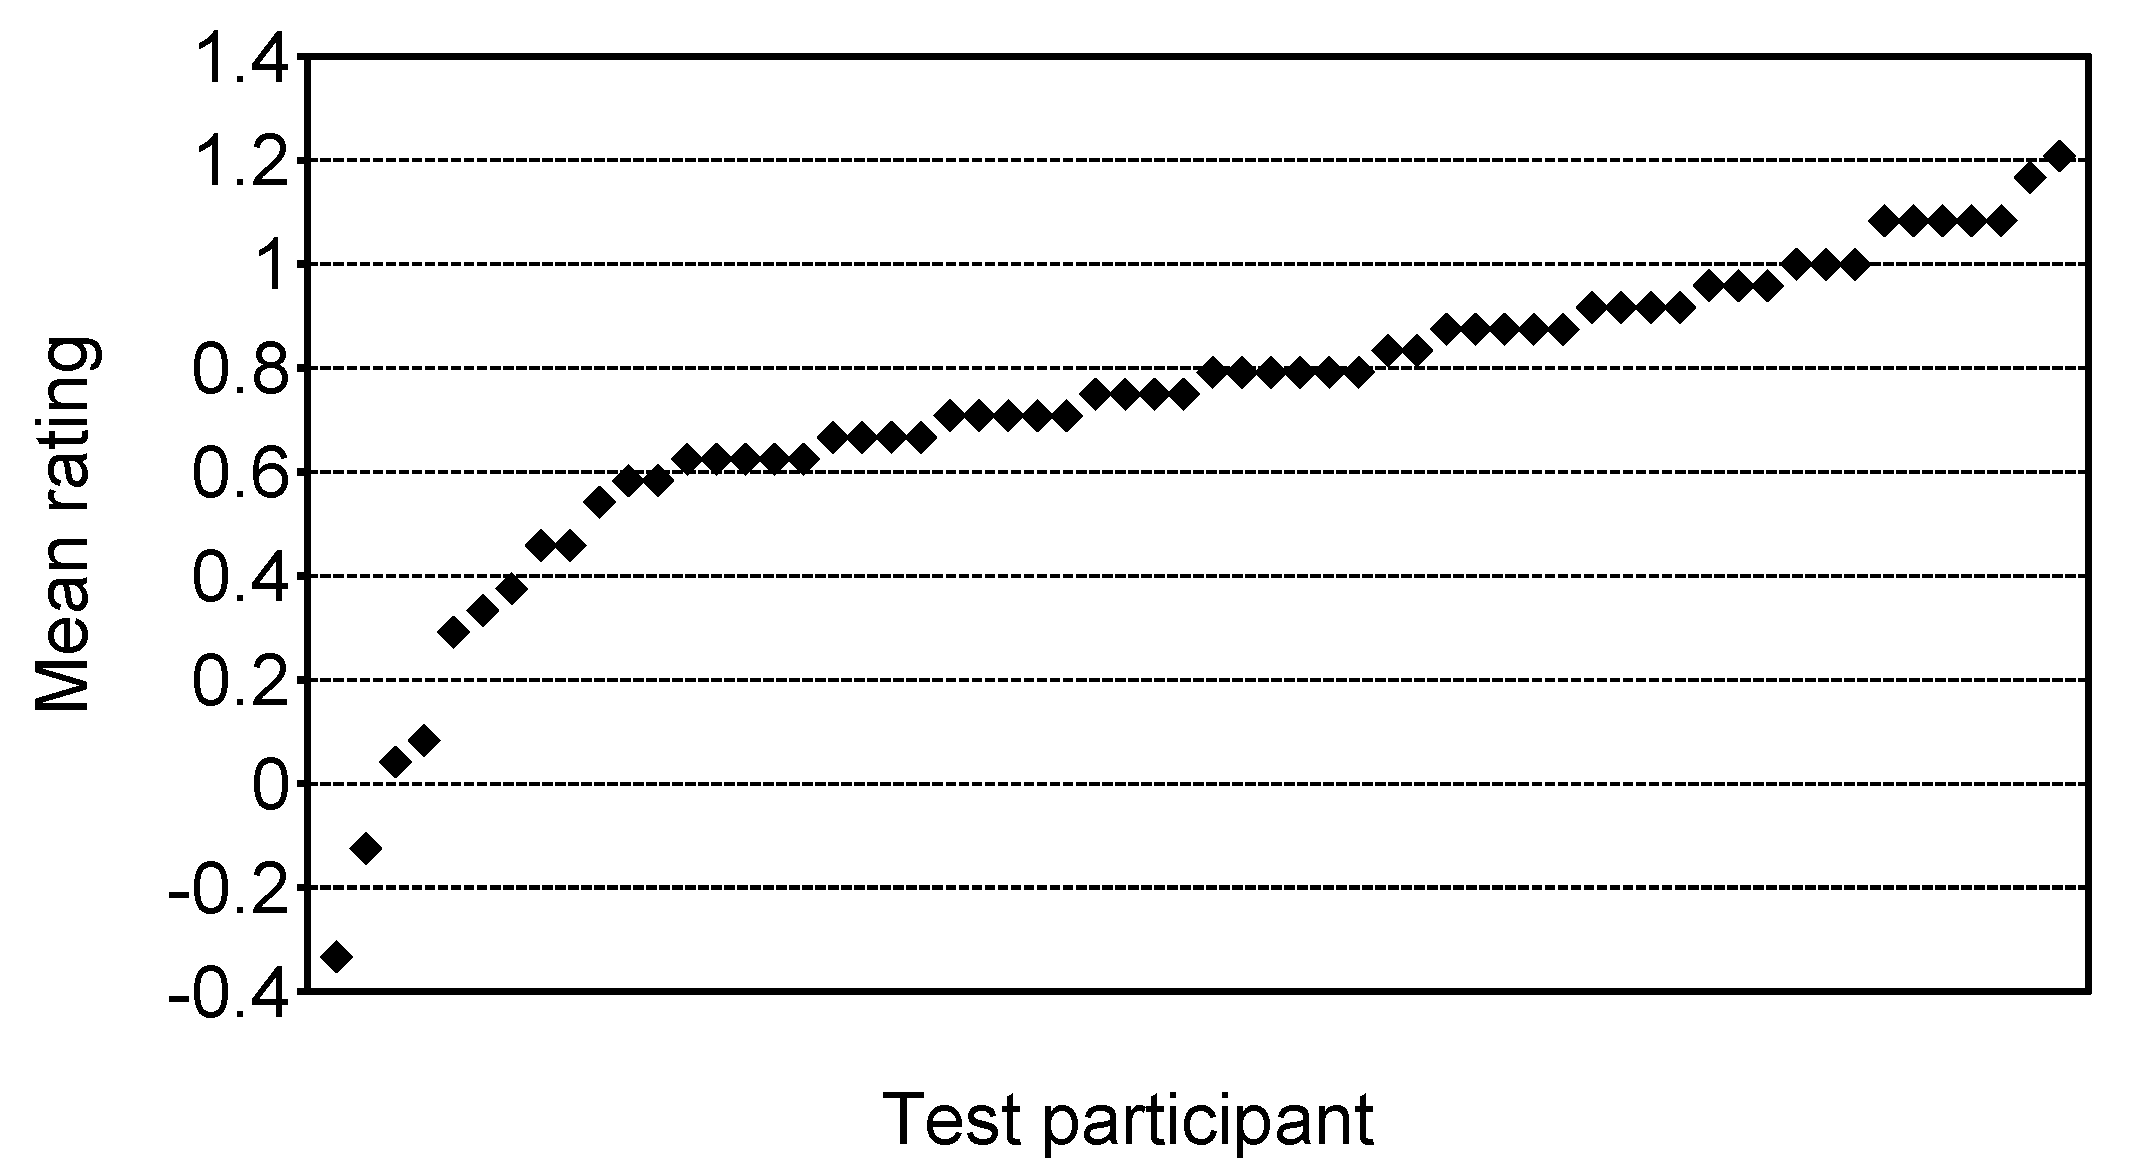
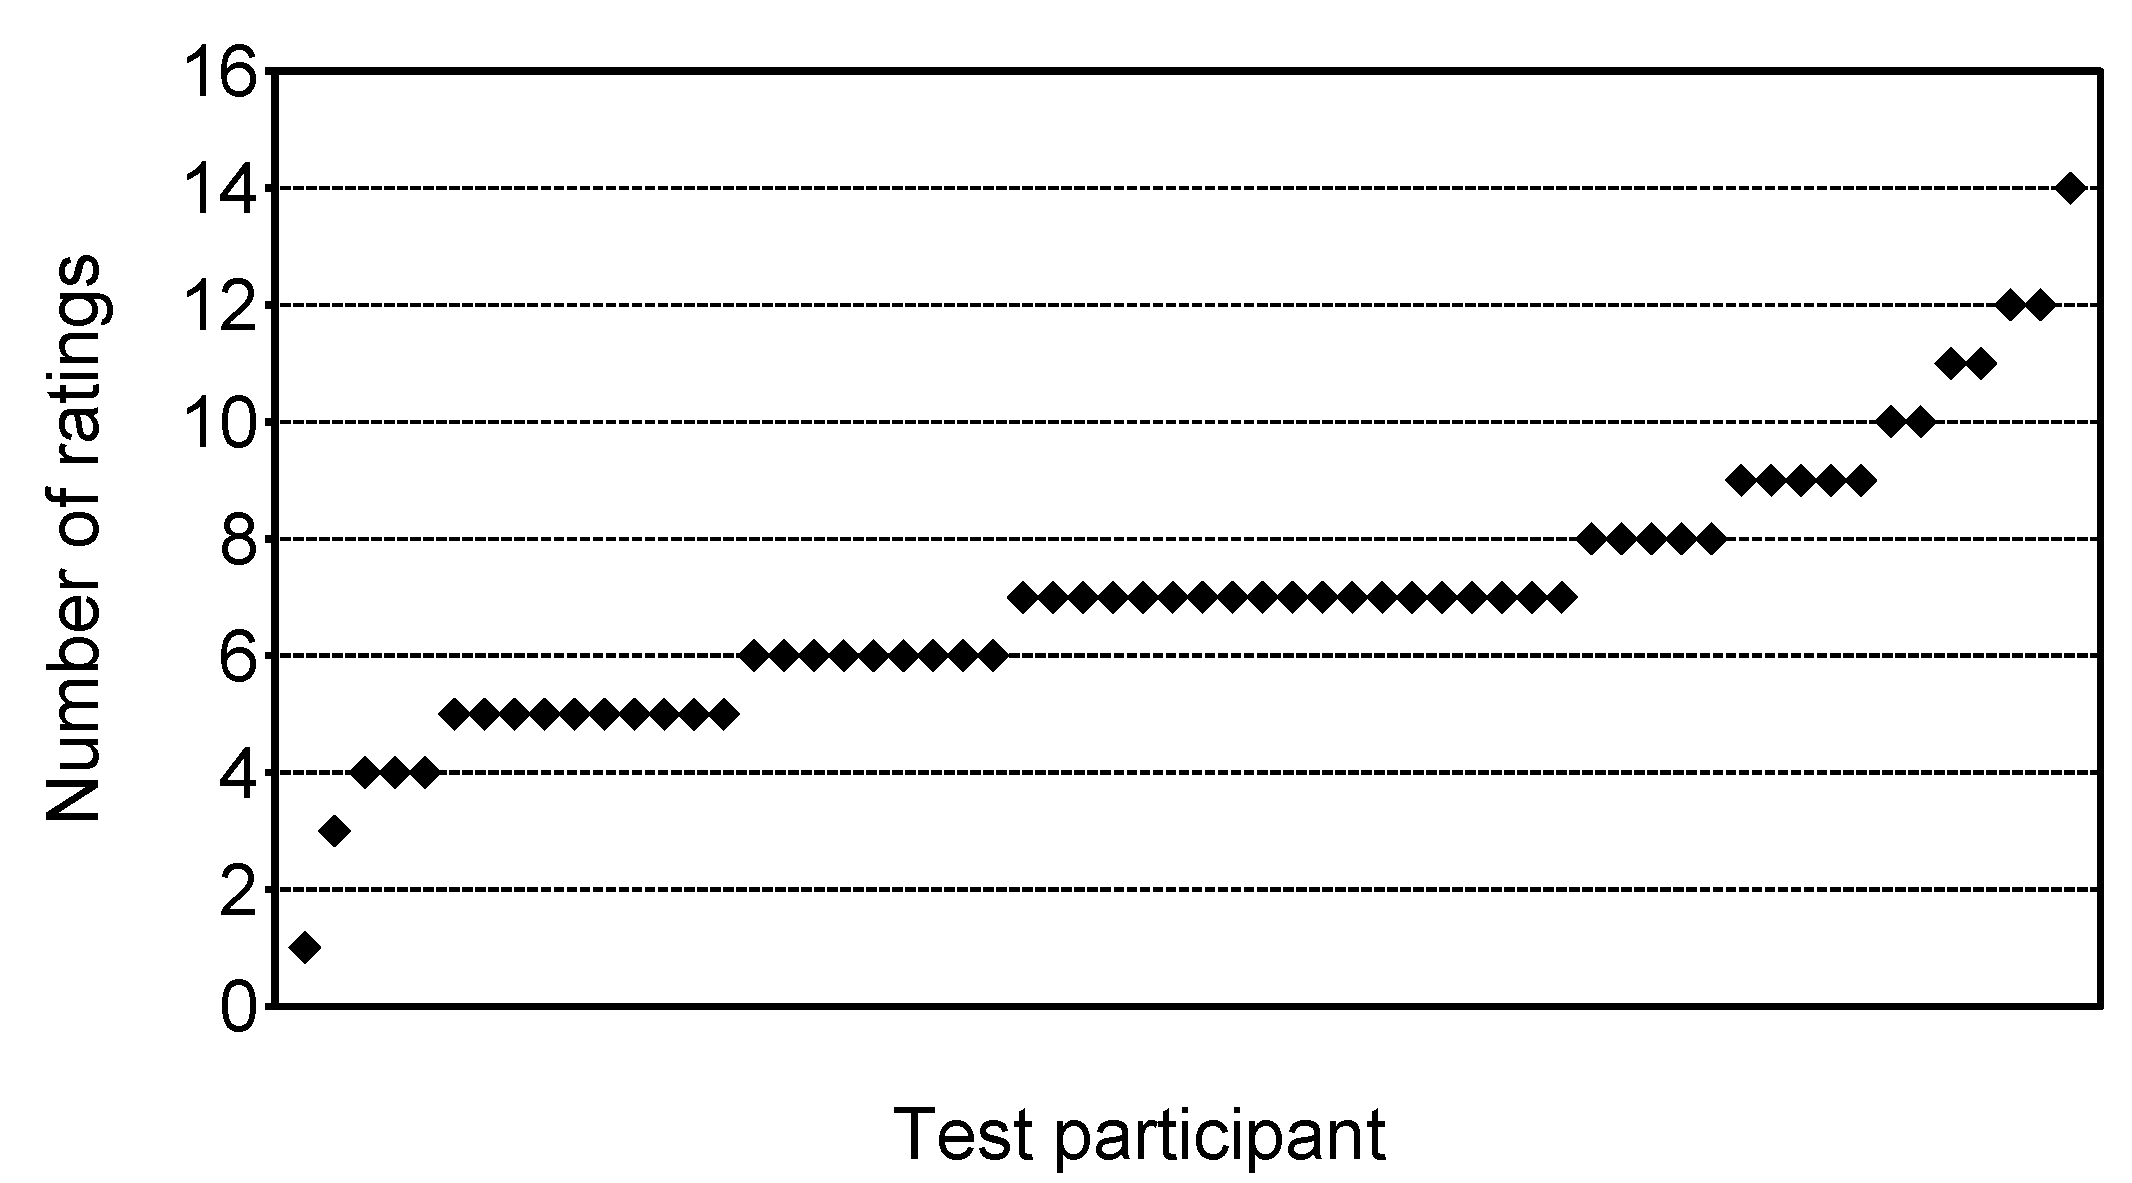
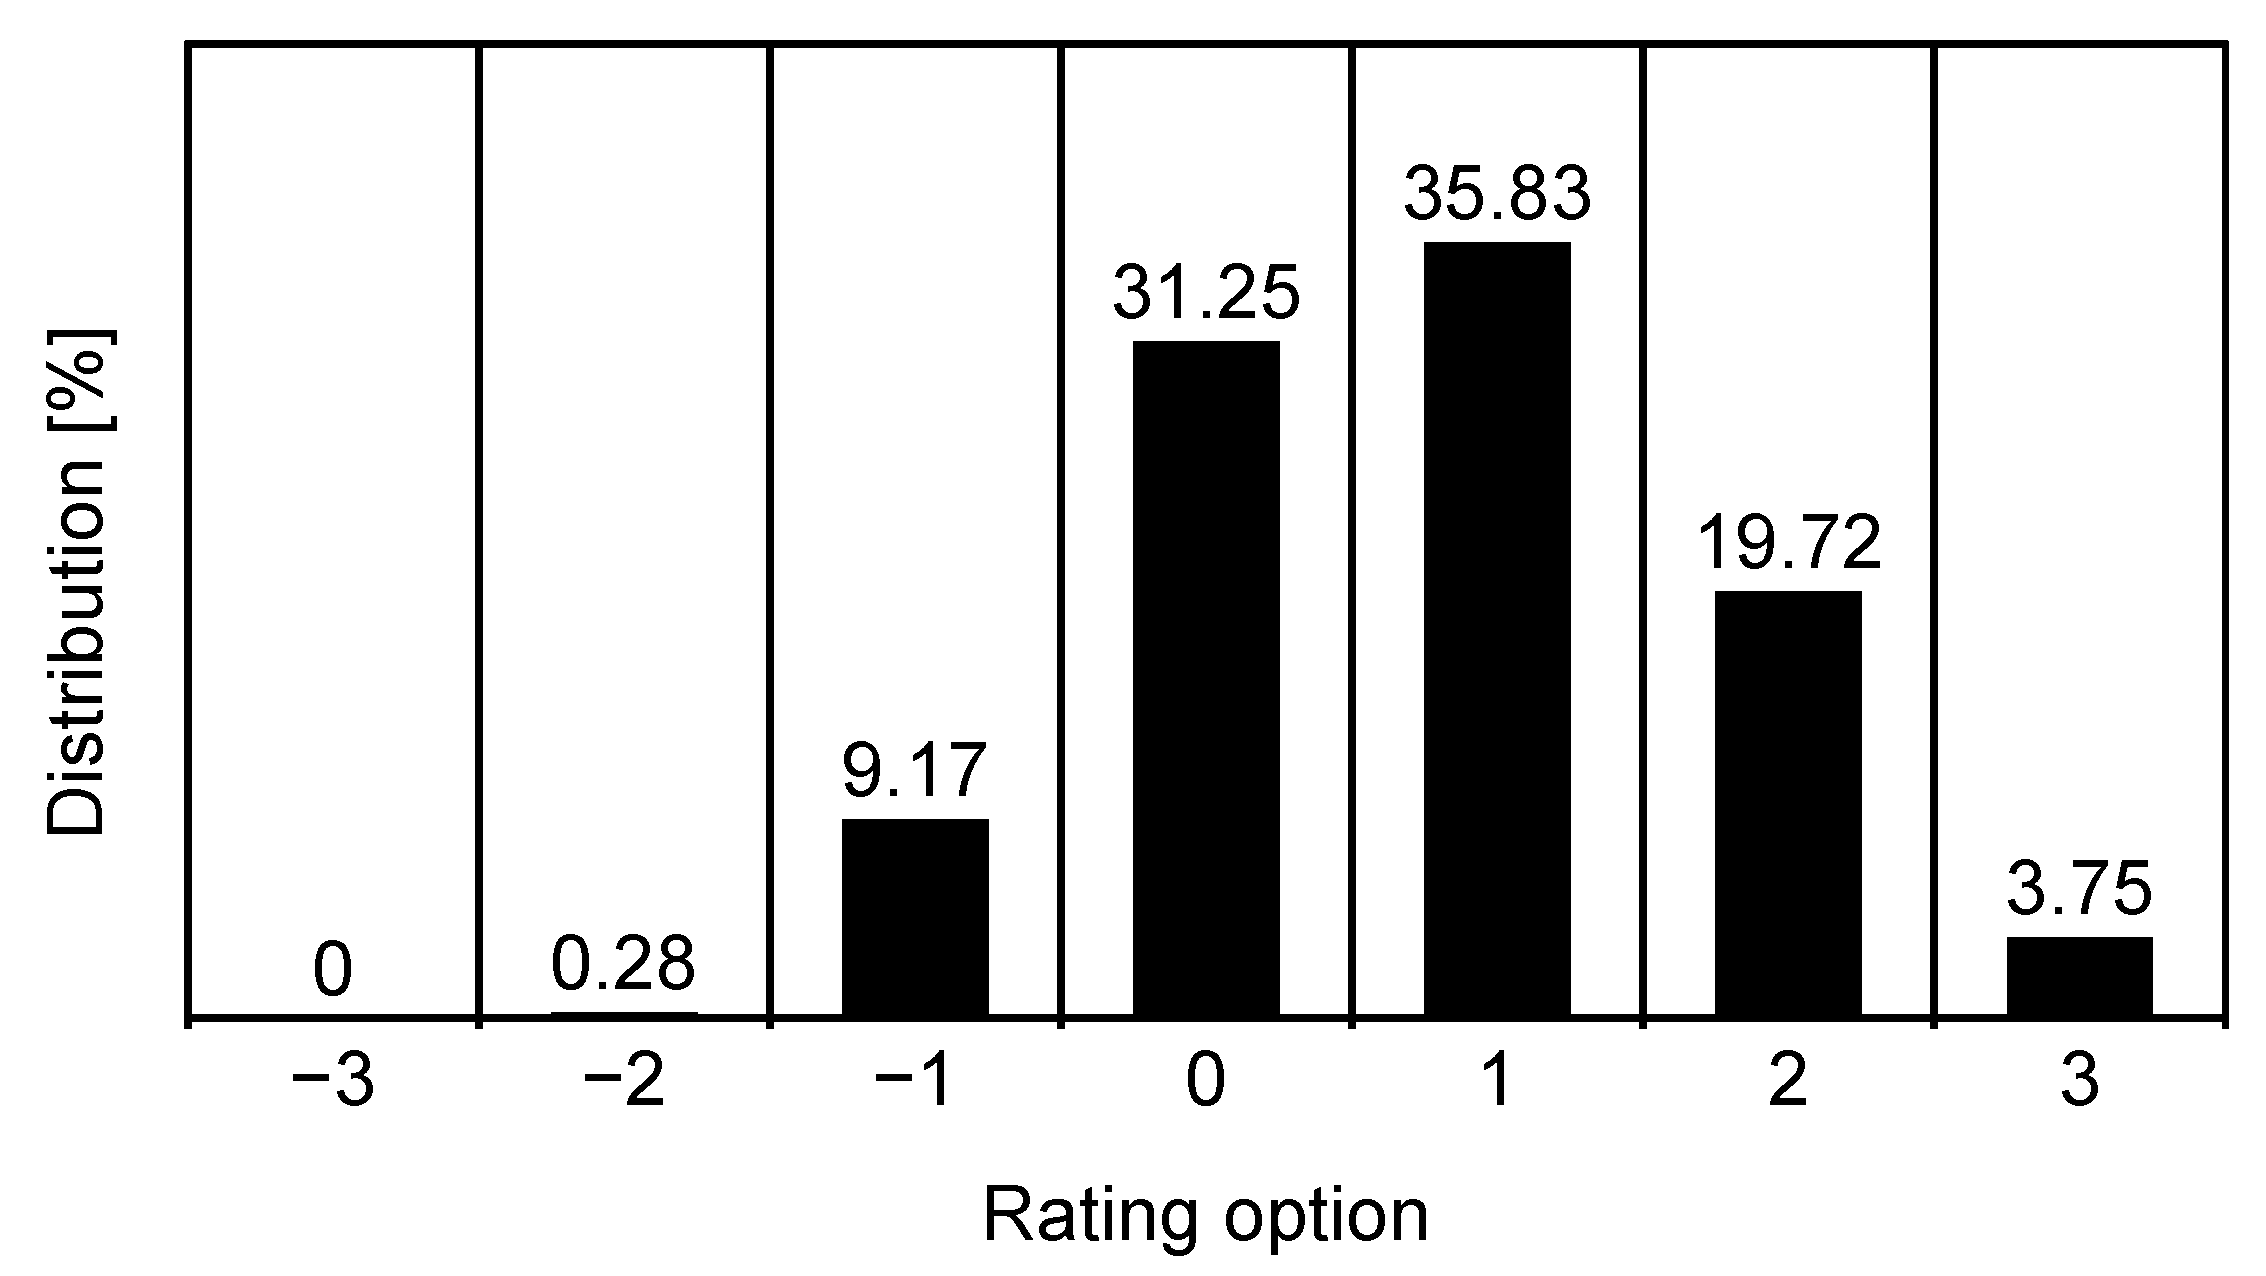
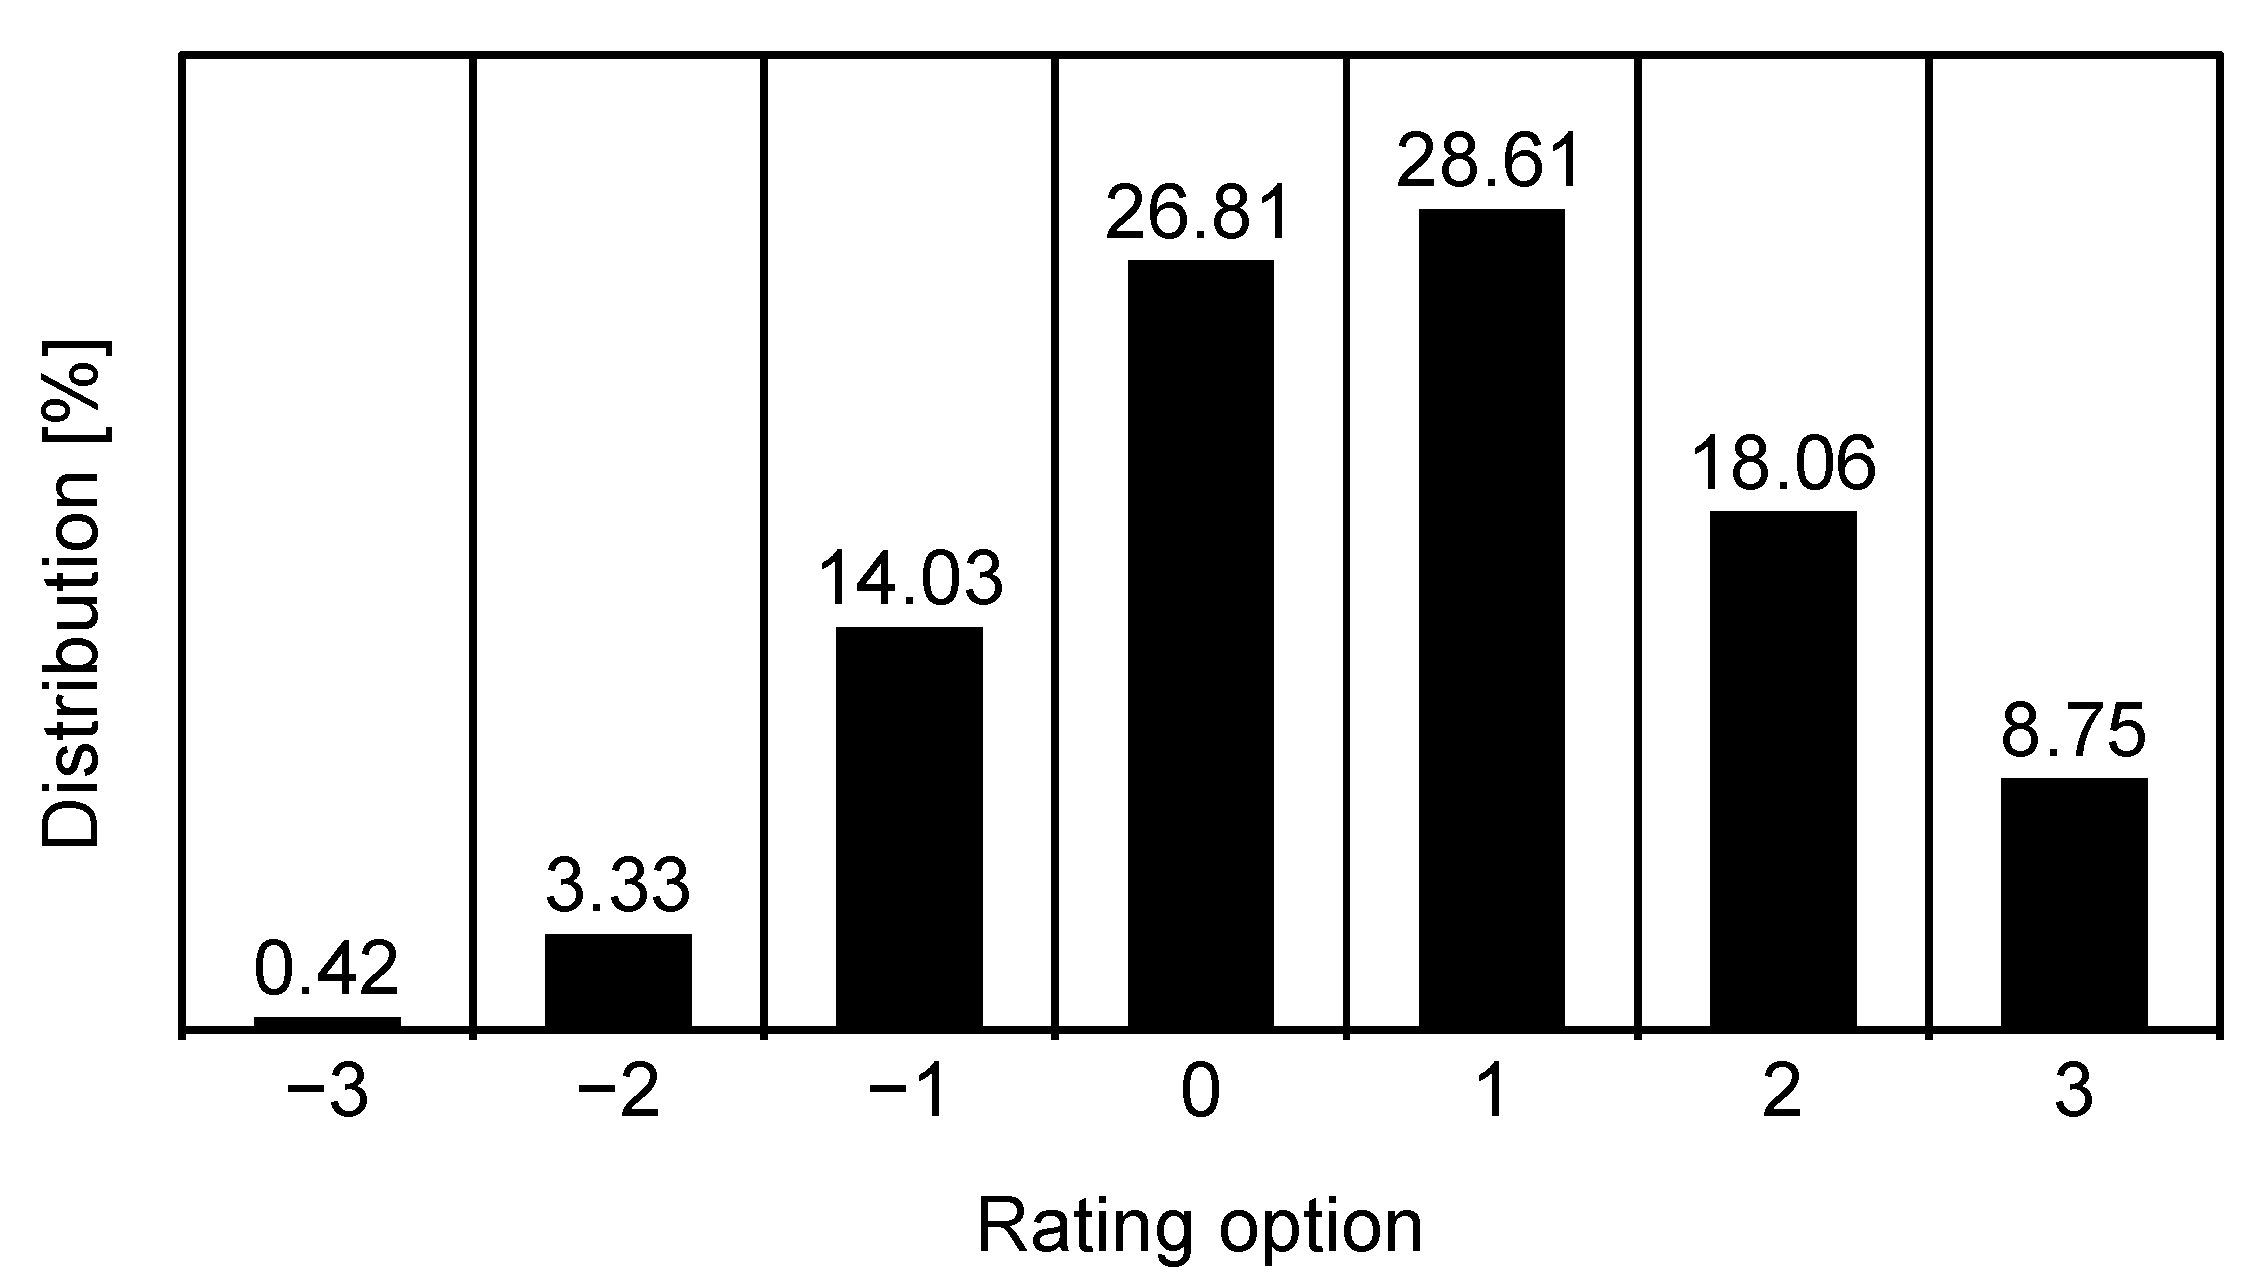
4.1. Overall Results
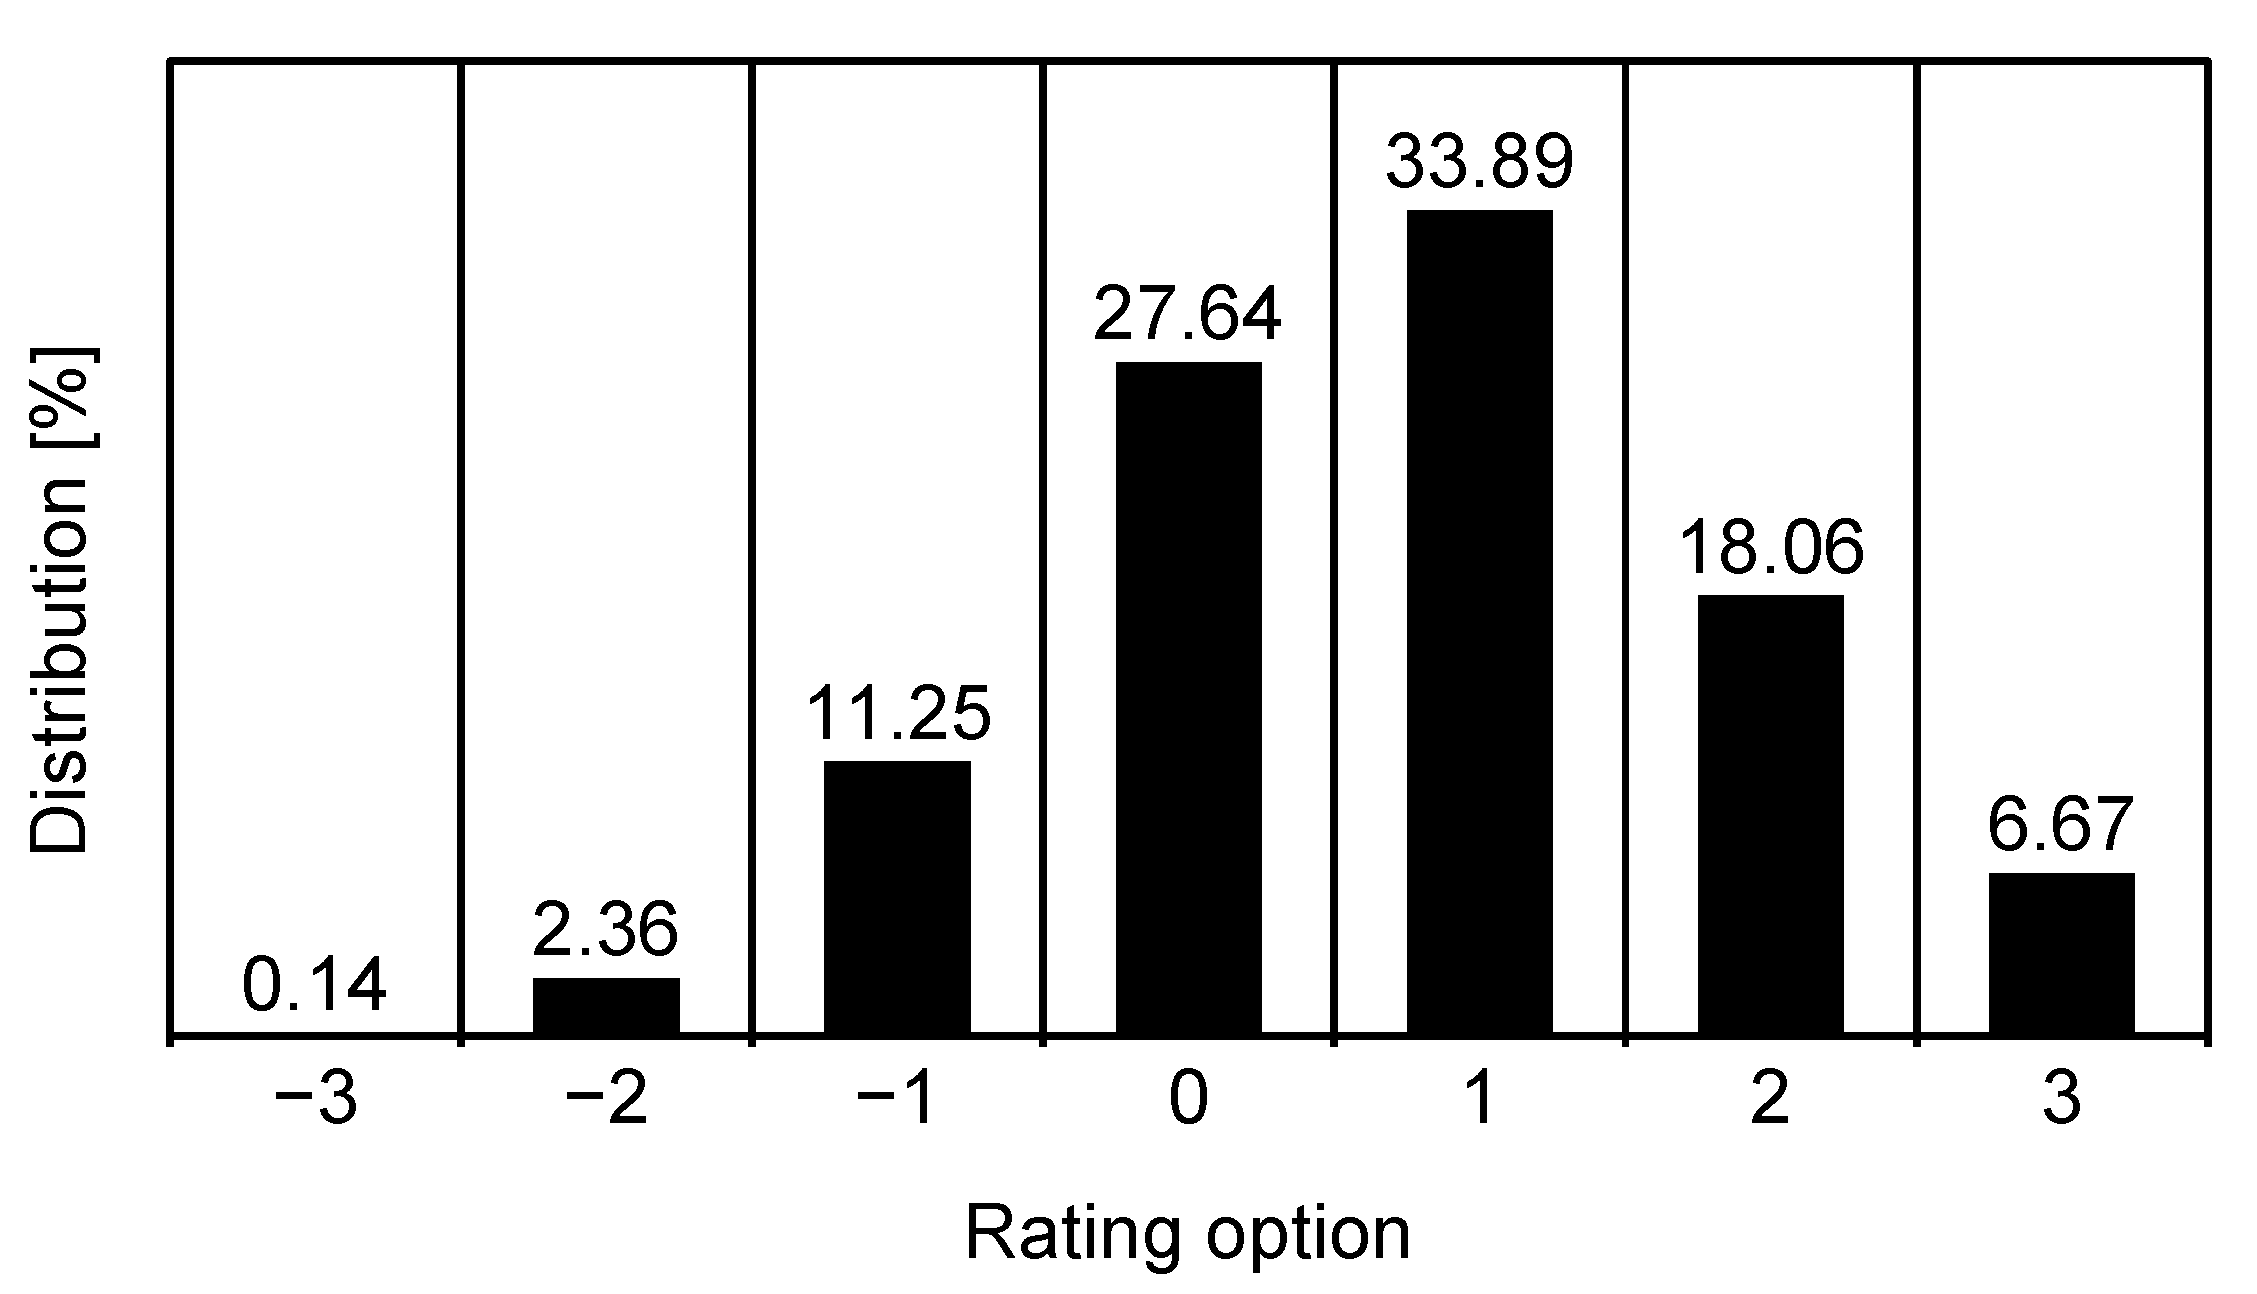
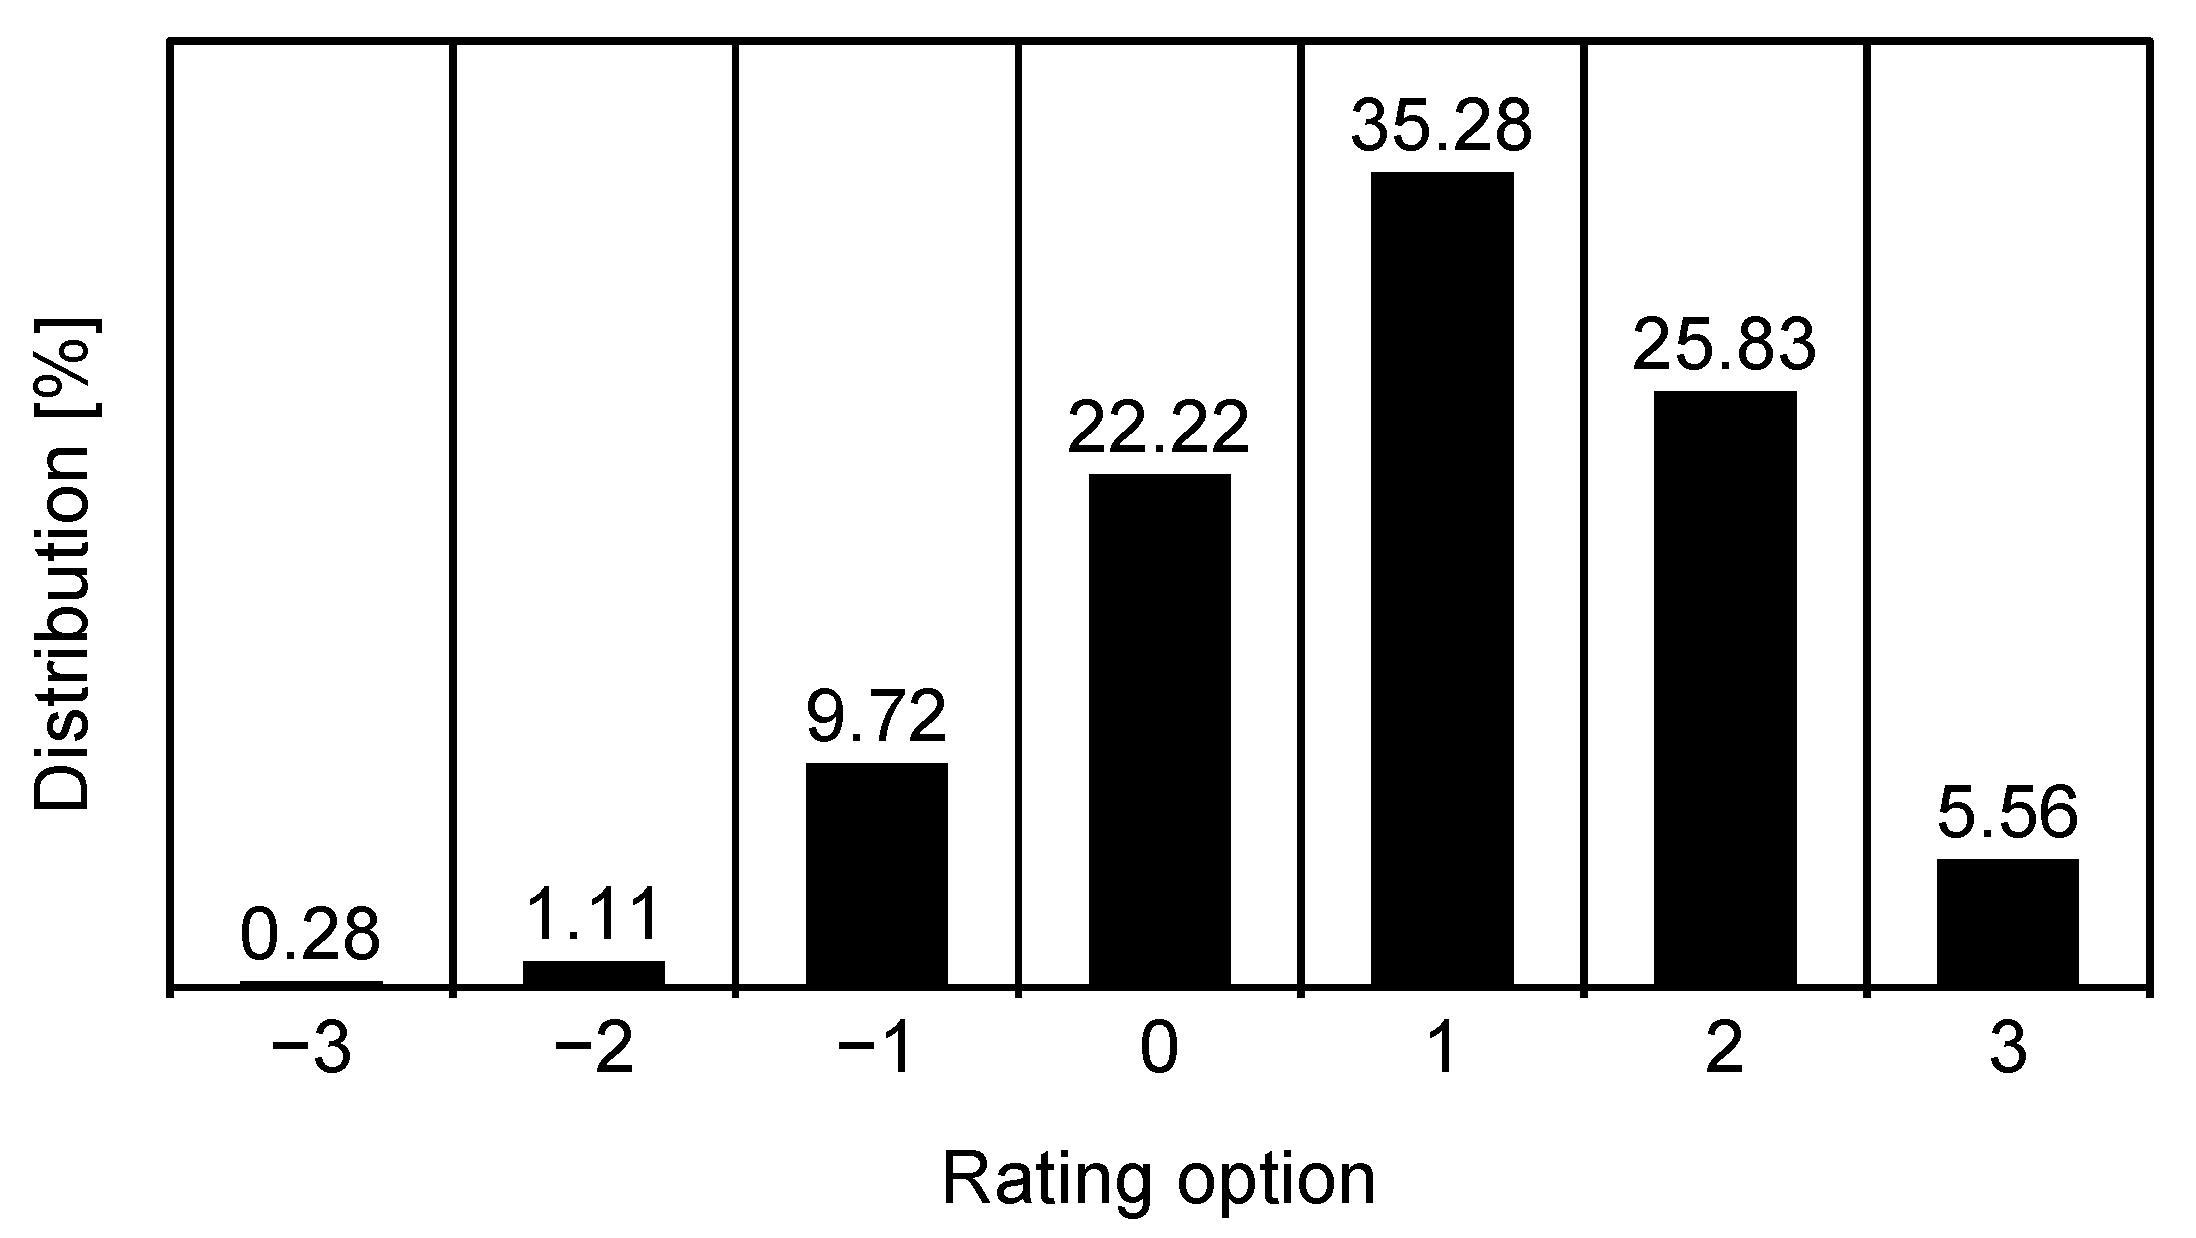
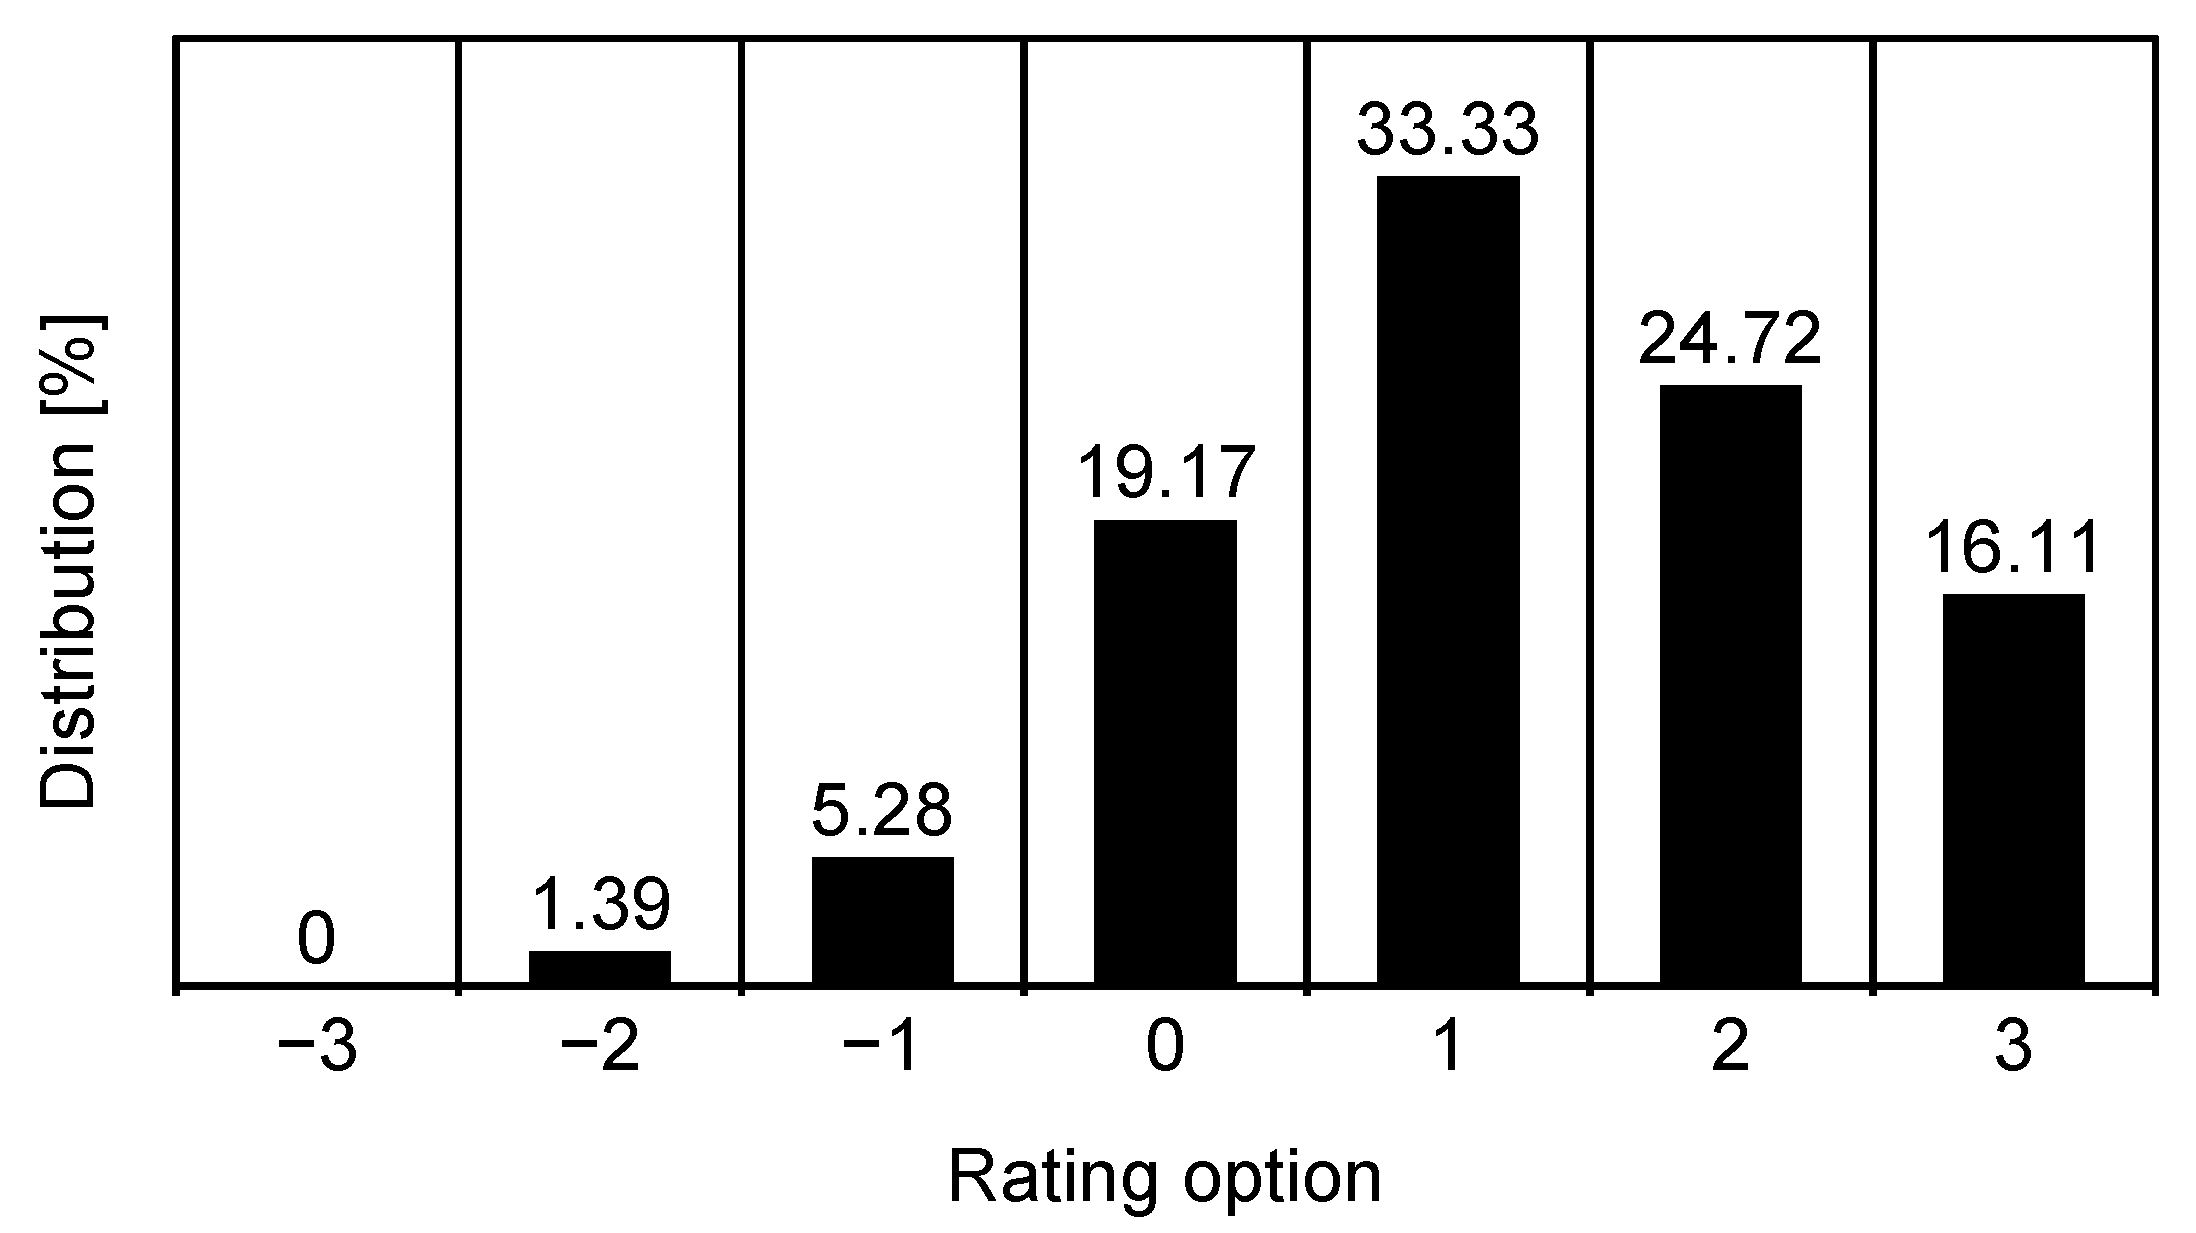
4.2. Impact of Label Order
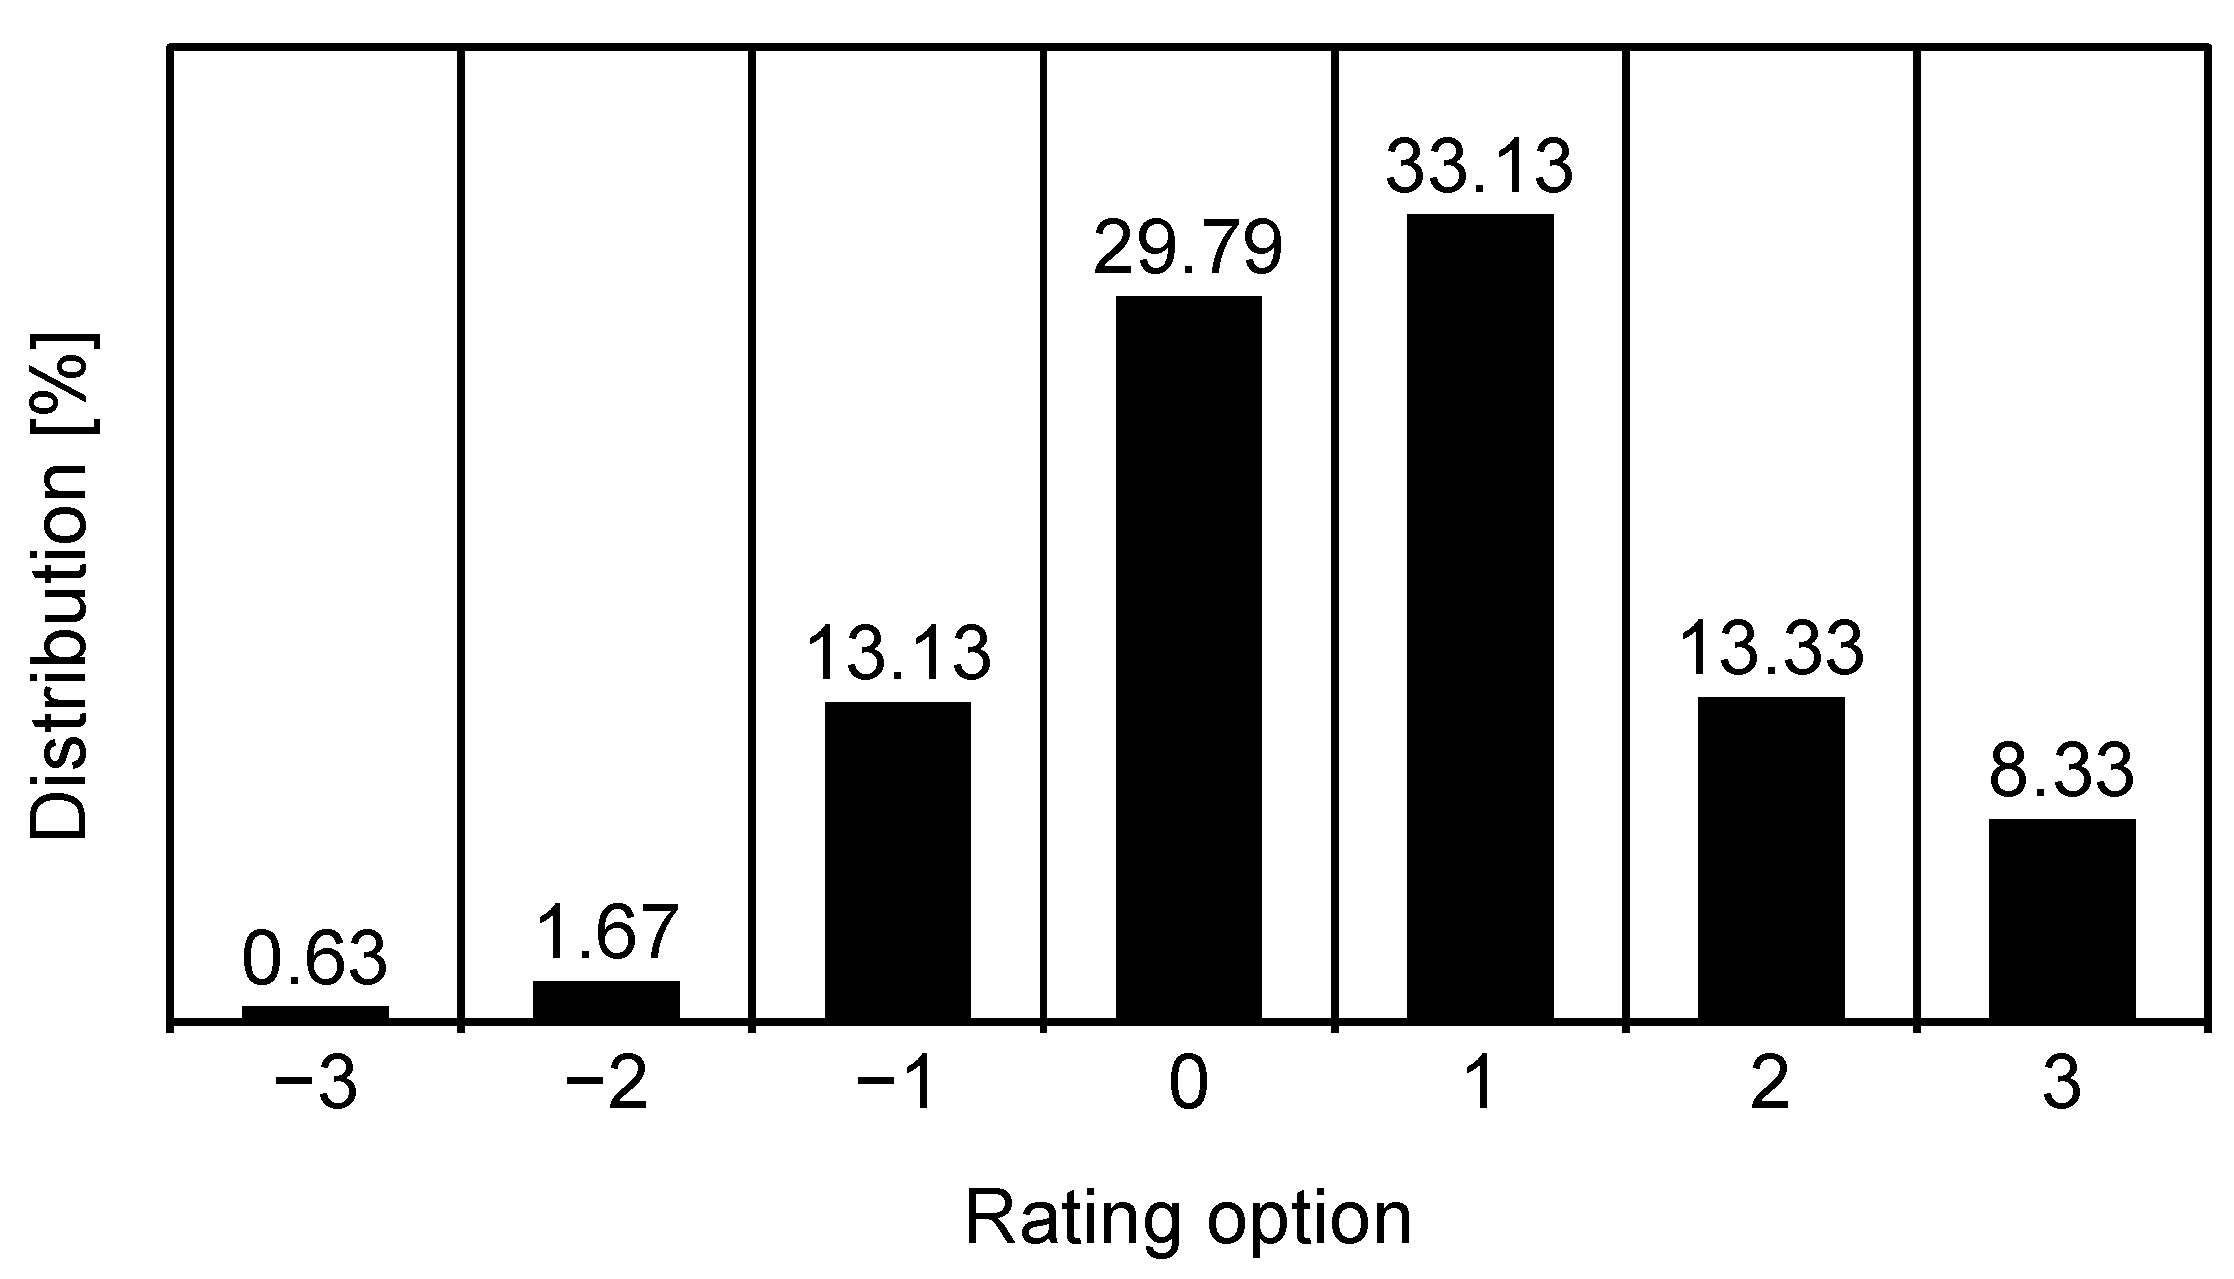
4.3. Impact of Input Type
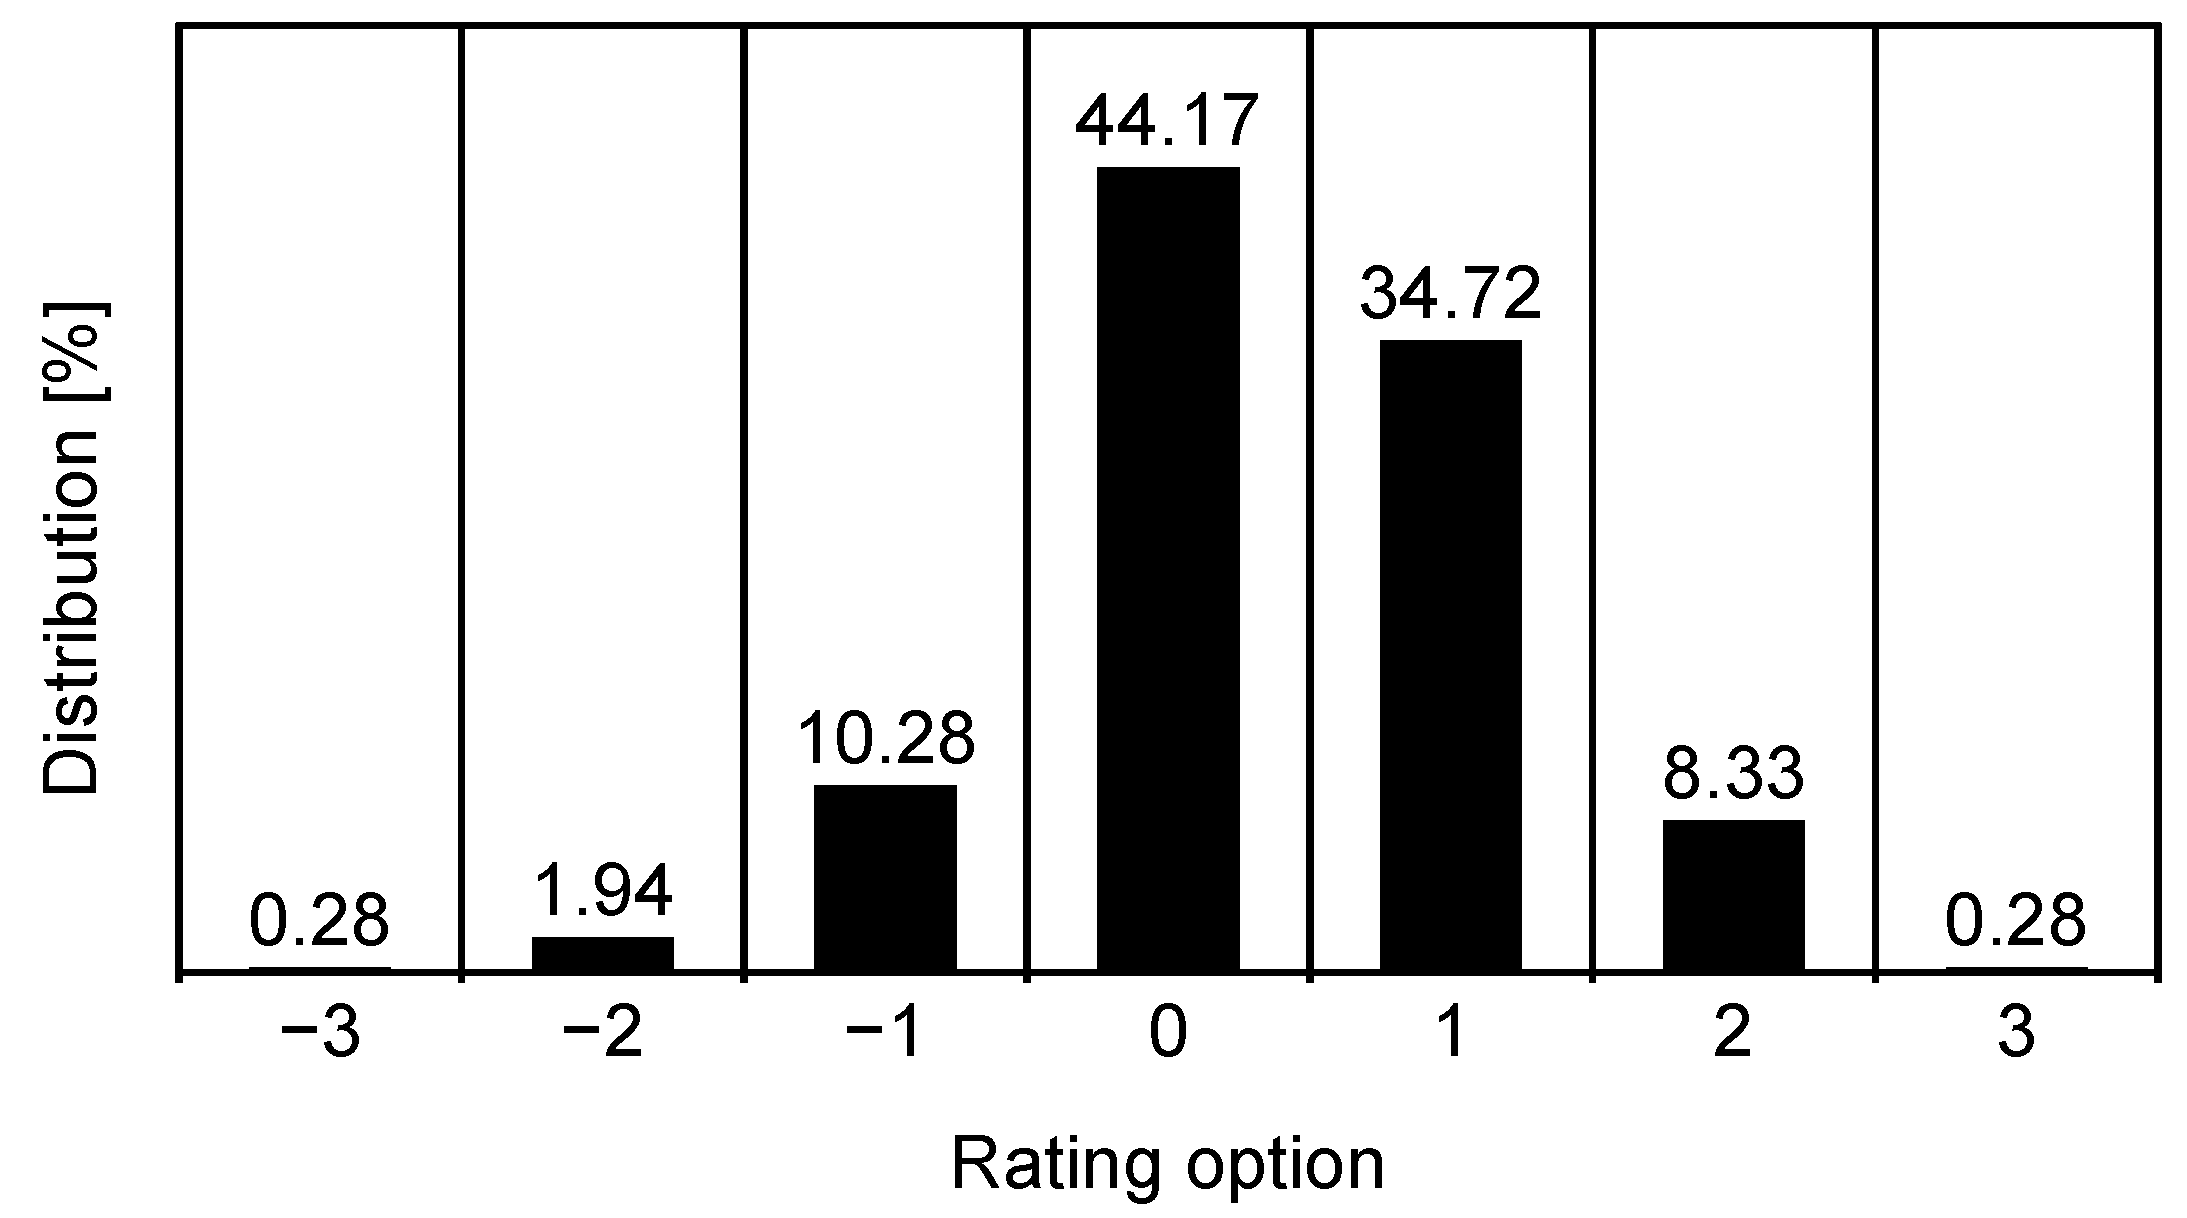
4.4. Impact of Game Difficulty
4.5. Impact of Added Command Execution Delay
4.6. Additional Discussion
5. Conclusions
Author Contributions
Funding
Institutional Review Board Statement
Informed Consent Statement
Data Availability Statement
Acknowledgments
Conflicts of Interest
Abbreviations
| ALC | Advance Lag Compensation |
| DDA | Dynamic Difficulty Adjustment |
| EBSE | evidence-based software engineering |
| fMRI | functional magnetic resonance imaging |
| FPS | first-person shooter |
| FTG | fighting game |
| GEQ | Gaming Experience Questionnaire |
| GSAQ | Gaming Specified Attributing Questionnaire |
| HCI | human–computer interaction |
| HD | high definition |
| HDR | high dynamic range |
| JND | just noticeable difference |
| LTE | long-term evolution |
| MMORPG | massively multiplayer online role-playing game |
| MOBA | multiplayer online battle arena |
| PC | personal computer |
| QoE | Quality of Experience |
| RMT | requirement management tool |
| RPG | role-playing game |
| RTS | real-time strategy |
| UHD | ultra-high-definition |
| VAT | value-added tax |
| VR | virtual reality |
References
- Normoyle, A.; Guerrero, G.; Jörg, S. Player Perception of Delays and Jitter in Character Responsiveness. In Proceedings of the ACM Symposium on Applied Perception, Vancouver, BC, Canada, 8–9 August 2014; pp. 117–124. [Google Scholar]
- Wilke, A.; Mata, R. Cognitive Bias; Elsevier: San Diego, CA, USA, 2017. [Google Scholar]
- Claypool, M.; Claypool, K.; Damaa, F. The Effects of Frame Rate and Resolution on Users Playing First Person Shooter Games. In Proceedings of the Multimedia Computing and Networking, San Jose, CA, USA, 15–18 January 2006; SPIE: New York, NY, USA, 2006; Volume 6071, p. 607101. [Google Scholar]
- Liu, S.; Claypool, M.; Kuwahara, A.; Sherman, J.; Scovell, J.J. Lower is Better? The Effects of Local Latencies on Competitive First-person Shooter Game Players. In Proceedings of the 2021 CHI Conference on Human Factors in Computing Systems, Yokohama, Japan, 8–13 May 2021; pp. 1–12. [Google Scholar]
- Chen, K.T.; Huang, P.; Lei, C.L. Effect of Network Quality on Player Departure Behavior in Online Games. IEEE Trans. Parallel Distrib. Syst. 2008, 20, 593–606. [Google Scholar] [CrossRef]
- Kokkinakis, A.; York, P.; Patra, M.S.; Robertson, J.; Kirman, B.; Coates, A.; Chitayat, A.P.P.; Demediuk, S.; Drachen, A.; Hook, J.; et al. Metagaming and Metagames in Esports. Int. J. Esports 2021, 1, 1–24. [Google Scholar]
- Boluk, S.; LeMieux, P. Metagaming: Videogames and the Practice of Play. Comput. Games New Media Cult. 2017, 53, 1–22. [Google Scholar]
- Shneiderman, B. Response time and display rate in human performance with computers. ACM Comput. Surv. (CSUR) 1984, 16, 265–285. [Google Scholar] [CrossRef]
- Raaen, K.; Eg, R. Instantaneous human-computer interactions: Button causes and screen effects. In Proceedings of the Human-Computer Interaction: Users and Contexts: 17th International Conference, HCI International 2015, Los Angeles, CA, USA, 2–7 August 2015; Proceedings, Part III 17. Springer: New York, NY, USA, 2015; pp. 492–502. [Google Scholar]
- Wang, E. User’s Delay Perception and Tolerance in Human-Computer Interaction. In Proceedings of the Human Factors and Ergonomics Society Annual Meeting, Baltimore, MD, USA, 29 September–4 October 2002; SAGE Publications: Los Angeles, CA, USA, 2002; Volume 46, pp. 651–655. [Google Scholar]
- Metzger, F.; Rafetseder, A.; Schwartz, C. A comprehensive end-to-end lag model for online and cloud video gaming. In Proceedings of the 5th ISCA/DEGA Workshop on Perceptual Quality of Systems (PQS 2016), Berlin, Germany, 29–31 August 2016; pp. 15–19. [Google Scholar]
- Pantel, L.; Wolf, L.C. On the impact of delay on real-time multiplayer games. In Proceedings of the 12th International Workshop on Network and Operating Systems Support for Digital Audio and Video, Miami, FL, USA, 12–14 May 2002; pp. 23–29. [Google Scholar]
- Schmidt, S.; Zadtootaghaj, S.; Möller, S. Towards the delay sensitivity of games: There is more than genres. In Proceedings of the 2017 Ninth International Conference on Quality of Multimedia Experience (QoMEX), Erfurt, Germany, 31 May–2 June 2017; IEEE: New York, NY, USA, 2017; pp. 1–6. [Google Scholar]
- Claypool, M.; Claypool, K. Latency can kill: Precision and deadline in online games. In Proceedings of the First Annual ACM SIGMM Conference on Multimedia Systems, Phoenix, AZ, USA, 22–23 February 2010; pp. 215–222. [Google Scholar]
- Fritsch, T.; Ritter, H.; Schiller, J. The effect of latency and network limitations on mmorpgs: A field study of everquest2. In Proceedings of the 4th ACM SIGCOMM Workshop on Network and System Support for Games, Hawthorne, NY, USA, 10–11 October 2005; pp. 1–9. [Google Scholar]
- Chen, K.T.; Chang, Y.C.; Tseng, P.H.; Huang, C.Y.; Lei, C.L. Measuring the latency of cloud gaming systems. In Proceedings of the 19th ACM International Conference on Multimedia, Scottsdale, AZ, USA, 28 November–1 December 2011; pp. 1269–1272. [Google Scholar]
- Kämäräinen, T.; Siekkinen, M.; Ylä-Jääski, A.; Zhang, W.; Hui, P. A Measurement Study on Achieving Imperceptible Latency in Mobile Cloud Gaming. In Proceedings of the 8th ACM on Multimedia Systems Conference, Taipei, Taiwan, 20–23 June 2017; pp. 88–99. [Google Scholar]
- Allison, R.S.; Harris, L.R.; Jenkin, M.; Jasiobedzka, U.; Zacher, J.E. Tolerance of Temporal Delay in Virtual Environments. In Proceedings of the IEEE Virtual Reality, Yokohama, Japan, 13–17 March 2001; IEEE: New York, NY, USA, 2001; pp. 247–254. [Google Scholar]
- Huang, P.; Arima, R.; Ishibashi, Y. Influence of Network Delay on Human Perception of Weight in Virtual Environment. In Proceedings of the 2017 3rd IEEE International Conference on Computer and Communications (ICCC), Chengdu, China, 13–16 December 2017; IEEE: New York, NY, USA, 2017; pp. 1221–1225. [Google Scholar]
- Klimmt, C.; Blake, C.; Hefner, D.; Vorderer, P.; Roth, C. Player Performance, Satisfaction, and Video Game Enjoyment. In Proceedings of the Entertainment Computing—ICEC 2009: 8th International Conference, Paris, France, 3–5 September 2009; Proceedings 8. Springer: New York, NY, USA, 2009; pp. 1–12. [Google Scholar]
- Erfani, M.; El-Nasr, M.S.; Milam, D.; Aghabeigi, B.; Lameman, B.A.; Riecke, B.E.; Maygoli, H.; Mah, S. The Effect of Age, Gender, and Previous Gaming Experience on Game Play Performance. In Proceedings of the Human-Computer Interaction: Second IFIP TC 13 Symposium, HCIS 2010, Held as Part of WCC 2010, Brisbane, Australia, 20–23 September 2010; Proceedings. Springer: New York, NY, USA, 2010; pp. 293–296. [Google Scholar]
- Hopp, T.; Fisher, J. Examination of the Relationship Between Gender, Performance, and Enjoyment of a First-Person Shooter Game. Simul. Gaming 2017, 48, 338–362. [Google Scholar] [CrossRef]
- Moller, S.; Schmidt, S.; Zadtootaghaj, S. New ITU-T Standards for Gaming QoE Evaluation and Management. In Proceedings of the 2018 Tenth International Conference on Quality of Multimedia Experience (QoMEX), Sardinia, Italy, 29–31 May 2018; IEEE: New York, NY, USA, 2018; pp. 1–6. [Google Scholar]
- Depping, A.E.; Mandryk, R.L. Why is This Happening to Me? How Player Attribution can Broaden our Understanding of Player Experience. In Proceedings of the 2017 CHI Conference on Human Factors in Computing Systems, Denver, CO, USA, 6–11 May 2017; pp. 1040–1052. [Google Scholar]
- Claypool, M.; Finkel, D. The effects of latency on player performance in cloud-based games. In Proceedings of the 2014 13th Annual Workshop on Network and Systems Support for Games, Nagoya, Japan, 4–5 December 2014; IEEE: New York, NY, USA, 2014; pp. 1–6. [Google Scholar]
- Clincy, V.; Wilgor, B. Subjective evaluation of latency and packet loss in a cloud-based game. In Proceedings of the 2013 10th International Conference on Information Technology: New Generations, Las Vegas, NV, USA, 15–17 April 2013; IEEE: New York, NY, USA, 2013; pp. 473–476. [Google Scholar]
- Li, S.; Chen, C.; Li, L. Evaluating the Latency of Clients by Player Behaviors in Client-Server Based Network Games. In Proceedings of the 2008 3rd International Conference on Innovative Computing Information and Control, Dalian, China, 18–20 June 2008; IEEE: New York, NY, USA, 2008; p. 375. [Google Scholar]
- Beigbeder, T.; Coughlan, R.; Lusher, C.; Plunkett, J.; Agu, E.; Claypool, M. The effects of loss and latency on user performance in unreal tournament 2003®. In Proceedings of the 3rd ACM SIGCOMM Workshop on Network and System Support for Games, Portland, OR, USA, 30 August 2004; pp. 144–151. [Google Scholar]
- Chanel, G.; Rebetez, C.; Bétrancourt, M.; Pun, T. Emotion Assessment From Physiological Signals for Adaptation of Game Difficulty. IEEE Trans. Syst. Man, Cybern. Part A Syst. Humans 2011, 41, 1052–1063. [Google Scholar] [CrossRef]
- Alexander, J.T.; Sear, J.; Oikonomou, A. An investigation of the effects of game difficulty on player enjoyment. Entertain. Comput. 2013, 4, 53–62. [Google Scholar] [CrossRef]
- Liu, C.; Agrawal, P.; Sarkar, N.; Chen, S. Dynamic Difficulty Adjustment in Computer Games Through Real-Time Anxiety-Based Affective Feedback. Int. J. Hum.-Comput. Interact. 2009, 25, 506–529. [Google Scholar] [CrossRef]
- Andrade, G.; Ramalho, G.; Santana, H.; Corruble, V. Challenge-Sensitive Action Selection: An Application to Game Balancing. In Proceedings of the IEEE/WIC/ACM International Conference on Intelligent Agent Technology, Compiegne, France, 19–22 September 2005; IEEE: New York, NY, USA, 2005; pp. 194–200. [Google Scholar]
- Baldwin, A.; Johnson, D.; Wyeth, P.A. The Effect of Multiplayer Dynamic Difficulty Adjustment on the Player Experience of Video Games. In CHI’14 Extended Abstracts on Human Factors in Computing Systems; Association for Computing Machinery: New York, NY, USA, 2014; pp. 1489–1494. [Google Scholar]
- Sabet, S.S.; Schmidt, S.; Griwodz, C.; Möller, S. Towards the Impact of Gamers’ Adaptation to Delay Variation on Gaming Quality of Experience. In Proceedings of the 2019 Eleventh International Conference on Quality of Multimedia Experience (QoMEX), Berlin, German, 5–7 June 2019; IEEE: New York, NY, USA, 2019; pp. 1–6. [Google Scholar]
- Sabet, S.S.; Schmidt, S.; Zadtootaghaj, S.; Naderi, B.; Griwodz, C.; Möller, S. A Latency Compensation Technique Based on Game Characteristics to Mitigate the Influence of Delay on Cloud Gaming Quality of Experience. In Proceedings of the 11th ACM Multimedia Systems Conference, Istanbul, Turkey, 8–11 June 2020; pp. 15–25. [Google Scholar]
- Savery, C.; Graham, N.; Gutwin, C.; Brown, M. The Effects of Consistency Maintenance Methods on Player Experience and Performance in Networked Games. In Proceedings of the 17th ACM Conference on Computer Supported Cooperative Work & Social Computing, Baltimore, MD, USA, 15–19 February 2014; pp. 1344–1355. [Google Scholar]
- Lee, S.W.; Chang, R.K. Enhancing the Experience of Multiplayer Shooter Games via Advanced Lag Compensation. In Proceedings of the 9th ACM Multimedia Systems Conference, Amsterdam, The Netherlands, 12–15 June 2018; pp. 284–293. [Google Scholar]
- Liu, S.; Claypool, M.; Devigere, B.; Kuwahara, A.; Sherman, J. ‘Git Gud!’—Evaluation of Self-Rated Player Skill Compared to Actual Player Performance. In Proceedings of the Extended Abstracts of the 2020 Annual Symposium on Computer-Human Interaction in Play, Virtual, 2–4 November 2020; pp. 306–310. [Google Scholar]
- Lwin, H.M.M.M.; Ishibashi, Y.; Mya, K.T. Influence of Voice Delay on Human Perception of Group Synchronization Error for Remote Learning: One-way communication case. In Proceedings of the 2020 IEEE Conference on Computer Applications (ICCA), Yangon, Myanmar, 27–28 February 2020; IEEE: New York, NY, USA, 2020; pp. 1–5. [Google Scholar]
- Pornpongtechavanich, P.; Wuttidittachotti, P.; Daengsi, T. QoE modeling for audiovisual associated with MOBA game using subjective approach. Multimed. Tools Appl. 2022, 81, 37763–37779. [Google Scholar] [CrossRef]
- Raaen, K.; Petlund, A. How much delay is there really in current games? In Proceedings of the 6th ACM Multimedia Systems Conference, Portland, OR, USA, 18–20 March 2015; pp. 89–92. [Google Scholar]
- Long, M.; Gutwin, C. Characterizing and Modeling the Effects of Local Latency on Game Performance and Experience. In Proceedings of the 2018 Annual Symposium on Computer-Human Interaction in Play, Melbourne, VIC, Australia, 28–31 October 2018; pp. 285–297. [Google Scholar]
- Claypool, M.; Eg, R.; Raaen, K. Modeling User Performance for Moving Target Selection with a Delayed Mouse. In Proceedings of the International Conference on Multimedia Modeling, Miami, FL, USA, 4–6 January 2016; Springer: New York, NY, USA, 2016; pp. 226–237. [Google Scholar]
- Claypool, M.; Cockburn, A.; Gutwin, C. The Impact of Motion and Delay on Selecting Game Targets with a Mouse. ACM Trans. Multimed. Comput. Commun. Appl. (TOMM) 2020, 16, 1–24. [Google Scholar] [CrossRef]
- Ivkovic, Z.; Stavness, I.; Gutwin, C.; Sutcliffe, S. Quantifying and Mitigating the Negative Effects of Local Latencies on Aiming in 3D Shooter Games. In Proceedings of the 33rd Annual ACM Conference on Human Factors in Computing Systems, Seoul, Republic of Korea, 18–23 April 2015; pp. 135–144. [Google Scholar]
- Quax, P.; Beznosyk, A.; Vanmontfort, W.; Marx, R.; Lamotte, W. An Evaluation of the Impact of Game Genre on User Experience in Cloud Gaming. In Proceedings of the 2013 IEEE International Games Innovation Conference (IGIC), Vancouver, BC, Canada, 23–25 September 2013; IEEE: New York, NY, USA, 2013; pp. 216–221. [Google Scholar]
- Sabet, S.S.; Schmidt, S.; Zadtootaghaj, S.; Griwodz, C.; Möller, S. Delay Sensitivity Classification of Cloud Gaming Content. In Proceedings of the 12th ACM International Workshop on Immersive Mixed and Virtual Environment Systems, Istanbul, Turkey, 8 June 2020; pp. 25–30. [Google Scholar]
- Beznosyk, A.; Quax, P.; Coninx, K.; Lamotte, W. Influence of Network Delay and Jitter on Cooperation in Multiplayer Games. In Proceedings of the 10th International Conference on Virtual Reality Continuum and Its Applications in Industry, Hong Kong, China, 11–12 December 2011; pp. 351–354. [Google Scholar]
- Beyer, J.; Möller, S. Assessing the Impact of Game Type, Display Size and Network Delay on Mobile Gaming QoE. PIK-Prax. Der Informationsverarbeitung Und Kommun. 2014, 37, 287–295. [Google Scholar] [CrossRef]
- Claypool, M. The effect of latency on user performance in real-time strategy games. Comput. Netw. 2005, 49, 52–70. [Google Scholar] [CrossRef]
- Pedri, S.; Hesketh, B. Time Perception: Effects of Task Speed and Delay. Percept. Mot. Ski. 1993, 76, 599–608. [Google Scholar] [CrossRef] [PubMed]
- Kohrs, C.; Angenstein, N.; Brechmann, A. Delays in Human-Computer Interaction and Their Effects on Brain Activity. PLoS ONE 2016, 11, e0146250. [Google Scholar] [CrossRef] [PubMed]
- Ravindran, K.; Sabbir, A.; Ravindran, B. Impact of network loss/delay characteristics on consistency control in real-time multi-player games. In Proceedings of the 2008 5th IEEE Consumer Communications and Networking Conference, Las Vegas, NV, USA, 10–12 January 2008; IEEE: New York, NY, USA, 2008; pp. 1128–1133. [Google Scholar]
- Le, A.; Liu, Y.E. Fairness in Multi-Player Online Games on Deadline-Based Networks. In Proceedings of the CCNC, Washington, DC, USA, 1–13 January 2017; pp. 670–675. [Google Scholar]
- Lindström, S.F.; Wetterberg, M.; Carlsson, N. Cloud gaming: A QoE study of fast-paced single-player and multiplayer gaming. In Proceedings of the 2020 IEEE/ACM 13th International Conference on Utility and Cloud Computing (UCC), Leicester, UK, 7–10 December 2020; IEEE: New York, NY, USA, 2020; pp. 34–45. [Google Scholar]
- Siu, K.; Guzdial, M.; Riedl, M.O. Evaluating singleplayer and multiplayer in human computation games. In Proceedings of the 12th International Conference on the Foundations of Digital Games, Hyannis, MA, USA, 14–17 August 2017; pp. 1–10. [Google Scholar]
- Lioret, A.; Diler, L.; Dalil, S.; Mota, M. Hybrid Prediction for Games’ Rollback Netcode. In Proceedings of the ACM SIGGRAPH 2022 Posters, Vancouver, BC, Canada, 7–11 August 2022; Association for Computing Machinery: New York, NY, USA, 2022; pp. 1–2. [Google Scholar]
- Huynh, E.; Valarino, F. An Analysis of Continuous Consistency Models in Real Time Peer-to-Peer Fighting Games. 2019. Available online: https://www.diva-portal.org/smash/get/diva2:1322881/FULLTEXT01.pdf (accessed on 24 April 2025).
- Ehlert, A. Improving Input Prediction in Online Fighting Games. 2021. Available online: https://www.diva-portal.org/smash/get/diva2:1560069/FULLTEXT01.pdf (accessed on 24 April 2025).
- Claypool, M. Game Input with Delay—Moving Target Selection with a Game Controller Thumbstick. ACM Trans. Multimed. Comput. Commun. Appl. (TOMM) 2018, 14, 1–22. [Google Scholar] [CrossRef]
- Long, M.; Gutwin, C. Effects of Local Latency on Game Pointing Devices and Game Pointing Tasks. In Proceedings of the 2019 CHI Conference on Human Factors in Computing Systems, Glasgow, Scotland, UK, 4–9 May 2019; pp. 1–12. [Google Scholar]
- Stern, M.K.; Johnson, J.H. Just noticeable difference. In The Corsini Encyclopedia of Psychology; John Wiley & Sons, Inc.: New York, NY, USA, 2010; pp. 1–2. [Google Scholar]
- Quax, P.; Monsieurs, P.; Lamotte, W.; De Vleeschauwer, D.; Degrande, N. Objective and subjective evaluation of the influence of small amounts of delay and jitter on a recent first person shooter game. In Proceedings of the 3rd ACM SIGCOMM Workshop on Network and System Support for Games, Portland, OR, USA, 30 August 2004; pp. 152–156. [Google Scholar]
- Xu, J.; Wah, B.W. Concealing network delays in delay-sensitive online interactive games based on just-noticeable differences. In Proceedings of the 2013 IEEE International Conference on Multimedia and Expo (ICME), San Jose, CA, USA, 15–19 July 2013; IEEE: New York, NY, USA, 2013; pp. 1–6. [Google Scholar]
- Tan, C.I.; Tan, W.H.; binti Shamsudin, S.F.; Navaratnam, S.; Ng, Y.Y. Investigating the Impact of Latency in Mobile-Based Multiplayer Online Battle Arena (MOBA) Games. Int. J. Creat. Multimed. 2022, 3, 1–16. [Google Scholar]
- Hohlfeld, O.; Fiedler, H.; Pujol, E.; Guse, D. Insensitivity to Network Delay: Minecraft Gaming Experience of Casual Gamers. In Proceedings of the 2016 28th International Teletraffic Congress (ITC 28), Wurzburg, Germany, 12–16 September 2016; IEEE: New York, NY, USA, 2016; Volume 3, pp. 31–33. [Google Scholar]
- Nichols, J.; Claypool, M. The effects of latency on online madden NFL football. In Proceedings of the 14th International Workshop on Network and Operating Systems Support for Digital Audio and Video, Cork, Ireland, 16–18 June 2004; pp. 146–151. [Google Scholar]
- Wason, P.C. On the Failure to Eliminate Hypotheses in a Conceptual Task. Q. J. Exp. Psychol. 1960, 12, 129–140. [Google Scholar] [CrossRef]
- Wason, P.C. Reasoning about a Rule. Q. J. Exp. Psychol. 1968, 20, 273–281. [Google Scholar] [CrossRef]
- Klayman, J. Varieties of Confirmation Bias. Psychol. Learn. Motiv. 1995, 32, 385–418. [Google Scholar]
- Darley, J.M.; Gross, P.H. A Hypothesis-confirming Bias in Labeling Effects. J. Personal. Soc. Psychol. 1983, 44, 20. [Google Scholar] [CrossRef]
- Jones, M.; Sugden, R. Positive Confirmation bias in the acquisition of information. Theory Decis. 2001, 50, 59–99. [Google Scholar] [CrossRef]
- Sakai, N.; Imada, S.; Saito, S.; Kobayakawa, T.; Deguchi, Y. The Effect of Visual Images on Perception of Odors. Chem. Senses 2005, 30, i244–i245. [Google Scholar] [CrossRef]
- Bentler, R.A.; Niebuhr, D.P.; Johnson, T.A.; Flamme, G.A. Impact of Digital Labeling on Outcome Measures. Ear Hear. 2003, 24, 215–224. [Google Scholar] [CrossRef]
- Iglesias, V. Preconceptions About Service: How Much Do They Influence Quality Evaluations? J. Serv. Res. 2004, 7, 90–103. [Google Scholar] [CrossRef]
- Gao, Z.; Schroeder, T.C. Effects of Label Information on Consumer Willingness-to-pay for Food Attributes. Am. J. Agric. Econ. 2009, 91, 795–809. [Google Scholar] [CrossRef]
- De Graaf, K.A.; Liang, P.; Tang, A.; Van Vliet, H. The Impact of Prior Knowledge on Searching in Software Documentation. In Proceedings of the 2014 ACM Symposium on Document Engineering, Fort Collins, CO, USA, 16–19 September 2014; pp. 189–198. [Google Scholar]
- Chovanová, H.H.; Korshunov, A.I.; Babčanová, D. Impact of Brand on Consumer Behavior. Procedia Econ. Financ. 2015, 34, 615–621. [Google Scholar] [CrossRef]
- Stylidis, K.; Wickman, C.; Söderberg, R. Perceived Quality of Products: A Framework and Attributes Ranking Method. J. Eng. Des. 2020, 31, 37–67. [Google Scholar] [CrossRef]
- Fitzgerald, M.P.; Russo Donovan, K.; Kees, J.; Kozup, J. How Confusion Impacts Product Labeling Perceptions. J. Consum. Mark. 2019, 36, 306–316. [Google Scholar] [CrossRef]
- Christandl, F.; Fetchenhauer, D.; Hoelzl, E. Price Perception and Confirmation Bias in the Context of a VAT Increase. J. Econ. Psychol. 2011, 32, 131–141. [Google Scholar] [CrossRef]
- Stacy, W.; MacMillan, J. Cognitive Bias in Software Engineering. Commun. ACM 1995, 38, 57–63. [Google Scholar] [CrossRef]
- Mohanani, R.; Salman, I.; Turhan, B.; Rodríguez, P.; Ralph, P. Cognitive Biases in Software Engineering: A Systematic Mapping Study. IEEE Trans. Softw. Eng. 2018, 46, 1318–1339. [Google Scholar] [CrossRef]
- Jørgensen, M.; Papatheocharous, E. Believing is Seeing: Confirmation Bias Studies in Software Engineering. In Proceedings of the 2015 41st Euromicro Conference on Software Engineering and Advanced Applications, Madeira, Portugal, 26–28 August 2015; IEEE: New York, NY, USA, 2015; pp. 92–95. [Google Scholar]
- Calikli, G.; Bener, A. Empirical Analyses of the Factors Affecting Confirmation Bias and the Effects of Confirmation Bias on Software Developer/Tester Performance. In Proceedings of the 6th International Conference on Predictive Models in Software Engineering, Timisoara, Romania, 12–13 September 2010; pp. 1–11. [Google Scholar]
- Leventhal, L.M.; Teasley, B.E.; Rohlman, D.S. Analyses of Factors Related to Positive Test Bias in Software Testing. Int. J. Hum.-Comput. Stud. 1994, 41, 717–749. [Google Scholar] [CrossRef]
- Salman, I. Cognitive Biases in Software Quality and Testing. In Proceedings of the 38th International Conference on Software Engineering Companion, Austin, TX, USA, 14–22 May 2016; pp. 823–826. [Google Scholar]
- Çalıklı, G.; Bener, A.B. Influence of confirmation biases of developers on software quality: An empirical study. Softw. Qual. J. 2013, 21, 377–416. [Google Scholar] [CrossRef]
- Rainer, A.; Beecham, S. A follow-up empirical evaluation of evidence based software engineering by undergraduate students. In Proceedings of the 12th International Conference on Evaluation and Assessment in Software Engineering (EASE), Swindon, UK, 26–27 June 2008; BCS Learning & Development: Swindon, UK, 2008. [Google Scholar]
- Jørgensen, M.; Løhre, E. First Impressions in Software Development Effort Estimation: Easy to Create and Difficult to Neutralize. In Proceedings of the 16th International Conference on Evaluation &Assessment in Software Engineering (EASE 2012), Stevenage, UK, 14–15 May 2012; IET: London, UK, 2012; pp. 216–222. [Google Scholar]
- Kara, P.A.; Robitza, W.; Raake, A.; Martini, M.G. The Label Knows Better: The Impact of Labeling Effects on Perceived Quality of HD and UHD Video Streaming. In Proceedings of the 2017 Ninth International Conference on Quality of Multimedia Experience (QoMEX), Erfurt, Germany, 31 May–2 June 2017; IEEE: New York, NY, USA, 2017; pp. 1–6. [Google Scholar]
- Kara, P.A.; Robitza, W.; Pinter, N.; Martini, M.G.; Raake, A.; Simon, A. Comparison of HD and UHD video quality with and without the influence of the labeling effect. Qual. User Exp. 2019, 4, 4. [Google Scholar] [CrossRef]
- Kara, P.A.; Cserkaszky, A.; Martini, M.G.; Bokor, L.; Simon, A. The effect of labeling on the perceived quality of HDR video transmission. Cogn. Technol. Work. 2020, 22, 585–601. [Google Scholar] [CrossRef]
- Geyer, F.; Szakal, V.A.; Kara, P.A.; Simon, A. Cognitive-bias-induced differences in the perceived video quality of rugged and conventional smartphones. In Proceedings of the 2022 16th International Conference on Signal-Image Technology &Internet-Based Systems (SITIS), Dijon, France, 19–21 October 2022; IEEE: New York, NY, USA, 2022; pp. 592–599. [Google Scholar]
- Bouchard, S.; Dumoulin, S.; Talbot, J.; Ledoux, A.A.; Phillips, J.; Monthuy-Blanc, J.; Labonté-Chartrand, G.; Robillard, G.; Cantamesse, M.; Renaud, P. Manipulating subjective realism and its impact on presence: Preliminary results on feasibility and neuroanatomical correlates. Interact. Comput. 2012, 24, 227–236. [Google Scholar] [CrossRef]
- BT.500: Methodologies for the Subjective Assessment of the Quality of Television Images. 2023. Available online: https://www.itu.int/rec/R-REC-BT.500/en (accessed on 21 February 2025).
- Unity Real-Time Development Platform. Available online: https://unity.com/ (accessed on 21 February 2025).
- 2024 Essential Facts About the U.S. Video Game Industry. Available online: https://www.theesa.com/resources/essential-facts-about-the-us-video-game-industry/2024-data/ (accessed on 2 March 2025).
- Video Games Europe: Key Facts Report 2023. Available online: https://www.videogameseurope.eu/wp-content/uploads/2024/09/Video-Games-Europe-2023-Key-Facts-Report_FINAL.pdf (accessed on 2 March 2025).
- Wulf, T.; Rieger, D.; Kümpel, A.S.; Reinecke, L. Harder, better, faster, stronger? The relationship between cognitive task demands in video games and recovery experiences. Media Commun. 2019, 7, 166–175. [Google Scholar] [CrossRef]
- Large, A.M.; Bediou, B.; Cekic, S.; Hart, Y.; Bavelier, D.; Green, C.S. Cognitive and behavioral correlates of achievement in a complex multi-player video game. Media Commun. 2019, 7, 198–212. [Google Scholar] [CrossRef]
- Seyderhelm, A.J.; Blackmore, K.L. How hard is it really? Assessing game-task difficulty through real-time measures of performance and cognitive load. Simul. Gaming 2023, 54, 294–321. [Google Scholar] [CrossRef]
- Mitre-Hernandez, H.; Carrillo, R.C.; Lara-Alvarez, C. Pupillary responses for cognitive load measurement to classify difficulty levels in an educational video game: Empirical study. JMIR Serious Games 2021, 9, e21620. [Google Scholar] [CrossRef]
- Zhong, X.; Xu, J. Measuring the effect of game updates on player engagement: A cue from DOTA2. Entertain. Comput. 2022, 43, 100506. [Google Scholar] [CrossRef]
- Liu, K.; Samiee, S. Too much Patching? Protocological Control and Esports Player Counts. In Proceedings of the 58th Hawaii International Conference on System Sciences, Big Island, HI, USA, 7–10 January 2025; pp. 2635–2644. [Google Scholar]
- Claypool, M.; Kica, A.; La Manna, A.; O’Donnell, L.; Paolillo, T. On the Impact of Software Patching on Gameplay for the League of Legends Computer Game. Comput. Games J. 2017, 6, 33–61. [Google Scholar] [CrossRef]
- Anderson, K. Software Patches and Their Impacts on Online Gaming Communities; University of Colorado: Boulder, CO, USA, 2019. [Google Scholar]
- Del Gallo, R. The Politics of a Game Patch: Patch Note Documents and the Patching Processes in League of Legends. 2023. Available online: https://utd-ir.tdl.org/server/api/core/bitstreams/10cc834a-ff20-4187-86f0-f3ef71a3c196/content (accessed on 24 April 2025).
- Arora, A.; Krishnan, R.; Telang, R.; Yang, Y. An Empirical Analysis of Software Vendors’ Patch Release Behavior: Impact of Vulnerability Disclosure. Inf. Syst. Res. 2010, 21, 115–132. [Google Scholar] [CrossRef]
- Lin, Z.; Jiang, X.; Xu, D.; Mao, B.; Xie, L. AutoPaG: Towards Automated Software Patch Generation with Source Code Root Cause Identification and Repair. In Proceedings of the 2nd ACM Symposium on Information, Computer and Communications Security, Singapore, 20–22 March 2007; pp. 329–340. [Google Scholar]
- Webb, S.D.; Soh, S. Cheating in networked computer games: A review. In Proceedings of the 2nd International Conference on Digital Interactive Media in Entertainment and Arts, Perth, Australia, 19–21 September 2007; pp. 105–112. [Google Scholar]
- Jussila, A. Conceptualizing Video Game Updates. 2022. Available online: https://jyx.jyu.fi/bitstreams/b64f85e3-94c3-4544-99a8-e41c8c8f8991/download (accessed on 24 April 2025).
- Truelove, A.; de Almeida, E.S.; Ahmed, I. We’ll fix it in post: What do bug fixes in video game update notes tell us? In Proceedings of the 2021 IEEE/ACM 43rd International Conference on Software Engineering (ICSE), Virtual, 25–28 May 2021; IEEE: New York, NY, USA, 2021; pp. 736–747. [Google Scholar]
- Mertens, J. Broken Games and the Perpetual Update Culture: Revising Failure with Ubisoft’s Assassin’s Creed Unity. Games Cult. 2022, 17, 70–88. [Google Scholar] [CrossRef]
- Kara, P.A.; Bokor, L.; Sackl, A.; Mourão, M. What your phone makes you see: Investigation of the effect of end-user devices on the assessment of perceived multimedia quality. In Proceedings of the 2015 Seventh International Workshop on Quality of Multimedia Experience (QoMEX), Costa Naviro, Greece, 26–29 May 2015; IEEE: New York, NY, USA, 2015; pp. 1–6. [Google Scholar]
- Gu, K.; Liu, M.; Zhai, G.; Yang, X.; Zhang, W. Quality assessment considering viewing distance and image resolution. IEEE Trans. Broadcast. 2015, 61, 520–531. [Google Scholar] [CrossRef]
- Fang, R.; Wu, D.; Shen, L. Evaluation of image quality of experience in consideration of viewing distance. In Proceedings of the 2015 IEEE China Summit and International Conference on Signal and Information Processing (ChinaSIP), Chengdu, China, 12–15 July 2015; IEEE: New York, NY, USA, 2015; pp. 653–657. [Google Scholar]
- Amirpour, H.; Schatz, R.; Timmerer, C.; Ghanbari, M. On the impact of viewing distance on perceived video quality. In Proceedings of the 2021 International Conference on Visual Communications and Image Processing (VCIP), Munich, Germany, 5–8 December 2021; IEEE: New York, NY, USA, 2021; pp. 1–5. [Google Scholar]
- Harmat, L.; de Manzano, Ö.; Theorell, T.; Högman, L.; Fischer, H.; Ullén, F. Physiological correlates of the flow experience during computer game playing. Int. J. Psychophysiol. 2015, 97, 1–7. [Google Scholar] [CrossRef]
- Yeo, M.; Lim, S.; Yoon, G. Analysis of biosignals during immersion in computer games. J. Med. Syst. 2018, 42, 557608. [Google Scholar] [CrossRef]
- Schmidt, S.; Uhrig, S.; Reuschel, D. Investigating the relationship of mental immersion and physiological measures during cloud gaming. In Proceedings of the 2020 Twelfth International Conference on Quality of Multimedia Experience (QoMEX), Athlone, Ireland, 26–28 May 2020; IEEE: New York, NY, USA, 2020; pp. 1–6. [Google Scholar]
- Wiederhold, B.K.; Davis, R.; Wiederhold, M.D. The effects of immersiveness on physiology. In Virtual Environments in Clinical Psychology and Neuroscience; IOS Press: Amsterdam, The Netherlands, 1998; pp. 52–60. [Google Scholar]
- Wiederhold, B.K.; Jang, D.P.; Kaneda, M.; Cabral, I.; Lurie, Y.; May, T.; Kim, I.; Wiederhold, M.D.; Kim, S. An investigation into physiological responses in virtual environments: An objective measurement of presence. Towards Cyberpsychol. 2001, 2, 175–183. [Google Scholar]
- Halbig, A.; Latoschik, M.E. A systematic review of physiological measurements, factors, methods, and applications in virtual reality. Front. Virtual Real. 2021, 2, 694567. [Google Scholar] [CrossRef]


Disclaimer/Publisher’s Note: The statements, opinions and data contained in all publications are solely those of the individual author(s) and contributor(s) and not of MDPI and/or the editor(s). MDPI and/or the editor(s) disclaim responsibility for any injury to people or property resulting from any ideas, methods, instructions or products referred to in the content. |
© 2025 by the authors. Licensee MDPI, Basel, Switzerland. This article is an open access article distributed under the terms and conditions of the Creative Commons Attribution (CC BY) license (https://creativecommons.org/licenses/by/4.0/).
Share and Cite
Nguyen, D.H.; Kara, P.A. The Influence of the Labeling Effect on the Perception of Command Execution Delay in Gaming. Multimodal Technol. Interact. 2025, 9, 47. https://doi.org/10.3390/mti9050047
Nguyen DH, Kara PA. The Influence of the Labeling Effect on the Perception of Command Execution Delay in Gaming. Multimodal Technologies and Interaction. 2025; 9(5):47. https://doi.org/10.3390/mti9050047
Chicago/Turabian StyleNguyen, Duy H., and Peter A. Kara. 2025. "The Influence of the Labeling Effect on the Perception of Command Execution Delay in Gaming" Multimodal Technologies and Interaction 9, no. 5: 47. https://doi.org/10.3390/mti9050047
APA StyleNguyen, D. H., & Kara, P. A. (2025). The Influence of the Labeling Effect on the Perception of Command Execution Delay in Gaming. Multimodal Technologies and Interaction, 9(5), 47. https://doi.org/10.3390/mti9050047