Article

diaLogic: A Multi-Modal Framework for Automated Team Behavior Modeling Based on Speech Acquisition

Department of Electrical and Computer Engineering, Stony Brook University, Stony Brook, NY 11794-2350, USA
*
Author to whom correspondence should be addressed.
Multimodal Technol. Interact. 2025, 9(3), 26; https://doi.org/10.3390/mti9030026
Submission received: 25 December 2024 / Revised: 12 February 2025 / Accepted: 6 March 2025 / Published: 10 March 2025

Abstract

:
This paper presents diaLogic, a humans-in-the-loop system for modeling the behavior of teams during collective problem solving. Team behavior is modeled using multi-modal data about cognition, social interactions, and emotions acquired from speech inputs. The system includes methods for speaker diarization, speaker interaction characterization, speaker emotion recognition, and speech-to-text conversion. Hypotheses about the invariant and differentiated aspects of teams are extracted using the similarities and dissimilarities of their behavior over time. Hypothesis extraction, a novel contribution of this work, uses a method to identify the clauses and concepts in each spoken sentence. Experiments present system performance for a broad set of cases of team behavior during problem solving. The average errors of the various methods are between 6% and 21%. The system can be used in a broad range of applications, from education to team research and therapy.

1. Introduction

Humans-in-the-Loop (HiL) systems integrate data acquisition, modeling, and decision making for activities and processes that tightly couple computing with human activities and characteristics, like beliefs, goals, social interactions, emotions, and so on [1,2,3]. A main challenge is to collect the necessary multi-modal information within the resource constraints of the system and with minimal user input to create models that can be used for decision making and control [2]. HiL systems can be implemented in two conceptual ways. (i) Multi-input, single-output systems use multiple data sources, which are organized into a single intuitive output data format, usually used for one purpose. (ii) Single-input, multi-output systems feature a single data source, which utilizes various algorithms to create multiple data outputs. Outputs are used for multiple purposes, either simultaneously or selectively. Within either way, models can be built at different points. For example, in a top-down decision-making approach, parameterized models are created before data acquisition. Data are then used to find the model parameters. For a bottom-up approach, models are identified (i.e., selected, inferred, or synthesized) during data acquisition.
The tight coupling of computing and humans imposes intriguing new challenges in which the formalized, algorithmic, and well-defined nature of traditional computer algorithms must coordinate with human behavior, which is more spontaneous, less structured, and often open-ended. An important problem in this context is the semantic coupling between computing and human activities. Semantic coupling describes the capacity to establish a sound and comprehensive bi-directional way to communicate meaning between computers and humans. For example, automated interventions can be introduced through algorithms to improve the effectiveness of a team, i.e., to encourage comprehensive participation and the solving of different conflicts. However, the nature of these interventions depends on the meaning of the cognitive, social, and emotional interactions of the participants who jointly solve problems, share a common space, perform a physical activity, participate to a medical procedure, and so on. In particular, this paper discusses an algorithmic solution to the modeling and representation of human behavior during Collective Problem Solving (CPS) in teams [4].
This paper presents the diaLogic system, a HiL system, to model team behavior during open-ended CPS. It is a single-input, multi-output automated data acquisition system that utilizes multi-modal data about cognition, social interactions, and emotions to extract hypotheses about team behavior. Cognitive, emotional, and social characteristics of teams are computed based on speech within recorded social settings, in which individuals interact with each other during CPS. The addressed semantic coupling includes identification of the concepts and the types of clauses forming the verbal responses, the participants’ (agents) emotions, and the nature of social interactions. Combining cognitive, social, and emotional data about a team into an extensive model is a novel contribution of this work as compared to similar work, which separately tackled the three types of data [5,6]. However, CPS success depends not only on reasoning and knowledge sharing [7] but also on decisions to cooperate or not [8], as well as the psychological safety of a team [9]. The knowledge-sharing amount, cooperation level, and psychological safety are related to each other [10], and considering only data pertaining to a single domain arguably offers an incomplete description of the team’s behavior. A preliminary version of this work discussed the modeling of social interactions in a team, including the classification of team members into group leaders and followers, and the level of a speaker’s contribution [11]. An unreviewed version of this work is also posted in the arXiv database [12].
The created models are used to extract hypotheses about team behavior invariants, which state that a certain condition holds true over different time ranges and teams. Hypothesis extraction utilizes the similarities and dissimilarities of the following five sets computed for consecutive time segments: (i) the concepts used in verbal responses, (ii) agent emotions, (iii) observed urgency and (iv) motivation in creating responses, and (v) differences between current and previous responses. Hypotheses are formulated using concepts and clauses in the spoken utterances based on a rule-based algorithm that classifies clauses in the following categories: what, who, for who, when, how, where, why, and consequence clauses [13,14]. This system achieves higher accuracy when processing normal social conversations than when processing conversations within a specialized context, like the jargon used in programming. diaLogic system can be utilized in a broad range of collaborative applications that includes education, team research, therapy, and resource allocation to teams [15]. The multi-modal data collected by diaLogic can be used to extract hypotheses that connect the cognitive, social, and emotional characteristics of a team to its performance. After validating the hypotheses through experiments, the obtained insight can be utilized to improve team interactions and results.
The diaLogic system was implemented in Python using the PyQt5, Numpy, Torch, Whisper [16], CoreNLP [17], and PyWSD [18] libraries. The core algorithm for diaLogic is a speaker diarization algorithm, from which all subsequent data are generated, such as speech emotion recognition, speaker interaction, speech-to-text, and speech clause information.
The remainder of this paper is structured as follows. Section 2 discusses related work. Section 3 describes the modeling of human behavior using invariants. Section 4 presents the system design of diaLogic, followed by experiments in Section 5. Conclusions end the paper.

2. Related Work

Systems similar to the diaLogic system are scarce, since most research focuses on the individual components of the system. Therefore, the discussion of the related work concentrates on the individual components.
Speaker diarization. Refinements of speaker diarization focus on improving the individual processing stages of the traditional algorithm [19]. These stages include audio processing, Neural Network (NN) architecture, and spectral clustering. During audio processing, audio quality is optimized. Audio de-noising and audio de-reverberation have been utilized to remove background noise within a specific recording. These methods are implemented either through purely mathematical means or through Machine Learning (ML) [20,21]. NN architecture refinements have been extensively studied within speaker diarization. Convolutional Neural Networks (CNNs), Long Short-Term Memory (LSTM), and architectural combinations have been suggested. Furthermore, specific layer-level improvements have been proposed. For example, optimizations of the softmax loss function and recurrent layers can reduce error [22]. However, these optimizations are data-specific and provide increased performance for only a specific subset of data. Therefore, as more optimizations are implemented, the data become more specialized.
Refinements of spectral clustering have been widely documented. Cross-EM validation is the most common refinement. This feature improves the cross-validation process within the K-means clustering algorithm. Agglomerative Hierarchical Clustering (AHC) and Sequential Constraint (SC) clustering have been suggested as well. These refinements provide a specialized approach to minimizing clustering error [23].
Interaction characterization. Interaction characterization through audiovisual means is the most common approach. The method proposed in [24] visually tracks head position and expression to obtain interaction data. The algorithm can be utilized for sentiment analysis, where a person’s visual expressions merit approval or disapproval [5]. Other methods focus on gaze tracking to identify social participation and signaling, like leadership relations, power attribution, prestige, and mutual engagement [25,26,27]. Audio data are used for speaker diarization to automatically track speakers over time; the collected data are then used to manually record interaction data [6]. Manually recording interactions is laborious and subject a person’s rationale and opinions. A mathematical algorithm reduces accuracy in exchange for faster processing, in addition to providing a logical baseline for interaction characterization. Sentiment analysis was recorded by hand from audio data in [28]. The speaker role was identified with an accuracy of 86%, and agreement/disagreement instances were identified with an accuracy of 52–92%, depending on the language [28].
Speech Emotion Recognition (SER). The determining factor for related work in SER is the database based on which an NN used for predictions is trained. The public SER database with the highest training accuracy is arguably the German EMODB database [29]. This database features high-quality samples, which contribute to its high accuracy. However, the extremely expressive nature of the German language also is a contributing factor to accuracy. Various implementations of EMODB have been designed. A Support Vector Machine (SVM) design offers an 80% accuracy [30]. A fused multi-class SVM algorithm achieves 93% accuracy [31]. A CNN-based implementation achieves 90% accuracy [32]. An attention-based CNN and LSTM solution achieves 87% accuracy [33]. A CNN-based design features 86% accuracy [34]. However, non-proprietary databases do not yield accuracy above 93% within training results. Therefore, the accuracy of related SER implementations is limited until new databases are created.
Speech clause detection. The detection of speech clauses, or subordination clauses, within sentences has also been studied. The methods for determining these clauses fall into three categories: dependency parsing, grammatical role detection, and word-based analysis. For dependency parsing, the relationships between words within a sentence are utilized to generate hypotheses regarding sentence meaning. Algorithms that utilize dependency parsing seek to utilize knowledge beyond parts of speech or individual word meanings and determine the meaning of a sentence as a whole [35,36]. Grammatical role detection algorithms utilize a simpler version of the former algorithm. This simplified approach seeks to extract specific parts of a sentence, which fit into a specific grammatical context. Sentences that feature similar contexts are compared for further analysis. Furthermore, this algorithm can be combined with elements from the former algorithm to identify sentences that fit into a specific context, then extract the parts of the sentences that are most prominent [37,38,39]. The most basic approach to speech clause detection focuses on a word-based approach. This approach considers a sentence as a whole and is entirely dependent on the part of speech assigned to each word [40]. Speech clauses are found by using the lexical meanings of the words. This method is the most dependent on context, corresponding to the highest potential for error.

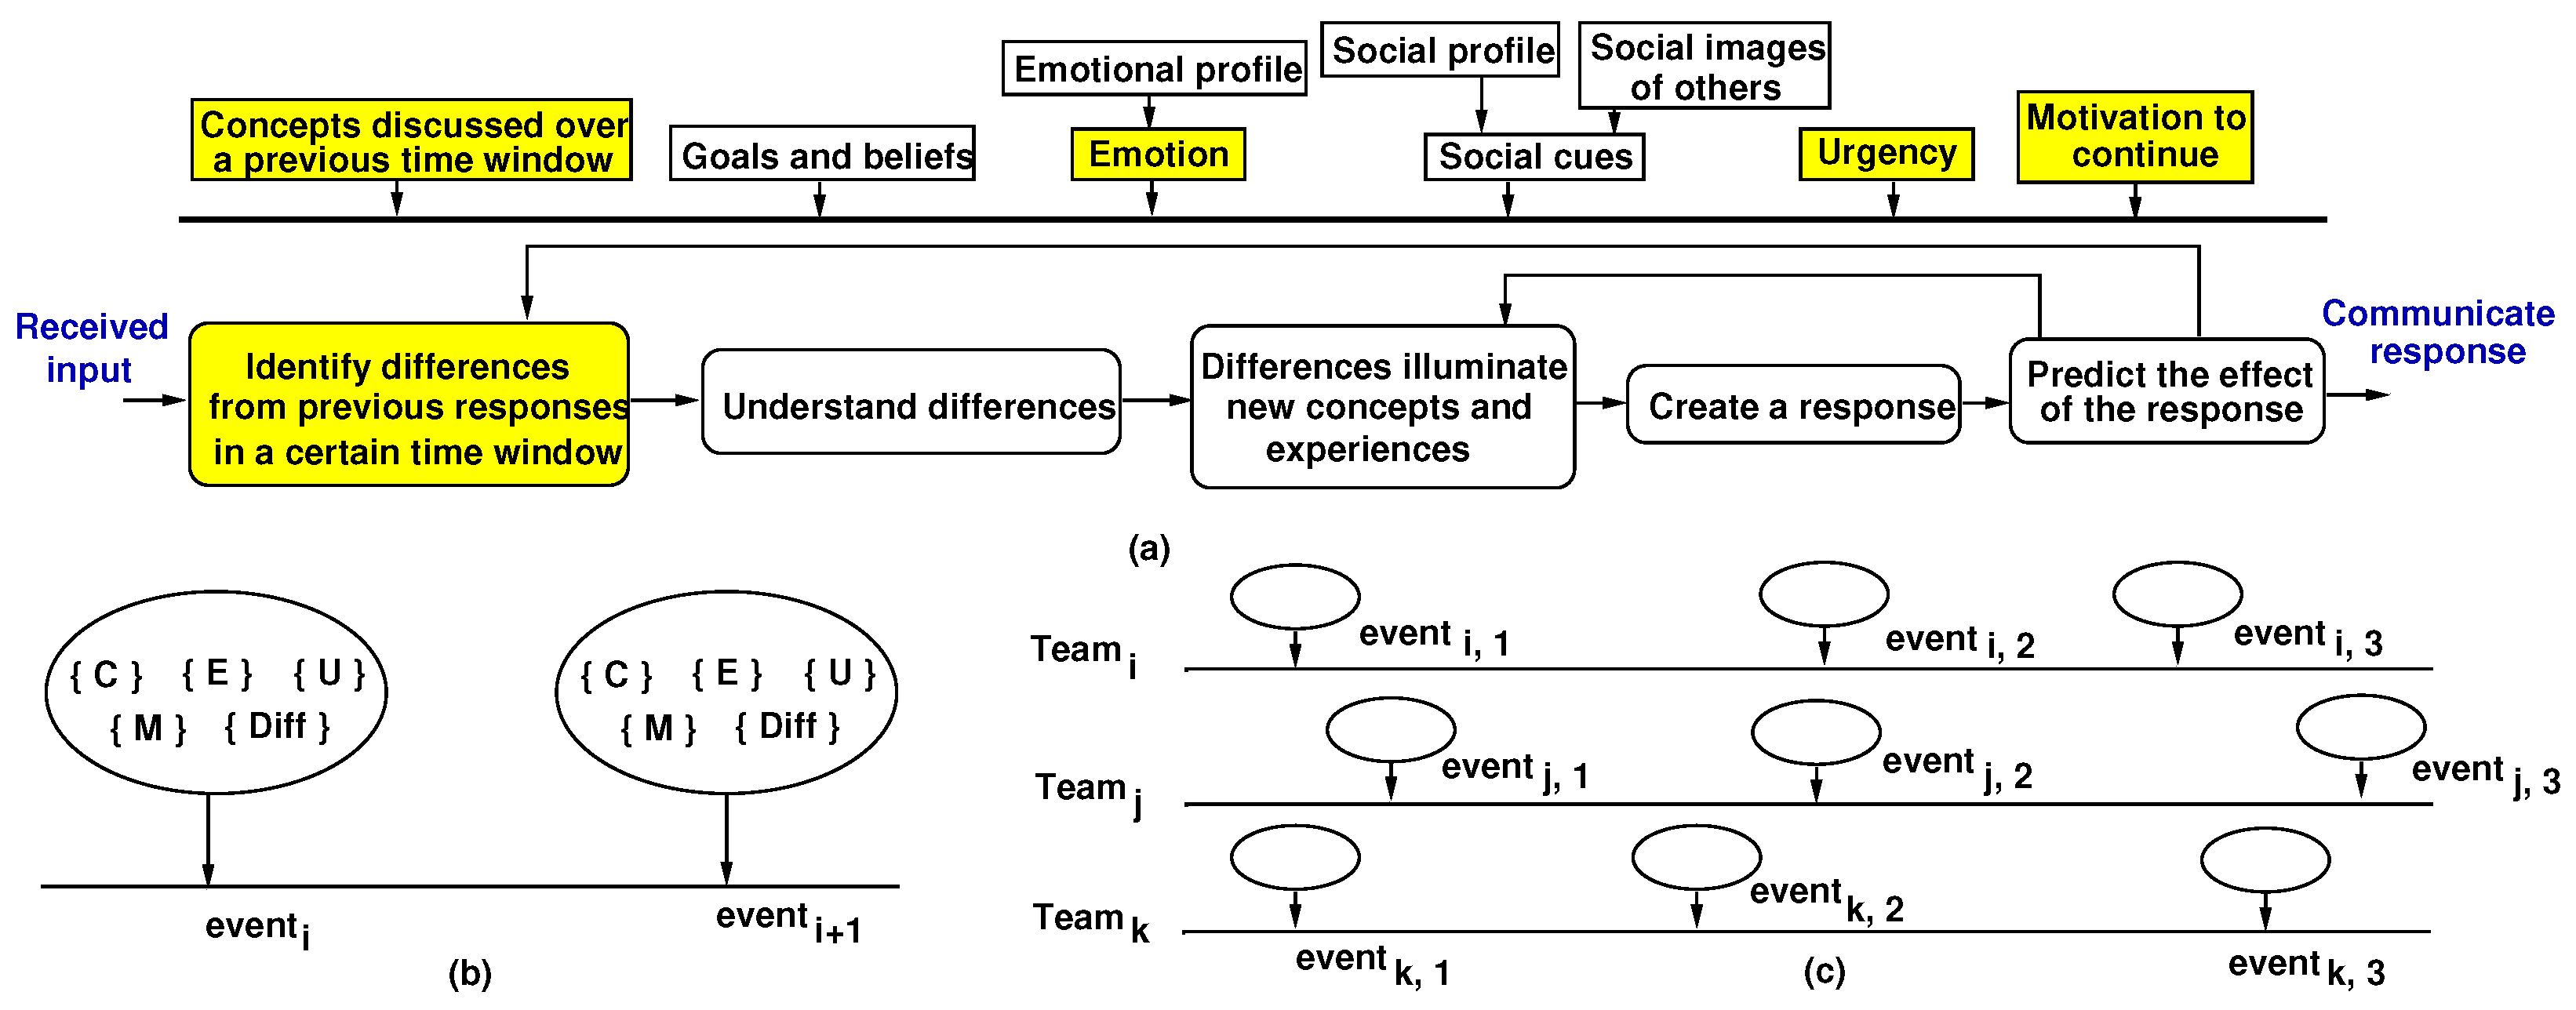
3. Modeling Human Behavior Using Invariants

Figure 1a summarizes the human agent model assumed for the design of the diaLogic system [4,14]. The bottom part of the figure presents the cognitive activities that an agent performs to create and communicate a response after receiving a verbal input from another agent. An agent first identifies the differences between the current input, the previously received inputs, and its own communicated outputs. Then, these differences are understood by the agent, and as a result, any related concepts and experiences are illuminated in the memory. These are used by the agent to create a response, but before communicating it, the agent predicts the expected effect of the response. Depending on the prediction, the agent decides to communicate the response to others, or, if unsatisfactory, other concepts and experiences are illuminated or the agent might focus on other differences.
The five cognitive activities in the bottom part of Figure 1a are continuously moderated by the elements depicted in the upper part of Figure 1a using the concepts discussed over the previous time window, the agent’s goals and beliefs, the agent’s motivation to continue as a result of its emotions, the interpretation of social cues, and the urgency (utility and valence) of the response. Not all components are observable. In the figure the activities and elements that can be directly tracked together with the responses communicated during team interaction are highlighted in yellow.
Figure 1b shows the observable behavior of a team of agents. At any moment in time, the team behavior is described by set { C } of the responses (e.g., concepts) mentioned over the last time window, set { E } of emotions, set { U } of the observed urgency in creating responses, set { M } of the observed motivation, and set { D i f f } of the differences between new and previous responses. The model defines an event as having occurred if there is a significant difference between any of the five sets describing a team, e.g., at least one of the five sets for e v e n t i significantly differs from a set for e v e n t i + 1 in Figure 1b. The time interval between two consecutive events is called a linear time segment. Figure 1c illustrates the modeling of team behavior using linear time segments.

3.1. Invariants and Hypothesis Extraction

This work considered hypotheses about invariant expressions that indicate how specific parameters consistently affect the outcome of team behavior. Invariance is the property according to which, under the same conditions, a condition holds true across different time ranges and teams. It describes the degree to which previous characteristics of a team predict future behavior of the same or a similar team, as well as the degree to which a parameter change produces a certain team behavior. Invariant expressions refer to the five sets ( { C } , { E } , { U } , { M } , and { D i f f } ), relations among the parameters, and parameters describing a team. A new hypothesis must be consistent with hypotheses already proven to be true.
Hypothesis extraction is the activity of finding invariants, which are then validated through experiments. Figure 2 summarizes the hypothesis extraction principle. It illustrates two linear time segments: the first between the consecutive events (i and i + 1 ) and the second between the consecutive events (j and j + 1 ). Note that the two linear time segments can pertain to the same team or different teams. The proposed methodology performs computations using appropriate metrics, i.e., the similarity and dissimilarity between the five sets at the start and at the end of the linear time segments, e.g., between the five sets for events i and j and their successive events ( i + 1 and j + 1 , respectively). The extracted hypotheses describe two cases:
1. Invariant situations: This case is described by the similarities between the pair of { { C } ,   { E } , { U } ,   { M } , { D i f f } } i and { { C } ,   { E } ,   { U } , { M } ,   { D i f f } } j and the similarities between the pair of { { C } , { E } ,   { U } , { M } and { D i f f } } i + 1 ,   { { C } , { E } ,   { U } , { M } , { D i f f } } j + 1 .
S i m ( e i , e j ) S i m ( e i + 1 , e j + 1 ) | D S i m ( e i , e j ) , D S i m ( e i + 1 , e j + 1 )
It states that, given the similarities between events i and j, the similarities between events i + 1 and j + 1 should be observed in the presence of the dissimilarities between events i and j and the dissimilarities between events i + 1 and j + 1 . As similarities exist in the presence of dissimilarities, the latter do not have an impact on the former. Parameter  e k indicates event k, S i m is the similarity between two events, and D S i m is the dissimilarity.
2. Differentiated situations: This case refers to the dissimilarities of the same pairs as the similar situations. However, the invariants state that, given the dissimilarities between events i and j, dissimilarities are also expected between events i + 1 and j + 1 in the presence of the similarities between events i and j and the similarities between events i + 1 and j + 1 . Hence, the dissimilarities between events i + 1 and j + 1 result from the dissimilarities between events i and j. Similarities might influence the magnitude of dissimilarities but not their existence.
D S i m ( e i , e j ) D S i m ( e i + 1 , e j + 1 ) | S i m ( e i , e j ) , S i m ( e i + 1 , e j + 1 )

3.2. Metrics, Similarity, and Dissimilarity

The following similarity and dissimilarity metrics were defined for sets { C } , { E } , { U } , { M } , and { D i f f } . They are separately computed for agents and teams.
1. Using concept networks ({C}): The first set of metrics characterize concept networks [41], like the number of concepts in the network, their variety (i.e., breadth of the network), the connections between concepts, the number of instances of more abstract concepts (e.g., the depth of the network), and the number of unrelated concepts in a network. Concept connections reflect the relationship between two concepts, such as using the metrics of the WordNet [42] or other similar databases.
The second set of metrics considers the meaning (semantics) of the concepts in a response. As explained in Section 4.5, the framework determines the type of the clause in which a concept was used, like what, how, why, when, who, for who, and consequence clauses. These metrics observe the nature of the team activity. For example, these metrics indicate if a certain agent or team focused more on creating a solution (hence, there was a high number of how clauses) or worked on problem framing (thus, used more what clauses). Section 4.5 details the rule-based algorithm used to find the clause types.
2. Using emotions ({E}): These metrics present the degree to which emotions were constant or changed and if certain emotions were predominant compared to others. The similarity and dissimilarity of an agent’s emotions relative to the rest of the team are also found.
3. Using urgency ({U}): These metrics describe the priority of the produced responses. Priority relates to an agent’s goals and beliefs. Urgency depends on the frequency of the responses produced by an agent, the intention of the responses (like enthusiasm, confidence, sarcasm, etc.), and the associated emotions.
4. Using motivations ({M}): These metrics complement the metrics on urgency to express the degree to which an agent decides to allocate attention, time, and energy to address the priority of a response. Motivation is characterized by the length of the responses, the nature of the used clauses, the variety of the referred concepts, and emotions. Note that motivation relates to the goals and beliefs of an agent.
5. Using differences ({Diff}): These metrics express the degree to which the metrics of the four previous types remained the same or changed. The following categories are computed: (i) direct measurements extracted during data collection, (ii) changes in direct measurements over time, (iii) statistical correlations between direct measurements and changes, (iv) sequences of situations that produce a certain outcome, and (v) situations in which the computed metrics are insufficient to explain an outcome.

4. System Design and Metrics

This section presents the design of the diaLogic system. Figure 3 illustrates the system. Inputs are the audio recordings of group interactions, with the number of speakers in each recording as a marker. Speaker diarization is performed on the audio data to identify who speaks when. The results of speaker diarization drive every other processing step, including speech emotion recognition, speaker interaction detection, speech-to-text conversion, words-per-minute computation, and speech clause detection. The obtained data are used to extract hypotheses about team behavior. Speaker diarization, Speech emotion recognition, and speech-to-text conversion use traditional algorithms. Speech clause detection and hypothesis extraction represent novel contributions of the system design. The components of the diaLogic systems are discussed next.

4.1. Speaker Diarization

Speaker diarization is the process of determining “who spoke when” within a given audio file. Speech utterances separated by speaker ID are generated within the given time frame of a source file. The diarization algorithm used within diaLogic system is a modification of the traditional top-down implementation of diarization [43]. The workflow of the algorithm is described in Figure 4(left). It features pre-processing, the main algorithm, followed by a modified post-processing stage. The three stages are discussed next.
Pre-processing. Pre-processing converts all speech data into 0.4 s consecutive intervals overlapping by 0.1 s based on the results of Pyannote’s speaker change detection algorithm [44]. Each interval is averaged into a 0.4 s segment-level embedding of an x vector. The algorithm follows the standard procedure reported in the literature, including voice activity detection (VAD) and data segmentation. VAD removes non-speech segments from the input audio. Two VAD modules were realized—Pyannote [44] and WebRTC [45]—as one VAD module was not enough to accurately process a variety of input data. For some input files, Pyannote did not remove non-speech data from between speech segments, while WebRTC did. Furthermore, Pyannote did not provide significant padding around the detected speech segments, resulting in sharp acoustic transitions between speech segments. The shortest output from either algorithm was used as input for data segmentation.
Main algorithm. The neural network (NN) used to generate x-vector predictions for our algorithm is a modified ECAPA-TDNN architecture from the SpeechBrain audio toolkit [43]. The architecture for ECAPA-TDNN is shown in Figure 4(right). We used exponential linear units (ELUs) [46] in place of ReLU activation layers. This change provided additional stability for the training process. We trained this architecture on the VoxCeleb1+2 configuration provided by SpeechBrain [43] based on over 2000 h of speech with a total of 7205 speakers taken from public sources. The model reached an equal error rate (EER) of 0.91% over the course of 12 epochs.
Each segment-level x vector was merged into an affinity matrix and input to a spectral offline clustering algorithm, which was derived from [47]. We utilized spectral clustering parameters based on an autotuning parameter from 0.4 to 0.95 in 0.05 steps and a K-means algorithm based on circular centroids. Spectral embeddings were generated based on the eigenvalues of the affinity matrix. The spectral clustering algorithm clustered the embeddings into m clusters, where m was the number of speakers. For our experiments, m was known beforehand. Thus, we eliminated the portion of spectral clustering where m is estimated using the minimal eigengap method. The result of spectral clustering is a series of utterances for each speaker, denoting a start and end time.
Post-processing. The utterances generated by spectral clustering are unrefined and can contain small spikes and overlaps in the speech of individual speakers. Therefore, a temporal smoothing algorithm removes spikes in speech. The method is presented as Algorithm 1. It balances speaker utterances and provides a more accurate representation of speech over time.
Algorithm 1 Temporal smoothing algorithm
  • Given: any speaker speaks consecutively for a minimum of 1.0 s;
  •     for (every speaker label)
  •      if (a spike in speaker activity less than 1.0 s in duration is followed
  •        by any further speech less than 1.0 s later)
  •           the two embeddings are merged;
  •      else
  •         if (any spike in speaker activity less than 1.0 s is followed by a 1.0 s
  •           gap in speech)
  •             the spike is negated;
We found that the utterance list generated after temporal smoothing was not robust to variances in speech interaction. Therefore, we implemented a modified VB resegmentation algorithm from Pyannote’s dataset [48]. Pyannote’s resegmentation algorithm incorrectly detected m instances, where m was less than 3, as the model was trained on a minimum of three speakers. Therefore, we modified the processing portion of Pyannote’s algorithm to symmetrize predictions for the proper m. The output of resegmentation is the final result of speaker diarization.
The CNN used for speaker diarization was trained using verbal discussions in the English language. Extending the diaLogic system to accept other languages and accents likely requires the retraining of the CNN devised for speaker diarization, similar to the work discussed in [49]. The clustering of the affinity matrix might change, too. The used datasets also did not incorporate significant amounts of overlapping speech. Speaker diarization for overlapping speech was discussed in [50], among other works. High levels of background noise can be tackled using methods like the work reported in [51].

4.2. Speaker Interaction Detection

The utterances generated by speaker diarization are represented by an N × 3 array, where N is the number of utterances and 3 designates the utterance components: the speaker ID, the start time, and the end time. For every pair of speech instances within the N × 3 array, the conversation length is computed as the difference between the second end time and the first start time. The speaker is designated as the first ID and the receiver as the second ID. Each of these interactions is recorded and documented in an Interaction Graph (IG). An IG represents every speaker as a node, every interaction as an edge, and the interaction time in seconds as a weight. Figure 5 illustrates an IG. One IG is generated for every two-minute interval. A final IG is produced for the entire video.
This algorithm is a circumstantial interaction algorithm. It operates under the assumption that consecutive speech segments indicate an interaction between two people. Instances where participants interrupt each other is a common occurrence, where this algorithm falls short.

4.3. Speech Emotion Recognition

The objective of speech emotion recognition (SER) is to determine the emotions of a given speaker within a given audio segment. A traditional SER algorithm [32,33,34] was modified to integrate emotion data with the speaker-specific data from speaker diarization. SER uses a CNN to detect the seven emotions within the EMODB dataset [29]: neutral, anger, boredom, disgust, fear, happy, and sad. As explained in [33] among other tasks, CNNs are expected to automatically learn the features of speech signals, e.g., F0, energy, voice probability, etc., that distinguish the above seven emotions. No predefined model was required, in contrast to other work, like [52], which used the valence–arousal model to explicitly state a link between brain activity, the positioning of the EEG electrodes for measurement, and the features used in the XGBoost classifier for SER. In our design, the CNN-based algorithm had to be modified to be compatible with speaker diarization by featuring the same 1 s utterances over time and offer output data corresponding to the same two-minute time intervals.
An overview of SER is shown in Figure 6(left). The N × 3 array corresponding to speaker utterances is the input to the algorithm. Sequential data segmentation is performed on the individual utterances. For SER, mel spectrograms offered the highest accuracy for DVector production, as MFCCS were not efficient. We found that the optimal spectrogram features for SER are a frame width of 128 ms, a hop length of 8 ms, and 128 mel frequencies. The spectrograms for SER featured final dimensions of ( 126 , 128 ) . To increase accuracy, the contrast of every spectrogram was increased by a factor of 10,000:1. The segmented audio data were then used as prediction inputs to a four-layer CNN.
The CNN used for SER was trained on 887 random utterances corresponding to the EMODB dataset. Utterances were in the German language, recorded by ten actors (five males and five females) and expressing discrete emotions. The architecture of the CNN is displayed in Figure 6(right). Dropout and ReLU were used for this model, compared to BatchNormalization and ELU [46] for the model used within diarization. We found that for SER, normalization and activation methods beyond the standard impede the model’s ability to converge. One D vector was derived for every consecutive second of speech. Psychological properties of emotions tell us that the minimum flight-or-fight response time for emotional duration is 6 s, while the typical emotional duration is approximately 10 s [53]. Therefore, we averaged the 1 s D vectors into non-overlapping 10 s segments for each utterance generated by speaker diarization. The resulting emotion data over time were used to plot emotion vs. time charts for every 2 min interval of speech. The emotional change ( E M a x ) was based on the emotion with the maximum rate of occurrence for each speaker. The emotional change ( Δ E ) considered the number of changes in emotion for each speaker. The SER algorithm did not require spectral clustering or smoothing.

4.4. Speech-to-Text Conversion

Each detected utterance from speaker diarization is input to an online speech-to-text module to create speaker-specific text transcriptions. The OpenAI Whisper speech-to-text library [16] was utilized due to its superior accuracy over the Google API [54] and Azure API [55]. The output of this module is an N s × 2 array, where N s is the number of utterances and a value of 2 designates the data, which comprise the speaker ID and the text transcription.
For each utterance, the original speech duration was used, along with the number of words, to estimate the words-per-minute rate for each utterance. Each individual rate was then averaged to estimate the average speech rate for each speaker across the entire video. Each of these metrics was output as a CSV file for future analysis.

4.5. Speech Clause Detection

Speech clause detection uses a rule-based algorithm that utilizes CoreNLP to find the parts of speech and word dependencies [17] and pyWSD to determine the category of a word [18]. Different parts of speech represent different functions within the algorithm. The algorithm steps are described as follows: (i) The algorithm breaks down each transcription at the sentence level. (ii) Verbs are considered to be actions and marked as anchor points. For every verb in a sentence, the algorithm looks at the words around it. (iii) It considers the linguistic dependencies of each verb to determine which nouns are associated with it. Then, the algorithm uses the following rules to decide the clause type:
  • Each word is marked with the verb associated with it and whether it occurs before or after the verb. This double word tagging is used to determine the clause types.
  • Clauses correspond to each of the detected subjects: who and for who clauses correspond to the PERSON category; what clauses are represented by the ORGANIZATION and MISC categories; when clauses relate to the DATE, TIME, DURATION, and SET categories; and where clauses are represented by the LOCATION category. The first instance of words in what, where, and when clauses are recorded.
  • If a noun with the PERSON label comes before the corresponding verb in a sentence, the word is marked as a who clause.
  • If the same noun comes after the verb, the word is labeled as a for who clause.
  • How clauses are represented by words that are adverbs. Descriptor words for how clauses are recorded if they are associated with a verb, and one instance of descriptor words is recorded for each verb.
  • Why clauses are represented as the following sentence structures: Because [blank] [verb] [blank] [descriptor] is used if two nouns are associated with a verb and a descriptor is present; otherwise, Because [blank] [verb] [descriptor] is used if a descriptor is present but a second noun is not. Similarly, Because [blank] [verb] [blank] is utilized if a second noun is present but a descriptor is not. Some examples of a coherent why sentence are “Because they did programming well” and “Because I took courses sparingly”. An attempt is made to build one why clause for each verb in the original sentence.
  • Assuming the same sentence structures as for why clauses, for consequence clauses, the verb, along with the noun or descriptor in the second blank, is formed into a separate sentence. From the examples above, the consequences would be did programming and took courses, respectively. One consequence cause is built for every verb in the original sentence.
  • Sentences that do not contain verbs in a multi-sentence utterance are ignored, and the speech clauses are detected for the next sentence.
  • Utterances that do not contain text are ignored.
The rule-based approach requires that word ambiguities be accurately handled within a context. Nouns are disambiguated using adaptive lesk from pyWSD to find the meaning of the word within the sentence context, then to assign it to a category, which represents a WordNet synset [42]. Rule-based approaches also tend to be less accurate for situations not considered when devising the rule set.

4.6. Hypothesis Extraction

Figure 7 presents the hypothesis extraction algorithm. The first step identifies the events in the behavior of each team ( T i ; line (1)). Figure 2c illustrates a sequence of events and the linear time segments between two consecutive events for the same team. In line (2), set S E is the set of linear time segments for team T i , and set A l l E is the set of all linear time segments in the considered dataset (line (3)). Events are found by identifying significant differences for sets { C } , { E } , { U } , { M } , and { D i f f } , as presented in Section 3.2. The clauses and concepts in set { C } are obtained using the speech clause detection algorithm. Sets { E } , { U } , and { M } are computed using the methods for speaker interaction detection, speech emotion recognition, and speech characteristics, like the frequency of responses, words-per-minute rate, and length of responses. Then, in line (4), the algorithm calculates Equations (1) (line (5)) and (2) (line (6)) for all pairs of linear time segments ( l s i and l s j ) in set A l l E and stores the results either in sets e q 1 S and e q 2 S if time segments l i and l j correspond to the same team ( T i ) (lines (7)–(9)) or in sets e q 1 A l l and e q 2 A l l if the linear time segments are for different teams (lines (10)–(12)). Lines (13)–(15) aggregate equations (1) (variables e q 1 S and e q 1 A l l ) and (2) (variables e q 2 S and e q 2 A l l ) so that similar equations expressed for consecutive linear time segments are clustered together. These steps find the largest time segments of the two equations corresponding to the same team ( T i ) (lines (13)–(14)) or different teams (line (15)). In lines (16)–(18), sets e q 1 S and e q 2 S are used to extract hypotheses for a certain team, while sets e q 1 A l l and e q 2 A l l are utilized to extract hypotheses for all teams. For each cluster, line (17) aggregates the ranges over which the parameters in Equations (1) and (2) can be joined for dissimilar values that condition the two equations. For example, let us assume that equations expressed as Δ I G Δ E | S i m ( { C } ) and Δ I G Δ E | S i m ( { U } ) are part of a cluster. Then, under aggregation, Δ I G Δ E | S i m ( { C } ) S i m ( { U } ) . This step finds the maximal conditions under which an equation holds. The generated hypothesis is a statement of these expressions (line (18)).

5. Experimental Results

In addition to public databases, the diaLogic system was experimentally tested using the following three datasets: Dataset 1 with 118 audio recordings is a dataset of undergraduate student study sessions on computer programming assignments. Sessions were not timed. Teams had three or four participants. Dataset 2, with 300 audio recordings, is a dataset of participants interacting in timed experiments. The dataset features 150 groups of 5 participants. Teams interacted for 30 or 60 min. Groups spoke about the legal and social implications of starting a business. Dataset 3, with 46 audio recordings, is a dataset of undergraduate students in timed 20 min experiments. Teams of three or four participants discussed how to complete a specific computer programming assignment. Participants were randomly sorted into teams. Male and female participants were present in all datasets.
With the three datasets, the experiments reported in this work considered a sample of 24 audio recordings—20 recordings with five participants and 4 recordings with three participants. A total of 11 teams were present in this set. Results from the first 10 teams of five participants were labeled as G x y z T k , where the x y z label is the group identifier and the k label is 1 or 2, denoting the first or the second recording for a group, respectively. Each recording is more than 30 min long. The four recordings of the 11th team with three participants were up to 6 min long.

5.1. Performance Data

The training times of the primary NN models used for speaker diarization and speech emotion recognition (SER) are shown in Table 1. A system with an Intel Core i7-9750H, NVIDIA RTX 3090 24 GB Desktop GPU, and 64 GB RAM was used. The diarization model was trained on the GPU, while the model for SER was trained on the CPU. These times do not include the duration required to form the training datasets. The speaker diarization model requires all samples for 7205 speakers to converge, and the SER model requires 887 samples per 7 emotions to converge. Overall, the accuracy previously stated for each of these models justifies the required training time.
The execution time of each stage of speaker diarization is outlined in Table 2. The machine used in this study was based on an Intel Core i7-12700H, NVIDIA RTX 3090 24 GB Desktop GPU, and 64 GB RAM. In total, 15 videos were tested, ranging from 30 min to an hour in length. Data segmentation and temporal smoothing were computationally complex due to the large amount of segment processing. The CNN prediction execution time was linearly proportional to the amount of segmented data. Spectral clustering was the least computationally complex, as the number of segments was less than the number of embeddings. The resegmentation execution time was linearly proportional to the length of the video.

5.2. Speaker Diarization

Figure 8 presents samples of the speaker diarization output, showing the speech contributions of the four participants over time. Participants 1 and 2 spoke the most during time segment 1, followed by participants 3 and 4. During time segment 2, participant 4 contributed the most, followed by participants 1 and 3. During time segment 3, there was not any speech. During time segment 4, participant 3 spoke the most, followed by participants 4 and 1. Participant 5 did not speak during this time segment. Similar diarization outputs were generated for all teams in the experimental dataset.
The accuracy of the diaLogic algorithm was evaluated on the CABank CALLHOME dataset [56]. This dataset includes phone conversations between two speakers. We procured an evaluation set of 40 audio files from the dataset of 176 samples, featuring 20 audio recordings of female speakers and 20 audio recordings of male speakers within the age range of 13–76. We utilized pyannote.metrics [57] to compute the diarization error rate (DER) for the audio files. The results are shown in Table 3 and Figure 9. The average DER of the diaLogic algorithm was 15.5%, with an average of 9.2% contributing to the confusion metric. Of the 40 files, 31 feature a DER of less than 20%, 6 files feature a DER in the 20–30% range, 1 in the 30–40% range, 1 in the 40–50% range, and 1 in the 50%+ range. The average DER of diaLogic is 14.5% lower than the 30% DER reported by Pyannote’s algorithm [44].

5.3. Speaker Interaction Graph Generation

Interaction graphs (IGs) offer a different facet of speaker participation and interactions than speech diarization charts. They highlight self-organization situations of the team interactions, like participant clustering, dominant members, and outliers. This information is useful for hypothesis extraction to describe any invariants of the team interactions.
Figure 10 illustrates the IGs for the first two minutes of the recordings for four teams. The interaction duration between the speakers in all four recordings was unbalanced. Only four participants interacted in team G7T1. In teams G7T2, G8T1, and G8T2, the interactions existed in a web of all five speakers.
The computational complexity of the algorithm required to generate interaction graphs (IGs) is linearly proportional to the number of utterances detected by speaker diarization. This algorithm executes within tens of seconds. Therefore, it has a negligible effect on the overall execution time of the system.
Table 4 summarizes the performance of speaker interaction detection—specifically, the frequency of interruptions between speakers. The table columns indicate the measured number of interactions, the measured number of interruptions, the measured number of adjacent (consecutive) interruptions, and the percentage adjustments of the two latter values, if only the conversation flow interruptions were considered. Results are shown for three videos. As expected, interruptions can lead to interaction characterization errors. The percentages of interruptions in each of the three videos were 12%, 17%, and 25%. However, interruptions only affected the algorithm’s performance if they disrupted the normal conversation flow of the video. By adjusting our metric to include only those interruptions, the percentage of interruptions for each video were reduced to 6%, 12%, and 21%, respectively. It is also important to note that the majority of the adjusted interruptions occurred within short bursts of interactions, in which speakers interjected and spoke very frequently within a short amount of time. Hence, these interruptions did not significantly contribute to the topic of conversation.

5.4. Speaker Emotion Recognition

The CNN used for SER was trained on 887 random utterances corresponding to seven emotions within the EMODB dataset [29]: neutral, anger, boredom, disgust, fear, happy, and sad. This CNN yielded a test accuracy of 93.8%. This accuracy is similar to the accuracy reported by related work for the EMODB database, like 90% for the CNN reported in [32], 89% in [33], and 86% in [34]. For another dataset, ref. [52] reported 93% accuracy for valence and 97% for arousal.
Team G4T1 presented a changing emotional dynamic, as depicted in Figure 11. All participants started out with the E m a x value for boredom. In the following intervals, participants alternated from E m a x for boredom to sad and happy. Sad represents the second most frequent E m a x , and happy represents the third most frequent E m a x .
The execution time of each stage of the speaker emotion recognition (SER) process is outlined in Table 5 for the first four two-minute segments of speech within each recording. Experiments used a machine with an Intel Core i7-12700H, NVIDIA RTX 3090 24 GB Desktop GPU, and 64 GB RAM. The algorithm was run on the same 15 recordings as those used to evaluate speaker diarization. The data segmentation and data concatenation stages are the least computationally complex and are executed within tens of seconds. The CNN prediction stage is linearly proportional to the amount of segmented data. However, the computational cost is more than the execution time of the prediction stage within the previous module, as each segment is one second.

5.5. Speech-to-Text Conversion and Words-per-Minute Estimation

We ran the Whisper speech-to-text algorithm [16] on a desktop NVIDIA RTX 3090 GPU with 24 GB of VRAM. The algorithm had the highest cost in terms of the total execution time of the diaLogic system, except the CNN training time. All five participants in teams G2T1 and G3T1, for example, had a words-per-minute (WPM) rate in the 142–203 range. Two participants from team G2T1 and one participant from team T3T1 were in the lower half of the range. Thus, it can be inferred that the participants of both teams were similarly engaged in their discussions, as the majority of the participants featured WPM rates in the 180–203 range. However, these results do not represent interactions as a whole; they are only a facet of a specific participant’s performance.

5.6. Speech Clause Detection

The computational complexity of the speech clause detection algorithm is directly proportional to the number of sentences in the entire set of detected speech from the speech-to-text algorithm. The most costly components of this algorithm are the repeated calls to CoreNLP and pyWSD, both of which have cloud components. The execution time of this algorithm is in the single-minute range.
Table 6 summarizes the accuracy of the clause detection algorithm for the first 50 speech clause results from four recordings of four teams: G7T1, G8T1, G9T1, and G10T1. Column 3 indicates the number of sentences with ambiguity errors for the first 50 speech clauses in the four recordings, and column 4 presents the corresponding percentages. As shown in column 4, the percentages of ambiguity errors were 14%, 20%, 24%, and 16%. Column 5 presents the number of sentences with algorithm errors, and column 6 enumerates the related percentages. Column 6 indicates that the percentages of algorithm errors were 16%, 10%, 12%, and 16%. Results showed that the detection accuracy of the algorithm, as a whole, was balanced by ambiguity, and the algorithm itself had an adequate accuracy.
The rule-based approach has some limitations, as not all detected words are of the correct type. For example, in the sentence, So I wonder how they decide about what the legal loophole there is., the algorithm detects the So at the beginning of the sentence as How. In many cases, the sentences forming why and consequence clauses are rationally formed, but the incorrect descriptor words throw off the meaning of the sentences. Still, the results were accurate enough to generate hypotheses regarding speaker behavior.
The most common anomalies were ambiguity resolution errors in CoreNLP and PyWSD and errors in the main algorithm. The most common ambiguity errors occur within part of speech detection, where a specific word is not correctly determined to be a noun, verb, adjective, or adverb. Furthermore, nouns that correspond to the PERSON, ORGANIZATION, MISC, DATE, TIME, DURATION, SET, and LOCATION categories are not detected as such or are mislabeled. The most common algorithm errors occurred when a noun in the context of for who was missing or an entity represented as what, when, or where was also missing. The algorithm also commonly detected so as a how clause, often with incorrect context. However, the algorithm detected multiple-word clauses with significant accuracy.

5.7. Team Behavior Hypothesis Extraction

This subsection discusses three extracted hypotheses.
1. The link between a team’s cognitive outputs and its interactions: This example illustrates hypothesis extraction to connect the cognitive and interaction attributes of a team. Figure 12 refers to a CPS case that involves two teams that solved a problem involving the identification of a new business opportunity. The analysis considered how the nature of the ideas and the concepts discussed by the participants of a team depend on the team’s interaction. The figure shows two consecutive events for each team: events i and i + 1 for Team i and events j and j + 1 for Team j. It also illustrates the network of concepts [41] for each event, e.g., the concepts mentioned during the linear time segment that ended at that event. For example, team i referred to twenty-two concepts during that linear segment, like bureaucracy, government, branch, federal, state, complications, and so on. The degree of relatedness between concepts is shown by the arcs connecting the concepts, like the arcs between concepts of government, federal, congress, and state.
The nature of the network indicates the breadth (diversity) of the concepts and the depth of the discussion, i.e., details. Equations (1) and (2) suggest that there is a similarity between events i and j, as their concept networks shows similar breadths. However, the network for event j has a shallower depth, as it includes only sixteen concepts. Events i + 1 and j + 1 are similar both breadth- and depth-wise, as they have nine and eight concepts, respectively. The IGs show similar interactions in the two teams: one member (the central, yellow bubble) has strong ties with all members, while the others interact less with each other. Therefore, the following hypothesis based on Equation (1) was extracted for this example:
S i m ( B r N i , B r N j ) S i m ( B r N i + 1 , B r N j + 1 ) S i m ( D e N i + 1 , D e N j + 1 ) | S i m ( I G i , i + 1 , I G j , j + 1 )
The hypothesis states that for concept networks with similar breadths ( B r ), similar breadths and depths ( D e ) are expected if the two teams also have similar interactions (i.e., I G s).
The following hypothesis based on Equation (2) was also extracted for this example:
D S i m ( D e N i , D e N j ) | S i m ( B r N i , B r N j ) S i m ( I G i , i + 1 , I G j , j + 1 )
The hypothesis states that the dissimilarity of the two concept network depths does not create dissimilarities (denoted as ⊥) for events i + 1 and j + 1 if the teams had an initially similar breadth of their concept networks and used similar interaction patterns (e.g., I G s ).
The two hypotheses must be experimentally validated.
2. The link between the changes in social interactions and emotions. This experiment used the diaLogic system to extract the hypothesis stating that a change in the interactions between team members (expressed as Δ I G ) results in a change in the member’s emotions ( Δ E ). The members making the greatest contributions to Δ I G (hence, the most social interaction) are expected to show the greatest Δ E .
The hypothesis was extracted for two cases: teams with constant and variable structures.
Constant team structure. Figure 13 displays the interaction dynamics for the first recording. Participants 1 and 2 had the greatest Δ I G for the entire duration. Participant 2 showed the lowest Δ I G . For the entire duration of the second recording, participants 1 and 2 exhibited the greatest Δ E , while participant 3 had the lowest Δ E .
Variable team structure. The interaction behavior for the first recording with a variable dynamic is shown in Figure 14. The dynamic shifts from period T 1 (minutes 0–2) to period T 2 (minutes 2–4). Participants 1 and 3 had the greatest Δ I G during T 1 . Participants 1 and 2 had the greatest Δ I G during T 2 . Participant 1 had the lowest Δ E during T 1 , and participant 3 had the lowest Δ E during T 2 . For the second recording, participants 1 and 3 had the greatest Δ I G during the two periods. Participants 2 and 3 had the lowest Δ E for T 1 , and participants 1 and 2 had the lowest Δ E for T 2 . Hence, the hypothesis held for the majority of the cases in the four videos but was not verified for the second time interval of this situation.
3. The link between emotional valence and emotional dynamics. Emotional valence is a qualitative property of emotions. Emotions with a positive valance are positive emotions, such as happy. Zero valance describes neutral emotions, like neutral, and boredom. Emotions with a negative valance are negative, such as disgust, fear, and sad. A change in valence for a single participant was hypothesized to be influenced by the valences of other participants. The emotional valence contributions of all participants result in an either constant or changing team emotional dynamic.
The above hypothesis was extracted for two teams with the same four participants and a fifth participant swapped between the two teams. Figure 15 presents the emotional dynamic for recording G4T2. Participant 1 started out with happiness, participants 2 and 3 with boredom, participant 4 with anger, and participant 5 with disgust. In the second time interval, all participants except participants 2 and 3 changed to a different max ( E m a x ) of negative valence. In the third time interval, participant 3 changed to sad. In the fourth time interval, participants 2 through 4 returned to boredom, while participant 1 retained sad since the second time interval.
The extracted hypothesis suggested that the levels of emotional interactions in the team were correlated, as negative emotions present within one time interval were inherited by other participants in future intervals. This suggests the existence of an emotional coupling between participants.

6. Conclusions

This paper presents diaLogic, a humans-in-the-loop system to model team behavior during collective problem solving. It performs automated multi-modal data acquisition and processing to extract hypotheses about team behavior. Cognitive, social, and emotional characteristics are identified based on speech within social settings involving teams. The core algorithm is a speaker diarization algorithm from which all subsequent data are computed, like speaker emotions, speaker interactions, speech-to-text conversion, and speech clauses. A rule-based algorithm identifies the types of clauses in the responses, e.g., what, who, for who, when, how, where, why, and consequence clauses.
Experiments show that data acquisition accuracy is enough to support qualitative interpretation of team behavior. The processing of a recording takes a few tens of minutes. The average characterization errors of the automated method are about 15% for speaker diarization and between 10 and 16% for speech clause detection. Speaker interaction errors were introduced mainly by speech interruptions but were not considered significant, as the relevant interruptions were between 6 and 21% in the discussions. It offers higher accuracy when processing normal conversations rather than conversations within a specialized context. As shown by experiments, the proposed method automates interaction characterization and, thus, reduces the time and effort required for analysis. Manual analysis of experimental data is very tedious and, while accurate, might take human raters months to complete (depending on the dataset). The diaLogic system can be utilized in a broad range of applications, from education to team research and therapy, to extract hypotheses that link cognitive, social, and emotional characteristics of a team to its performance. After validating the hypotheses through experiments, the obtained insights can be used to improve team interactions and results.
Future work will focus on expanding the amount of data and hypotheses drawn from the core algorithms. Future data classification methods will use sarcasm, irony, enthusiasm, and confidence. To build these classifiers, new voice databases need to be created based on two considerations. First, the databases must contain clean audio data. Second, the databases must feature accurate representations of speech properties. Finally, the analysis approach proposed by the diaLogic system could be used to provide real-time feedback to a team operating in high-stakes, time-critical situations, like critical incidents and emergency rooms, as well as for firefighters, military applications, and so on. However, such applications require significantly faster algorithms for speaker diarization and emotion recognition that can execute in the range of minutes—especially for speech-to-text conversion, which is slow due to its cloud-based services.

Author Contributions

Conceptualization, R.D. and A.D.; methodology, R.D. and A.D.; software, R.D.; validation, R.D.; investigation, R.D. and A.D.; data curation, R.D.; writing—original draft preparation, R.D. and A.D.; supervision, A.D. All authors have read and agreed to the published version of the manuscript.

Funding

This research received no external funding.

Institutional Review Board Statement

In addition to public domain data, we used data that we collected using the approval received on 21 April 2023 from the Office of Research Compliance of Stony Brook University, IRB ID: IRB2023-00167.

Informed Consent Statement

Informed consent for participation was obtained from all subjects involved in the study.

Data Availability Statement

The raw data supporting the conclusions of this article will be made available by the authors on request.

Conflicts of Interest

The authors declare no conflicts of interest.

References

  1. Wu, X.; Xiao, L.; Sun, Y.; Zhang, J.; Ma, T.; He, L. A Survey of Human-in-the-Loop for Machine Learning. Future Gener. Comput. Syst. 2022, 135, 364–381. [Google Scholar] [CrossRef]
  2. Hong, J.; Hong, Y.-G.; de Foy, X.; Kovatsch, M.; Schooler, E.; Kutscher, D. Internet of Things (IoT) Edge Challenges and Functions. Internet Research Task Force (IRTF) 2024, RFC: 556, April.
  3. Tehrani, B.M.; Wang, J.; Wang, C. Review of Human-in-the-Loop Cyber-Physical Systems (HiLCPS): The Current Status from Human Perspective. In Proceedings of the ASCE International Conference on Computing in Civil Engineering, Atlanta, GA, USA, 17–19 June 2019; pp. 470–478. [Google Scholar]
  4. Doboli, A.; Doboli, S. A Novel Agent-based, Evolutionary Model for Expressing the Dynamics of Creative Open-Problem Solving in Small Groups. Appl. Intell. 2021, 51, 2094–2127. [Google Scholar] [CrossRef]
  5. Cutler, R.; Davis, L. Look Who’s Talking: Speaker Detection Using Video and Audio Correlation. In Proceedings of the IEEE International Conference on Multimedia and Expo., New York, NY, USA, 30 July–2 August 2000; Volume 3, pp. 1589–1592. [Google Scholar]
  6. Kumar, M.; Kim, S.H.; Lord, C.; Narayanan, S. Improving Speaker Diarization for Naturalistic Child-Adult Conversational Interactions Using Contextual Information. J. Acoust. Soc. Am. 2020, 147, EL196. [Google Scholar] [CrossRef] [PubMed]
  7. Cabrera, A.; Cabrera, E. Knowledge-sharing dilemmas. Organ. Stud. 2002, 23, 687–710. [Google Scholar] [CrossRef]
  8. Fischbacher, U.; Gachter, S.; Fehr, E. Are People Conditionally Cooperative? Evidence from a Public Goods Experiment. Econ. Lett. 2001, 71, 397–404. [Google Scholar] [CrossRef]
  9. Edmondson, A. Psychological safety and learning behavior in work teams. Adm. Sci. Q. 1999, 44, 350–383. [Google Scholar] [CrossRef]
  10. Edmondson, A.; Kramer, R.; Cook, K. Psychological Safety, Trust, and Learning in Organizations: A Group-level Lens. Trust. Distrust Organ. Dilemmas Approaches 2004, 12, 239–272. [Google Scholar]
  11. Duke, R.; Doboli, A. diaLogic: Interaction-Focused Speaker Diarization. In Proceedings of the IEEE International Systems Conference (SysCon), Vancouver, BC, Canada, 15 April–15 May 2021; pp. 1–8. [Google Scholar]
  12. Duke, R.; Doboli, A. diaLogic: Non-Invasive Speaker-Focused Data Acquisition for Team Behavior Modeling. arXiv 2022, arXiv:2209.00619. [Google Scholar]
  13. Fauconnier, G.; Turner, T. The Way We Think: Conceptual Blending and the Mind’s Hidden Complexities; Basic Books: New York, NY, USA, 2002. [Google Scholar]
  14. Doboli, A.; Curiac, D.-I. Studying Consensus and Disagreement during Problem Solving in Teams through Learning and Response Generation Agents Model. Mathematics 2023, 11, 2602. [Google Scholar] [CrossRef]
  15. Duke, R.; Doboli, A. Applications of diaLogic System in Individual and Team-based Problem-Solving Applications. In Proceedings of the IEEE International Symposium on Smart Electronic Systems (iSES), Warangal, India, 18–22 December 2022; pp. 706–711. [Google Scholar]
  16. Radford, A.; Kim, J.W.; Xu, T.; Brockman, G.; McLeavey, C.; Sutskever, I. Robust Speech Recognition via Large-Scale Weak Supervision. arXiv 2022, arXiv:2212.04356. [Google Scholar]
  17. Manning, C.; Surdeanu, M.; Bauer, J.; Finkel, J.; Bethard, S.; McClosky, D. The Stanford CoreNLP Natural Language Processing Toolkit. In Proceedings of the 52nd Annual Meeting of the Association for Computational Linguistics: System Demonstrations, Baltimore, MD, USA, 23–24 June 2014; pp. 55–60. [Google Scholar]
  18. Tan, L. Pywsd: Python Implementations of Word Sense Disambiguation (WSD) Technologies [software]. 2014. Available online: https://github.com/alvations/pywsd (accessed on 9 March 2025).
  19. Jurafsky, D.; Martin, J. Speech and Language Processing; Pearson Prentice Hall: Old Bridge, NJ, USA, 2009. [Google Scholar]
  20. Park, T.J.; Kanda, N.; Dimitriadis, D.; Han, K.J.; Watanabe, S.; Narayanan, S. A Review of Speaker Diarization: Recent Advances with Deep Learning. Comput. Speech Lang. 2022, 72, 101317. [Google Scholar] [CrossRef]
  21. Sun, L.; Du, J.; Jiang, C.; Zhang, X.; He, S.; Yin, B.; Lee, C.-H. Speaker Diarization with Enhancing Speech for the First DIHARD Challenge. In Proceedings of the INTERSPEECH, Hyderabad, India, 2–6 September 2018; pp. 2793–2797. [Google Scholar]
  22. Cyrta, P.; Trzcinski, T.; Stokowiec, W. Speaker Diarization using Deep Recurrent Convolutional Neural Networks for Speaker Embeddings. In Advances in Intelligent Systems and Computing; Springer: Cham, Switzerland, 2017; pp. 107–117. [Google Scholar]
  23. Aronowitz, H.; Zhu, W.; Suzuki, M.; Kurata, G.; Hoory, R. New Advances in Speaker Diarization. In Proceedings of the INTERSPEECH, Shanghai, China, 25–29 October 2020; pp. 279–283. [Google Scholar]
  24. Siracusa, M.; Fisher, J. Dynamic Dependency Tests for Audio-Visual Speaker Association. In Proceedings of the IEEE International Conference on Acoustics, Speech and Signal Processing (ICASSP), Honolulu, HI, USA, 16–20 April 2007; pp. 457–460. [Google Scholar]
  25. Capozzi, F.; Beyan, C.; Pierro, A.; Koul, A.; Murino, V.; Livi, S.; Bayliss, A.; Ristic, J.; Becchio, C. Tracking the Leader: Gaze Behavior in Group Interactions. iScience 2019, 16, 242–249. [Google Scholar] [CrossRef] [PubMed]
  26. Pierro, A.; Mannetti, L.; De Grada, E.; Livi, S.; Kruglanski, A.W. Autocracy Bias in Informal Groups under Need for closure. Personal. Soc. Psychol. Bull. 2003, 29, 405–417. [Google Scholar] [CrossRef]
  27. Risko, E.F.; Richardson, D.C.; Kingstone, A. Breaking the Fourth Wall of Cognitive Science: Real-World Social Attention and the Dual Function of Gaze. Curr. Dir. Psychol. Sci. 2016, 25, 70–74. [Google Scholar] [CrossRef]
  28. Wang, W.; Yaman, S.; Precoda, K.; Richey, C. Automatic Identification of Speaker Role and Agreement/Disagreement in Broadcast Conversation. In Proceedings of the IEEE International Conference on Acoustics, Speech and Signal Processing (ICASSP), Prague, Czech Republic, 22–27 May 2011; pp. 5556–5559. [Google Scholar]
  29. Burkhardt, F.; Paeschke, A.; Rolfes, M.; Sendlmeier, W.; Weiss, B. A Database of German Emotional Speech. In Proceedings of the INTERSPEECH, Lisbon, Portugal, 4–8 September 2005. [Google Scholar] [CrossRef]
  30. Semwal, N.; Kumar, A.; Narayanan, S. Automatic Speech Emotion Detection System using Multi-Domain Acoustic Feature Selection and Classification Models. In Proceedings of the IEEE International Conference on Identity, Security and Behavior Analysis (ISBA), New Delhi, India, 22–24 February 2017; pp. 1–6. [Google Scholar]
  31. Kanth, N.R.; Saraswathi, S. Efficient Speech Emotion Recognition Using Binary Support Vector Machines & Multiclass SVM. In Proceedings of the IEEE International Conference on Computational Intelligence and Computing Research, Madurai, India, 10–12 December 2015; pp. 1–6. [Google Scholar]
  32. Sun, T.-W. End-to-End Speech Emotion Recognition With Gender Information. IEEE Access 2020, 8, 152423–152438. [Google Scholar] [CrossRef]
  33. Zhong, S.; Yu, B.; Zhang, H. Exploration of an Independent Training Framework for Speech Emotion Recognition. IEEE Access 2020, 8, 222533–222543. [Google Scholar] [CrossRef]
  34. Suganya, S.; Charles, E. Speech Emotion Recognition Using Deep Learning on Audio Recordings. In Proceedings of the International Conference on Advances in ICT for Emerging Regions, Colombo, Sri Lanka, 3–4 September 2019; pp. 1–6. [Google Scholar]
  35. Del Corro, L.; Gemulla, R. ClausIE: Clause-Based Open Information Extraction. In Proceedings of the International Conference World Wide Web, Rio de Janeiro, Brazil, 13–17 May 2013; pp. 355–366. [Google Scholar]
  36. Chen, X.; Alexopoulou, T.; Tsimpli, I. Automatic Extraction of Subordinate Clauses and Its Application in Second Language Acquisition Research. Behav. Res. Methods 2022, 53, 803–817. [Google Scholar] [CrossRef]
  37. Gagnon, M.; Sylva, L. Text Summarization by Sentence Extraction and Syntactic Pruning. In Proceedings of the Computational Linguistics in the North East, Storrs, CT, USA, 22–24 October 2004; Available online: https://api.semanticscholar.org/CorpusID:58920425 (accessed on 9 March 2025).
  38. Heilman, M.; Smith, N. Extracting Simplified Statements for Factual Question Generation. In Proceedings of the Third Workshop on Question Generation, Tenth International Conference on Intelligent Tutoring Systems, Pittsburgh, PA, USA, 18 June 2010; Available online: https://api.semanticscholar.org/CorpusID:2123424 (accessed on 9 March 2025).
  39. Atabuzzaman, M.; Shajalal, M.; Ahmed, M.E.; Afjal, M.I.; Aono, M. Leveraging Grammatical Roles for Measuring Semantic Similarity Between Texts. IEEE Access 2021, 9, 62972–62983. [Google Scholar] [CrossRef]
  40. Dornescu, I.; Evans, R.; Orasan, C. Relative Clause Extraction for Syntactic Simplification. In Proceedings of the Workshop on Automatic Text Simplification—Methods and Applications in the Multilingual Society, Dublin, Ireland, 24 August 2014; pp. 1–10. [Google Scholar]
  41. Doboli, A.; Umbarkar, A.; Doboli, S.; Betz, J. Modeling Semantic Knowledge Structures for Creative Problem Solving: Studies on Expressing Concepts, Categories, Associations, Goals and Context. Knowl.-Based Syst. 2015, 78, 34–50. [Google Scholar] [CrossRef]
  42. Fellbaum, C. WordNet and Wordnets. In Encyclopedia of Language and Linguistics, 2nd ed.; Brown, K., Ed.; Elsevier: Oxford, UK, 2005; pp. 665–670. [Google Scholar]
  43. Ravanelli, M.; Parcollet, T.; Plantinga, P.; Rouhe, A.; Cornell, S.; Lugosch, L.; Subakan, C.; Dawalatabad, N.; Heba, A.; Zhong, J.; et al. SpeechBrain: A General-Purpose Speech Toolkit. arXiv 2021, arXiv:2106.04624. [Google Scholar]
  44. Bredin, H.; Yin, R.; Coria, J.; Gelly, G.; Korshunov, P.; Lavechin, M.; Fustes, D.; Titeux, H.; Bouaziz, W.; Gill, M. pyannote.audio: Neural Building Blocks for Speaker Diarization. In Proceedings of the IEEE International Conference on Acoustics, Speech, and Signal Processing, Barcelona, Spain, 4–8 May 2020; pp. 7124–7128. [Google Scholar]
  45. webrtc/common_audio/vad-external/webrtc. Available online: https://chromium.googlesource.com/external/webrtc/stable/src/+/b34066b0ebe4a9adc6df603090afdf6a2b2a986b/common_audio/vad/vad_core.h (accessed on 9 March 2025).
  46. Clevert, D.-A.; Unterthiner, T.; Hochreiter, S. Fast and Accurate Deep Network Learning by Exponential Linear Units (ELUs). arXiv 2016, arXiv:1511.07289. [Google Scholar]
  47. Xia, W.; Lu, H.; Wang, Q.; Tripathi, A.; Huang, Y.; Lopez Moreno, I.; Sak, H. Turn-to-Diarize: Online Speaker Diarization Constrained by Transformer Transducer Speaker Turn Detection. arXiv 2022, arXiv:2109.11641. [Google Scholar]
  48. Bredin, H.; Laurent, A. End-to-end Speaker Segmentation for Overlap-aware Resegmentation. In Proceedings of the Interspeech, Annual Conference of the International Speech Communication Association, Brno, Czech Republic, 30 August–3 September 2021; Available online: https://api.semanticscholar.org/CorpusID:233204561 (accessed on 9 March 2025).
  49. Lyu, K.; Lyu, R.; Chang, H. Real-time Multilingual Speech Recognition and Speaker Diarization System based on Whisper Segmentation. PeerJ Comput. Sci. 2024, 10, e1973. [Google Scholar] [CrossRef] [PubMed]
  50. Yella, S.; Valente, F. Speaker diarization of overlapping speech based on silence distribution in meeting recordings. In Proceedings of the Interspeech, Portland, OR, USA, 9–13 September 2012; pp. 490–493. [Google Scholar]
  51. Le Prell, C.; Clavier, O. Effects of noise on speech recognition: Challenges for communication by service members. Hear. Res. 2017, 349, 76–89. [Google Scholar] [CrossRef] [PubMed]
  52. Castiblanco Jimenez, I.A.; Olivetti, E.C.; Vezzetti, E.; Moos, S.; Celeghin, A.; Marcolin, F. Effective Affective EEG-based Indicators in Emotion-Evoking VR Environments: An Evidence from Machine Learning. Neural Comput. Applic. 2024, 36, 22245–22263. [Google Scholar] [CrossRef]
  53. Valenza, G.; Citi, L.; Lanata, A.; Scilingo, E.P.; Barbieri, R. Revealing Real-Time Emotional Responses: A Personalized Assessment based on Heartbeat Dynamics. Sci. Rep. 2014, 4, 4998. [Google Scholar] [CrossRef]
  54. Google. Speech-to-Text: Automatic Speech Recognition|Google Cloud. Available online: https://cloud.google.com/speech-to-text (accessed on 2 May 2022).
  55. Microsoft Azure. Speech to Text Audio to Text Translation|Microsoft Azure. Available online: https://azure.microsoft.com/en-us/services/cognitive-services/speech-to-text/#overview (accessed on 2 May 2022).
  56. CABank English CallHome Corpus. Cabank English Callhome Corpus. Available online: https://ca.talkbank.org/access/CallHome/eng.html (accessed on 9 March 2025).
  57. Bredin, H. pyannote.metrics: A Toolkit for Reproducible Evaluation, Diagnostic, and Error Analysis of Speaker Diarization Systems. In Proceedings of the Interspeech, Annual Conference of the International Speech Communication Association, Stockholm, Sweden, 20–24 August 2017; pp. 3587–3591. [Google Scholar]
Figure 1. (a) Overview of the agent model assumed by the diaLogic system; (b) the five sets that describe the observable behavior of agents: set { C } of the responses produced over a time window, set { E } of emotions, set { U } of the observed urgency in creating responses, set { M } of the observed motivation, and set { D i f f } of the differences between new and previous responses; (c) modeling team behavior using linear time segments.
Mti 09 00026 g001
Figure 2. Hypothesis extraction principle: Invariant situations describe the similarities of the five observable sets, and differentiated situations refer to the dissimilarities of the five sets.
Mti 09 00026 g002
Figure 3. Structure of diaLogic system. The system includes the following components: speaker diarization, speaker interaction detection, speech emotion recognition, speech-to-text conversion, speech clauses detection, and hypothesis extraction.
Mti 09 00026 g003
Figure 4. Speaker diarization procedure (left) and ECAPA–Time Delay Neural Network (ECAPA-TDNN) with exponential linear units (ELUs) for speaker diarization (right).
Mti 09 00026 g004
Figure 5. Interaction graph to describe speaker interaction. Each node represents a team member (participant), the edge describes the interaction between the corresponding participants, and the edge label indicates the interaction time. The edge color encodes the total conversation time between two participants.
Mti 09 00026 g005
Figure 6. Speech emotion recognition procedure (left) and speech emotion recognition CNN structure (right).
Mti 09 00026 g006
Figure 7. Hypothesis extraction algorithm.
Mti 09 00026 g007
Figure 8. Speaker diarization outputs for the four participants of a team: Time: Minutes 0–2 (top left); Time: Minutes 2–4 (top right); Time: Minutes 4–6 (bottom left); Time: Minutes 6-8 (bottom right).
Mti 09 00026 g008
Figure 9. Diarization error rate (DER) across the 40 CALLHOME audio files.
Mti 09 00026 g009
Figure 10. Four Interaction Graphs for the first 2 min in recordings for team G7T1 (top left), team G7T2 (top right), team G8T1 (bottom left), and team G8T2 (bottom right).
Mti 09 00026 g010
Figure 11. The emotion trends for team G4T1 during minutes 0–8: Time: minutes 0–2 (top left); Time: minutes 2–4 (top right); Time: minutes 4–6 (bottom left); Time: minutes 6–8 (bottom right).
Mti 09 00026 g011
Figure 12. Hypothesis extraction on the connections between the depth and breadth of the cognitive network for a team’s outputs and its interactions.
Mti 09 00026 g012
Figure 13. The link between the changes in social interactions and emotions for a constant team structure. Participant interactions: minutes 0–2 (top left); Participant interactions: minutes 2–4 (top right); Participant emotions: minutes 0–2 (bottom left); Participant emotions: minutes 2–4 (bottom right).
Mti 09 00026 g013
Figure 14. The link between the changes in social interactions and emotions for a variable team structure: Participant interactions: minutes 0–2 (top left); Participant interactions: minutes 2–4 (top right); Participant emotions: minutes 0–2 (bottom left); Participant emotions: minutes 2–4 (bottom right).
Mti 09 00026 g014
Figure 15. The link between emotional valence and emotional dynamics for recording G4T2: Time: minutes 0–2 (top left); Time: minutes 2–4 (top right); Time: minutes 4–6 (bottom left); Time: minutes 6–8 (bottom right).
Mti 09 00026 g015
Table 1. Training times of the primary neural network models using an Intel Core i7-9750H, NVIDIA RTX 3090 24 GB Desktop GPU, and 64 GB RAM.
Neural Network ModelTraining Time (h:mm:ss)
Speaker Diarization6 days 11 h
SER5:01:08
Table 2. Average execution time of speaker diarization stages for 15 files using an Intel Core i7-12700H, Nvidia RTX 3090 24 GB Desktop GPU, and 64 GB RAM.
Data Segmentation
(h:mm:ss)
CNN Predictions
(h:mm:ss)
Spectral Clustering
(h:mm:ss)
Temporal Smoothing
(h:mm:ss)
Resegmentation
0:02:540:03:360:00:080:00:010:02:29
Table 3. Average diarization error rate (DER) metrics across the 40 CALLHOME audio files.
Correct (%)Conf. (%)Missed (%)FA (%)DER (%)
88.09.22.83.515.5
Table 4. Interruption frequency analysis of interaction characterization.
Video# Int.# Inter.# Adj. Inter.Inter. (%)Adj. Inter. (%)
G2 T12072614126
G6 T115728201712
G110 T220852442521
Table 5. Average execution time of speaker emotionrecognition (SER) stages for 15 files using an Intel Core i7-12700H, NVIDIA RTX 3090 24 GB Desktop GPU, and 64 GB RAM.
Data Segmentation
(h:mm:ss)
CNN Predictions
(h:mm:ss)
Data Concatenation
(h:mm:ss)
0:00:080:06:210:00:07
Table 6. Accuracy evaluation of the speech clause detection algorithm.
Video# Senten.# Senten. w/Ambig. ErrorSenten. w/Ambig. Error (%)# Senten. w/Alg. ErrorSenten. w/Alg. Error (%)
G7T150714816
G8T1501020510
G9T1501224612
G10T150816816
Disclaimer/Publisher’s Note: The statements, opinions and data contained in all publications are solely those of the individual author(s) and contributor(s) and not of MDPI and/or the editor(s). MDPI and/or the editor(s) disclaim responsibility for any injury to people or property resulting from any ideas, methods, instructions or products referred to in the content.

