
The Effects of Transparency and Reliability of In-Vehicle Intelligent Agents on Driver Perception, Takeover Performance, Workload and Situation Awareness in Conditionally Automated Vehicles


Abstract
1. Introduction
2. Related Work
2.1. Transparency Design of Interaction
2.2. Influence of System Reliability on Drivers
2.3. Drivers and In-Vehicle Intelligent Agents
2.3.1. Perception of the Agent
2.3.2. Trust
2.3.3. Takeover Performance
2.3.4. Workload
2.3.5. Situation Awareness (SA)
3. Current Study and Research Questions
- RQ 1. How will agent transparency influence drivers’ perception of the agent, trust, workload, situation awareness, and takeover performance?
- RQ 2. How will agent reliability influence drivers’ perception of the agent, trust, workload, situation awareness, and takeover performance?
- RQ 3. Are there any interaction effects of agent transparency and reliability on drivers’ perception of the agent, trust, workload, situation awareness, and takeover performance?
4. Methods
4.1. Participants
4.2. Apparatus
4.3. Experimental Design
4.4. Procedure
4.5. Dependent Measures
- Speed: the maximum/minimum/average speed during the takeover, measured in kilometers per hour.
- Acceleration: the maximum/minimum/average longitudinal and lateral acceleration during the takeover, measured in m/s2.
- Steering Wheel Angle: the maximum/standard deviation of steering wheel angle of the takeover period, measured in degrees.
4.6. Data Analysis
5. Results
5.1. User Perception and Trust in Automation
5.2. Takeover Performance
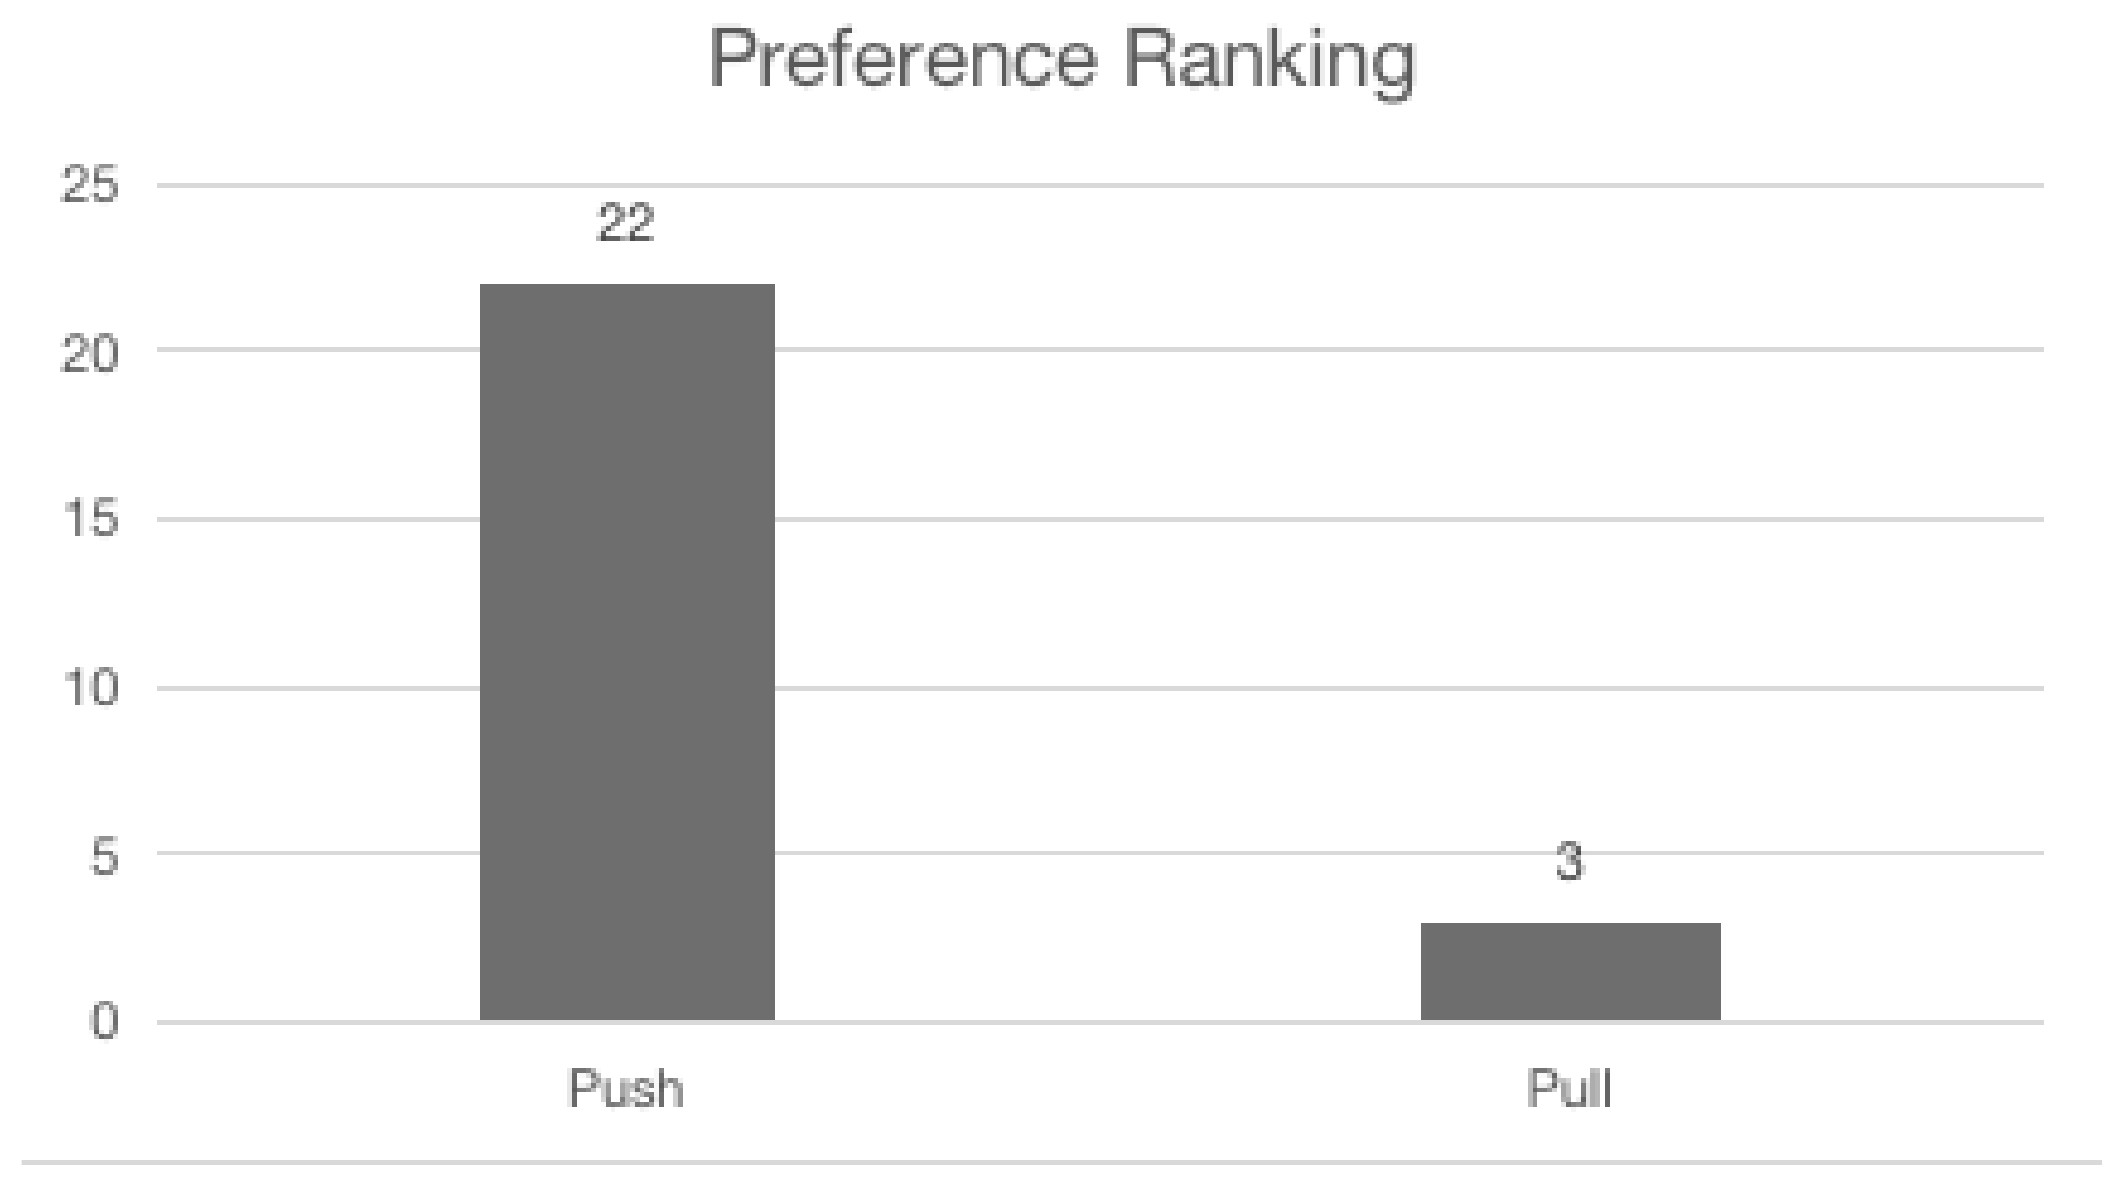
5.3. Agent Preference
5.4. Pull Request
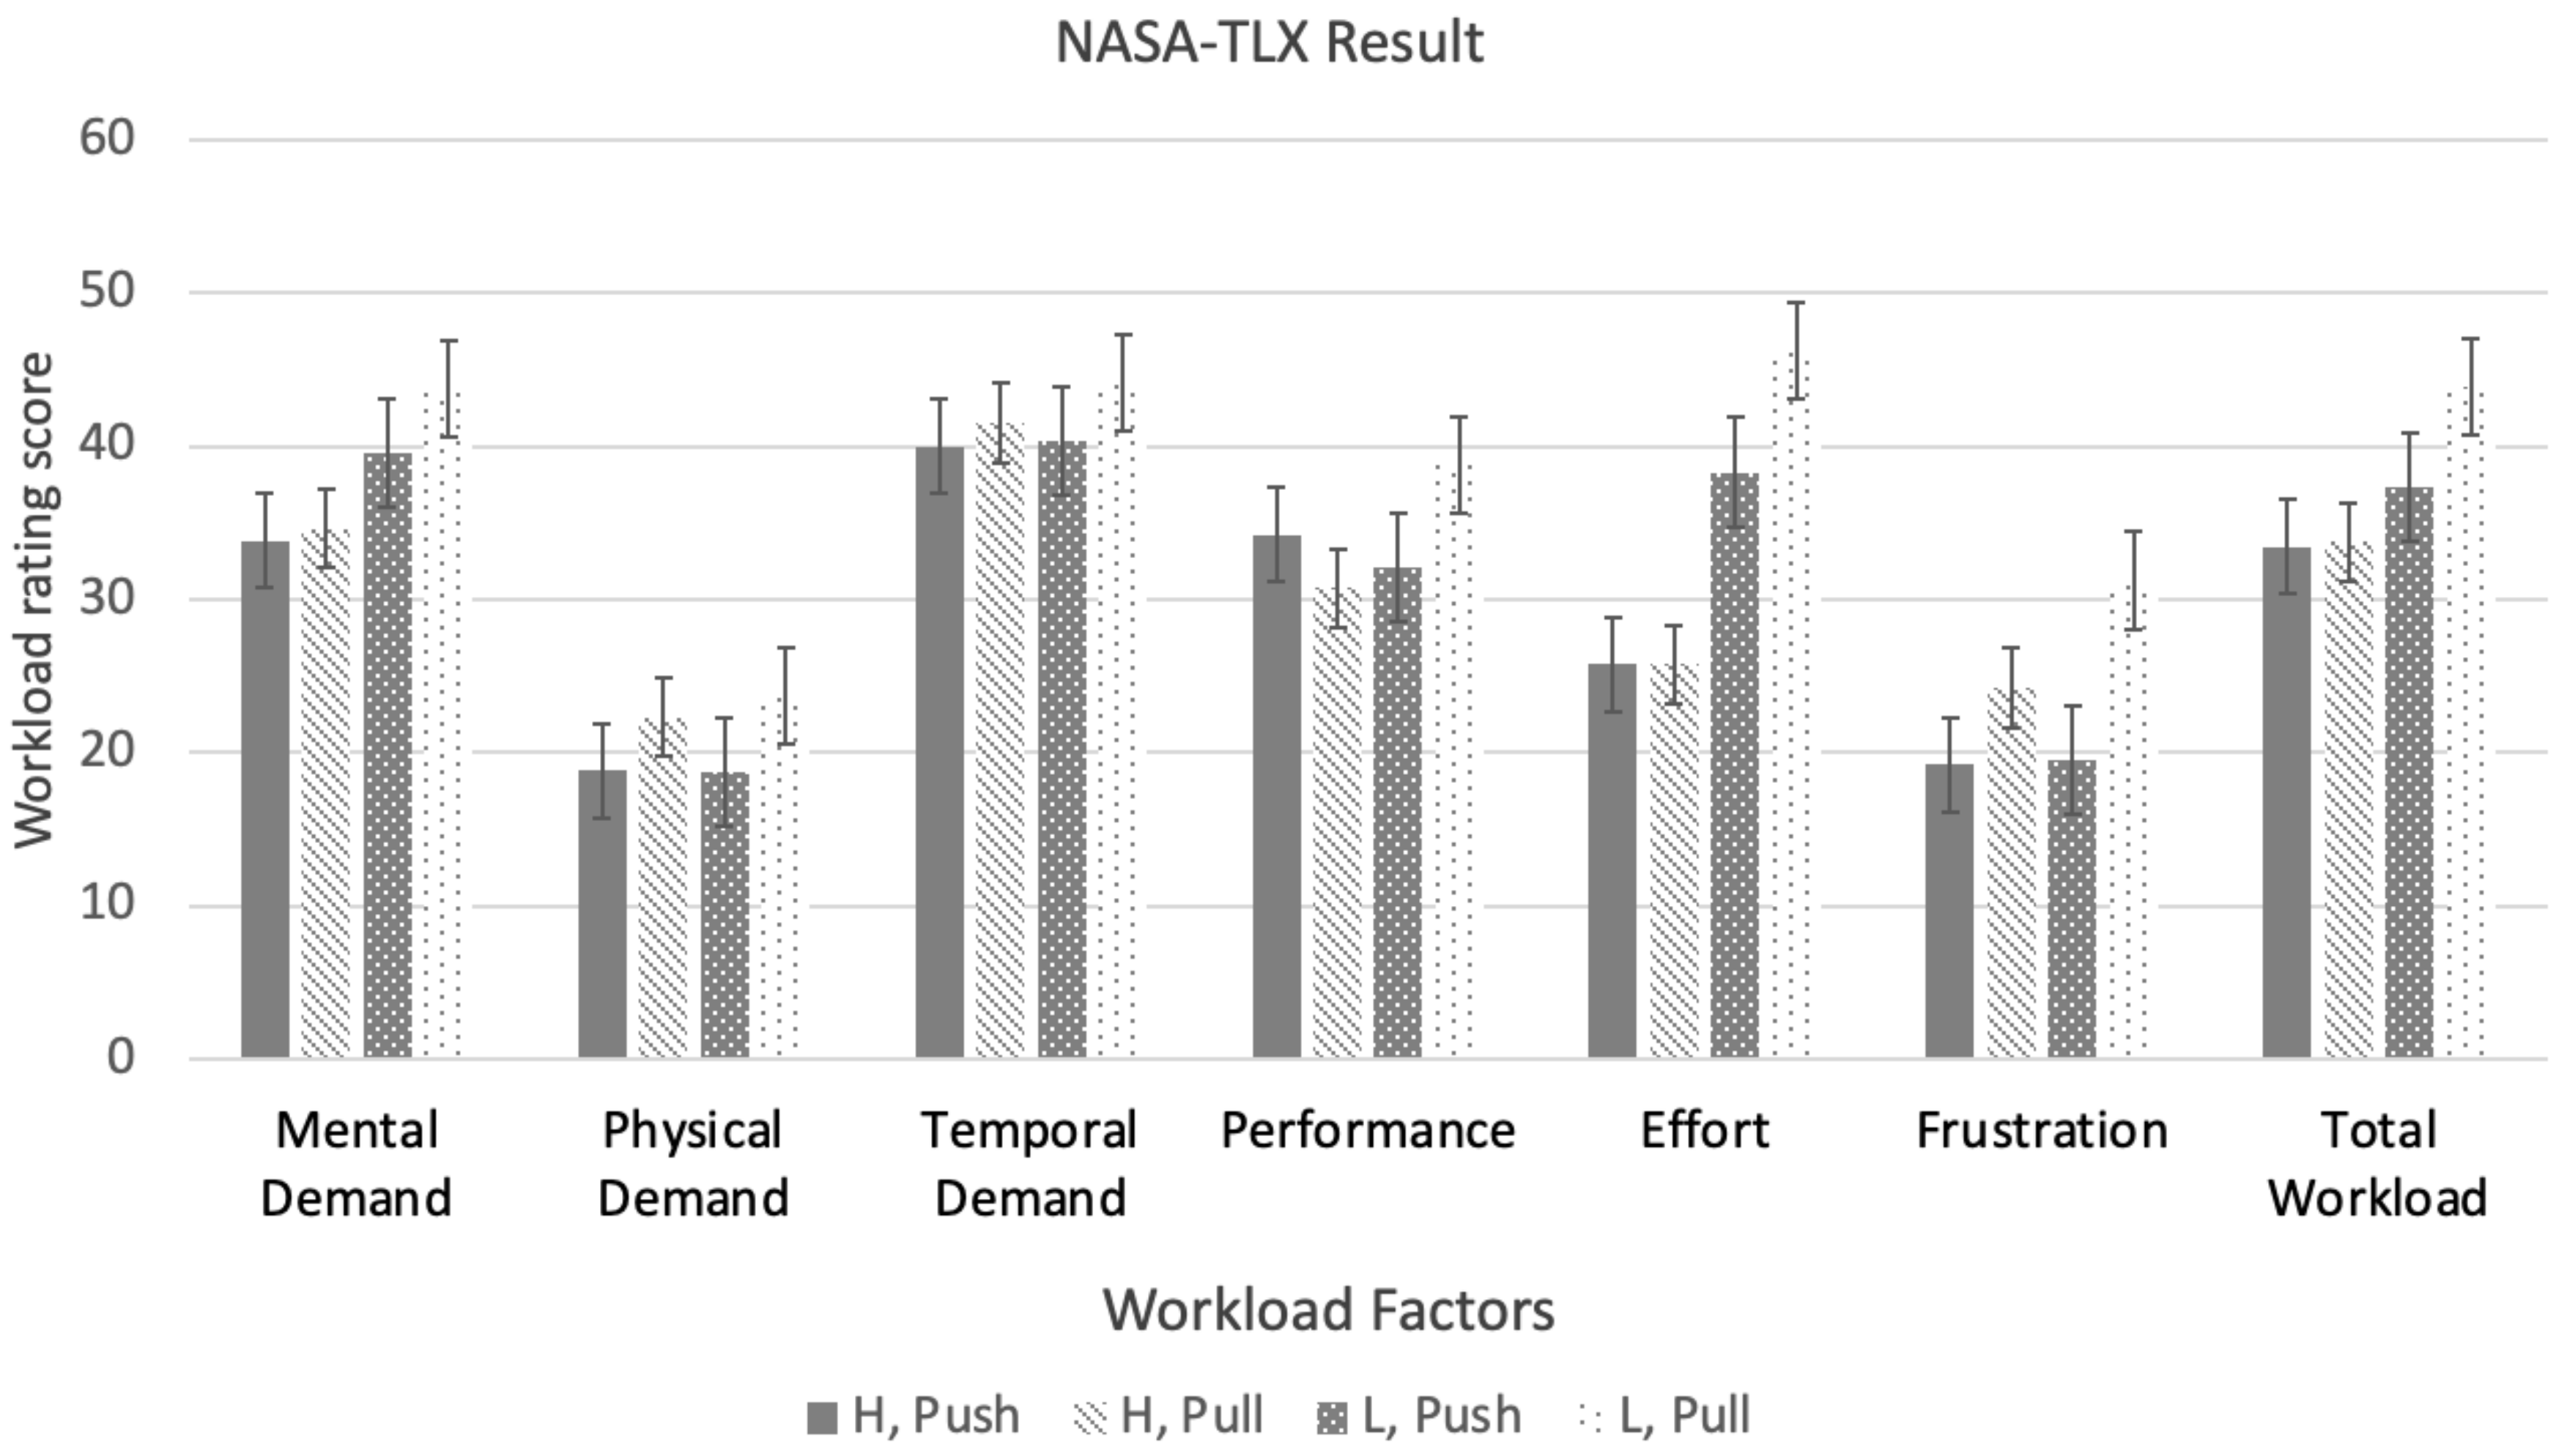
5.5. Workload
5.6. Situation Awareness (SAGAT)
5.7. Compliance
6. Discussion
- RQ 1. How will agent transparency influence drivers’ perception of the agent, trust, workload, situation awareness, and takeover performance?
- RQ 2. How will agent reliability influence drivers’ perception of the agent, trust, workload, situation awareness, and takeover performance?
- RQ 3. Are there any interaction effects of agent transparency and reliability on drivers’ perception of the agent, trust, workload, situation awareness, and takeover performance?
7. Limitations and Future Work
Author Contributions
Funding
Institutional Review Board Statement
Informed Consent Statement
Data Availability Statement
Conflicts of Interest
References
- Wiegand, G.; Eiband, M.; Haubelt, M.; Hussmann, H. ‘I’d like an Explanation for That!’ Exploring reactions to unexpected autonomous driving. In Proceedings of the 22nd International Conference on Human-Computer Interaction with Mobile Devices and Services, Oldenburg, Germany, 5 October 2020. [Google Scholar]
- Shuttleworth, J. Levels of Driving Automation are Defined in New SAE International Standard J3016; SAE International: Warrendale, PA, USA, 2014. [Google Scholar]
- Koo, J.; Kwac, J.; Ju, W.; Steinert, M.; Leifer, L.; Nass, C. Why did my car just do that? Explaining semi-autonomous driving actions to improve driver understanding, trust, and performance. Int. J. Interact. Des. Manuf. 2015, 9, 269–275. [Google Scholar] [CrossRef]
- Lee, J.D.; See, K.A. Trust in automation: Designing for appropriate reliance. Hum. Factors 2004, 46, 50–80. [Google Scholar] [CrossRef] [PubMed]
- Gunning, D.; Stefik, M.; Choi, J.; Miller, T.; Stumpf, S.; Yang, G.Z. XAI-Explainable artificial intelligence. Sci. Robot. 2019, 4, eaay2017. [Google Scholar] [CrossRef] [PubMed]
- Lugano, G. Virtual assistants and self-driving cars. In Proceedings of the 15th International Conference on ITS Telecommunications (ITST), Warsaw, Poland, 29–31 May 2017. [Google Scholar]
- Chen, J.Y.; Lakhmani, S.G.; Stowers, K.; Selkowitz, A.R.; Wright, J.L.; Barnes, M. Situation awareness-based agent transparency and human-autonomy teaming effectiveness. Theor. Issues Ergon. Sci. 2018, 19, 259–282. [Google Scholar] [CrossRef]
- Chen, J.Y.; Procci, K.; Boyce, M.; Wright, J.; Garcia, A.; Barnes, M. Situation Awareness-Based Agent Transparency 2014. Army Research Lab Aberdeen Proving Ground md Human Research and Engineering Directorate. 2014. Available online: https://apps.dtic.mil/sti/pdfs/AD1143367.pdf (accessed on 17 July 2022).
- Endsley, M.R. Measurement of situation awareness in dynamic systems. Hum. Factors 1995, 37, 65–84. [Google Scholar] [CrossRef]
- Wright, J.L.; Chen, J.Y.; Lakhmani, S.G. Agent Transparency and Reliability in Human-Robot Interaction: The Influence on User Confidence and Perceived Reliability. IEEE Trans. Hum.-Mach. Syst. 2019, 50, 254–263. [Google Scholar] [CrossRef]
- Seong, Y.; Bisantz, A.M. The impact of cognitive feedback on judgment performance and trust with decision aids. Int. J. Ind. Ergon. 2008, 38, 608–625. [Google Scholar] [CrossRef]
- Lee, S.C.; Jeon, M. A systematic review of functions and design features of in-vehicle agents. Int. J. Hum.-Comput. Stud. 2022, 165, 102864. [Google Scholar] [CrossRef]
- Stanton, N.A.; Marsden, P. From Fly-by-Wire to Drive-by-Wire: Safety implications of automation in vehicles. Saf. Sci. 1996, 24, 135–149. [Google Scholar] [CrossRef]
- Chen, J.Y.; Barnes, M.J. Human-Agent teaming for multirobot control: A review of human factors issues. IEEE Trans. Hum.-Mach. Syst. 2014, 44, 13–29. [Google Scholar] [CrossRef]
- Selkowitz, A.; Lakhmani, S.; Chen, J.Y.; Boyce, M. The effects of agent transparency on human interaction with an autonomous robotic agent. In Proceedings of the Human Factors and Ergonomics Society, Los Angeles, CA, USA, 26–30 October 2015. [Google Scholar]
- Cheverst, K.; Byun, H.E.; Fitton, D.; Sas, C.; Kray, C.; Villar, N. Exploring issues of user model transparency and proactive behavior in an office environment control system. User Model. User-Adapt. Interact. 2005, 15, 235–273. [Google Scholar] [CrossRef]
- Wang, J.; Yue, T.; Liu, Y.; Wang, Y.; Wang, C.; Yan, F.; You, F. Design of Proactive Interaction for In-Vehicle Robots Based on Transparency. Sensors 2022, 22, 3875. [Google Scholar] [CrossRef] [PubMed]
- Merat, N.; Seppelt, B.; Louw, T.; Engström, J.; Lee, J.D.; Johansson, E.; Green, C.A.; Katazaki, S.; Monk, C.; Itoh, M.; et al. The ‘Out-of-the-Loop’ concept in automated driving: Proposed definition, measures and implications. Cogn. Technol. Work 2019, 21, 87–98. [Google Scholar] [CrossRef]
- Kurkovsky, S.; Harihar, K. Using ubiquitous computing in interactive mobile marketing. Pers. Ubiquitous Comput. 2006, 10, 227–240. [Google Scholar] [CrossRef]
- Konis, K.S. Leveraging ubiquitous computing as a platform for collecting real-time occupant feedback in buildings. Intell. Build. Int. 2013, 5, 150–161. [Google Scholar] [CrossRef]
- McBride, S.E.; Rogers, W.A.; Fisk, A.D. Understanding human management of automation errors. Theor. Issues Ergon. Sci. 2014, 15, 545–577. [Google Scholar] [CrossRef]
- Wickens, C.D.; Dixon, S.R. The benefits of imperfect diagnostic automation: A synthesis of the literature. Theor. Issues Ergon. Sci. 2007, 8, 201–212. [Google Scholar] [CrossRef]
- Singh, A.L.; Tiwari, T.; Singh, I.L. Effects of Automation Reliability and Training on Automation-Induced Complacency and Perceived Mental Workload. J. Indian Acad. Appl. Psychol. 2009, 35, 9–22. [Google Scholar]
- Parasuraman, R.; Riley, V. Humans and Automation: Use, Misuse, Disuse, Abuse. Hum. Factors 1997, 39, 230–253. [Google Scholar] [CrossRef]
- Wickens, C.D.; Gempler, K.; Morphew, M.E. Workload and Reliability of Predictor Displays in Aircraft Traffic Avoidance. Transp. Hum. Factors 2000, 2, 99–126. [Google Scholar] [CrossRef]
- Bartneck, C.; Kulić, D.; Croft, E.; Zoghbi, S. Measurement instruments for the anthropomorphism, animacy, likeability, perceived intelligence, and perceived safety of robots. Int. J. Soc. Robot. 2009, 1, 71–81. [Google Scholar] [CrossRef]
- De Visser, E.J.; Pak, R.; Shaw, T.H. “From ‘automation’ to ‘autonomy’: The importance of trust repair in human–machine interaction. Ergonomics 2018, 61, 1409–1427. [Google Scholar] [CrossRef] [PubMed]
- Haspiel, J.; Du, N.; Meyerson, J.; Robert, L.P., Jr.; Tilbury, D.; Yang, X.J.; Pradhan, A.K. Explanations and Expectations: Trust Building in Automated Vehicles. In Proceedings of the 2018 ACM/IEEE International Conference on Human-Robot Interaction, Chicago, IL, USA, 5–8 March 2018. [Google Scholar]
- Du, N.; Haspiel, J.; Zhang, Q.; Tilbury, D.; Pradhan, A.K.; Yang, X.J.; Robert, L.P., Jr. Look who’s talking now: Implications of AV’s explanations on driver’s trust, AV preference, anxiety and mental workload. Transp. Res. Part C Emerg. Technol. 2019, 104, 428–442. [Google Scholar] [CrossRef]
- Lewis, M. Designing for Human-Agent Interaction. AI Mag. 1998, 19, 67. [Google Scholar]
- Banks, V.A.; Stanton, N.A. Analysis of driver roles: Modelling the changing role of the driver in automated driving systems using EAST. Theor. Issues Ergon. Sci. 2019, 20, 284–300. [Google Scholar] [CrossRef]
- McDonald, A.D.; Alambeigi, H.; Engström, J.; Markkula, G.; Vogelpohl, T.; Dunne, J.; Yuma, N. Toward Computational Simulations of Behavior During Automated Driving Takeovers: A Review of the Empirical and Modeling Literatures. Hum. Factors 2019, 61, 642–688. [Google Scholar] [CrossRef]
- Hart, S.G.; Staveland, L.E. Development of NASA-TLX (Task Load Index): Results of Empirical and Theoretical Research. Adv. Psychol. 1988, 52, 139–183. [Google Scholar]
- Guznov, S.; Lyons, J.; Pfahler, M.; Heironimus, A.; Woolley, M.; Friedman, J.; Neimeier, A. Robot Transparency and Team Orientation Effects on Human–Robot Teaming. Int. J. Hum.-Comput. Interact. 2020, 36, 650–660. [Google Scholar] [CrossRef]
- Endsley, M.R.; Selcon, S.J.; Hardiman, T.D.; Croft, D.G. A Comparative Analysis of Sagat and Sart for Evaluations of Situation Awareness. In Proceedings of the Human Factors and Ergonomics Society Annual Meeting, Los Angeles, CA, USA, 5–9 October 1998. [Google Scholar]
- Miller, C.A. Delegation and transparency: Coordinating interactions so information exchange is no surprise. In International Conference on Virtual, Augmented and Mixed Reality; Springer: New York, NY, USA, 2014; pp. 191–202. [Google Scholar]
- Gable, T.M.; Walker, B.N. Georgia Tech SIMULATOR Sickness Screening Protocol. 2013. Available online: https://smartech.gatech.edu/handle/1853/53375 (accessed on 17 July 2022).
- Lee, K.M.; Jung, Y.; Kim, J.; Kim, S.R. Are physically embodied social agents better than disembodied social agents?: The effects of physical embodiment, tactile interaction, and people’s loneliness in human-robot interaction. Int. J. Hum. Comput. Stud. 2006, 64, 962–973. [Google Scholar] [CrossRef]
- Carpinella, C.M.; Wyman, A.B.; Perez, M.A.; Stroessner, S.J. The Robotic Social Attributes Scale (RoSAS): Development and Validation. In Proceedings of the ACM/IEEE International Conference on Human-Robot Interaction, Vienna, Austria, 6–9 March 2017. [Google Scholar]
- Hone, K.S.; Graham, R. Towards a tool for the Subjective Assessment of Speech System Interfaces (SASSI). Nat. Lang. Eng. 2000, 6, 287–291. [Google Scholar] [CrossRef]
- Jian, J.Y.; Bisantz, A.M. Foundations for an empirically determined scale of trust in automated systems. Int. J. Cogn. Ergon. 2000, 4, 53–71. [Google Scholar] [CrossRef]
- Endsley, M.R. A Systematic Review and Meta-Analysis of Direct Objective Measures of Situation Awareness: A Comparison of SAGAT and SPAM. Hum. Factors 2021, 63, 124–150. [Google Scholar] [CrossRef] [PubMed]
- Svenningsson, N.; Faraon, M. Artificial Intelligence in Conversational Agents: A Study of Factors Related to Perceived Humanness in Chatbots. In Proceedings of the 2019 2nd Artificial Intelligence and Cloud Computing Conference, Kobe, Japan, 21–23 December 2019. [Google Scholar]
- Mercado, J.E.; Rupp, M.A.; Chen, J.Y.; Barnes, M.J.; Barber, D.; Procci, K. Intelligent Agent Transparency in Human-Agent Teaming for Multi-UxV Management. Hum. Factors 2016, 58, 401–415. [Google Scholar] [CrossRef] [PubMed]
- Parasuraman, R.; Sheridan, T.B.; Wickens, C.D. A model for types and levels of human interaction with automation. IEEE Trans. Syst. Man Cybern. Part A Syst. Hum. 2000, 30, 286–297. [Google Scholar] [CrossRef] [PubMed]
- Marsh, H.W.; Hocevar, D. Application of Confirmatory Factor Analysis to the Study of Self-Concept: First-and Higher Order Factor Models and Their Invariance Across Groups. Psychol. Bull. 1985, 97, 562. [Google Scholar] [CrossRef]
- Cacioppo, J.T.; Gardner, W.L.; Berntson, G.G. Beyond Bipolar Conceptualizations and Measures: The Case of Attitudes and Evaluative Space. Psychol. Rev. 1997, 1, 3–25. [Google Scholar] [CrossRef]
- Leigh, J.H. Modality Congruence, Multiple Resource Theory and Intermedia Broadcast Comparisons: An elaboration. J. Advert. 1992, 21, 55–62. [Google Scholar] [CrossRef]
- Wickens, C.D.; Helton, W.S.; Hollands, J.G.; Banbury, S. Engineering Psychology and Human, Performance, 5th ed.; Harper Collins: New York, NY, USA, 2021; pp. 309–318. [Google Scholar]
- Kraus, J.; Scholz, D.; Stiegemeier, D.; Baumann, M. The More You Know: Trust Dynamics and Calibration in Highly Automated Driving and the Effects of Take-Overs, System Malfunction, and System Transparency. Hum. Factors 2020, 62, 718–736. [Google Scholar] [CrossRef]
- Dzindolet, M.T.; Peterson, S.A.; Pomranky, R.A.; Pierce, L.G.; Beck, H.P. The role of trust in automation reliance. Int. J. Hum. Comput. Stud. 2003, 58, 697–718. [Google Scholar] [CrossRef]
- Wang, L.; Jamieson, G.A.; Hollands, J.G. Trust and reliance on an automated combat identification system. Hum. Factors 2009, 51, 281–291. [Google Scholar] [CrossRef]


| Event No. | Description | Condition | |
|---|---|---|---|
| Push | Pull | ||
| [Reliable/Unreliable] 1 | [Reliable/Unreliable] | ||
| 1 | Construction Site | Please take over. The vehicle’s front cameras detect an obstacle [around a quarter mile/3 miles] ahead | 1. Please take over 2. Obstacle around [around a quarter mile/3 miles] ahead 3. Detected by front cameras |
| 2 | Car Swerves | The car in front of you is expected to swerve into your lane in [1000 feet/2 miles] based on the system’s prediction program. | 1. The car in front of you is expected to swerve into your lane 2. It is expected to swerve in [1000 feet/2 miles] 3. Detected by prediction program |
| 3 | Decision Error | Please take over. There is an error in the system’s decision-making code. …Never mind | 1. Please take over 2. System Error 3. Detected in system’s decision code. 4. Never mind (given regardless of whether the participant asks for more info) |
| 4 | Jaywalker | The vehicle’s front right sensors detect a [pedestrian ahead who is walking into the street/large animal crossing the road ahead] Based on their trajectory the vehicle will brake and move to the left lane. | 1. [Pedestrian on road/Animal crossing road] ahead 2. Based on the pedestrian’s trajectory, the vehicle will brake and move to the left lane 3. Detected by front right sensors |
| 5 | Fog | Please take over. The vehicle’s light sensors detect heavy [fog/rain] ahead. | 1. Please take over 2. Heavy [fog/rain] ahead 3. Detected by vehicle’s light sensors |
| Event No. | Description | Condition | |
|---|---|---|---|
| Push | Pull | ||
| [Reliable/Unreliable] 1 | [Reliable/Unreliable] | ||
| 1 | Construction Site | Please take over. The vehicle’s front cameras detect an obstacle [700 feet/2 miles] ahead | 1. Please take over 2. Obstacle around [700 feet/2 miles] ahead 3. Detected by front cameras |
| 2 | Sensor Malfunction | The front right sensor is malfunctioning based on the test code. …Never mind | 1. Please take over 2. Sensor malfunction 3. Detected in system’s decision code. 4. Never mind (given regardless of whether the participant asks for more info) |
| 3 | Cow on road | The vehicle’s front right sensors detect a [large animal/child] crossing the road ahead. Based on their trajectory the vehicle will brake and move to the left lane. | 1. [large animal/child] on the road ahead 2. Based on the pedestrian’s trajectory, the vehicle will brake and move to the left lane 3. Detected by front right sensors |
| 4 | Rain | Please take over. The vehicle’s moisture sensors detect heavy [rain/fog] ahead. | 1. Please take over 2. Heavy [rain/fog] ahead 3. Detected by vehicle’s moisture sensors |
| 5 | Car Swerves | The vehicle to your [left/right] is expected to swerve into your lane based on the system’s decision model. | 1. Vehicle expected to move into your lane 2. The vehicle is positioned on your [left/right] 3. Detected in system’s decision model |
| Reliability | Transparency | Order of Robot (Scenario) | |||
|---|---|---|---|---|---|
| NAO (S1) | Milo (S2) | NAO (S2) | Milo (S1) | ||
| High | Push | Group 1 | Group 2 | ||
| Pull | |||||
| Low | Push | Group 3 | Group 4 | ||
| Pull | |||||
| Scale | Items | Agent Condition Mean (SD) | |||
|---|---|---|---|---|---|
| H 1, Push | H, Pull | L 1, Push | L, Pull | ||
| GodSpeed | Anthropomorphism | 2.33 (0.77) | 2.93 (1.04) † | 2.73 (0.72) | 2.65 (0.87) |
| Animacy | 2.60 (0.85) | 3.22 (1.05) † | 2.69 (0.89) | 2.86 (0.91) | |
| Likeability | 3.62 (1.01) | 4.05 (0.91) † | 3.51 (0.74) | 3.63 (1.02) | |
| Perceived Intelligence * | 4.17 (0.73) † | 3.89 (1.03) | 3.92 (0.67) | 3.74 (0.81) | |
| Perceived Safety | 3.64 (0.52) | 3.63 (0.83) | 3.59 (0.64) | 3.51 (0.59) | |
| Social Presence | Social Presence | 4.90 (1.44) | 5.65 (1.36) | 5.61 (1.15) | 5.57 (1.04) |
| RoSAS | Competence * | 5.54 (1.36) † | 5.25 (1.61) | 5.08 (0.83) | 4.64 (1.38) |
| Warmth * | 2.64 (1.75) | 4.18 (1.79) † | 3.05 (1.16) | 3.17 (1.55) | |
| Discomfort | 2.17 (0.98) | 2.21 (1.66) | 2.19 (0.74) | 2.13 (1.67) | |
| SASSI | System Response Accuracy | 5.03 (0.83) | 5.30 (1.34) | 4.90 (0.84) | 4.71 (1.13) |
| Likeability | 4.96 (1.16) | 5.29 (1.40) † | 5.19 (0.87) | 4.91 (1.38) | |
| Cognitive Demand | 3.20 (1.37) | 3.17 (1.23) | 3.20 (1.09) | 3.09 (1.20) | |
| Annoyance | 3.00 (1.80) | 2.85 (1.52) | 2.85 (1.29) | 2.95 (1.47) | |
| Habitability | 3.96 (0.58) | 4.34 (1.22) † | 3.94 (0.64) | 4.13 (0.55) | |
| Speed | 4.75 (0.97) † | 4.17 (2.33) | 4.69 (1.38) | 4.08 (1.98) | |
| Trust in Automation | Trust | 4.54 (1.26) | 5.23 (1.37) † | 4.64 (1.12) | 4.73 (0.93) |
| Scale | Items | F Value and Significance (p) | |||||
|---|---|---|---|---|---|---|---|
| Transparency | Reliability | Transparency × Reliability | |||||
| F | p | F | p | F | p | ||
| GodSpeed | Anthropomorphism | 1.75 | 0.20 | 0.15 | 0.70 | 3.73 | 0.07 |
| Animacy | 3.40 | 0.08 | 0.15 | 0.70 | 1.32 | 0.26 | |
| Likeability | 1.78 | 0.19 | 0.77 | 0.39 | 0.54 | 0.47 | |
| Perceived Intelligence | 4.32 | 0.049 * | 0.91 | 0.35 | 0.86 | 0.36 | |
| Perceived Safety | 0.10 | 0.76 | 0.14 | 0.70 | 0.09 | 0.76 | |
| Social Presence | Social Presence | 1.02 | 0.32 | 1.32 | 0.26 | 2.52 | 0.13 |
| RoSAS | Competence | 4.81 | 0.039 * | 0.96 | 0.34 | 0.38 | 0.54 |
| Warmth | 4.53 | 0.043 * | 0.49 | 0.49 | 3.07 | 0.09 | |
| Discomfort | 0.00 | 0.98 | 0.01 | 0.92 | 0.02 | 0.88 | |
| SASSI | System Response Accuracy | 0.04 | 0.84 | 0.99 | 0.33 | 1.46 | 0.24 |
| Likeability | 0.00 | 0.95 | 0.04 | 0.84 | 1.20 | 0.28 | |
| Cognitive Demand | 0.07 | 0.79 | 0.00 | 0.95 | 0.02 | 0.89 | |
| Annoyance | 0.00 | 1.00 | 0.04 | 0.84 | 0.22 | 0.64 | |
| Habitability | 1.52 | 0.23 | 0.01 | 0.90 | 1.05 | 0.32 | |
| Speed | 2.34 | 0.14 | 0.06 | 0.81 | 0.01 | 0.90 | |
| Trust in Automation | Trust | 2.50 | 0.13 | 0.39 | 0.53 | 1.46 | 0.24 |
| Takeover Measures | Items | F Value and Significance (p) | |||||
|---|---|---|---|---|---|---|---|
| Transparency | Reliability | Transparency × Reliability | |||||
| F | p | F | p | F | p | ||
| Take over time | Take over time | 2.38 | 0.14 | 0.01 | 0.91 | 0.26 | 0.62 |
| Speed | Maximum | 1.01 | 0.33 | 0.47 | 0.50 | 0.91 | 0.33 |
| Minimum | 0.07 | 0.80 | 1.78 | 0.20 | 0.03 | 0.86 | |
| Average | 0.63 | 0.44 | 1.04 | 0.32 | 0.30 | 0.59 | |
| Longitudinal Acceleration | Maximum | 0.02 | 0.88 | 0.80 | 0.38 | 1.43 | 0.24 |
| Minimum | 0.02 | 0.90 | 0.02 | 0.90 | 1.04 | 0.32 | |
| Average | 0.08 | 0.77 | 0.69 | 0.41 | 1.71 | 0.20 | |
| Lateral Acceleration | Maximum | 0.42 | 0.52 | 0.15 | 0.70 | 5.34 | 0.03 * |
| Minimum | 4.05 | 0.06 | 0.00 | 1.00 | 1.78 | 0.19 | |
| Average | 1.01 | 0.33 | 0.17 | 0.68 | 1.69 | 0.21 | |
| Wheel Angel | Maximum | 0.60 | 0.45 | 0.31 | 0.59 | 0.32 | 0.60 |
| Standard deviation | 0.51 | 0.48 | 0.02 | 0.89 | 0.02 | 0.89 | |
| Items | F Value and Significance (p) | |||||
|---|---|---|---|---|---|---|
| Transparency | Reliability | Transparency × Reliability | ||||
| F | p | F | p | F | p | |
| Mental Demand | 0.26 | 0.61 | 0.64 | 0.43 | 0.09 | 0.77 |
| Physical Demand | 6.42 | 0.02 * | 0.03 | 0.86 | 0.04 | 0.86 |
| Temporal Demand | 0.24 | 0.62 | 0.01 | 0.93 | 0.01 | 0.95 |
| Performance | 0.16 | 0.70 | 0.02 | 0.89 | 1.74 | 0.20 |
| Effort | 0.42 | 0.52 | 5.57 | 0.03 * | 0.17 | 0.68 |
| Frustration | 2.52 | 0.13 | 0.07 | 0.79 | 0.21 | 0.65 |
| Total Workload | 0.94 | 0.34 | 0.72 | 0.40 | 0.49 | 0.49 |
| Items | F Value and Significance (p) | |||||
|---|---|---|---|---|---|---|
| Transparency | Reliability | Transparency × Reliability | ||||
| F | p | F | p | F | p | |
| Level 1 SA | 2.85 | 0.10 | 4.93 | 0.036 * | 0.00 | 0.95 |
| Level 2 SA | 0.50 | 0.49 | 0.67 | 0.42 | 0.00 | 0.97 |
| Level 3 SA | 0.76 | 0.39 | 1.84 | 0.19 | 0.36 | 0.55 |
| Average | 2.36 | 0.14 | 2.50 | 0.13 | 0.06 | 0.81 |
| Situation Awareness | Condition Mean (SD) | |
|---|---|---|
| High Reliability | Low Reliability | |
| Level 1 SA * | 0.81 (0.20) | 0.64 (0.33) |
| Level 2 SA | 0.56 (0.44) | 0.46 (0.37) |
| Level 3 SA | 0.45 (0.35) | 0.30 (0.30) |
| Average | 0.60 (0.27) | 0.47 (0.26) |
| Transparency | ||
|---|---|---|
| Reliability | High Reliability, Push 2.54 (0.18) | High Reliability, Pull 2.92 (0.19) |
| Low Reliability, Push 3.00 (0.19) † | Low Reliability, Pull 2.70 (0.25) |
Publisher’s Note: MDPI stays neutral with regard to jurisdictional claims in published maps and institutional affiliations. |
© 2022 by the authors. Licensee MDPI, Basel, Switzerland. This article is an open access article distributed under the terms and conditions of the Creative Commons Attribution (CC BY) license (https://creativecommons.org/licenses/by/4.0/).
Share and Cite
Zang, J.; Jeon, M. The Effects of Transparency and Reliability of In-Vehicle Intelligent Agents on Driver Perception, Takeover Performance, Workload and Situation Awareness in Conditionally Automated Vehicles. Multimodal Technol. Interact. 2022, 6, 82. https://doi.org/10.3390/mti6090082
Zang J, Jeon M. The Effects of Transparency and Reliability of In-Vehicle Intelligent Agents on Driver Perception, Takeover Performance, Workload and Situation Awareness in Conditionally Automated Vehicles. Multimodal Technologies and Interaction. 2022; 6(9):82. https://doi.org/10.3390/mti6090082
Chicago/Turabian StyleZang, Jing, and Myounghoon Jeon. 2022. "The Effects of Transparency and Reliability of In-Vehicle Intelligent Agents on Driver Perception, Takeover Performance, Workload and Situation Awareness in Conditionally Automated Vehicles" Multimodal Technologies and Interaction 6, no. 9: 82. https://doi.org/10.3390/mti6090082
APA StyleZang, J., & Jeon, M. (2022). The Effects of Transparency and Reliability of In-Vehicle Intelligent Agents on Driver Perception, Takeover Performance, Workload and Situation Awareness in Conditionally Automated Vehicles. Multimodal Technologies and Interaction, 6(9), 82. https://doi.org/10.3390/mti6090082