1. Introduction
Vehicle automation promises to enhance driver’s comfort, traffic safety, and efficiency. However, to make automated vehicles (AVs) widely accepted and desirable, we must design in-vehicle systems that accommodate human capabilities. What are the driver’s needs and preferences? What are the cognitive processes that support driver–vehicle communication and interaction? This study presents the development and empirical evaluation of a display that continuously informs drivers about the current reliability level of the AV system. Such a system could render AV behaviour more predictable for the driver and, hence, improve the joint driver–vehicle performance.
The Society of Automotive Engineers (SAE) defined six levels of automation [
1]. Level 0 refers to no automation, while Level 5 refers to full automation. Increasing steps denote higher levels of vehicle autonomy and automation. The crucial distinction lies between partial automation (Level 2; L2) and conditional automation (Level 3; L3). For instance, an L2 vehicle can perform lateral and longitudinal control but requires the driver to supervise the system at all times. An L3 vehicle can, under certain conditions, operate autonomously, and the driver is allowed to engage in non-driving tasks. However, the driver must reliably take over control when requested by the AV. Nevertheless, how can drivers be expected to resume stable vehicle control within a reasonable time, if they are engaged in non-driving tasks?
A driver remains calibrated to the vehicle dynamics, and environmental conditions during manual driving [
2]. However, drivers’ visual attention might be focused elsewhere when an L3 vehicle drives in an automated mode, resulting in impaired situation awareness [
3,
4] that is informed by peripheral ambient cues, e.g., vestibular information [
5]. The lack of calibration of the vehicle and low situation awareness is not a problem as long as the vehicle operates in the automated mode. However, when an L3 vehicle reaches its operational boundary, a take-over request (TOR) is issued. Because the vehicle cannot operate safely by itself anymore, the driver is required to regain control. However, successful steering requires a frequently updated perceptual-motor loop, attuning gaze behaviour and steering to the current vehicle and environmental conditions [
2]. The perceptual-motor control loop is disrupted during automated driving, which closely relates to the
out-of-the-loop phenomena when the driver is not in physical control of the vehicle, and not monitoring the driving situation [
6]. The lack of perceptual-motor calibration results in lower vehicle control and poorer driving performance, which can be represented by increased vehicle jerk [
7,
8,
9,
10,
11].
To successfully implement L3 vehicles, we must ensure that drivers are ready to take over when requested. In addition, an appropriate user interface is necessary to ensure a smooth control transition. In the following sections, we will focus on concepts that lead us to design the ambient visual cue as an instrument to convey the current state of the AV system. First, we will briefly discuss why communicating reliable information in autonomous driving is beneficial. Next, we will introduce the “Multiple Resource Theory” [
12], a crucial concept in our approach to delivering reliable information to the driver. Finally, we will present other work related to the design of the ambient visual cue.
1.1. Reliability Communication
In the real world, the AV reliability will vary accordingly to its changing levels of certainty in coping with the dynamic environment [
13]. Moray [
14] suggests that, when interacting with an automated system, monitoring should be proportional to the reliability of the system. Therefore, conveying the current level of reliability could help drivers of L3 vehicles adapt their supervision strategy and the level of secondary task engagement [
13] and help them better identify states that require their attention [
14].
According to Norman [
15], appropriate automation design should continually provide feedback and interact with operators. The feedback design in automation has been considered a potential solution for the out-of-the-loop problem [
14]. Moreover, providing users with ongoing reliability feedback can better facilitate appropriate trust [
16]. Previous studies showed that the continuous reliability information led to faster and more precise responses to a take-over request [
17,
18,
19], better situation awareness [
17], and more on-road glance behaviour in low-reliability situations [
20]. Furthermore, Helldin et al. [
19] found that drivers provided with uncertainty information could, to a higher degree, perform tasks other than driving without compromising driving safety.
1.2. Multiple Resource Theory
Multiple resource theory by Wickens [
21] explains how dual-task performance decreases time-sharing ability. According to this theory, only limited resources are available for information processing. Multiple resource theory distinguishes two channels of visual processing, the focal and the ambient vision [
22,
23]. Focal vision supports object recognition and high acuity perception. Ambient vision, distributed across the visual field, is responsible for the perception of orientation and movement. Wickens [
12] suggests that, when two tasks use different channels, time-sharing will be better than the contrasting scenario where two tasks share usage of the same channel and compete for like resources.
Drivers involved in non-driving related tasks (NDRTs) are likely to look away from the road [
24], e.g., at their smartphone or other passengers. Therefore, their focal vision will be occupied. Based on the multiple resource theory, peripheral displays can communicate AV reliability via ambient vision without inducing resource competition. Such peripheral displays show a high potential to raise drivers’ situation awareness and improve their take-over performance [
25]. Moreover, peripheral displays convey information without demanding much attention or cognitive effort [
26].
1.3. Ambient Light
The ambient light was designed following the findings of the subsequent studies. Borojeni et al. [
26] used an LED stripe behind the steering wheel to deliver a TOR. They found the ambient light to cue focal attention appropriately to the operational context without capturing focal attention itself. However, they did not include reliability information in this study.
Faltaous [
13] conducted a user study to investigate the effect of communicating the system’s reliability via a feedback bar. They used an LED strip with a continuous colour gradient from red to green. Based on the results, they derived five recommendations for reliability communication: (1) to provide training sessions with the interface; (2) to use distinct colours instead of a continuous colour spectrum; (3) to deliver TORs via a haptic or auditory channel and reliability via visual channel; (4) to adapt feedback modalities according to the nature of the driving task; and (5) to employ a relatively slow update rate of the reliability cue.
Finally, Zirk et al. [
27] compared a four-stage likelihood alarm system (4-LAS), three-stage likelihood alarm system (3-LAS), conservative binary alarm system (con-BAS), and liberal alarm system (lib-BAS). They found that the con-BAS yielded the best performance, which they attribute to the absence of any cry wolf effect [
28] and alarm fatigue. On the contrary, the worst performance was yielded by the lib-BAS and a 3-LAS. Finally, the 4-LAS yielded significantly better results than both 3-LAS and the lib-BAS in terms of performance and absence of the cry wolf effect. The authors found that the 4-LAS induced the same behavioural strategies as the con-BAS system. They found that participants tend to collapse the four levels into two and treat the 4-LAS in the same way as a con-BAS. This finding is in accordance with the theory of categorical perception, which claims that the human visual system separates colors into discrete categories rather than as a continuous function of luminance [
29]. Hence, Zirk et al. recommend using a discrete con-BAS when possible (e.g., when a miss-prone system is not safety-critical) and the discrete 4-LAS when the fail-safe engineering approach must be followed [
30].
1.4. Measuring Driver’s Cognitive States
Performance-based (e.g., reaction time [
31], vehicle jerk [
11]) and self-assessment (e.g., questionnaires [
32], and interview [
33]) methods have been traditionally used to assess driver’s cognitive states. With the development of low-cost, non-invasive sensors, psychophysiological measures became more available to be employed in driving research [
34]. Electroencephalography (EEG) is perhaps one of the most widely used psychophysiological methods to study the neural indices of cognitive effort and attention allocation in the driving context. The most common use of EEG in the driving context is to study brain activity during states of mental over- or under-arousal (for a recent review, see [
35]). Employing psychophysiological measures allows for assessing cognitive states continuously, unobtrusively, and without disturbing the real-time task. Therefore, psychophysiological measures provide an additional value when combined with subjective and performance-based measures [
34].
Most researchers jointly report that an increased mental workload (MW) leads to a decrease in parietal alpha power [
36,
37,
38,
39], and that alpha waves are associated with relaxation and tend to increase in states of lower alertness, and mental vigilance [
40,
41]. Frontal theta power was reported to increase with increasing MW [
36,
37,
42,
43,
44]; however, the findings in frontal theta power are less consistent. Some authors used a ratio between theta and alpha power to operationalize MW [
45,
46,
47]. Holm et al. suggest a
Task-Load Index (TLI), which is calculated as Fz theta/Pz alpha ratio and increases with increased MW [
48]. Pope et al. [
49] proposed an
Engagement index (EI), which is calculated as beta power divided by the sum of alpha power and theta power at the Cz, Pz, P3, and P4 electrodes.
1.5. The Importance of Conveying Reliability
Drivers must be well prepared for the control transition because an inappropriate reaction to a TOR could result in a safety-critical event [
50]. However, drivers of L3 AVs may focus on tasks which are not related to driving [
1]. Hence, they might not pay attention to the vehicle and the traffic environment before a TOR is delivered. However, how can we expect distracted drivers to respond adequately, with the required precision, and in the desired time frame?
Increasing the predictability of TORs could give drivers time to come back in the loop [
51,
52] and become calibrated to the vehicle dynamics [
2]. Drivers would be able to perceive the complex traffic environment, comprehend the situation, and predict future states. Enhancing the situation awareness would lead to improved decision-making, therefore improving the take-over behaviour [
3,
52].
Future systems should provide continuous feedback on the automation states [
15], and additional support before the control transition [
52]. Using the peripheral vision channel to deliver the support feedback could deliver the necessary information without posing additional demands on drivers’ processing capacity [
12]. The four-stage setting seems to be the most ergonomic way of communicating the reliability information, ensuring that the system is neither too conservative (resulting in a miss-prone system) nor too liberal (resulting in the cry-wolf effect) [
27]. When the TOR is predictable, drivers will have sufficient time to evaluate the current situation and get calibrated to the vehicle dynamics, which will result in a smooth, calm transition of control represented by low vehicle jerk [
8,
9,
10].
1.6. Hypotheses and Research Questions
This study aims to evaluate the efficiency of a four-stage likelihood alarm system conveying the current level of reliability on drivers’ performance. The alarm system was designed as an ambient light in the vehicle’s cabin. We hypothesize that the ambient light will help drivers of L3 vehicles, who are distracted by a non-driving related task, better predict situations when the AV system requests drivers to take over. Increasing the predictability of TORs will therefore provide drivers with additional time to restore situation awareness and get calibrated to the vehicle dynamics, resulting in better take-over performance without increasing MW. To test our assumptions, we formulate the following hypotheses and research questions:
H1:
The ambient light conveying reliability of the AV system does not increase drivers’ mental workload.
H2:
Drivers equipped with the ambient light have better take-over performance.
RQ1:
Do drivers consider continuous reliability feedback useful in predicting TORs?
RQ2:
How do drivers evaluate the four-stage settings of the ambient light?
2. Materials and Methods
2.1. Apparatus
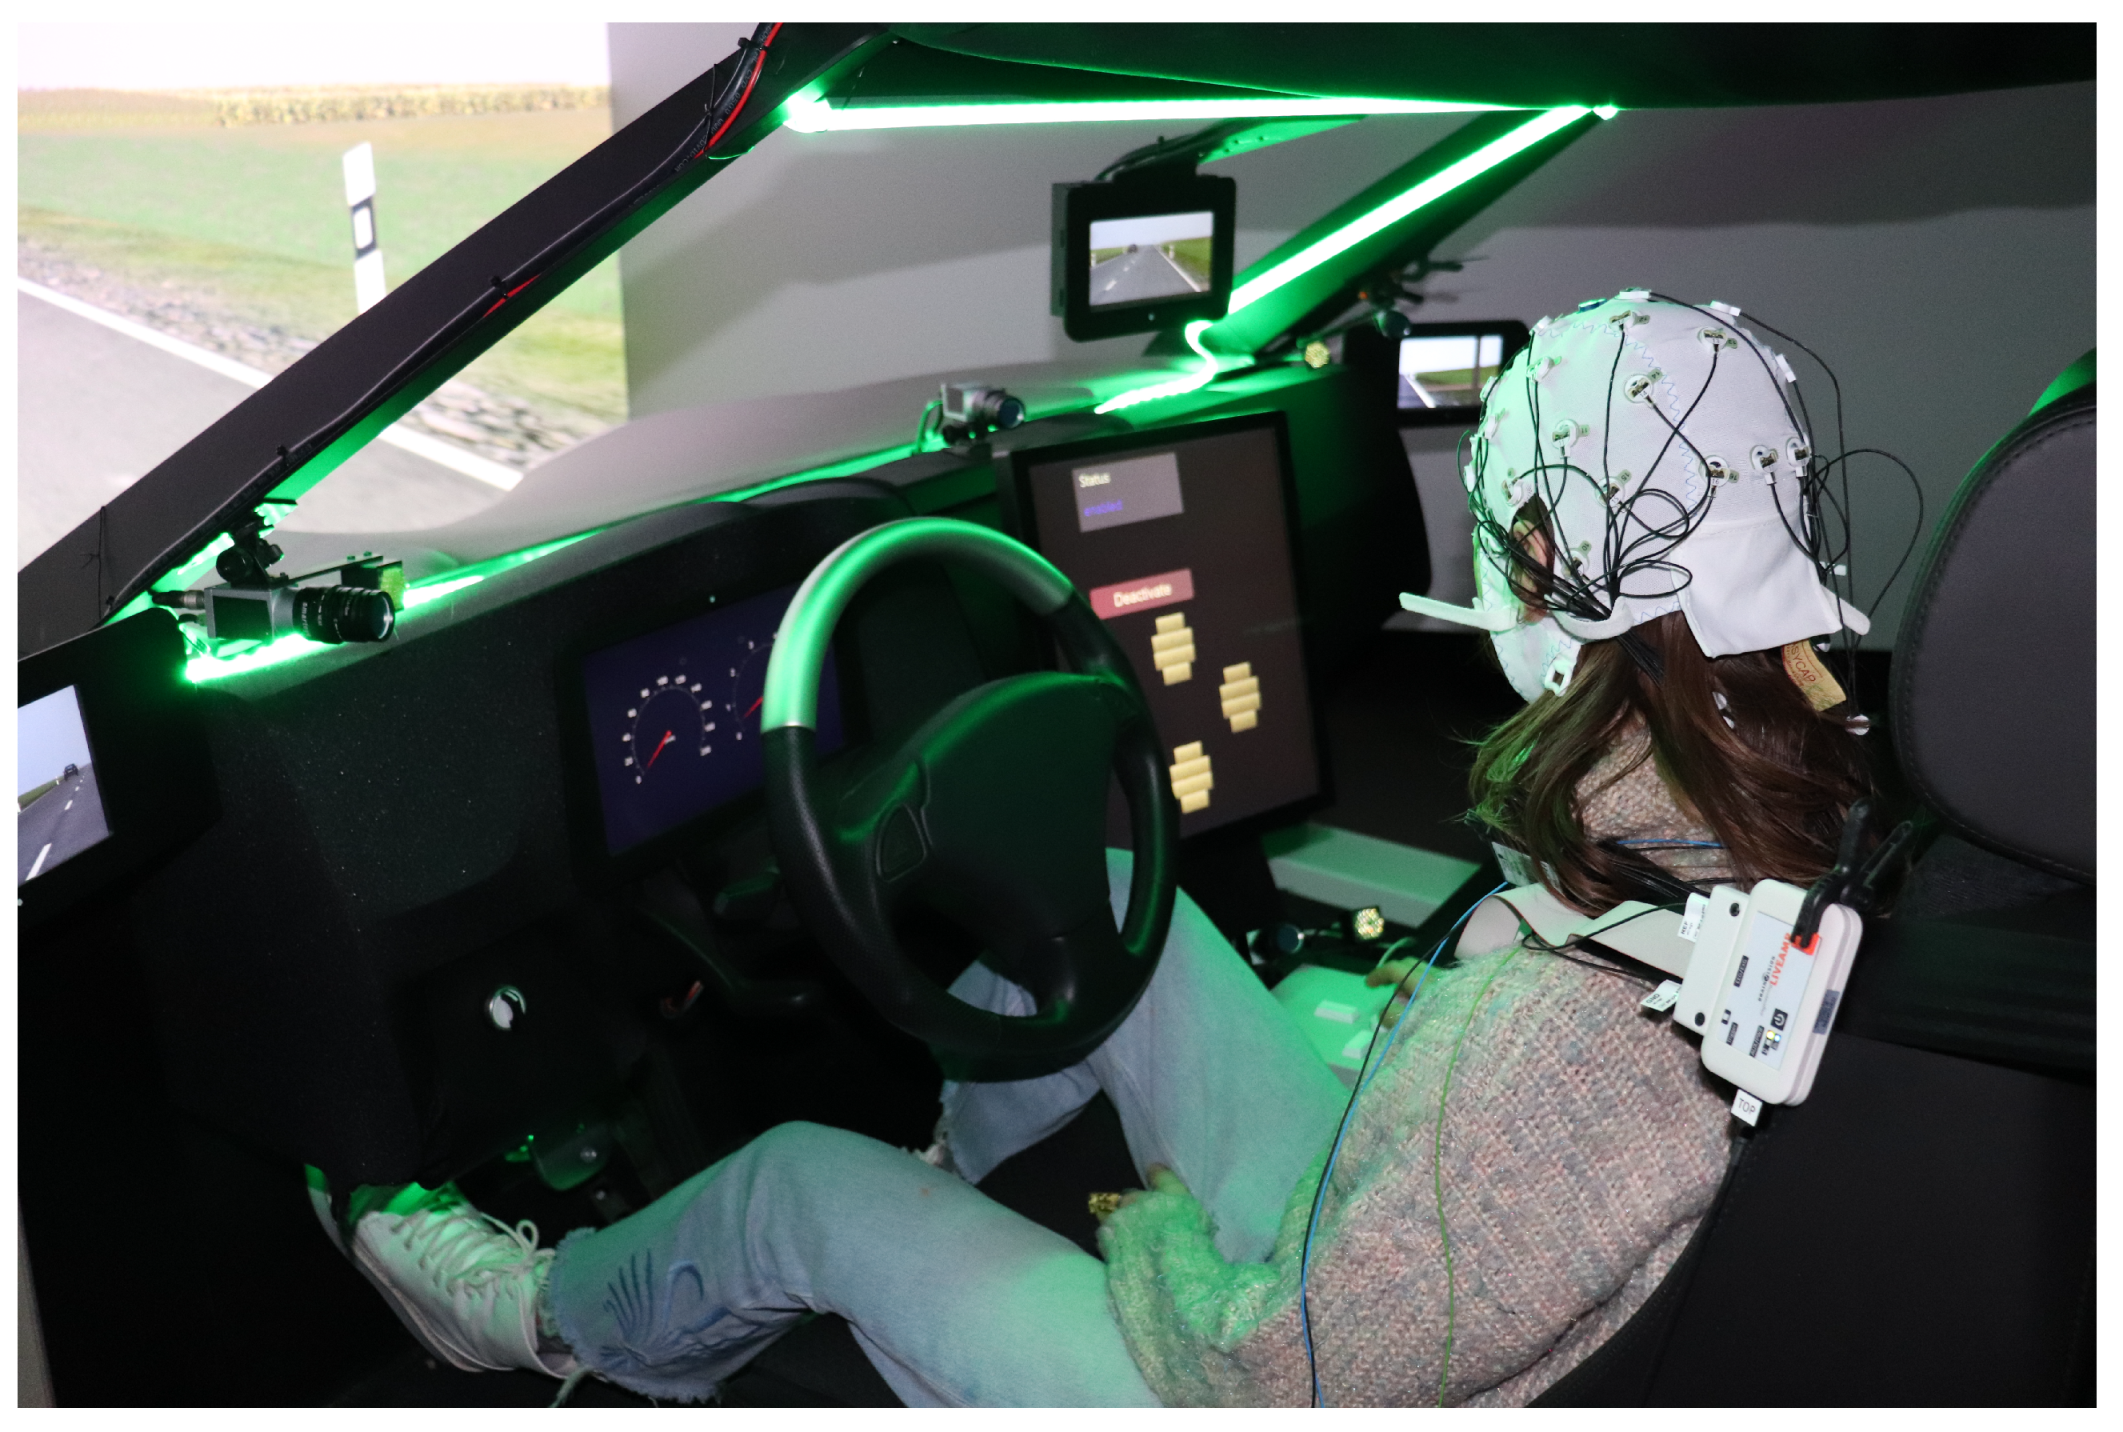
The experiment took place in a highly immersive, fixed-base driving simulator with a realistic car mock-up. Only the front screen of the driving simulator was used due to technical issues. An LED stripe was mounted around the entire windshield of the car mock-up (see
Figure 1). This setup was chosen to provide a wide viewing angle, assuring that the light is equally distributed in the cabin of the vehicle and within the peripheral vision of participants, no matter where they focus or what their seating position is. The colours of the ambient light were optimised in a pre-study with five subjects evaluating the brightness and colour settings. We used four colour settings of the LED stripe: green (#00ff00), yellow (#ffff00), orange (#ff4500), and red (#ff0000).
A non-driving related task (NDRT) was presented on a dashboard screen with a size of 390 to 275 mm. The screen was placed in the middle console of the vehicle mock-up. We used the feature-based visual search task, which is grounded in the feature-integration theory of attention by Treisman and Gelade [
53]. We chose this NDRT because it competes with the driving scene for limited spatial attention resources and is self-paced, hence every participant can adapt their effort according to the demands of the primary task and their level of fatigue. Thirty-nine icons with the letter “O” and one icon with the letter “Q” were presented. The icons were grouped into four fields (10 letters per field; each icon was 14 to 14 mm large), and the position of the target letter “Q” was randomised for each trial. To minimise the muscular noise in the EEG signal, participants responded to the NDRT on a keyboard placed under the dashboard screen in the reach of their right hand. The keyboard had four buttons corresponding to the four fields of the visual search task (see
Figure 1). Participants were trained to press a button corresponding to the field where the letter “Q” is currently located.
2.2. Materials
We administered a German adaptation of the Driving Activity Load Index (DALI; [
32] to assess subjective MW. The scale consists of five items representing the factors contributing to MW (effort of attention, visual demand, auditory demand, temporal demand, and situational stress) in the context of driving.
2.3. Task and Experimental Design
Participants monitored an SAE L3 [
1] vehicle. The experiment consisted of four driving scenarios, each approximately 10 min long. The scenarios were similar in length, road curvature, and the number of events. The order of the scenarios was counterbalanced using the balanced Latin square. There was light rain and fog consistently spread throughout the scenarios. Each scenario started once participants activated the automation. At the end of each scenario, the AV autonomously stopped in a designated parking area. To simulate the
out-of-the-loop phenomena [
6], which is expected in real-world L3 vehicles, participants conducted the NDRT while the vehicle was operating in an automated mode.
When operating in the automated mode, the ego vehicle traveled at 27.7 m/s on a rural road with mild oncoming traffic. We implemented 20 slower lead vehicles traveling on the same lane as the ego vehicle. The lead vehicles traveled at a speed of 13.85 m/s. Once the ego vehicle was 100 m behind the slow lead vehicle, the lead vehicle either (a) accelerated and left or (b) initiated deceleration of −2 m/s3, which resulted in a TOR for the driver of the ego vehicle. We implemented ten vehicles that accelerated and ten vehicles which decelerated. Drivers were trained that, in case of a TOR, they are required to disengage from the secondary task, understand the current traffic situation, deactivate the automation, perform the necessary manoeuvre (overtake the slow lead vehicle), re-activate the automation, and return to the secondary task.
We implemented a between-group design. Both groups experienced the same training and driving scenarios. Nevertheless, we manipulated the settings of the ambient light delivered by the LED stripe around the windshield. In order to avoid bias in the EEG data originating from the absence of any light, participants from the group without the reliability information experienced green and red ambient light. The green light was continuously on during the automated drive and switched to red light once participants disabled the automation and drove manually. Therefore, no reliability information was conveyed via the LED light.
Participants from the group quipped with the ambient light conveying reliability were informed that the light changes its colour depending on the level of reliability on which the AV is currently operating. Participants were instructed that, as the colour cascade (green-yellow-orange-red) progressed, the system’s reliability decreased and the likelihood of a TOR increased. We explained that the green light indicates a high reliability of the AV system and low probability of a TOR; the yellow light shows slightly decreased reliability of the AV system; the orange light indicates moderately reduced reliability of the AV system; the red light indicates low reliability of the AV system and high probability of a TOR. We recommended participants from the experimental group use the reliability information to monitor the AV system and predict the TORs.
We implemented several false alarms (FAs) in the group equipped with the reliability light. In an FA situation, a decrease in reliability was cued via an LED light, but no TOR followed. We implemented eight green-yellow-green FAs; four green-yellow-orange-green FAs; and two green-yellow-orange-red-green FAs. Nevertheless, we did not include any system failures. Therefore, all TORs in the experimental group were preceded by a gradual decline in reliability. The decline in reliability was conveyed via a discrete change to yellow, orange, and red light. The yellow and orange phases were three seconds long. The red phase was 1 s long, followed by an auditory TOR.
2.4. Procedure
To minimise the time spent in the simulator due to ongoing COVID pandemics, participants received an email with information about the experiment, informed consent, and a demographic questionnaire one day before the experiment. Upon arrival at the laboratory, participants were asked to sign the informed consent and data protection sheet. Then, we introduced the driving simulator and the safety regulations. Comprehensive training in the transition of control was provided, lasting approximately 10 to 15 min. First, participants drove manually for several minutes to learn how to operate the vehicle, followed by several minutes of autonomous driving. Afterwards, participants learned how to conduct the NDRT. In the last stage of training, we explained the experimental task, and participants experienced two TORs. Further explanation and another driving trial followed whenever participants misunderstood the task and/or did not react accordingly after a TOR as instructed. Therefore, the take-over manoeuvre was trained, and every participant learned how to react after a TOR before the experiment started. After the training session, we asked participants to fill in the DALI, LETRAS-G, and the Cooperation scale.
After the training, we set up the EEG in another room. Participants were offered snacks and drinks during the EEG montage. Once the signal quality was sufficient, participants were seated in the simulator, and we explained the task again. Moreover, we explained the settings of the LED light, which was turned off during the training session.
Once the participants understood the instructions well, we initiated the experiment. First, participants experienced the four driving scenarios with a short break. At the end of each scenario, we asked participants to fill in the DALI and the Cooperation scale. Moreover, participants again filled in the LETRAS-G at the end of the last scenario. After that, we removed the electrodes, participants were offered to wash their hair, and the interview was conducted. In the end, participants received financial compensation.
2.5. Participants
We recruited 51 participants and divided them into two gender- and age-balanced groups. Nine participants were excluded from the final analysis due to technical problems recording the EEG data. The experimental group consisted of 21 participants (7 men and 14 women; age M = 22.62; SD = 4.40). The control group consisted of 21 participants (7 men and 14 women; age M = 23.00; SD = 3.76). All participants had normal or corrected to normal vision, no known neurological or psychiatric disease, and were fluent in the German language. All participants had a valid German car driver’s license, on average for 5.40 years (SD = 3.68), drove up to 10,000 km per year, and 59.50% of participants drove their car at least once a week. The majority of participants (71.4%) were students of Ulm University, who were recruited via mailing lists and advertisements in the university building. All participants received financial compensation of 20 EUR or study credits.
2.6. EEG Signal Processing
The EEG was recorded using 32 Ag/AgCl active shielded electrodes placed according to the International 10–20 System with reference to the FCz position. We used a standard actiCAP snap elastic cap (BrainProducts, Munich, Germany). The impedances were kept below 25 kOhm. Data were recorded with a sampling rate of 500 Hz using a LiveAmp amplifier and the BrainVision Recorder (BrainProducts, Munich, Germany).
The raw data were exported from the Brain Vision Analyzer to a .mat file and further pre-processed using MATLAB v2022a and the toolbox EEGlab v2022.0 [
54]. In the offline processing, we high-pass filtered the signal at 0.5 Hz and low-pass filtered at 30 Hz. Bad channels were removed (i.e., maximum acceptable high-frequency noise > 4
SD and minimum correlation with nearby channels
r = 0.8) and interpolated. All channels were re-referenced to a common average. Finally, we used the independent component analysis with the runica algorithm to extract 32 components. Using the IClabel plugin for EEGlab, we classified the origin of the components. We focused on the components one to seven and removed those flagged to originate in eye or muscular activity of more than 70%. The spectral characteristics were computed using the Darbelai package version v2019.02.01.1. The alpha power is calculated in the bandwidth range of 8–13 Hz; the theta power is calculated in the bandwidth range of 4–8 Hz; the total power is calculated in the bandwidth range of 1–32 Hz. The frontal theta power was computed as a mean theta power on the Fz, F3, and F4 electrode location. The parietal alpha power was computed as a mean alpha power on the Pz, P3, and P4 electrode locations.
3. Results
3.1. Perceived Mental Workload
The perceived MW was measured using the DALI questionnaire [
32]. We administered the questionnaire at five time points: after the simulator familiarization and after each of the four experimental rides. Using a mixed factor ANOVA with the Greenhouse–Geisser correction, we found a significant main effect of time (
F (1.78, 53.32) = 9.40,
p < 0.001,
). A Bonferroni corrected post-hoc test showed that there was a significant decline in perceived MW between the familiarization and Ride 2 (
p = 0.03), Ride 3 (
p < 0.001), and Ride 4 (
p < 0.001). Moreover, we found a significant decline from Ride 1 to Ride 4 (
p = 0.01). There was neither a main effect of group (
F(1.00, 30.00) = 0.33,
p = 0.57) nor the interaction (
F (1.78, 53.32) = 0.66,
p = 0.50). This finding suggests that the perceived MW was comparable for participants with the ambient light and without the ambient light. The data are presented in
Figure 2.
Furthermore, we conducted a Mann–Whitney U test to compare the perceived mental workload between men and women after the training session. This comparison was made to understand whether there are gender differences in how demanding the first exposure is to an AV. We found no difference between the groups [U = 144.00, p = 0.511]. We fail to reject the null hypothesis and conclude that there are no gender differences in perceived mental workload between men and women.
3.2. EEG Measures of Mental Workload
To measure the objective MW, we analysed the relative frontal theta power and the relative parietal alpha power. The Task-Load Index (TLI) [
48] was calculated as a quotient of frontal midline theta divided by parietal midline alpha.
Figure 3 shows the topographical distribution of alpha and theta power over each of the four rides and the entire experiment.
To evaluate the frontal theta, we used a mixed-factor ANOVA with the Greenhouse–Geisser correction. We found a significant main effect of time (
F (2.19, 85.27) = 3.503,
p = 0.03,
). A Bonferroni corrected post-hoc test showed that there was a significant decrease in relative theta power between the first and the fourth ride (
p < 0.01). There was neither a main effect of group (
F (1.00, 39.00) = 1.56,
p = 0.22) nor the interaction (
F (2.19, 85.27) = 1.30,
p = 0.28). The data are presented in
Figure 4.
To evaluate the parietal alpha, we used a mixed-factor ANOVA with the Greenhouse–Geisser correction. We found a significant main effect of time (
F (1.79, 69.68) = 12.07,
p < 0.001,
). A Bonferroni corrected post-hoc test showed that there was a significant increase in relative alpha power between the first and the second (
p < 0.03), third (
p = 0.001), and fourth (
p < 0.001) ride. Moreover, we found a significant increase between the second and the fourth ride (
p = 0.02). There was neither a main effect of group (
F (1.00, 39.00) = 0.246,
p = 0.62) nor the interaction (
F (1.79, 69.68) = 0.33,
p = 0.70). The data are presented in
Figure 4.
To evaluate the TLI, we used a mixed-factor ANOVA with the Greenhouse–Geisser correction. We found no main effect of time (F (1.44, 56.08) = 2.05, p = 0.12), group (F (1.00, 39.00) = 1.56, p = 0.22), or the interaction (F (1.44, 56.09) = 0.13, p = 0.81).
Both self-report and objective measures of MW suggest that there was no difference between the drivers equipped with the ambient light and those without the ambient light. Therefore, we conclude that the ambient light conveying reliability does not increase drivers’ MW and accept hypothesis 1.
3.3. Take-Over Performance-Vehicle Jerk
We compared the take-over performance of drivers equipped with the ambient light and those without the ambient light. We analysed the vehicle jerk after a TOR, in the period when drivers deactivated the automation and overtook a slow-moving lead vehicle. The vehicle jerk was calculated as a second derivative of velocity. The signal was filtered using a five-point moving average filter. Then, the second derivative of vehicle velocity was calculated for every TOR. Furthermore, we calculated the coefficient of variance for every TOR as the standard deviation divided by the mean. Finally, we standardised the values of the coefficient of variance in order to compare relative low and high vehicle jerk within the sample. The results are shown in
Figure 5.
Using a mixed-factor ANOVA with the Greenhouse–Geisser correction, we found a significant main effect of time (
F (3.53, 123.51) = 7.23,
p < 0.001,
) and a significant effect of the interaction between time and group (
F (3.53, 123.51) = 9.71,
p < 0.001,
). There was no main effect of group (
F (1, 35) = 0.02,
p < 0.897,
). The table with results of Bonfferoni post-hoc tests can be found in
Appendix A.
The results show that drivers with the ambient light performed similarly to the drivers without the ambient light in the first half of the experiment. This finding suggests that a period of training was necessary irrespective of the presence of ambient light conveying the reliability information. However, we observed increasing vehicle jerk of the drivers without the ambient light during take-overs; and there was no difference or even decrease in the vehicle jerk of the drivers with the ambient light in the second half of the experiment. This finding suggests that, with training, participants equipped with the ambient reliability light performed better. Their driving style was calmer and more predictable, suggesting better control of the vehicle and better take-over performance. Therefore, we accept hypothesis 2.
3.4. Overall Assessment of the Ambient Light
To get a better understanding of drivers’ opinions about the ambient light, we conducted an unstructured interview at the end of the experiment. We asked participants whether they considered the light to be useful, pleasant, obtrusive, and salient enough. Furthermore, we investigated whether they actually used the light in the way we intended it to be used, and what did they think about the four stages. Finally, we asked whether they have some recommendations on what to change.
Participants usually considered the ambient light to be a helpful tool to predict TORs. They mentioned that the light did not disturb or annoy them during the task, yet was salient enough to make them look up when there was a decrease in reliability. Most of the participants mentioned that, over time, they learned to ignore the yellow-stage warning and only paid attention to the orange- and red-stage warnings. Most of the participants felt comfortable focusing on the NDRT because they knew the system would warn them if something was going wrong. One participant considered the ambient light to be distracting because they could not focus on the NDRT. Most of the participants of both groups mentioned that they needed more time to be comfortable in controlling the vehicle, even though we provided them training in the simulator. Overall, participants liked the ambient light and considered it a useful tool; however, some participants mentioned that the difference between the yellow and the orange stage was not salient enough.
4. Discussion
This study aimed to understand the effect of an ambient light conveying the current level of reliability on drivers’ take-over performance and mental workload. Moreover, we aimed to get a qualitative evaluation of the ambient light design; and to understand how drivers perceive the reliability information. We conducted an experimental study in a driving simulator. We employed a between-group design; one group was monitoring a vehicle equipped with a four-stage ambient light conveying reliability, and one group was monitoring a vehicle without the light. We analysed the vehicle jerk as a proxy of performance, perceived MW, and EEG signals as an objective measure of MW. Our data show that introducing the ambient light conveying reliability improved the take-over performance without increasing MW.
We hypothesized that the ambient light would lead to better take-over performance. We assumed that the continuous reliability information will help drivers identify states that require their attention [
14] and that, therefore, they will have more time to be prepared for the control transition [
52]. Based on the literature, we used low vehicle jerk as an indicator of calm, relaxed driving style; and high vehicle jerk as an indicator of unpredictable, risky driving style [
8,
9]. We found that both groups performed similarly in the first half of the experiment. However, the vehicle jerk started increasing mid-experiment in the control group while remaining stable in the experimental group. This finding suggests a training period when drivers behave more carefully, irrespective of the ambient light. However, once drivers become used to the experimental situation, their driving style becomes riskier. Because the vehicle jerk of the experimental group remained stable throughout the experiment, we believe that the ambient light-induced more careful driving behaviour. Therefore, we assume that the ambient light could be useful to increase road safety by reducing risky driving behaviour.
To assess MW, we used both self-report and objective measures. We decided to combine the approaches to increase the robustness of our findings [
34]. We observed that MW decreased over time, but there was no difference between drivers with and without the ambient light. This effect was observed using both self-report and psychophysiological measures. The learning effect can be considered as the main factor in the overall decrease of MW [
41]. Our results suggest that the task was equally demanding for drivers irrelevant to the ambient light, and imply that the ambient light could support drivers and convey information without increasing MW. This outcome was expected based on the multiple resource theory [
12,
21,
55]. Other authors came to similar conclusions about ambient displays, which seem to be useful to assist drivers with TORs [
26], lane changing [
56], or controlling the driving speed [
57].
According to the reports and comments from the participants, the four-stage setting of the ambient light seemed adequate. We confirmed that people tend to combine the four stages into two, resulting in a sort-of-conservative binary alarm system. This is desirable [
27], and we recommend using the four-stage likelihood setting in reliability communication. However, based on the feedback from the participants of the experiment, we recommend further investigating designing the light setting. However, the light design was not the main focus of this experiment.
4.1. Limitations
In this study, we did not use eye-tracking. However, it would be useful to understand the effect of ambient light on gaze behaviour. Moreover, it would be useful to understand how the ambient light influenced drivers’ performance in the NDRT. Finally, our sample consists predominantly of young women, hence the generalizability of the results might be limited.
4.2. Future Orientation
In future studies, it would be useful to study what are the best shades of each of the four stages; and how to locate the light in the cabin of the vehicle to increase efficiency. It is necessary to understand how to deal with different lighting conditions in relation to the brightness and colour of the ambient light; and to assess whether the light setting can be optimised for each driver. To understand whether this optimisation is necessary, we recommend studying how take over performance changes between participants of different gender, age, and personality. Moreover, before implementing such a system in real vehicles, it would be necessary to understand the effect of a system failure on drivers’ trust and acceptance of the ambient light.
4.3. Contribution
Development of a new alarm system with a setting that has not been tested before. Testing neuroergonomic methodology in the driving context. Evaluating a new method of increasing traffic safety and improving joint driver-vehicle performance.
5. Conclusions
Drivers with ambient light had a better take-over performance without increased mental workload. We found that the vehicle jerk was comparable for all drivers at the beginning of the experiment, which can be understood as a period of training. After drivers became familiar with the task, we observed a difference between drivers with the ambient light and without. The vehicle jerk of the drivers equipped with the ambient light remained low throughout the experiment, suggesting a calm driving style. The vehicle jerk of drivers without the ambient light increased in the second half of the experiment, suggesting that their driving style became more aggressive and unpredictable. Therefore, we argue that drivers with ambient light had a better take-over performance. Moreover, we measured the MW using both self-report data (the DALI questionnaire) and EEG indices of MW (frontal theta power, parietal alpha power, and the Task-Load Index). We found that the MW was comparable for all the drivers irrespective of the ambient light. Furthermore, most drivers reported the ambient light to be a useful tool to predict TORs. In conclusion, we argue that the ambient light conveying reliability improves drivers’ take-over performance without increasing their mental workload. Therefore, it could improve the joint driver-AV performance during the control transition on SAE L3 automation.


