Article

Reducing the Gap between Mental Models of Truck Drivers and Adaptive User Interfaces in Commercial Vehicles

by
Lasse Schölkopf
1,*,
Camilla Gatto von der Heyde
1,
Anna Sprung
2 and
Frank Diermeyer
1
1
Institute of Automotive Technology, Technical University of Munich, 85748 Garching, Germany
2
MAN Truck & Bus SE, Dachauer Street 667, 80995 Munich, Germany
*
Author to whom correspondence should be addressed.
Multimodal Technol. Interact. 2022, 6(2), 14; https://doi.org/10.3390/mti6020014
Submission received: 25 December 2021 / Revised: 25 January 2022 / Accepted: 28 January 2022 / Published: 29 January 2022

Abstract

:
Whether or not a product matches the user’s mental model and therefore his understanding of how it works influences the perceived usability. Therefore, it is beneficial if an interface is based on the user’s initial mental model, hence it works just as expected. If it contradicts preexisting models, operating errors and frustrated users are to be expected. This work proposes a method to increase the probability of correspondence between a developed product and the user’s mental model by addressing a common source of error in the product development process: Product designers assuming their own mental model matches the user’s. The process was demonstrated using the example of an adaptive user interface for commercial vehicles. A questionnaire was used to identify the underlying dimensions of the user group’s mental model of adaptive user interfaces. By conducting two expert workshops and a user survey with 75 truck drivers, a questionnaire consisting of 37 items and four dimensions was constructed. Thereby, the initial mental model of truck drivers regarding an adaptive user interface for commercial vehicles was determined.

1. Introduction

The number of functionalities in our vehicles is increasing steadily [1], which generally leads to an increase in complexity of interaction [2]. This applies especially to commercial vehicles such as trucks, which feature even more complex driving workplaces due to many additional functions compared to passenger cars [3]. This potentially overwhelms the user with vast amounts of control elements and in return this leads to decreased usability [4]. The number of people killed in accidents involving large trucks in the U.S. increased steadily from 3686 in 2010 to 5005 deaths in 2019 [5] and distractions from the driving task are one of the most frequent causes for accidents [6]. Therefore, any potential distractions by complex human–machine interfaces have to be avoided at all costs.
Whilst the sheer number of buttons can be decreased by introducing multimodal modalities such as touchscreens [7], this can lead to complex menu structures [8] and potentially accidents [9] due to distractions from the road. Adaptive user interfaces (AUIs) are presented as a promising solution: They declutter the driving workplace by reducing the number of necessary buttons and control elements for vehicle functions whilst minimizing the need for deep menu structures by managing the complexity and only presenting the currently relevant control elements. This potential to simplify human–machine interaction in complex systems is well documented [4,10,11,12,13,14,15,16,17]. However, mixed study results suggest that AUIs can introduce new problems such as perceived unpredictability, lack of feeling of being in control and user acceptance [2,18].
How is this possible? Fewer buttons, but still confusing? Whilst it is in general beneficial to reduce the number of buttons in the driving workplace, a system’s simplicity is not exclusively determined by its number of control elements [19]. According to Donald Norman [19], the perceived simplicity of a system depends on whether the user has a matching mental model of the system.
In addition, the transferability of research results carried out in other topics is limited [20], making it necessary to conduct studies with this user group. Moreover, a truck is much more than just a means of transport for truck drivers, but a working tool [21], which makes its usability all the more important.
Therefore, this work uses the example of an interface for commercial vehicles to investigate how designers can reduce the gap between the user’s mental model and the AUI to be developed.

2. State of the Art

AUIs are known to have the potential to simplify human–machine interaction and are regarded as a future trend [22]. They have the potential to provide the user with an optimized usability [10] and reduce operating times [17] whilst improving user satisfaction [17]. This makes them especially useful for applications with high numbers of functions [4] or limited space to display them [14], such as in commercial vehicles [7]. Despite numerous advantages, evaluation results of AUIs have been mixed [17] and challenges remain which will be discussed in the following sections.

2.1. Adaptive User Interfaces

An interface is adaptive if it changes some aspects according to the current context [23], which can be defined as the current task, location, time and other influencing factors. Depending on the predefined context, the AUI automatically displays relevant information or adapts the interface [4]. For example, while the vehicle is being driven off-road, such a system would display the vehicle functions relevant to that situation, such as traction control and differential locks. If the vehicle is stationary and being unloaded, other vehicle functions such as surrounding lights and lowering of the suspension level become relevant and are displayed to the driver [3,7].
From a technological point of view, AUIs can be implemented with either static or dynamic rules or a combination of both [2] and have been the subject of previous research [2,24,25]. Whilst only concepts for AUIs exist for commercial vehicles [3], Mercedes Benz [26] and Ford [27] released their first passenger cars featuring adaptive infotainment functions, proving that they are no longer fiction.

2.1.1. Opportunities

Compared to static interfaces, AUIs offer several benefits if certain prerequisites are met. These include, for example, a high prediction rate [12], transparency [28] and a fitting definition of the system’s context [29]. As for any interface, it is also advised to follow a user-centered design process and adhere to usability guidelines [30].
AUIs allow for a significant reduction in control elements and therefore in theory reduce reaction times of the operator [7]. By adapting to different operating contexts [10], they require fewer interaction steps to complete tasks [28]. This can reduce distractions from the driving task [28] and help in reducing the operator’s mental workload [11]. Furthermore, dynamic interfaces can improve the perceived usability, usefulness and satisfaction [16] and are praised by proponents for their performance gains [12]. Due to those advantages, it is widely acknowledged that a move from static user interfaces to context-dependence is necessary [15]. Then again, the use of AUIs is only advised if the benefits overweigh the risks and problems [13] which will be discussed in the next section.

2.1.2. Disadvantages

Despite the opportunities of AUIs, potential disadvantages have to be considered. For instance, giving your product’s control elements multiple meanings depending on context generally makes it harder to understand [19]. This is particularly relevant for AUIs which are inherently inconsistent [31] and unstable [32], thereby violating the basic usability principle of consistency [33]. Research also suggests that AUIs can reduce the awareness of the functionalities of a system [17]. Furthermore, the system’s behavior can be unpredictable [2,12,18] and lead to a feeling of not being in control [13,18], which is especially critical for use in heavy commercial vehicles. Since AUIs for commercial vehicles are used in a dynamic environment that requires the driver to focus on the road, only limited cognitive and attentional resources can be directed at the current state of the system. This can lead to inattentional blindness and change blindness, which means that changes to objects in the world or even to the object itself are not perceived due to lack of attention [34]. For AUIs in dynamic environments, this might result in the driver not noticing a transition of the system to a new mode, and corresponding discrepancies between the user’s perception of the current system state and the real state might occur. Those factors could explain the relative unsuccessfulness of AUIs [18], lack of trust [35], underwhelming study results [8] as well as the biggest challenge: Achieving user acceptance [2].

2.1.3. Resulting Challenges

Therefore, what can be done from a system designer’s perspective? It seems indispensable that the system matches the user’s expectations and works “just as imagined”. One could argue that the potential drawbacks of AUIs thereby can be reduced, especially since users of AUIs have high expectations towards them and are more frustrated when the interface does not work as expected [30]. Unfortunately, little research has focused on the design of AUIs [29] and only general guidelines on how to optimize an AUI for mental models (MMs) exist [36]. Additionally, whilst research agrees that the system should be consistent with the users’ mental model [19,37,38,39], there is a lack of methods regarding how to achieve this conformity.
The next section therefore explores the role of MMs and implications for the design process of AUIs.

2.2. Mental Models

2.2.1. Definition and Relevance

Whilst definitions of MMs often are criticized for being unspecific [40], that is exactly what they are. They are generally understood as simplifications of the real world which are formed by the users and act as a cognitive shortcut, allowing them to operate products without exactly knowing how complex underlying mechanisms work [37]. The MM therefore refers to how the user thinks the system works [38]. The model defines the user’s knowledge about his own possibilities of interacting with the system as well as the understanding of the system’s actions [38]. With an optimal MM, the user therefore knows at all times what the system is doing and what he can do [38]. The importance of correct MMs can also be illustrated by analyzing cases where incorrect MMs were present. Divergences between MMs and the actual system behavior have, for example, led to confusion about the system’s current state and subsequent tragic airplane accidents in the past [41] and increased take-over times in conditionally automated driving [42]. An inadequate MM that does not represent a system’s technical functionality can also lead to wrong assumptions and overestimations of an assisted driving system’s capabilities, which can result in crashes [43].

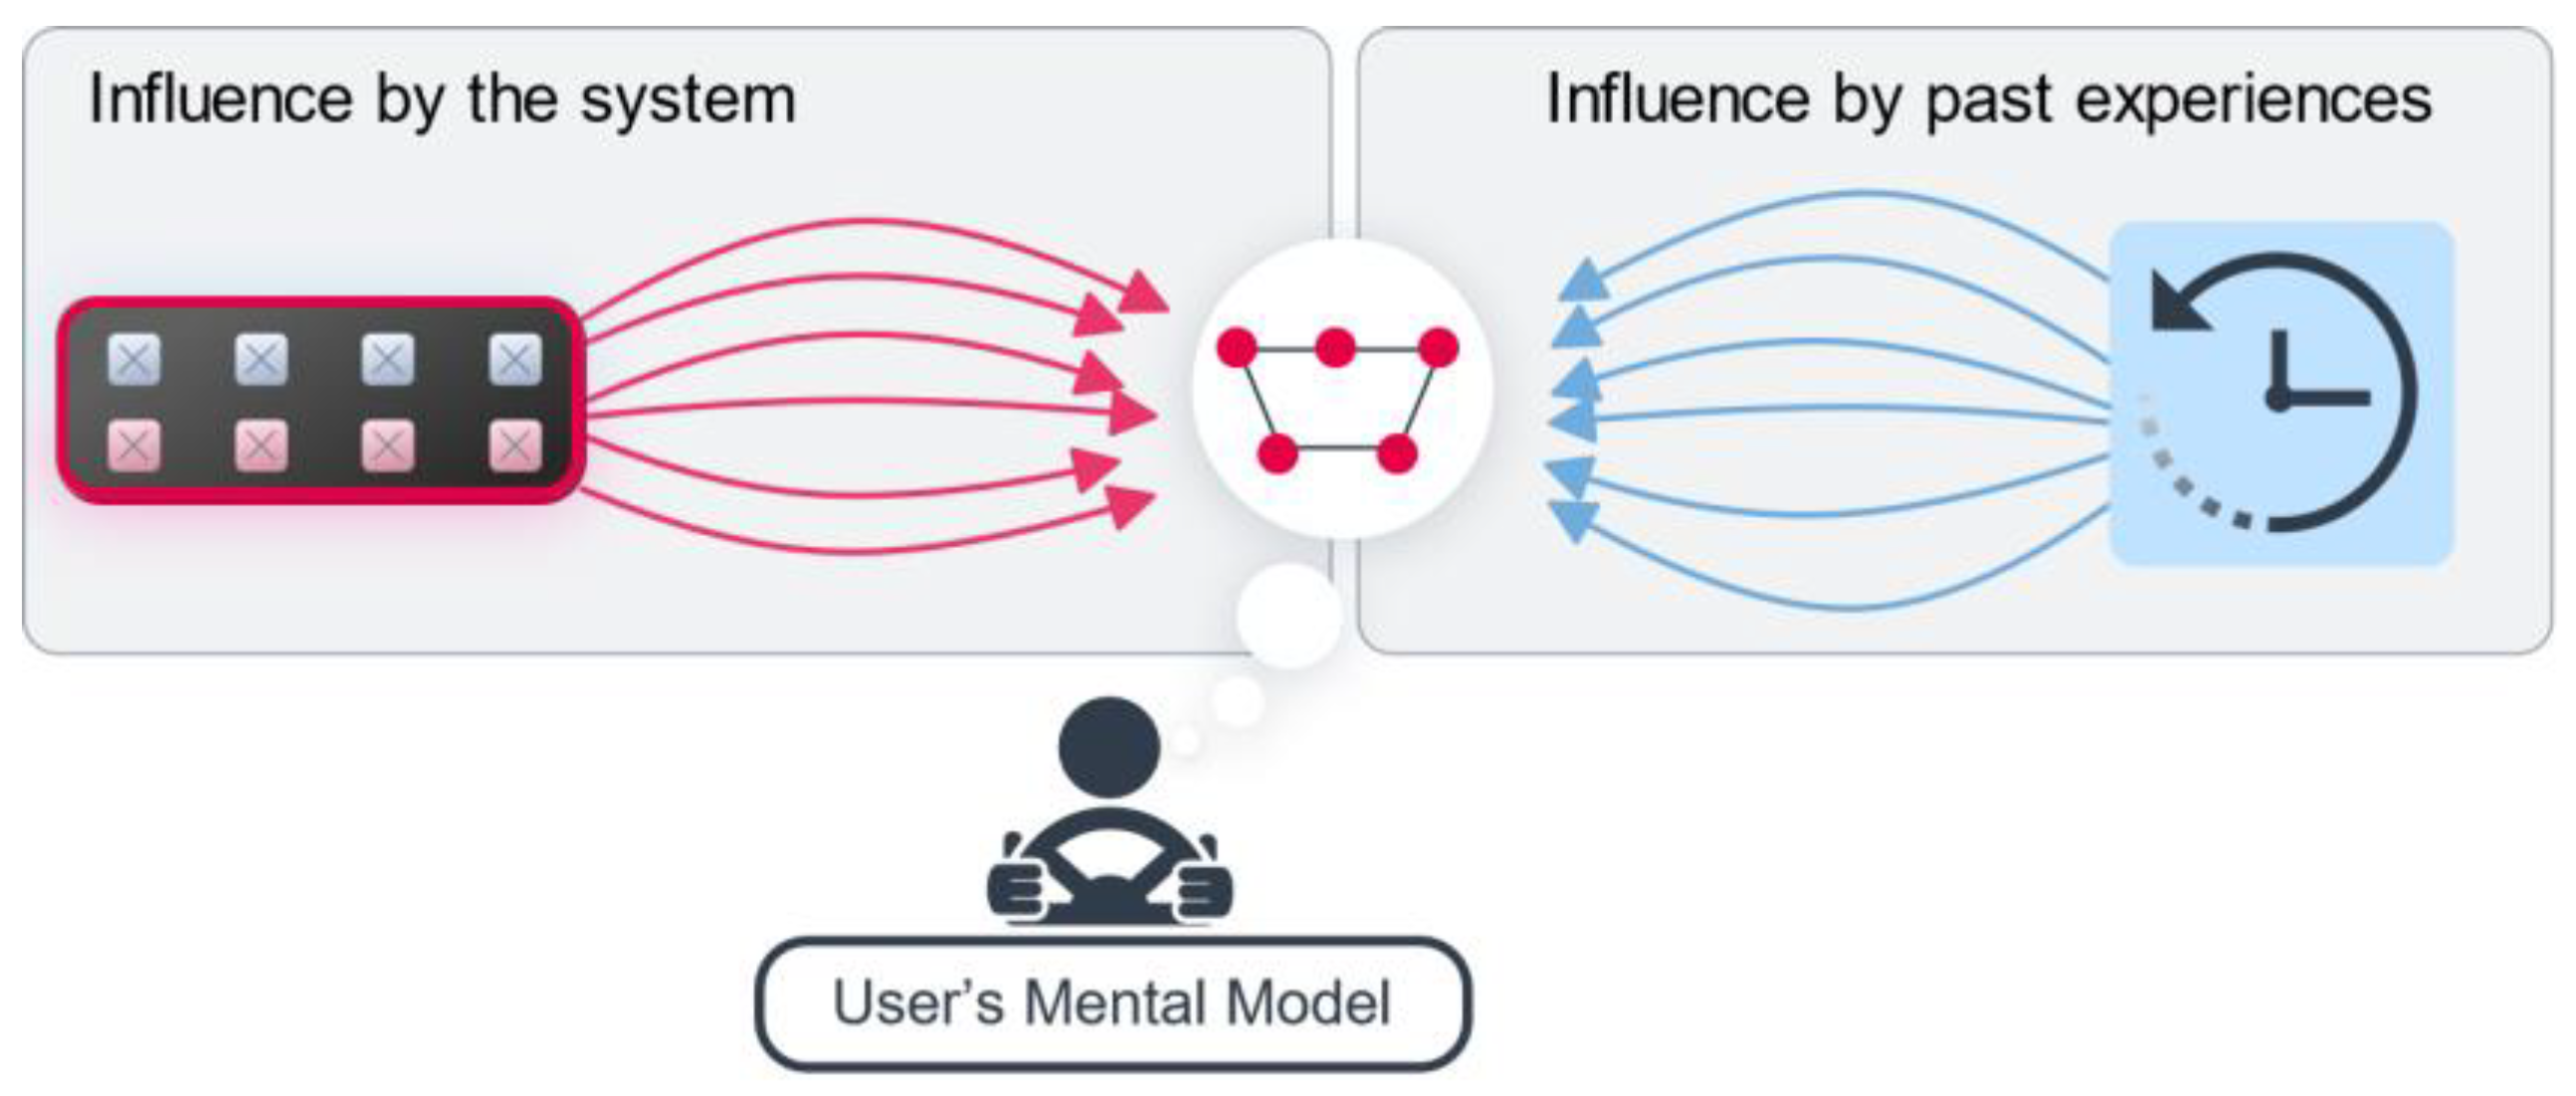
2.2.2. Formation of Mental Models

MMs are formed by synthesizing prior knowledge and new information [44]. Prior experiences with similar products can lead to MMs which are, depending on new experiences, reinforced, revised or rejected [44]. From this, it can be deducted that MMs are dynamic and change over time [45]. The model of how a product works can also be different for each user [46], for example, due to different past experiences with similar-looking devices [46] as shown in Figure 1. It also should be noted that the creation of a new MM from scratch requires mental effort and is demanding, hence users try to use preexisting MMs [47].
MMs are also influenced by the system itself, for example, by its form of representation [48,49]. The user relies on information such as what the device looks like and what the user has read about the system in advertisements, articles, instruction manuals [46] or system descriptions [42]. The product therefore can communicate a model from the product’s designer to the end user. During the first visual inspection of the system and therefore before interacting with it, the user builds an initial MM based on visual appearance [49].

2.2.3. Resulting Challenges and Implications

Since the development of a new MM is demanding and users prefer to use existing ones, a new product like an AUI should conform to preexisting MMs [50]. Furthermore, the user can become frustrated if it is difficult to fit new information into existing MMs [51]. Hence, the system should behave according to the existing MMs, meaning it works exactly as a novice would expect [38]. This allows the user to use already formed MMs instead of building a new one, which would require more effort [47].
MMs exhibit high interpersonal variation, i.e., the idea of how a product works may differ significantly for each person [46]. Differences between the MM of the product’s designer and user are also possible: The person developing the product can have a widely deviating MM of how the product works compared to the user as shown in Figure 2. According to Norman [46], designers expect the user’s MM to be identical to their own, which unfortunately is not always the case. Since developers design the product with their own MM in mind, the resulting product can therefore represent a model which is incompatible with the end user’s MM, resulting in missed expectations and leading to confusion and frustration. Deviating mental models also can result in different patterns of performance [48], hence the user may try to use it in a manner that the developer did not expect and account for.
It is acknowledged that the MM represented by the system should be oriented towards the user’s MM instead of the developer’s [37] as illustrated in Figure 2. If the product communicates and represents a model which is not matching the user’s MM, problems arise [46].
This has to be avoided, especially when developing adaptive systems, since users of AUIs have higher expectations and are more frustrated when the interface does not work as the user expected [30]. Besides the user interface itself, the behavior of the AUI should also match the user’s MM. According to Gajos et al. [12], an adaptive algorithm is predictable if users can easily model its strategy in their heads, i.e., it behaves in accordance with their mental model.
For example, based on previous experiences with similar products, the user might expect the system to be intelligent and self-learning over time. If the system’s designer does not expect this and imagines the system to follow unchanging and predetermined rules stored in the algorithm, a product might be developed which frustrates the user since its behavior is not matching his MM.
The importance of considering MMs can also be inferred from the guidelines of leading AI systems. Wright et al. [36] analyzed guidelines of Apple [52], Google [50] and Microsoft [53]. The authors showed that the guidelines for the category of interfaces emphasize MMs the most with 24 rules [36]. However, whilst they contain good advice such as “set expectations for adaption”, little advice is given on how to implement this or measure success.

3. Research Questions

To avoid confusion [41] and frustration [51] and reduce the mental effort [47], AUIs should match the user’s existing MMs or facilitate the formation of adequate models. This allows the user to always know what to do and what the system does [38] and makes the system seem simple [19]. In addition to existing usability engineering methods, designers should focus on mental models early in the design process of AUIs [3]. The overall objective of this work, therefore, is to answer how the gap between MMs and AUIs for commercial vehicles can be reduced, which is necessary since the transferability of results in other fields to truck drivers is limited [20]. This goal is subdivided into the following three research questions.
From the state of the art, it can be deduced that it is beneficial if the system matches the MM of the user group [39], which is especially relevant for AUIs [50]. Therefore, in addition to applying existing usability engineering methods, designers and developers of AUIs should focus on mental models early in the design process of AUIs [3]. Unfortunately, there is a lack of methods on how to implement this in the development process when the product itself does not exist yet. The first research question is, thus, as follows:
  • RQ1: How can the user’s mental model be incorporated into the design and development process of adaptive user interfaces?
MMs are hard to measure [54] since they are subjective. In order to make the MM more tangible for practitioners, the MM’s underlying structure has to be identified. In the field of questionnaires, this structure is represented by dimensions. For example, van der Laan et al. [55] developed a questionnaire that represents and quantifies user acceptance based on the two dimensions “usefulness” and “satisfaction”, allowing for meaningful interpretations of study results. Therefore, to gain more insights into the user group’s MM, this work’s goal is to identify the underlying structure of the model. To allow for efficient and economical evaluations, the structures should be represented by a questionnaire’s dimensions. Hence, the second question is phrased as follows:
  • RQ2: What underlying dimensions describe the mental model of truck drivers regarding AUI and how can it be measured?
It is beneficial to know the existing MM of users, since the product should match their understanding of how the system works. This is so important that Google [50] mentions it specifically in their guidelines for designing systems using AI to identify existing mental models. We therefore aim to provide designers and developers of AUIs for commercial vehicles with the knowledge of how truck drivers’ initial MMs are defined regarding AUIs. Obtaining this knowledge might reduce the risk of deviating MMs of the developer and user. Therefore, the following research question is formulated:
  • RQ3: What is the initial mental model of truck drivers before interacting with an AUI for commercial vehicles?
In the following, the three mentioned research questions will be worked on and answered.

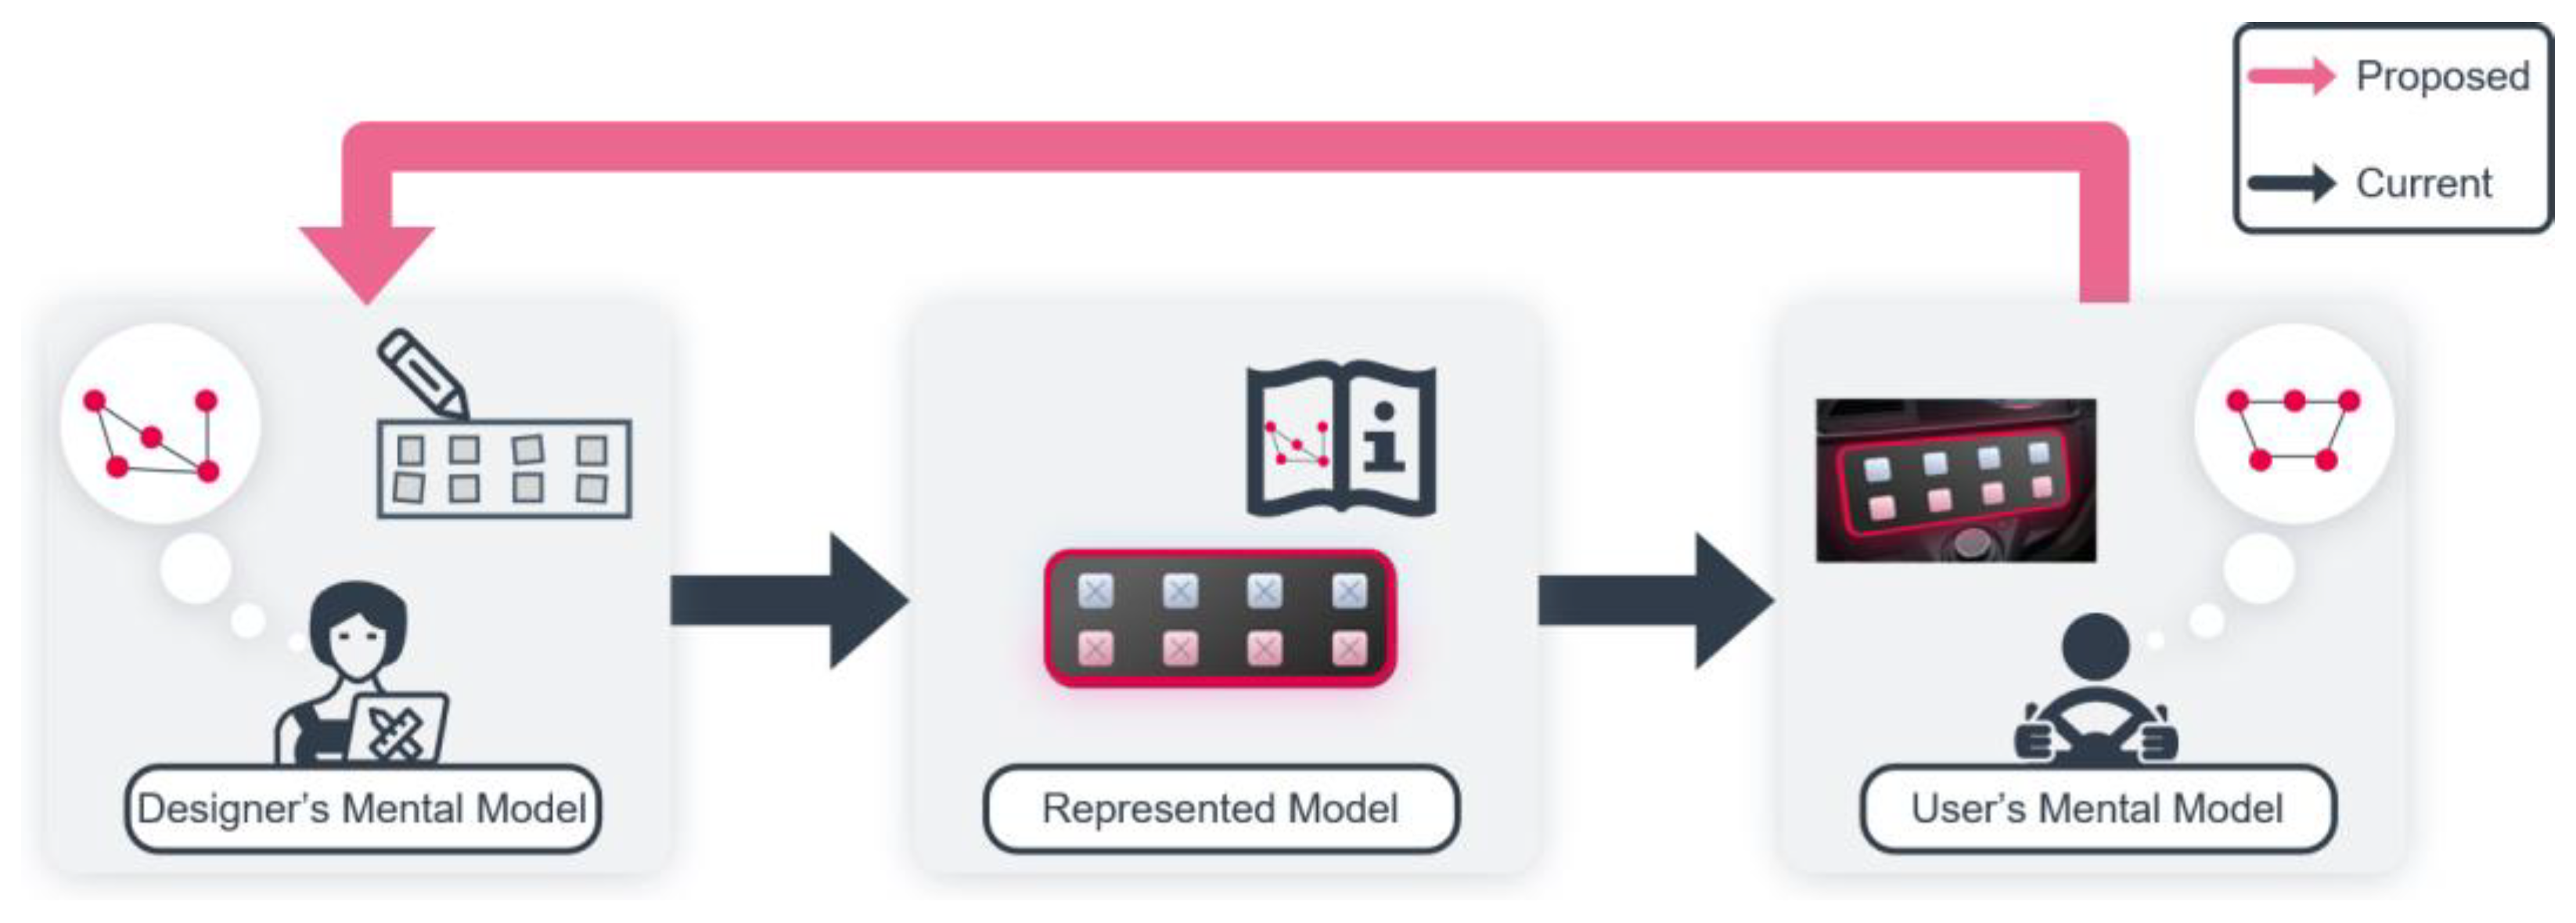
4. RQ1—How to Incorporate MMs during AUI Development

As noted by Cooper et al. [37] and Norman [46], it is possible that the system’s designer and user have different MMs of the same system (Figure 2 and Figure 3). While designers often expect that the user’s MM of the product to be developed matches their own [46], this is not always the case since the product itself communicates the model to the end user, as shown in Figure 3. This can lead to products contradicting existing MMs of the user group, which has to be avoided, since products should match or build upon existing MMs [46,50].
Therefore, we propose to augment the traditional development process and include a step which allows the system’s designer to gain access to knowledge about the MM of the user group as early as possible during the conception phase of the product shown in Figure 3.
This leads to a chicken-and-egg situation: The designer needs insights into the MM of a user group that has not yet formed a solidified MM of the product, since there is no possibility of interaction with it yet. Fortunately, this conflict can be mitigated by measuring the initial MM, which is even possible based on sketches and descriptions of the system [49]. Therefore, all the designer needs to measure the initial MM is a brief description or first design sketches of the AUI. The system’s description should be not too detailed and focus on the general functionality of the system, since the information given to the user can influence the MM [42]. This ideally should be carried out during the early conception phase. After presenting and explaining the system, the user’s MM is measured. This can either be carried out by conducting interviews in which users explain how they think the system works [49] or by assessing the MM with questionnaires [56,57,58].
With the gained knowledge about the initial MM, the designer then can create the AUI in a manner which represents a model that is consistent with the user’s expectations.

5. RQ2—Structure of the MM and Measuring It

MMs are hard to measure [54] since they are subjective, but methods to overcome this exist. They can generally be categorized as quantitative and qualitative methods [56].
Qualitative methods such as interviews, analysis of behavior, card sorting and diaries allow for fairly detailed analysis of the user’s MM, but are time-inefficient and therefore costly. In contrast, measuring MMs using quantitative methods, such as questionnaires, is comparatively quick and inexpensive and therefore more efficient [56]. Due to their high efficiency and standardization, MMs are often measured by questionnaires [56,57,58]. They are constructed for this purpose and typically focus on the correctness of the MM, which is quantified, for instance, in the form of an understanding score. While this is helpful to probe if the user has an appropriate understanding of the system, it lacks the information of a multidimensional questionnaire to interpret the structure of the MM.
To gain more insights into the user group’s MM, this work’s goal is to identify the underlying structure of the model, also called dimensions. This approach is similar to the User Experience Questionnaire’s construction [59], which was developed by Laugwitz et al. [60] and breaks down the product’s user experience into six scales (attractiveness, perspicuity, efficiency, dependability, stimulation, novelty).
The method for constructing an MM questionnaire was subdivided into two major phases shown in Figure 4: Item generation and scale development.
First, items were generated with the goal of covering all characteristics of AUIs with items, evident by the high number of identified statements. This process is inspired by the work of Richardson et al. [56], Beggiato and Krems [58] and Rothhämel et al. [61].
In order to reduce the variance and ensure a high level of comprehensibility of the items, duplicates were removed in subsequent workshops and the wording was tailored to the targeted group of truck drivers which was verified with pretests. The second phase focused on developing the scales and identifying the underlying dimensions of the users’ MM through a survey, followed by conducting an online survey and a subsequent factor analysis. This procedure is similar to approaches used by Hassenzahl et al. [62] and Laugwitz et al. [60]. In addition, the Delphi method was used to name the questionnaire’s dimensions. The individual steps of the two phases are described in the following.

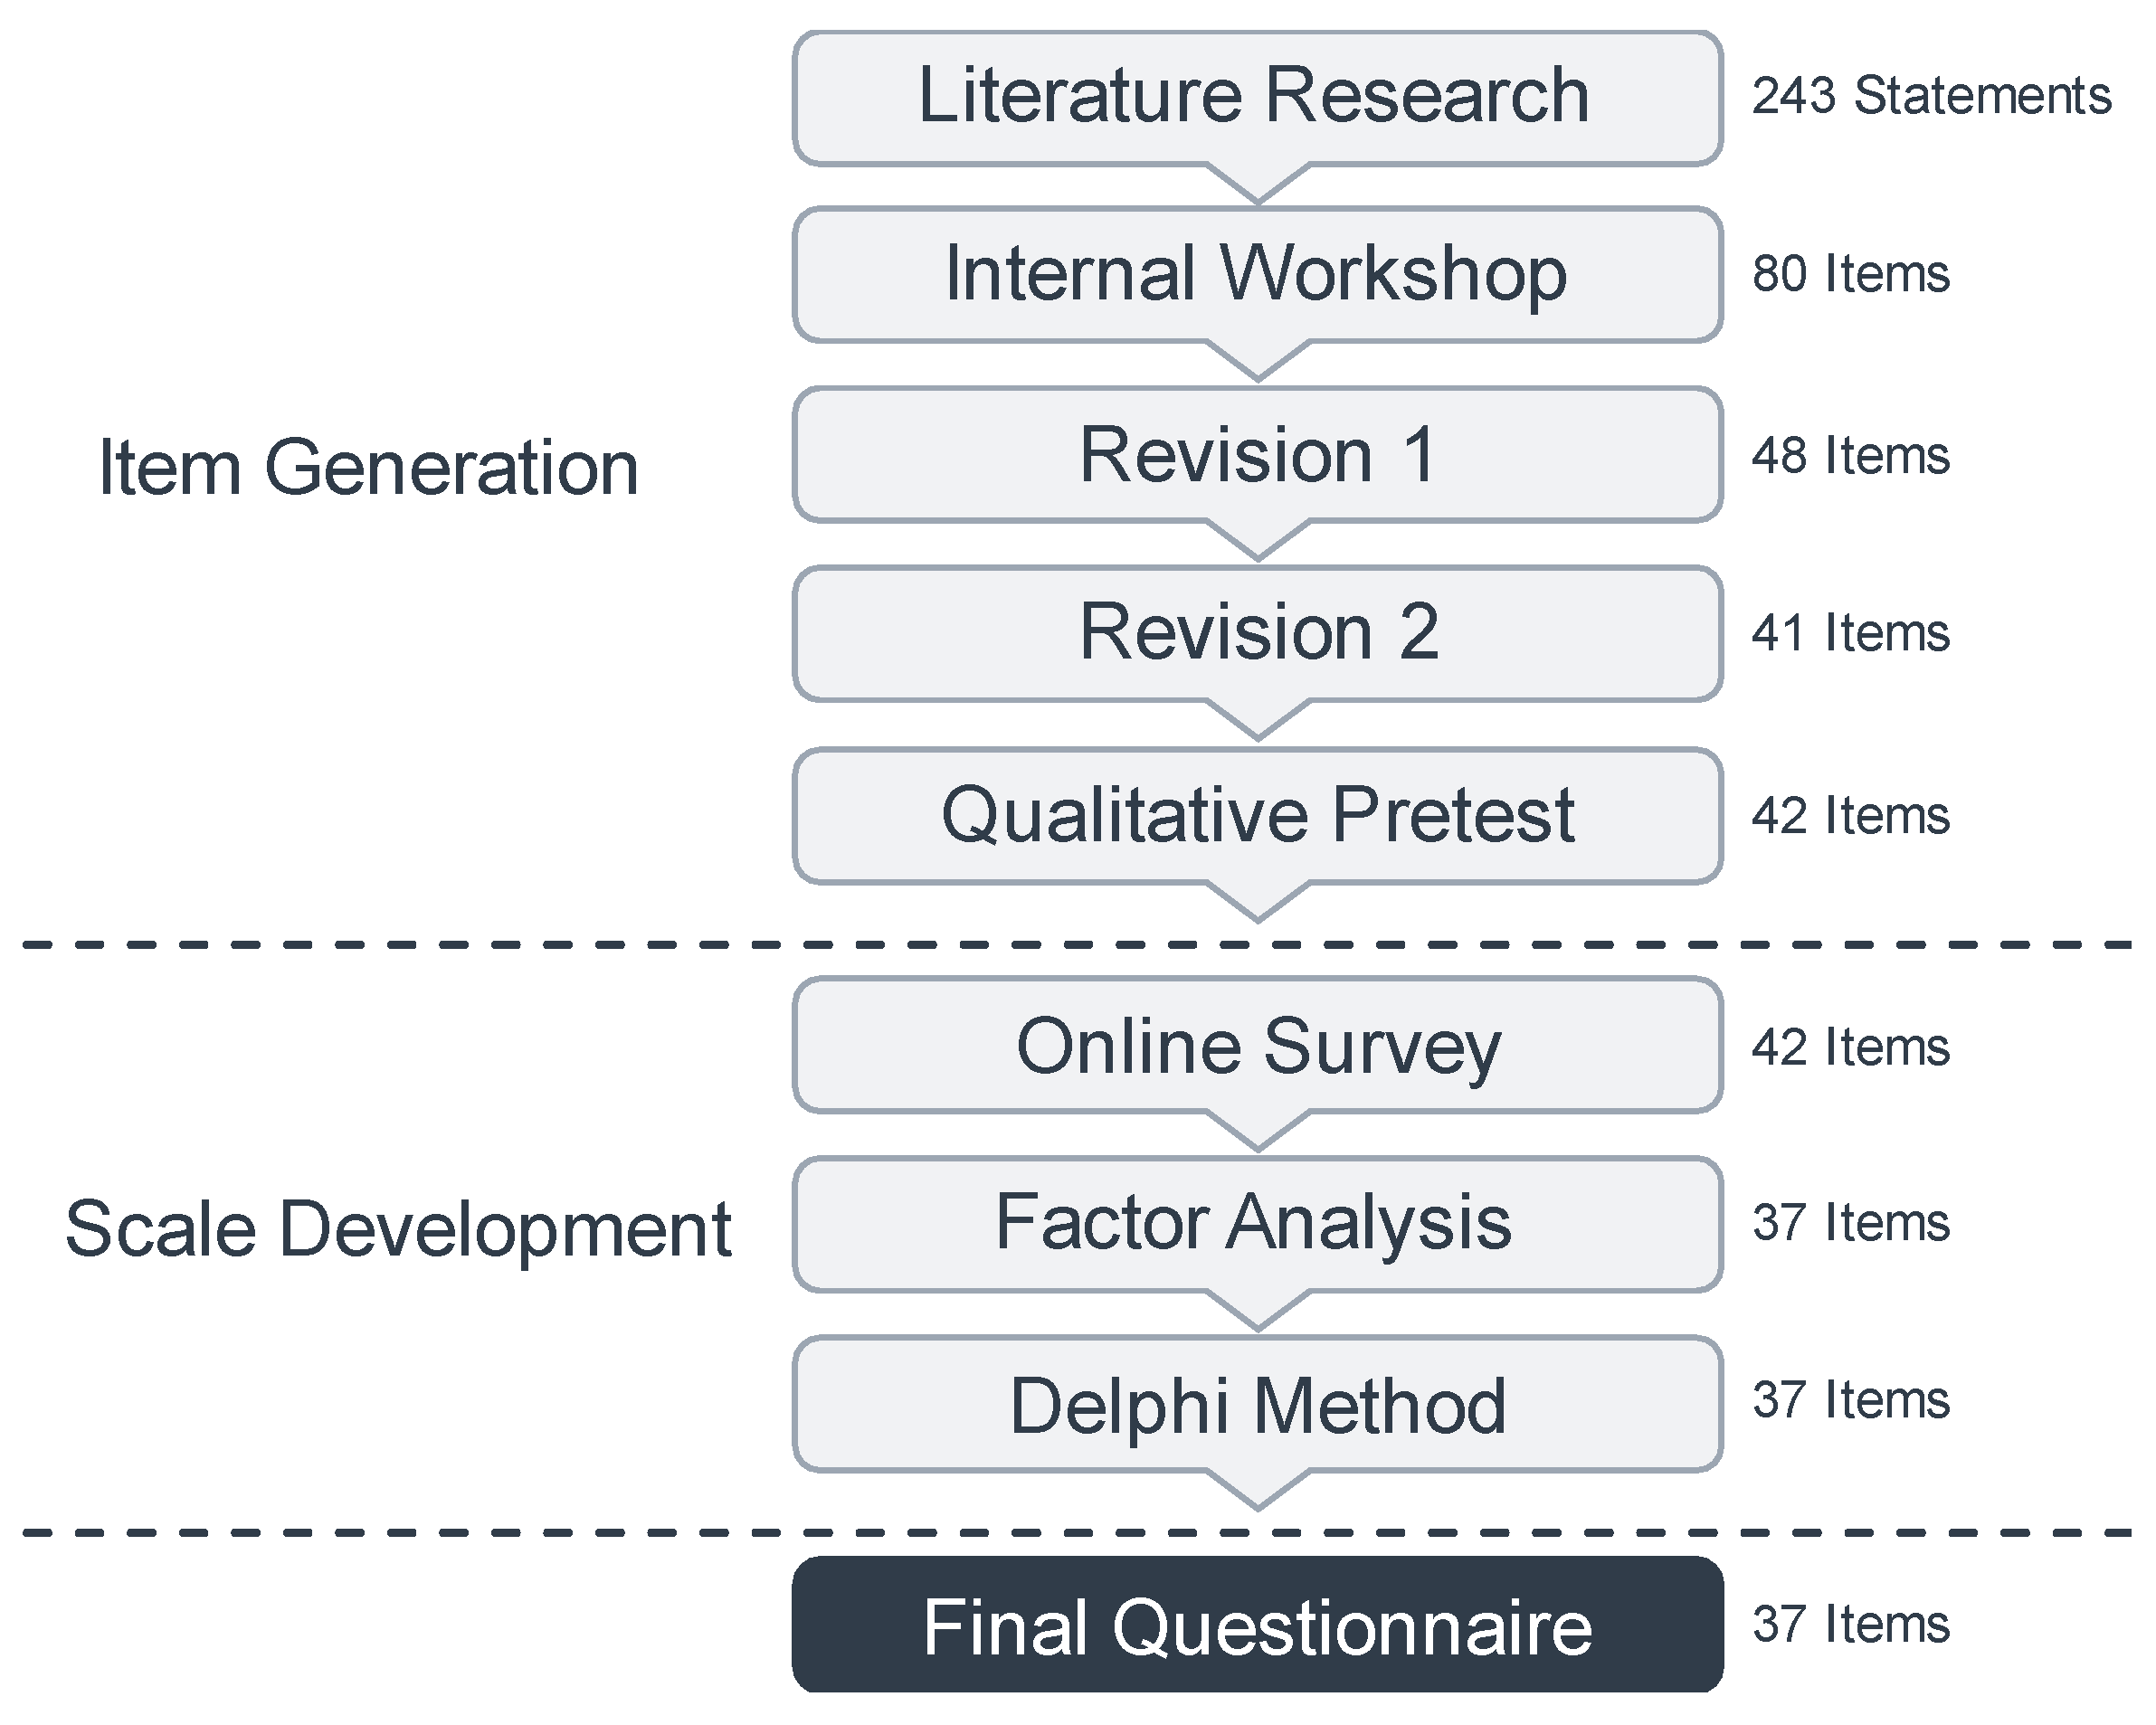
5.1. Generating an Item Pool

By applying a similar approach to Rothhämel et al. [61] and Richardson et al. [56], a literature review was initially conducted. The objective was to consider all possible aspects of AUIs and to obtain a broad basis for the formulation of items. In total, 243 statements regarding the characteristics and properties of AUIs were derived from multiple application areas such as health care, web applications and the automotive sector. Consideration of different areas should ensure that all relevant properties are considered. During an internal workshop, the authors of this paper reviewed the statements for redundancies and clustered them thematically. Based on this step, a first item pool consisting of 80 items was generated.

5.2. Item Revision

5.2.1. Expert Workshop 1

For the first revision of the item pool, an expert workshop was conducted via an online conference and virtual sticky notes on the collaboration platform Miro [63] shown in Figure 5. The goal of the workshop was to review the content and completeness of the item pool, reduce the total number of items and review the wording of the individual items regarding understandability and accuracy.
Five participants took part in the expert workshop (4 female, 1 male). The participants were recruited from the Chair of Automotive Engineering at the Technical University of Munich and were considered to be experts in the field of automotive human–machine interaction and AUIs. The average age was 27.8 (SD = 3.7) and the experience in the respective fields varied between one and ten years (M = 4.2, SD = 3.5). Furthermore, two participants reported having previous experience with questionnaire construction.
After a brief introduction to the topic and the goals, the participants were asked to vote on each item to keep, remove or rephrase it. A comment was required when an item was voted for revision or rewording. The workshop lasted for approximately 2 h. As a result, 36 items were removed due to redundancies or irrelevance of contents. Another 35 items were adjusted in their wording due to ambiguity or to simplify the language and improve accuracy. The item pool was reduced to 48 items.

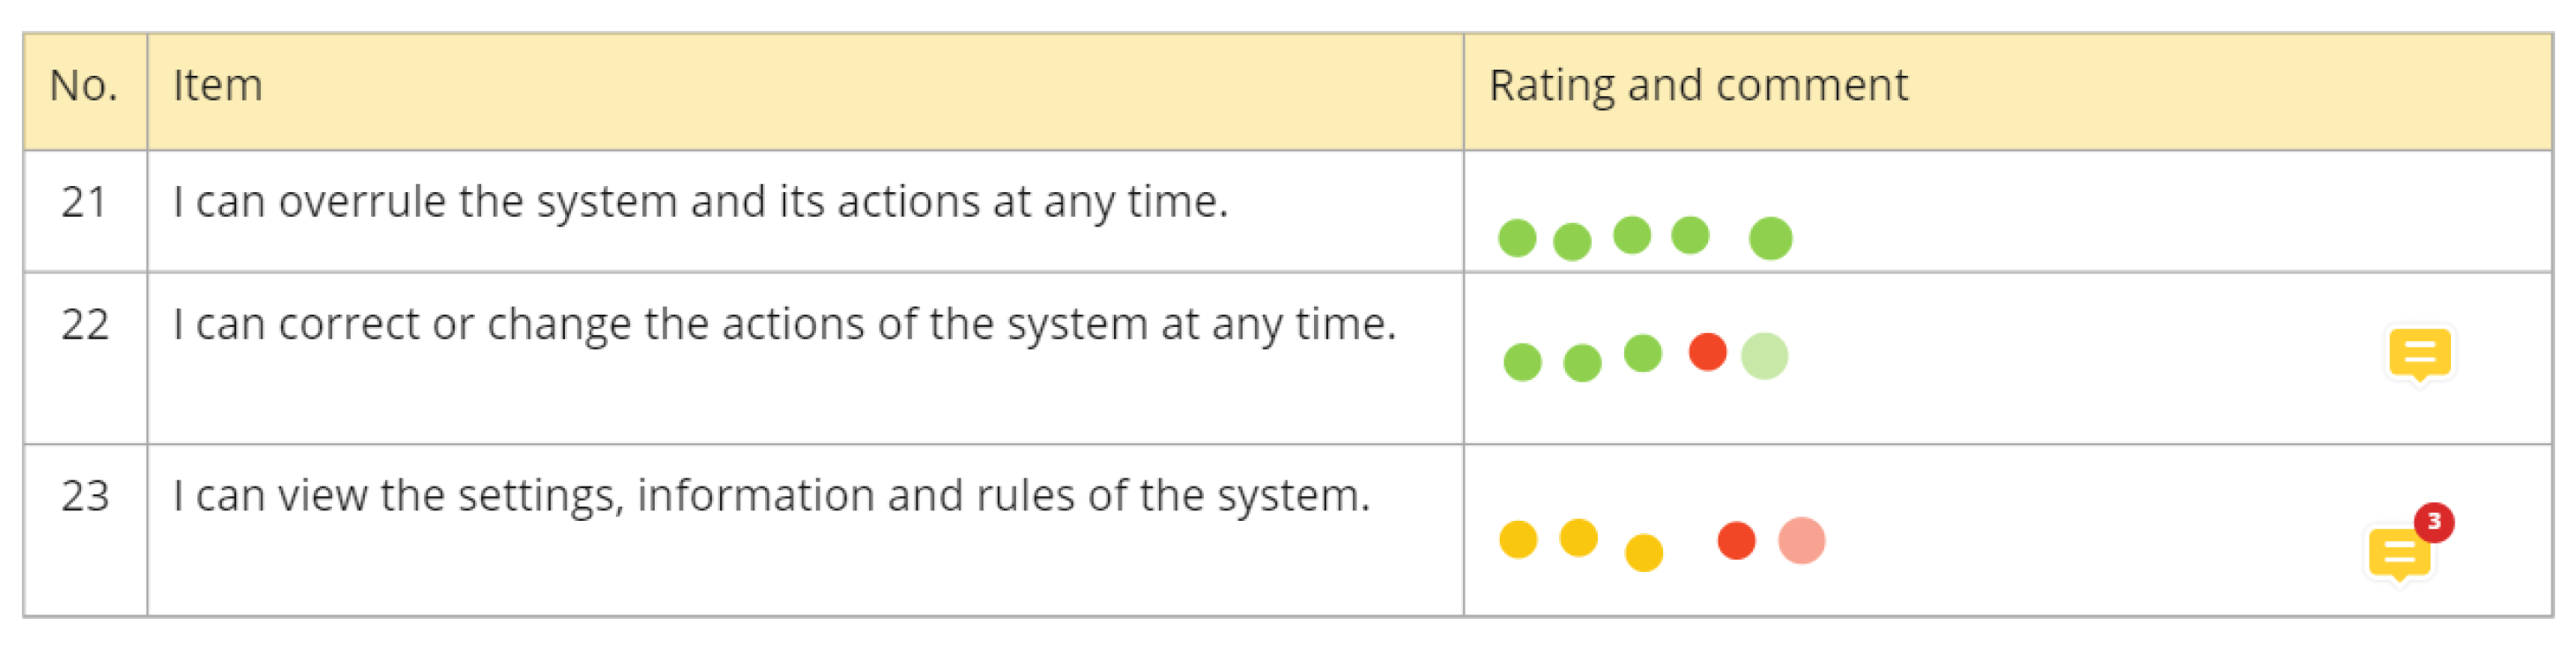
5.2.2. Expert Workshop 2

A second virtual expert workshop was carried out, but with experts from the field of psychology and sociology. The goal of this workshop was to review wording and comprehensibility of the questionnaire’s items again, but with an emphasis on understandability and comparable wording of the individual items in accordance with recommendations from the literature [64].
All three participating experts (100% female) were considered to be experienced with the construction of questionnaires and had an average age of 29.3 years (SD = 4.2). Two participants were recruited from the Technical University of Munich and had prior experience in surveying truck drivers. The other participant was recruited externally and had no experience with truck drivers.
After a short introduction to AUIs, a questionnaire draft containing the 48 items from the previous workshop with a 6-point Likert scale (1—not true at all to 6—fully applies) was discussed. The participants were asked to review the items considering the goals of the workshop and document their remarks on a virtual whiteboard. The results were discussed retrospectively within the group. The workshop lasted for approximately 2 h. The revision resulted in seven eliminations and twelve adjustments. This reduced the item pool to 41.

5.2.3. Qualitative Pretests

After both expert revisions, a preliminary test with truck drivers was conducted to verify the comprehensibility of the items with the actual target group. For this, five truck drivers (100% male, 80% full-time drivers) participated in cognitive interviews, which are used to detect potential problems in the comprehensibility of questions [33]. The paraphrasing method was utilized, meaning the subject was asked to repeat all questions of the questionnaire draft in their own words [65]. Based on the answers, the interviewer assessed if the participant understood the item as intended. Misleading questions were rephrased using the participant’s suggestions.
The test sample participated voluntarily and had an average age of 41.4 years (SD = 12.1). The average annual mileage varied between 10,000 and 125,000 km (M = 51,100, SD = 12,500). Two respondents stated that they worked exclusively in construction site traffic. Two drivers worked both on construction sites and road clearing during winter. One participant stated driving exclusively in long-distance traffic. The interviews took place virtually via an online conference or by telephone. The duration ranged from 39 to 62 min (M = 48, SD = 11.97). A paraphrasing method was utilized during the interviews, meaning the subject was asked to repeat the question in their own words [65]. Based on the answer, the interviewer assesses if the participant understands the item as intended.
The pretest resulted in three adjustments in item wording, as well as the definition of the term “context” in the survey’s introduction. According to four of the five respondents, this term led to misunderstandings, and therefore examples or a more explicit definition was desired. Furthermore, one item was added regarding content validity, resulting in 42 items.

5.3. Data Acquisition

In order to identify the underlying structure of the MM of truck drivers of AUIs, an online survey was carried out containing all 42 items of the previous steps. The participants were recruited via an internal database of the Technical University of Munich which contains contact data of interested truck drivers. Furthermore, participants were acquired in truck-specific online forums as well as a truck parking area in front of the warehouse of an industrial company in Dachau, Germany. All drivers participated voluntarily and could opt in to a prize draw to win one of four vouchers over EUR 20. The average age of the resulting sample of 75 drivers (1% non-binary, 4% female, 95% male) was 47 years (SD = 11), ranging from 27 to 66. For the main traffic type, 28% of the drivers categorized their driving mainly as construction traffic, 17% as distribution traffic, 20% as primarily in long-distance traffic and 35% stated other traffic types such as garbage collection and firefighting traffic. Mean annual mileage was 44,236 km (SD = 57,335).
After initial participant information was presented containing a data privacy statement and the goal of the study, a short video explaining the functionality of an AUI was shown (Figure 6). It contained an abstract description of an AUI for trucks based on previous research [3,7], which explained the system’s functionality in general. The AUI’s schematic representation and basic description is based on a previously conceptualized system which defines the current working phase as the system’s context [7] and presents currently relevant vehicle functions to the driver via dynamic control elements [3].
The items therefore were answered based on a rough description of how an AUI works. Thus, the answers were based on an initial MM of the system which the drivers had, meaning how they think such a system would work without having experience with it. The initial MM was likely formed by a combination of transferred MMs from similar products and the described system behavior.
The completion time of the survey was estimated to be around 10–15 min. All data were anonymized with the exception of voluntarily filled out contact data for the prize draw. The resulting dataset is freely available under Attribution 4.0 International Creative Commons rights [66].

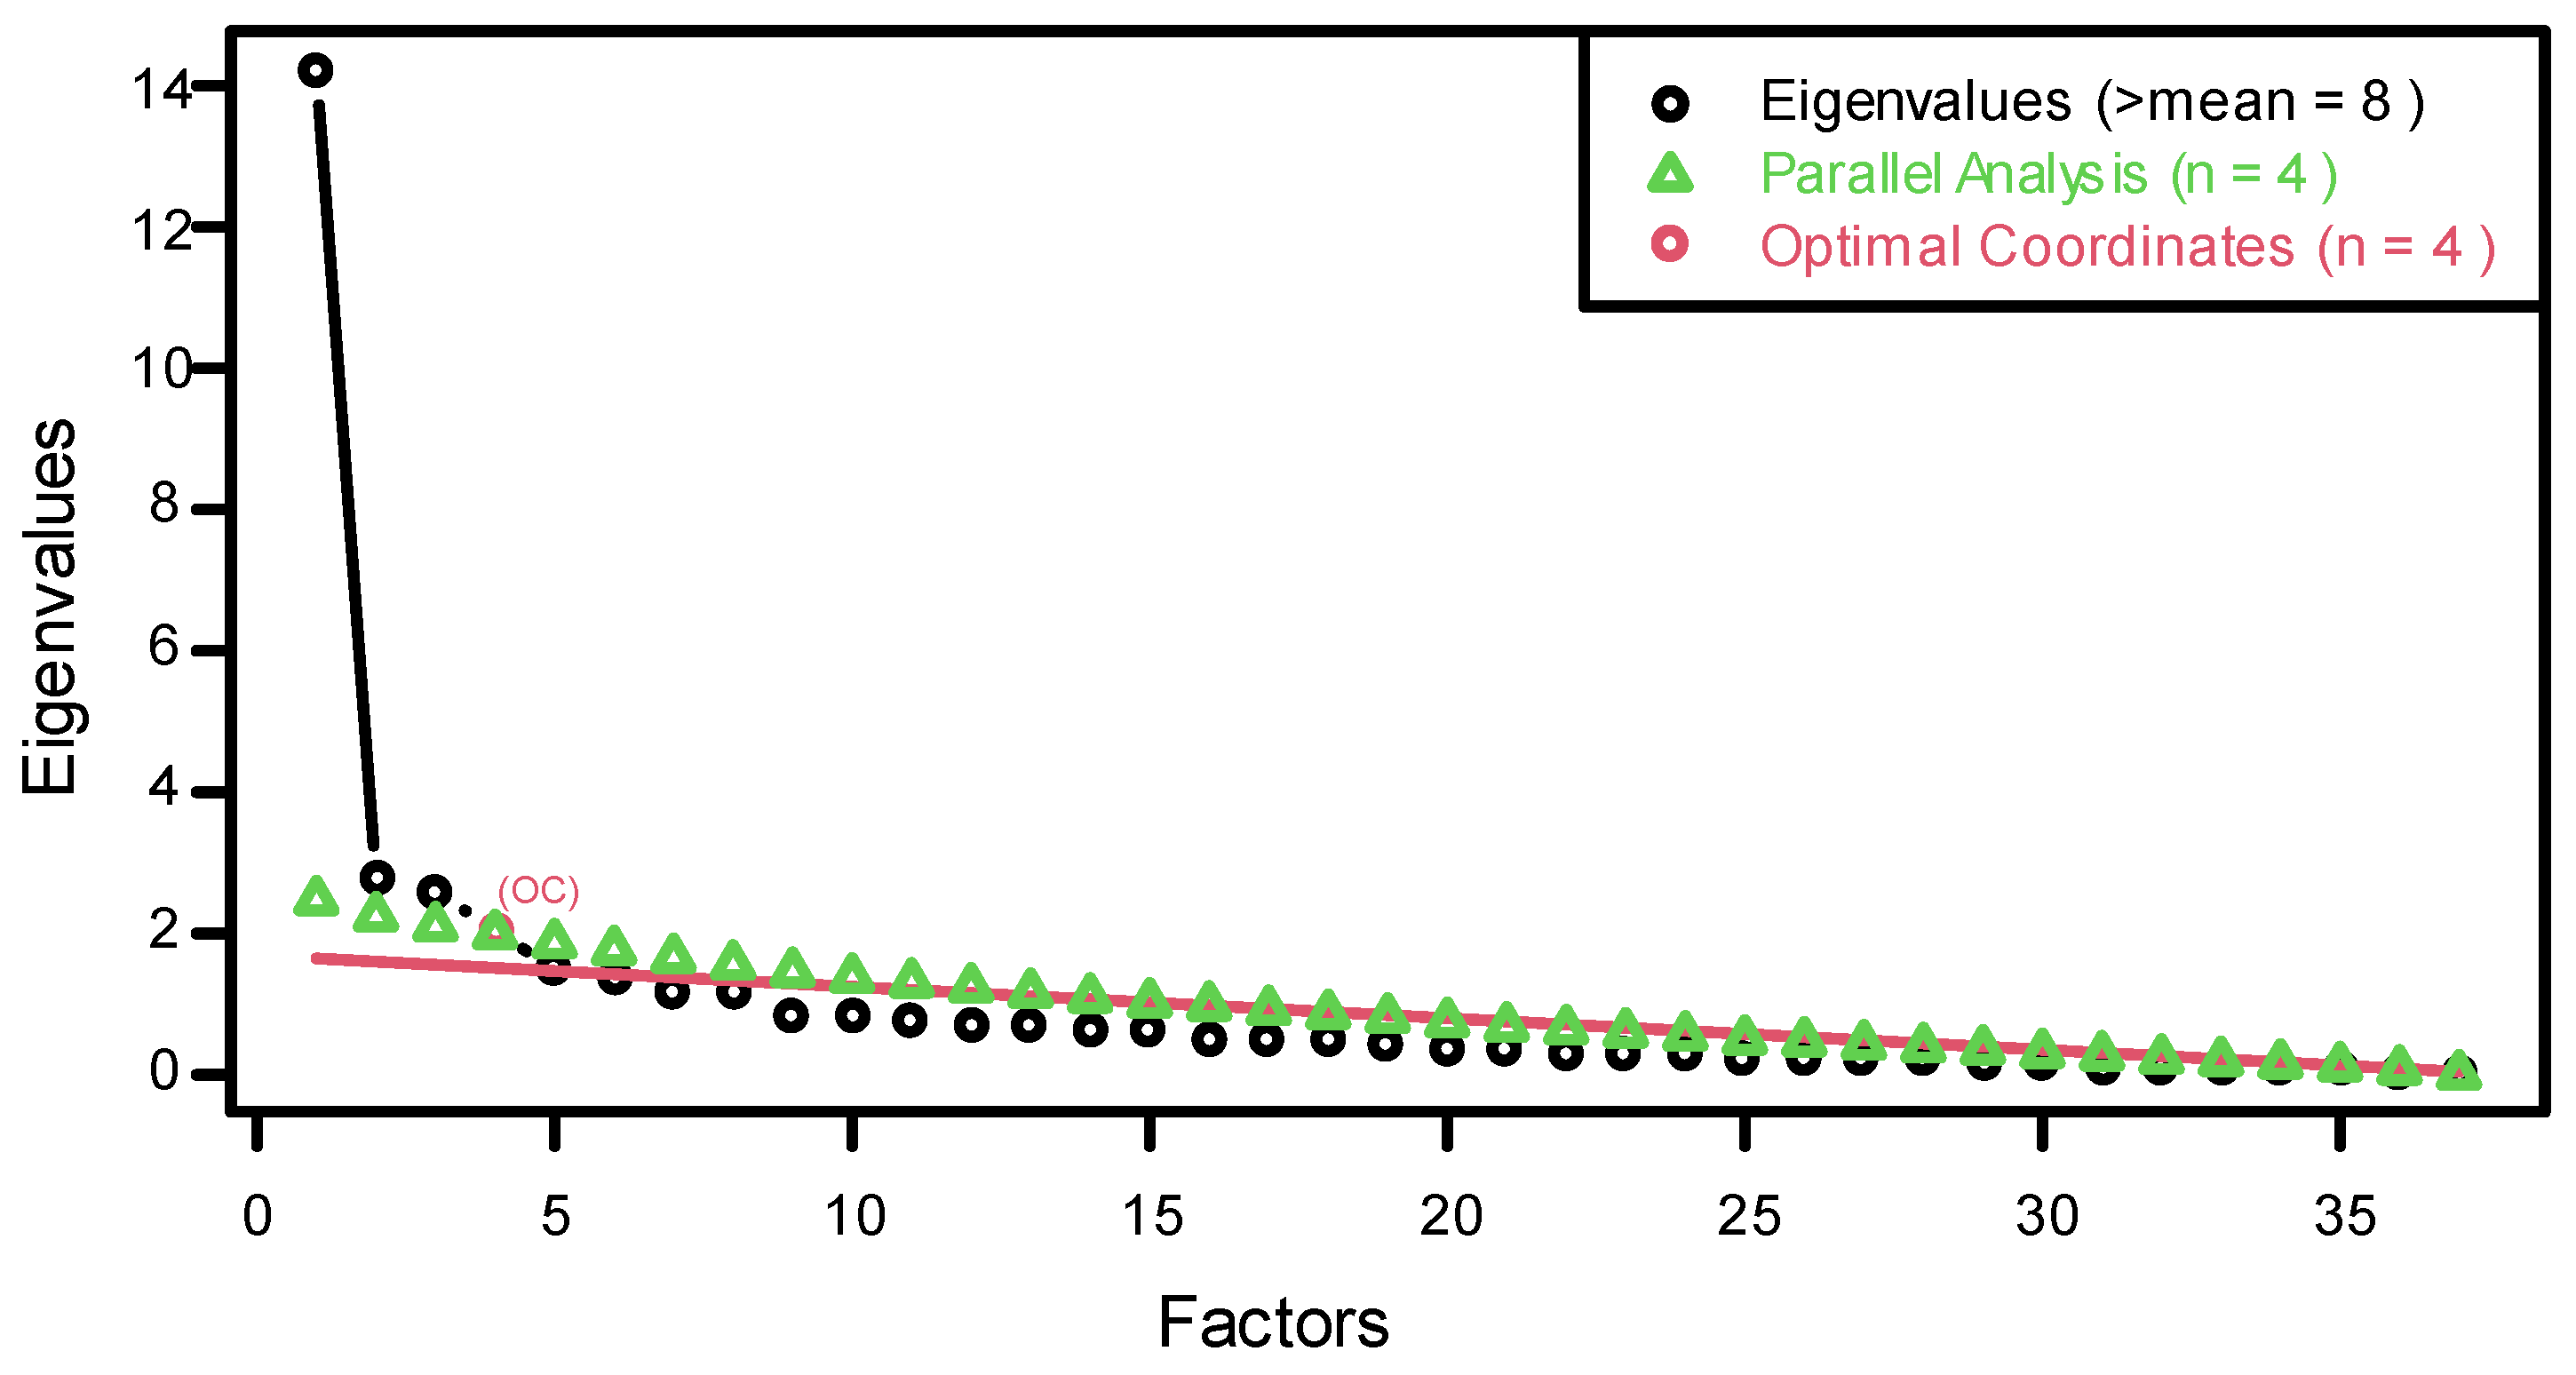
5.4. Factor Analysis

In order to identify underlying structures of the MM, a principal component analysis (PCA) was conducted on the 42-item sample with oblimin rotation. The adequacy of the sample for the analysis was first tested with the Kaiser–Meyer–Olkin (KMO) value and individual item values (MSA).
The KMO verified the sampling adequacy with a value of KMO = 0.78. Five items showed insufficient MSA values (<0.5), requiring them to be excluded from the analysis and subsequently from the questionnaire. The KMO value of the revised questionnaire resulted in an increase in the KMO value up to 0.84. Bartlett’s test for sphericity was significant, χ2 (666) = 2.019 (p < 0.001), confirming that the item correlations were sufficiently large to conduct a PCA. For determining the number of components to be extracted, the Kaiser’s criterion, scree plot and parallel analysis were compared (Figure 7). The Kaiser’s criterion, also called eigenvalues, indicated eight factors. Based on the correspondence of the scree plot and the parallel analysis, as well as content considerations, four factors were extracted for the final analysis.
The factor loadings after the rotation were analyzed. The items with the highest loadings on the same components were clustered. The analysis resulted in one component with twelve items, one with nine items, another component with ten and the last one with six items. All component scales reached high values for reliability, measured as internal consistency by Cronbach’s α and Guttman’s λ shown in Table 1.
The explained variation per factor ranged from 10 to 16% (Table 1). The factor correlations were all positive and relatively low (Table 2).
From the conducted factor analysis, it can therefore be deducted that the underlying MM of the truck drivers consists of four dimensions and can be measured with 37 items. The values of all individual items can be found in Appendix A. The identified factors are moderately correlating, indicating their uniqueness.

5.5. Naming the Dimensions

To name the four identified dimensions, a term is to be found that describes the corresponding items equally well [67]. For this purpose, an iterative, qualitative survey was conducted. The procedure followed the Delphi method, which seeks to find agreement between all participants [67,68]. Four AUI experts participated in the survey (50% female, 50% male). The participants were recruited from a manufacturer of commercial vehicles and were considered to be human–machine interaction experts. The average age was 36.3 years (SD = 5.6) and the experience of the experts in the field of AUIs varied between 3 and 8 years (M = 4.4; SD = 2.4).
The online survey consisted of two iterations and lasted a total of two weeks. In the first iteration, the task was to formulate suitable names and optionally give short descriptions for the presented item groups. For the second iteration, the participants received summaries of the findings, as well as a proposed name to be voted on. The proposed name was formulated by the author, summarizing the experts’ suggestions as accurately as possible. Participants’ responses remained anonymous throughout the survey.
The results of the Delphi survey led to the following named four dimensions of the MM:
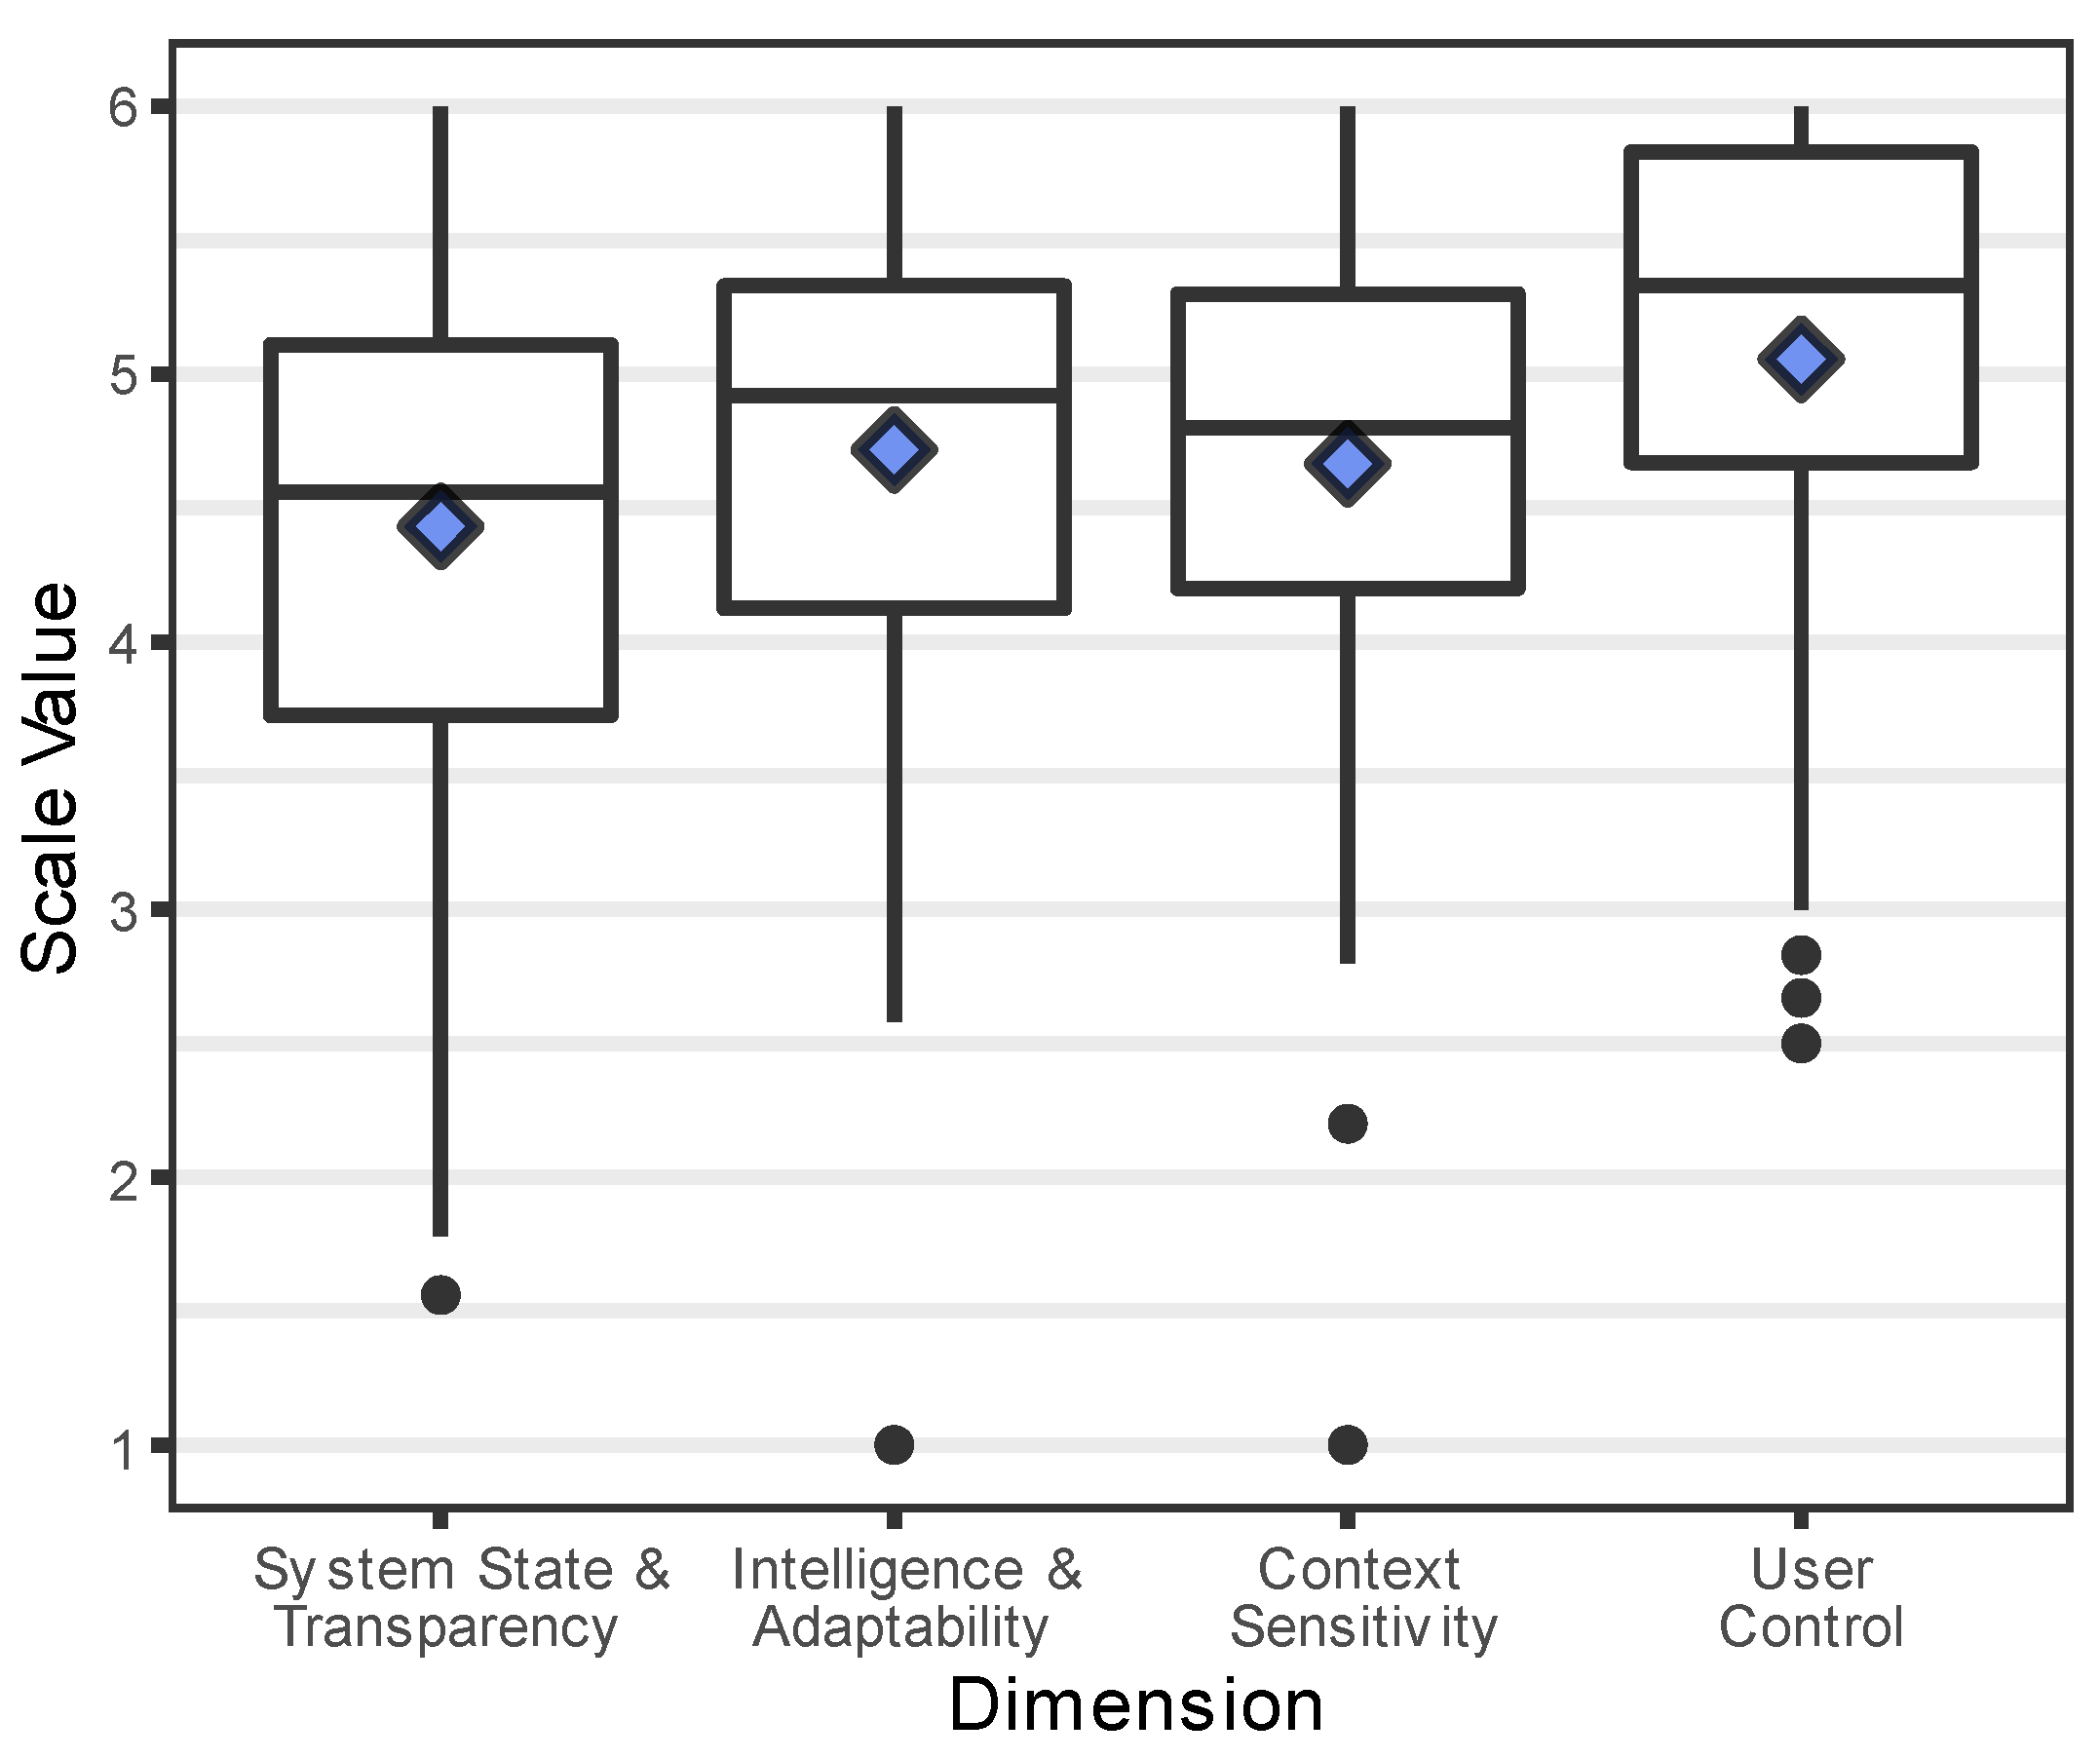
  • Factor 1: System State and Transparency. Describes the user’s MM regarding the transparency of the system and how much information about the system state is visible.
  • Factor 2: Intelligence and Adaptability. Describes how intelligent the user thinks the AUI is, how much it is able to recognize, if it is personalized and how adaptable the system is in general.
  • Factor 3: Context Sensitivity. Reflects the user’s MM regarding the degree of context sensitivity, how the system prioritizes functions and what kind of context is defined.
  • Factor 4: User Control. Represents how much the user thinks the system allows him to be in control and if he can change its behavior manually or access functions via static interaction.

6. RQ3—Initial MM

As established, new products should build upon existing MMs [47,50] and therefore behave as the user expects it to [38]. The framework which presents the solution to RQ1 showed that gaining knowledge about the initial MM of the targeted user group as early as possible during the development phase is crucial.
Fortunately, the questionnaire resulting from RQ2 is able to measure the MM of truck drivers regarding AUIs. The initial MM therefore can also be measured.

6.1. Data Acquisition

The dataset from the same sample described in Section 5.3, which is freely available, [66] was analyzed. This time, only the 37 items which ended up in the final questionnaire and are relevant for the MM’s four dimensions presented in Section 5.5 were computed.
Since the participants only watched a video containing an abstract sketch of the AUI (Figure 6) and a basic description of the system’s functionality, it is assumed that the initial MM was measured analogously to Greenberg et al. [49].

6.2. Resulting MM

The initial MM was determined by calculating the average scores for all 37 items of the four dimensions.
The resulting MM is visualized in Figure 8 with the corresponding descriptive data shown in Table 3.
Since the mean values for all dimensions of the questionnaire lie in the upper half of the scale, it can be derived that the targeted user group of truck drivers generally has high expectations. This is especially true for the MM’s dimensions User Control and Intelligence and Adaptability which feature the highest mean and median values.

7. Discussion

This work investigated how to improve the conformance of MMs and an AUI in early stages of product development by using an AUI for trucks as an example. From this goal, three research questions were derived which are discussed in this section.
RQ1: How to incorporate the user’s mental model into the design and development process of adaptive user interfaces? As identified by previous work, it is possible that the product’s designer and target group have different MMs of how a system works [37,46]. Since the literature also established that it is beneficial to orientate the product to the user’s instead of the developer’s MM [37,47,50], we set out to integrate measures into the development process which incorporate the user’s MM as a starting point.
The proposed approach to answer RQ1 gives designers and developers of AUIs insight into the user’s MM early during the product development phase. This helps the development team to orient the resulting product towards the user’s MM instead of their own MM, which could differ significantly and result in confusion and low usability. Whilst this approach is not limited to AUIs, the biggest benefit is expected for complex products requiring user interaction.
Arguably, the addition of a new step during the product’s development adds complexity and cost to the process. For example, a measuring method is required to determine the initial MM as well as a representative user survey with the target user group. To convince manufacturers to implement this approach, the benefits have to be proven in future work.
RQ2: What underlying dimensions describe the mental model of truck drivers regarding an AUI and how can they be measured? As suggested by the literature, it is beneficial to build upon the user’s MM [46,50], which requires a robust method of measuring it. Previous work turned to questionnaires due to high levels of efficiency and standardization [56,57,58] but focused on the MM’s correctness without exploring underlying dimensions. This work aimed to change that and reveal the structure of truck drivers’ MMs regarding an AUI for commercial vehicles. This was achieved by constructing a questionnaire and analyzing the factors, similar to previous work in the field of user experience evaluations [59,60,62]. A literature review, two workshops with experts in the field of HMI as well as psychology, five interviews and a user survey with a representative sample group consisting of 75 truck drivers and a Delphi method with HMI experts were conducted. This revealed that the user’s MM can be described by four dimensions: System State and Transparency, Intelligence and Adaptability, Context Sensitivity and User Control. From this, it can be derived that design aspects targeting those four aspects will likely influence the user’s understanding of how the system works.
Whilst previous work has shown that the transparency of a system is critical to the user’s MM when interacting with AUIs [2,69], the perceived intelligence and adaptability of a system, as well as its context sensitivity and degree of user control, have not yet been identified in this form. This is also the first work to identify the most important dimensions of a mental model for AUIs used in commercial vehicles.
This work was able to prove the questionnaire’s construct validity, while a validation such as that shown by Hassenzahl et al. [62] to show expected differences between multiple AUIs was not conducted. Furthermore, the questionnaire is only validated in the German language, therefore it is not scientifically applicable in English or other languages [70]. Since the construction was achieved by using a sample of German truck drivers, the transferability to other applications may also be limited. Before deploying the questionnaire in the field of AUIs for personal cars or aviation, a validation of the applicability to differing user groups is advised.
RQ3: What is the initial mental model of truck drivers before interacting with an AUI for commercial vehicles?
The limitations stated for RQ2 are expected to be true for RQ3 since the same questionnaire and sample were used. The results indicate high expectations towards AUIs in general, which is consistent with previous findings [30]. In particular, the MM scales User Control and Intelligence and Adaptability were rated highly, indicating that the user group expects such a system to let them always be in control. Furthermore, maybe due to interactions with personal cars or consumer electronic products, the drivers expect such a system to behave intelligently and adapt to their needs. For the development of an AUI, designers and developers therefore should focus on giving the user a feeling of being in control and on implementing robust, intelligent algorithms.
Whilst the users were instructed to rate the items based on how they think such a system works, it cannot be ruled out that the users were influenced by their wishes towards such a system. In addition, while it was shown before that the initial MM can be obtained based on system descriptions and sketches [49], it cannot be excluded that individual subjects may have had problems understanding the AUI presented to them in the video format. While the average age of the participating subjects (47 years) is similar to that found in broader studies of truck drivers [71], the sample in this study may differ from the overall population of truck drivers in other respects. For example, since participation was voluntary, an above-average number of truck drivers with an interest in new technology may have participated in the study and thus influenced the results. Additionally, it cannot be ruled out that truck drivers with rare and highly specialized use cases, such as airport tanker trucks, did not participate in the study. Future work should therefore validate the results based on physical prototypes and include a larger sample to include drivers with uncommon use cases.

8. Conclusions

In this work, an approach to minimize the risk of gaps between the user’s MM and a product to be developed was shown by considering the user’s initial MM in early development phases. In contrast to prior work, we suggest not only measuring the correctness of the user’s MM, but also identifying the underlying dimensions of the user’s MM, since more profound actions to improve the product can be derived from this.
The process was illustrated using the example of an AUI for commercial vehicles, which to date only exists as a concept. For this purpose, the underlying structure of the user’s MM was identified by constructing a questionnaire consisting of 37 items for this use case. This was achieved by forming and revising items and conducting an online survey with N = 75 participating truck drivers, who were shown an abstract description of how the system would work and behave. A subsequent factor analysis and Delphi method showed that truck drivers’ MM regarding an AUI for commercial vehicles can be described in four dimensions: System State and Transparency, Intelligence and Adaptability, Context Sensitivity and User Control. The results for the first MM show that the user group has high expectations, especially with regard to User Control and Intelligence and Adaptability. It is therefore essential to take this into account when designing an AUI for commercial vehicles in order to avoid a gap between the initial MM of the user group and the subsequent product.
While the approach worked for the highly specific use case of an AUI for commercial vehicles with the user group of truck drivers, the transferability of the questionnaire to other fields may be restricted. Therefore, the transferability other domains should be explored in future research.

Author Contributions

As first author, L.S., initiated the research and writing process, conducted the literature review, proposed the development process and instructed the questionnaire construction by setting the necessary framework conditions. C.G.v.d.H. constructed the questionnaire and carried out the user survey, including data collection and analysis, and contributed to the literature research and the writing process. A.S. advised the questionnaire construction and critically revised the content of this work. F.D. made an essential contribution to the conception of the research project. He critically revised the paper for important intellectual content. F.D. gave final approval of the version to be published and agrees to all aspects of the work. As a guarantor, he accepts responsibility for the overall integrity of the paper. This research was funded by MAN Truck & Bus SE. All authors have read and agreed to the published version of the manuscript.

Funding

This research was funded by MAN Truck & Bus SE.

Institutional Review Board Statement

The study was conducted according to the guidelines of the Declaration of Helsinki. Ethical review and approval were waived for this study as no ethical issues were involved (e.g., no vulnerable populations, no collection of sensitive issues, no distressing situations, invasive activities or collection of biological materials).

Informed Consent Statement

Informed consent was obtained from all subjects involved in the study.

Data Availability Statement

The questionnaire’s dataset is freely available under Attribution 4.0 International Creative Commons rights [66].

Acknowledgments

Special thanks go to Stephan Haug, Svenja Escherle, Julius Pfadt and Selina Kim who contributed to design of the study and statistical analysis.

Conflicts of Interest

The authors declare no conflict of interest.

Appendix A

This section of the Appendix contains the four identified dimensions of the users’ MM with the corresponding item wording as well as statistical metrics.
Table A1. Items of Factor 1 “System State and Transparency”.
ItemItem WordingFactor
Loading
Item
Difficulty
Item
Discrimination
1The adaptive system provides reasons for its actions.0.643.60.68
2I can view the sensor data that the adaptive system uses to recognize the context.0.373.80.42
3The adaptive system shows me how automatically it adapts: Whether it adapts in a fully automated way, needs my confirmation, or only presents me with a selection of functions.0.824.60.73
4The adaptive system announces its changes to me.0.735.00.68
5When a vehicle function is executed, other similar vehicle functions are suggested to me.0.474.10.61
6The adaptive system informs me which vehicle functions are currently active.0.745.10.61
7Context recognition is performed with a high degree of accuracy.0.364.70.53
8The adaptive system shows me how confident it is in recognizing the current context.0.794.10.67
9The adaptive system informs me about the current context.0.804.90.73
Table A2. Items of Factor 2 “Intelligence and Adaptability”.
ItemItem WordingFactor
Loading
Item
Difficulty
Item
Discrimination
1The adaptive system quickly adapts to the current context.0.450.500.71
2I can operate all vehicle functions with the adaptive control system.0.474.70.48
3Vehicle functions that I have used more often at a particular time are suggested to me again at the same time.0.814.30.60
4Vehicle functions that I last used are suggested to me.0.614.70.64
5Vehicle functions that I use frequently are suggested to me.0.615.00.78
6Safety-relevant vehicle functions are displayed preferentially.0.395.20.56
7I can define which vehicle functions should no longer be suggested to me in the future.0.634.80.68
8If I have rejected vehicle functions several times in the same situation, they will no longer be suggested to me.0.744.00.50
9If I sustainably change my behavior, the adaptive control system recognizes this and adapts to it.0.504.60.69
10The adaptive system recognizes new contexts that have not occurred before.0.594.60.75
11The adaptive system automatically creates a personal user profile.0.634.60.65
12My user profile can also be transferred to other vehicles with the adaptive system.0.714.90.71
Table A3. Items of Factor 3 “Context Sensitivity”.
ItemItem WordingFactor
Loading
Item
Difficulty
Item
Discrimination
1When I use the adaptive system for the first time, it asks me about my preferences, e.g., whether I like to use a particular vehicle function.0.564.40.70
2The adaptive system uses sensor data from the vehicle’s environment to recognize the context (e.g., GPS location, engine speed, road type, weather, traffic density).0.734.90.75
3During my workday, the adaptive system frequently switches between recognized contexts.0.784.50.64
4Depending on the context, the appearance of the adaptive system changes.0.624.70.65
5The number of vehicle functions changes with the current context.0.724.60.66
6The adaptive system recognizes how demanding the situation is for me and adapts to it.0.543.70.52
7Vehicle functions that are relevant in the current context are suggested to me.0.454.90.65
8Vehicle functions that I have saved as favorites are suggested to me.0.375.10.62
9Vehicle functions that are urgent in terms of time are displayed preferentially.0.685.00.64
10Vehicle functions that are not relevant within the context are hidden by the adaptive control system.0.544.90.57
Table A4. Items of Factor 4 “User Control”.
ItemItem WordingFactor
Loading
Item
Difficulty
Item
Discrimination
1Certain areas of the adaptive system remain unchanged in the same place.0.645.00.61
2I can override the adaptive system and its actions at any time.0.645.50.65
3I can view the rules of the adaptive system.0.594.70.59
4I can change the rules of the adaptive system.0.514.80.66
5I can change how automatically the adaptive system adapts at any time (e.g., functions are executed automatically by the system or must first be confirmed by me).0.765.00.76
6I can also call up vehicle functions that are not suggested to me by the adaptive system.0.625.30.63

References

  1. Flaspöler, E.; Hauke, A.; Pappachan, P. The Human Machine Interface as an Emerging Risk; Publications Office: Luxembourg, 2010; ISBN 978-92-9191-300-8. [Google Scholar]
  2. Walter, N. Personalization and Context-Sensitive User Interaction of in-Vehicle Infotainment Systems. Ph.D. Dissertation, Technische Universität München, München, Germany, 2018. [Google Scholar]
  3. Schölkopf, L.; Wolf, M.-M.; Hutmann, V.; Diermeyer, F. Conception, Development and First Evaluation of a Context-Adaptive User Interface for Commercial Vehicles. In Proceedings of the 13th International Conference on Automotive User Interfaces and Interactive Vehicular Applications, AutomotiveUI ’21, Leeds, UK, 9–14 September 2021; ACM: New York, NY, USA, 2021; pp. 21–25, ISBN 9781450386418. [Google Scholar]
  4. Hartmann, M. Challenges in Developing User-Adaptive Intelligent User Interfaces. In 17th Workshop on Adaptivity and User Modeling in Interactive Systems; Hauger, D., Köck, M., Nauerz, A., Eds.; Gesellschaft für Informatik e.V.: Darmstadt, Germany, 2009. [Google Scholar]
  5. National Highway Traffic Safety Administration. Traffic Safety Facts: 2019 Data; DOT HS 813 110; US Department of Transportation: Washington, DC, USA, 2021. Available online: https://crashstats.nhtsa.dot.gov/Api/Public/ViewPublication/813110 (accessed on 20 December 2021).
  6. Class, U. Sicheres automatisiertes Fahren braucht System. ATZ Automobiltech. Z. 2019, 121, 82. [Google Scholar] [CrossRef]
  7. Schölkopf, L.; Kneuper, A.; Hutmann, V.; Diermeyer, F. Methods for Reducing the Complexity of Driving Workplaces in Commercial Vehicles. In Advances in Human Aspects of Transportation; Stanton, N., Ed.; Springer International Publishing: Cham, Switzerland, 2021; pp. 34–44. ISBN 978-3-030-80011-6. [Google Scholar]
  8. Garzon, S.R. Intelligent In-Car-Infotainment Systems: A Contextual Personalized Approach. In Proceedings of the 8th International Conference on Intelligent Environments (IE), Guanajuato, Mexico, 26–29 June 2012; IEEE: Piscataway, NJ, USA, 2012; pp. 315–318, ISBN 978-1-4673-2093-1. [Google Scholar]
  9. Hanisch, S. Nach Tesla-Unfall: Gericht Verbietet Touchscreen-Bedienung. BR24 [Online]. 6 August 2020. Available online: https://www.br.de/nachrichten/wirtschaft/nach-tesla-unfall-gericht-verbietet-touchscreen-bedienung,S6nsrLT (accessed on 30 October 2020).
  10. Ahram, T.Z.; Falcão, C. (Eds.) Advances in Usability, User Experience and Assistive Technology; Springer International Publishing: Cham, Switzerland, 2019; ISBN 978-3-319-94946-8. [Google Scholar]
  11. Hancock, P.A.; Chignell, M.H. Mental workload dynamics in adaptive interface design. IEEE Trans. Syst. Man Cybern. 1988, 18, 647–658. [Google Scholar] [CrossRef]
  12. Gajos, K.Z.; Everitt, K.; Tan, D.S.; Czerwinski, M.; Weld, D.S. Predictability and accuracy in adaptive user interfaces. In Proceedings of the Twenty-Sixth Annual CHI Conference on Human Factors in Computing Systems—CHI ’08, Florence, Italy, 5–10 April 2008; Czerwinski, M., Lund, A., Tan, D., Eds.; ACM Press: New York, NY, USA, 2008; p. 1271, ISBN 9781605580111. [Google Scholar]
  13. Alvarez-Cortes, V.; Zayas-Perez, B.E.; Zarate-Silva, V.H.; Ramirez Uresti, J.A. Current Trends in Adaptive User Interfaces: Challenges and Applications. In Electronics, Robotics and Automotive Mechanics Conference (CERMA 2007), Cuernavaca, Morelos, Mexico, 25–28 September 2007; IEEE: Piscataway, NJ, USA, 2007; pp. 312–317. ISBN 0-7695-2974-7. [Google Scholar]
  14. Findlater, L.; McGrenere, J. Impact of screen size on performance, awareness, and user satisfaction with adaptive graphical user interfaces. In Proceedings of the Twenty-Sixth Annual CHI Conference on Human Factors in Computing Systems—CHI ’08, Florence, Italy, 5–10 April 2008; Czerwinski, M., Lund, A., Tan, D., Eds.; ACM Press: New York, NY, USA, 2008; p. 1247, ISBN 9781605580111. [Google Scholar]
  15. Hutchison, D.; Kanade, T.; Kittler, J.; Kleinberg, J.M.; Mattern, F.; Mitchell, J.C.; Naor, M.; Nierstrasz, O.; Pandu Rangan, C.; Steffen, B.; et al. (Eds.) Human-Computer Interaction. HCI Intelligent Multimodal Interaction Environments; Springer: Berlin/Heidelberg, Germany, 2007; ISBN 978-3-540-73108-5. [Google Scholar]
  16. Wesson, J.L.; Singh, A.; van Tonder, B. Can Adaptive Interfaces Improve the Usability of Mobile Applications? In Human-Computer Interaction; Forbrig, P., Paternó, F., Mark Pejtersen, A., Eds.; Springer: Berlin/Heidelberg, Germany, 2010; pp. 187–198. ISBN 978-3-642-15230-6. [Google Scholar]
  17. Findlater, L.; Gajos, K.Z. Design Space and Evaluation Challenges of Adaptive Graphical User Interfaces. AIMag 2010, 30, 68. [Google Scholar] [CrossRef] [Green Version]
  18. Paymans, T.F.; Lindenberg, J.; Neerincx, M. Usability trade-offs for adaptive user interfaces. In Proceedings of the 9th international conference on Intelligent user interfaces, Funchal, Portugal, 13–16 January 2004; Vanderdonckt, J., Ed.; ACM: New York, NY, USA, 2004; p. 301, ISBN 1581138156. [Google Scholar]
  19. Norman, D.A. Living with Complexity; MIT Press: Cambridge, MA, USA, 2011; ISBN 0262014866. [Google Scholar]
  20. Maria, S. Informationsmanagement im Nutzfahrzeug. Ph.D. Dissertation, Technische Universität München, München, Germany, 2013. [Google Scholar]
  21. Stecher, M.W. Ergonomische Gestaltung und Bewertung Berührungsfreier Gestensteuerungen für Nutzfahrzeuge. Ph.D. Dissertation, Technische Universität München, Garching, Germany, 2019. [Google Scholar]
  22. Meixner, G.; Häcker, C.; Decker, B.; Gerlach, S.; Hess, A.; Holl, K.; Klaus, A.; Lüddecke, D.; Mauser, D.; Orfgen, M.; et al. Retrospective and Future Automotive Infotainment Systems—100 Years of User Interface Evolution. In Automotive User Interfaces; Meixner, G., Müller, C., Eds.; Springer International Publishing: Cham, Switzerland, 2017; pp. 3–53. ISBN 978-3-319-49447-0. [Google Scholar]
  23. Zimmermann, G.; Vanderheiden, G.C.; Strobbe, C. Towards Deep Adaptivity—A Framework for the Development of Fully Context-Sensitive User Interfaces. In Universal Access in Human-Computer Interaction. Design and Development Methods for Universal Access; Hutchison, D., Kanade, T., Kittler, J., Kleinberg, J.M., Kobsa, A., Mattern, F., Mitchell, J.C., Naor, M., Nierstrasz, O., Pandu Rangan, C., et al., Eds.; Springer International Publishing: Cham, Switzerland, 2014; pp. 299–310. ISBN 978-3-319-07436-8. [Google Scholar]
  24. Rodriguez Garzon, S. Kontextsensitive Personalisierung automotiver Benutzerschnittstellen. Ph.D. Dissertation, Technische Universität Berlin, Berlin, Germany, 2013. [Google Scholar]
  25. Ablaßmeier, M. Multimodales, kontextadaptives Informationsmanagement im Automobil. Ph.D. Dissertation, Technische Universität München, München, Germany, 2009. [Google Scholar]
  26. Walthart, G. EQS with Unique MBUX Hyperscreen: The Big in-Car Cinema. An Assistant for the Driver and Front Passenger Who is Constantly Learning, Thanks to Artificial Intelligence. 2021. Available online: https://media.daimler.com/marsMediaSite/ko/en/48584064 (accessed on 8 April 2021).
  27. Thomasen, F. First of a New Breed: Ford Mustang Mach-E Ready to Accelerate Zero-Emission Driving Thrills and Bring on Tomorrow. Available online: https://media.ford.com/content/fordmedia/feu/en/news/2020/12/09/first-of-a-new-breed--ford-mustang-mach-e-ready-to-accelerate-ze.html (accessed on 8 April 2021).
  28. Walter, N.; Kaplan, B.; Altmüller, T.; Bengler, K. Erhöhung der Transparenz eines adaptiven Empfehlungsdiensts. In Mensch und Computer 2015—Workshopband; Weisbecker, A., Burmester, M., Schmidt, A., Eds.; De Gruyter: Berlin, Germany, 2015; pp. 475–482. ISBN 9783110443905. [Google Scholar]
  29. Bauer, C.; Dey, A.K. Considering context in the design of intelligent systems: Current practices and suggestions for improvement. J. Syst. Softw. 2016, 112, 26–47. [Google Scholar] [CrossRef]
  30. Gena, C. Methods and techniques for the evaluation of user-adaptive systems. Knowl. Eng. Rev. 2005, 20, 1–37. [Google Scholar] [CrossRef]
  31. Lavie, T.; Meyer, J. Benefits and costs of adaptive user interfaces. Int. J. Hum.-Comput. Stud. 2010, 68, 508–524. [Google Scholar] [CrossRef]
  32. Gajos, K.Z.; Chauncey, K. The Influence of Personality Traits and Cognitive Load on the Use of Adaptive User Interfaces. In Proceedings of the 22nd International Conference on Intelligent User Interfaces, IUI’17, Limassol, Cyprus, 13 March 2017; Papadopoulos, G.A., Kuflik, T., Chen, F., Duarte, C., Fu, W.-T., Eds.; ACM: New York, NY, USA, 2017; pp. 301–306, ISBN 9781450343480. [Google Scholar]
  33. DIN EN ISO 9241-112:2017-08; Ergonomie der Mensch-System-Interaktion—Teil 112: Grundsätze der Informationsdarstellung (ISO 9241-112:2017); Deutsche Fassung EN ISO 9241-112:2017. Beuth Verlag GmbH: Berlin, Germany, 2017.
  34. Simons, D.J.; Chabris, C.F. Gorillas in our midst: Sustained inattentional blindness for dynamic events. Perception 1999, 28, 1059–1074. [Google Scholar] [CrossRef]
  35. Bader, R.; Siegmund, O.; Woerndl, W. A study on user acceptance of proactive in-vehicle recommender systems. In Proceedings of the 3rd International Conference on Automotive User Interfaces and Interactive Vehicular Applications—AutomotiveUI ’11, Salzburg, Austria, 30 November–2 December 2011; Tscheligi, M., Ed.; ACM Press: New York, NY, USA, 2011; p. 47, ISBN 9781450312318. [Google Scholar]
  36. Wright, A.P.; Wang, Z.J.; Park, H.; Guo, G.; Sperrle, F.; El-Assady, M.; Endert, A.; Keim, D.; Chau, D.H. A Comparative Analysis of Industry Human-AI Interaction Guidelines. 2020. Available online: http://arxiv.org/pdf/2010.11761v1 (accessed on 20 December 2021).
  37. Cooper, A.; Reimann, R.; Cronin, D. About Face 3: The Essentials of Interaction Design; Completely rev. and updated; Wiley: Indianapolis, IN, USA, 2007; ISBN 978-0470084113. [Google Scholar]
  38. Vollrath, M.; Leplow, B.; Selg, H. Ingenieurpsychologie: Psychologische Grundlagen und Anwendungsgebiete; 1. Aufl.; Kohlhammer: Stuttgart, Germany, 2015; ISBN 9783170226203. [Google Scholar]
  39. Schilling, T. Mentale Modelle der Benutzer von Fahrerinformationssystemen. Ph.D. Thesis, Humboldt-Universität zu Berlin, Berlin, Germany, 2008. [Google Scholar]
  40. Streitz, N.A. Learning Issues for Intelligent Tutoring Systems; Springer: New York, NY, USA, 1988. [Google Scholar]
  41. Silva, S.S.; Hansman, R.J. Divergence between Flight Crew Mental Model and Aircraft System State in Auto-Throttle Mode Confusion Accident and Incident Cases. J. Cogn. Eng. Decis. Mak. 2015, 9, 312–328. [Google Scholar] [CrossRef] [Green Version]
  42. Blömacher, K.; Nöcker, G.; Huff, M. The evolution of mental models in relation to initial information while driving automated. Transp. Res. Part F Traffic Psychol. Behav. 2020, 68, 198–217. [Google Scholar] [CrossRef]
  43. Lyons, K. Two People Killed in Fiery Tesla Crash with No One Driving: Authorities Said it Took Four Hours to Extinguish the Fire. 2021. Available online: https://www.theverge.com/2021/4/18/22390612/two-people-killed-fiery-tesla-crash-no-driver (accessed on 21 January 2022).
  44. Buckley, B.C.; Boulter, C.J. Investigating the Role of Representations and Expressed Models in Building Mental Models. In Developing Models in Science Education; Gilbert, J.K., Boulter, C.J., Eds.; Springer: Dordrecht, The Netherlands, 2000; pp. 119–135. ISBN 978-0-7923-6772-7. [Google Scholar]
  45. Westbrook, L. Mental models: A theoretical overview and preliminary study. J. Inf. Sci. 2006, 32, 563–579. [Google Scholar] [CrossRef]
  46. Norman, D.A. The Design of Everyday Things; Basic Books: New York, NY, USA, 2002; ISBN 9780465003945. [Google Scholar]
  47. Zhang, W.; Xu, P. Do I have to learn something new? Mental models and the acceptance of replacement technologies. Behav. Inf. Technol. 2011, 30, 201–211. [Google Scholar] [CrossRef]
  48. Schnotz, W.; Kürschner, C. External and internal representations in the acquisition and use of knowledge: Visualization effects on mental model construction. Instr. Sci. 2008, 36, 175–190. [Google Scholar] [CrossRef]
  49. Greenberg, S.; Carpendale, S.; Marquardt, N.; Buxton, B. Uncovering the Initial Mental Model. Sketching User Experiences: The Workbook; Elsevier: Hoboken, NJ, USA, 2012; pp. 217–226. ISBN 9780123819598. [Google Scholar]
  50. Google LLC. Google PAIR. People + AI Guidebook. 2019. Available online: https://pair.withgoogle.com/guidebook/ (accessed on 15 July 2021).
  51. d’Apollonia, S.T.; Charles, E.S.; Boyd, G.M. Acquisition of Complex Systemic Thinking: Mental Models of Evolution. Educ. Res. Eval. 2004, 10, 499–521. [Google Scholar] [CrossRef]
  52. Apple Inc. Human Interface Guidelines: Machine Learning. 2021. Available online: https://developer.apple.com/design/human-interface-guidelines/machine-learning/overview/introduction/ (accessed on 15 July 2021).
  53. Microsoft Corporation. Guidelines for Human-AI Interaction. 2021. Available online: https://www.microsoft.com/en-us/research/project/guidelines-for-human-ai-interaction/ (accessed on 15 July 2021).
  54. Norman, D.A. Some Observations on Mental Models. In Mental Models; Psychology Press: Hove, UK; East Sussex, UK, 1983; pp. 7–14. [Google Scholar]
  55. van der Laan, J.D.; Heino, A.; de Waard, D. A simple procedure for the assessment of acceptance of advanced transport telematics. Transp. Res. Part C Emerg. Technol. 1997, 5, 1–10. [Google Scholar] [CrossRef]
  56. Richardson, N.T.; Sprung, A.; Michel, B. Entwicklung und Validierung eines Fragebogens zur Erfassung des mentalen Modells für das hochautomatisierte Fahren. Z. Arb. Wiss. 2019, 73, 312–323. [Google Scholar] [CrossRef]
  57. Lim, B.Y.; Dey, A.K.; Avrahami, D. Why and why not explanations improve the intelligibility of context-aware intelligent systems. In Proceedings of the SIGCHI Conference on Human Factors in Computing Systems, CHI’09, Boston, MA, USA, 4–9 April 2009; Olsen, D.R., Arthur, R.B., Hinckley, K., Morris, M.R., Hudson, S., Greenberg, S., Eds.; ACM: New York, NY, USA, 2009; pp. 2119–2128, ISBN 9781605582467. [Google Scholar]
  58. Beggiato, M.; Krems, J.F. The evolution of mental model, trust and acceptance of adaptive cruise control in relation to initial information. Transp. Res. Part F Traffic Psychol. Behav. 2013, 18, 47–57. [Google Scholar] [CrossRef]
  59. Hinderks; Andreas; Schrepp, M.; Thomaschewski, J. User Experience Questionnaire (UEQ). 2018. Available online: https://www.ueq-online.org/ (accessed on 16 April 2021).
  60. Laugwitz, B.; Held, T.; Schrepp, M. Construction and Evaluation of a User Experience Questionnaire. In HCI and Usability for Education and Work; Holzinger, A., Ed.; Springer: Berlin/Heidelberg, Germany, 2008; pp. 63–76. ISBN 978-3-540-89349-3. [Google Scholar]
  61. Rothhämel, M.; IJkema, J.; Drugge, L. On a Method for Generating a Word Pool for the Description of Steering Feel. In Proceedings of the 10th International Symposium on Advanced Vehicle Control, Loughborough, UK, 22–25 August 2010. [Google Scholar]
  62. Hassenzahl, M.; Burmester, M.; Koller, F. AttrakDiff: Ein Fragebogen zur Messung wahrgenommener hedonischer und pragmatischer Qualität. In Mensch & Computer 2003; Szwillus, G., Ziegler, J., Eds.; Vieweg + Teubner Verlag: Wiesbaden, Germany, 2003; pp. 187–196. ISBN 978-3-519-00441-7. [Google Scholar]
  63. RealtimeBoard, Inc. Miro. 2021. Available online: https://miro.com/ (accessed on 9 November 2021).
  64. Bühner, M. Einführung in Die Test-und Fragebogenkonstruktion; 3. Aktualisierte und Erweiterte Auflage; Pearson Studium ein Imprint von Pearson Education: München, Germany, 2011; ISBN 9783863265700. [Google Scholar]
  65. Lenzner, T.; Neuert, C.; Otto, W. Cognitive Pretesting: GESIS Survey Guidelines; GESIS–Leibniz Institute for the Social Sciences: Mannheim, Germany, 2015. [Google Scholar]
  66. Schölkopf, L.; Gatto von der Heyde, C.; Diermeyer, F. Survey Data from 75 Truck Drivers on their Mental Models of Adaptive Interfaces. 2021. Available online: https://mediatum.ub.tum.de/1631619 (accessed on 12 December 2021).
  67. Schrepp, M.; Rummel, B. UX Fragebögen: Verwenden wir die richtigen Methoden? In Proceedings of the Mensch und Computer 2018—Workshopband, Dresden, Germany, 2–5 September 2018. [Google Scholar]
  68. Häder, M. Delphi-Befragungen; Springer Fachmedien Wiesbaden: Wiesbaden, Germany, 2014; ISBN 978-3-658-01927-3. [Google Scholar]
  69. Zhang, Y. Dimensions and elements of people’s mental models of an information-rich Web space. J. Am. Soc. Inf. Sci. 2010, 61, 2206–2218. [Google Scholar] [CrossRef]
  70. Moosbrugger, H.; Kelava, A. Testtheorie und Fragebogenkonstruktion; Springer: Berlin/Heidelberg, Germany, 2020; ISBN 978-3-662-61531-7. [Google Scholar]
  71. Lohre, D.; Bernecker, T.; Stock, W. ZF-Zukunftsstudie Fernfahrer 2.0: Der Mensch im Transport-und Logistikmarkt. 2014. Available online: https://www.zf.com/master/media/corporate/m_zf_com/company/download_center/company_3/zukunftsstudie_1/zf_zukunftsstudie_2014_gesamt.pdf (accessed on 18 December 2021).
Figure 1. Main influencing factors on the formation of the user’s mental model.
Mti 06 00014 g001
Figure 2. Implementation model representing technological standpoint while the mental model reflects the user’s understanding of the system, based on Cooper et al. [37]. Differences in the mental model of designer and user are indicated by different graphical representations of the system.
Mti 06 00014 g002
Figure 3. Flow of mental models based on Norman [46] with differentiating MMs between the user and designer represented by a divergent graphical representation, augmented by the proposed step to give the designer access to knowledge about the user’s initial MM of the system.
Mti 06 00014 g003
Figure 4. Overview of the methods during the development of the final questionnaire with resulting number of items per step.
Mti 06 00014 g004
Figure 5. Exemplary items illustrating the process of rating the items during the virtually conducted expert workshop to revise the item pool with color coded decisions and comments.
Mti 06 00014 g005
Figure 6. Screenshot of the video shown to the participants explaining the basic functionality of an AUI for commercial vehicles. The left section shows the current working phase on a timeline which leads to different vehicle functions shown in the schematic driving workplace on the right.
Mti 06 00014 g006
Figure 7. Scree plot for the remaining 37 items with corresponding eigenvalues and dimensions as well as a parallel analysis.
Mti 06 00014 g007
Figure 8. Initial mental model measured using the questionnaire’s 37 items which were answered by 75 truck drivers, diamond indicates mean value (1—not true at all to 6—fully applies).
Mti 06 00014 g008
Table 1. Reliability and internal consistency of the factors quantified by Cronbach’s α and Guttman’s λ as well as explained variation per factor.
Factor 1Factor 2Factor 3Factor 4
Cronbach’s α0.880.910.890.85
Guttman’s λ0.900.930.910.86
Explained
Variation
16%16%16%10%
Table 2. Correlation matrix of all factors after conducting oblimin rotation.
Factor 1Factor 2Factor 3Factor 4
Factor 11.000.330.340.28
Factor 2 1.000.350.32
Factor 3 1.000.22
Factor 4 1.00
Table 3. Descriptive data of all factors regarding the initial MM of the drivers.
System State and TransparencyIntelligence and AdaptabilityContext
Sensitivity
User Control
Mean4.434.724.675.06
SD1.00.950.920.92
Median4.564.924.805.33
Publisher’s Note: MDPI stays neutral with regard to jurisdictional claims in published maps and institutional affiliations.

