
Displays for Productive Non-Driving Related Tasks: Visual Behavior and Its Impact in Conditionally Automated Driving

 ,
,  , ,
, ,  , and
, and 
Abstract
1. Introduction
1.1. In-Vehicle Displays
1.2. Theoretical Considerations
1.3. Research Questions and Hypotheses
- RQ1
- How do the NDRT display variants (HUD and ASD) influence drivers’ glance behavior?
- RQ2
- What can we learn from combining insights of our investigation of physiological workload, TOR and NDRT performance, and self-ratings, with visual behavior, to foster safe, productive and enjoyable human-computer interaction in conditionally automated vehicles?
2. Materials and Methods
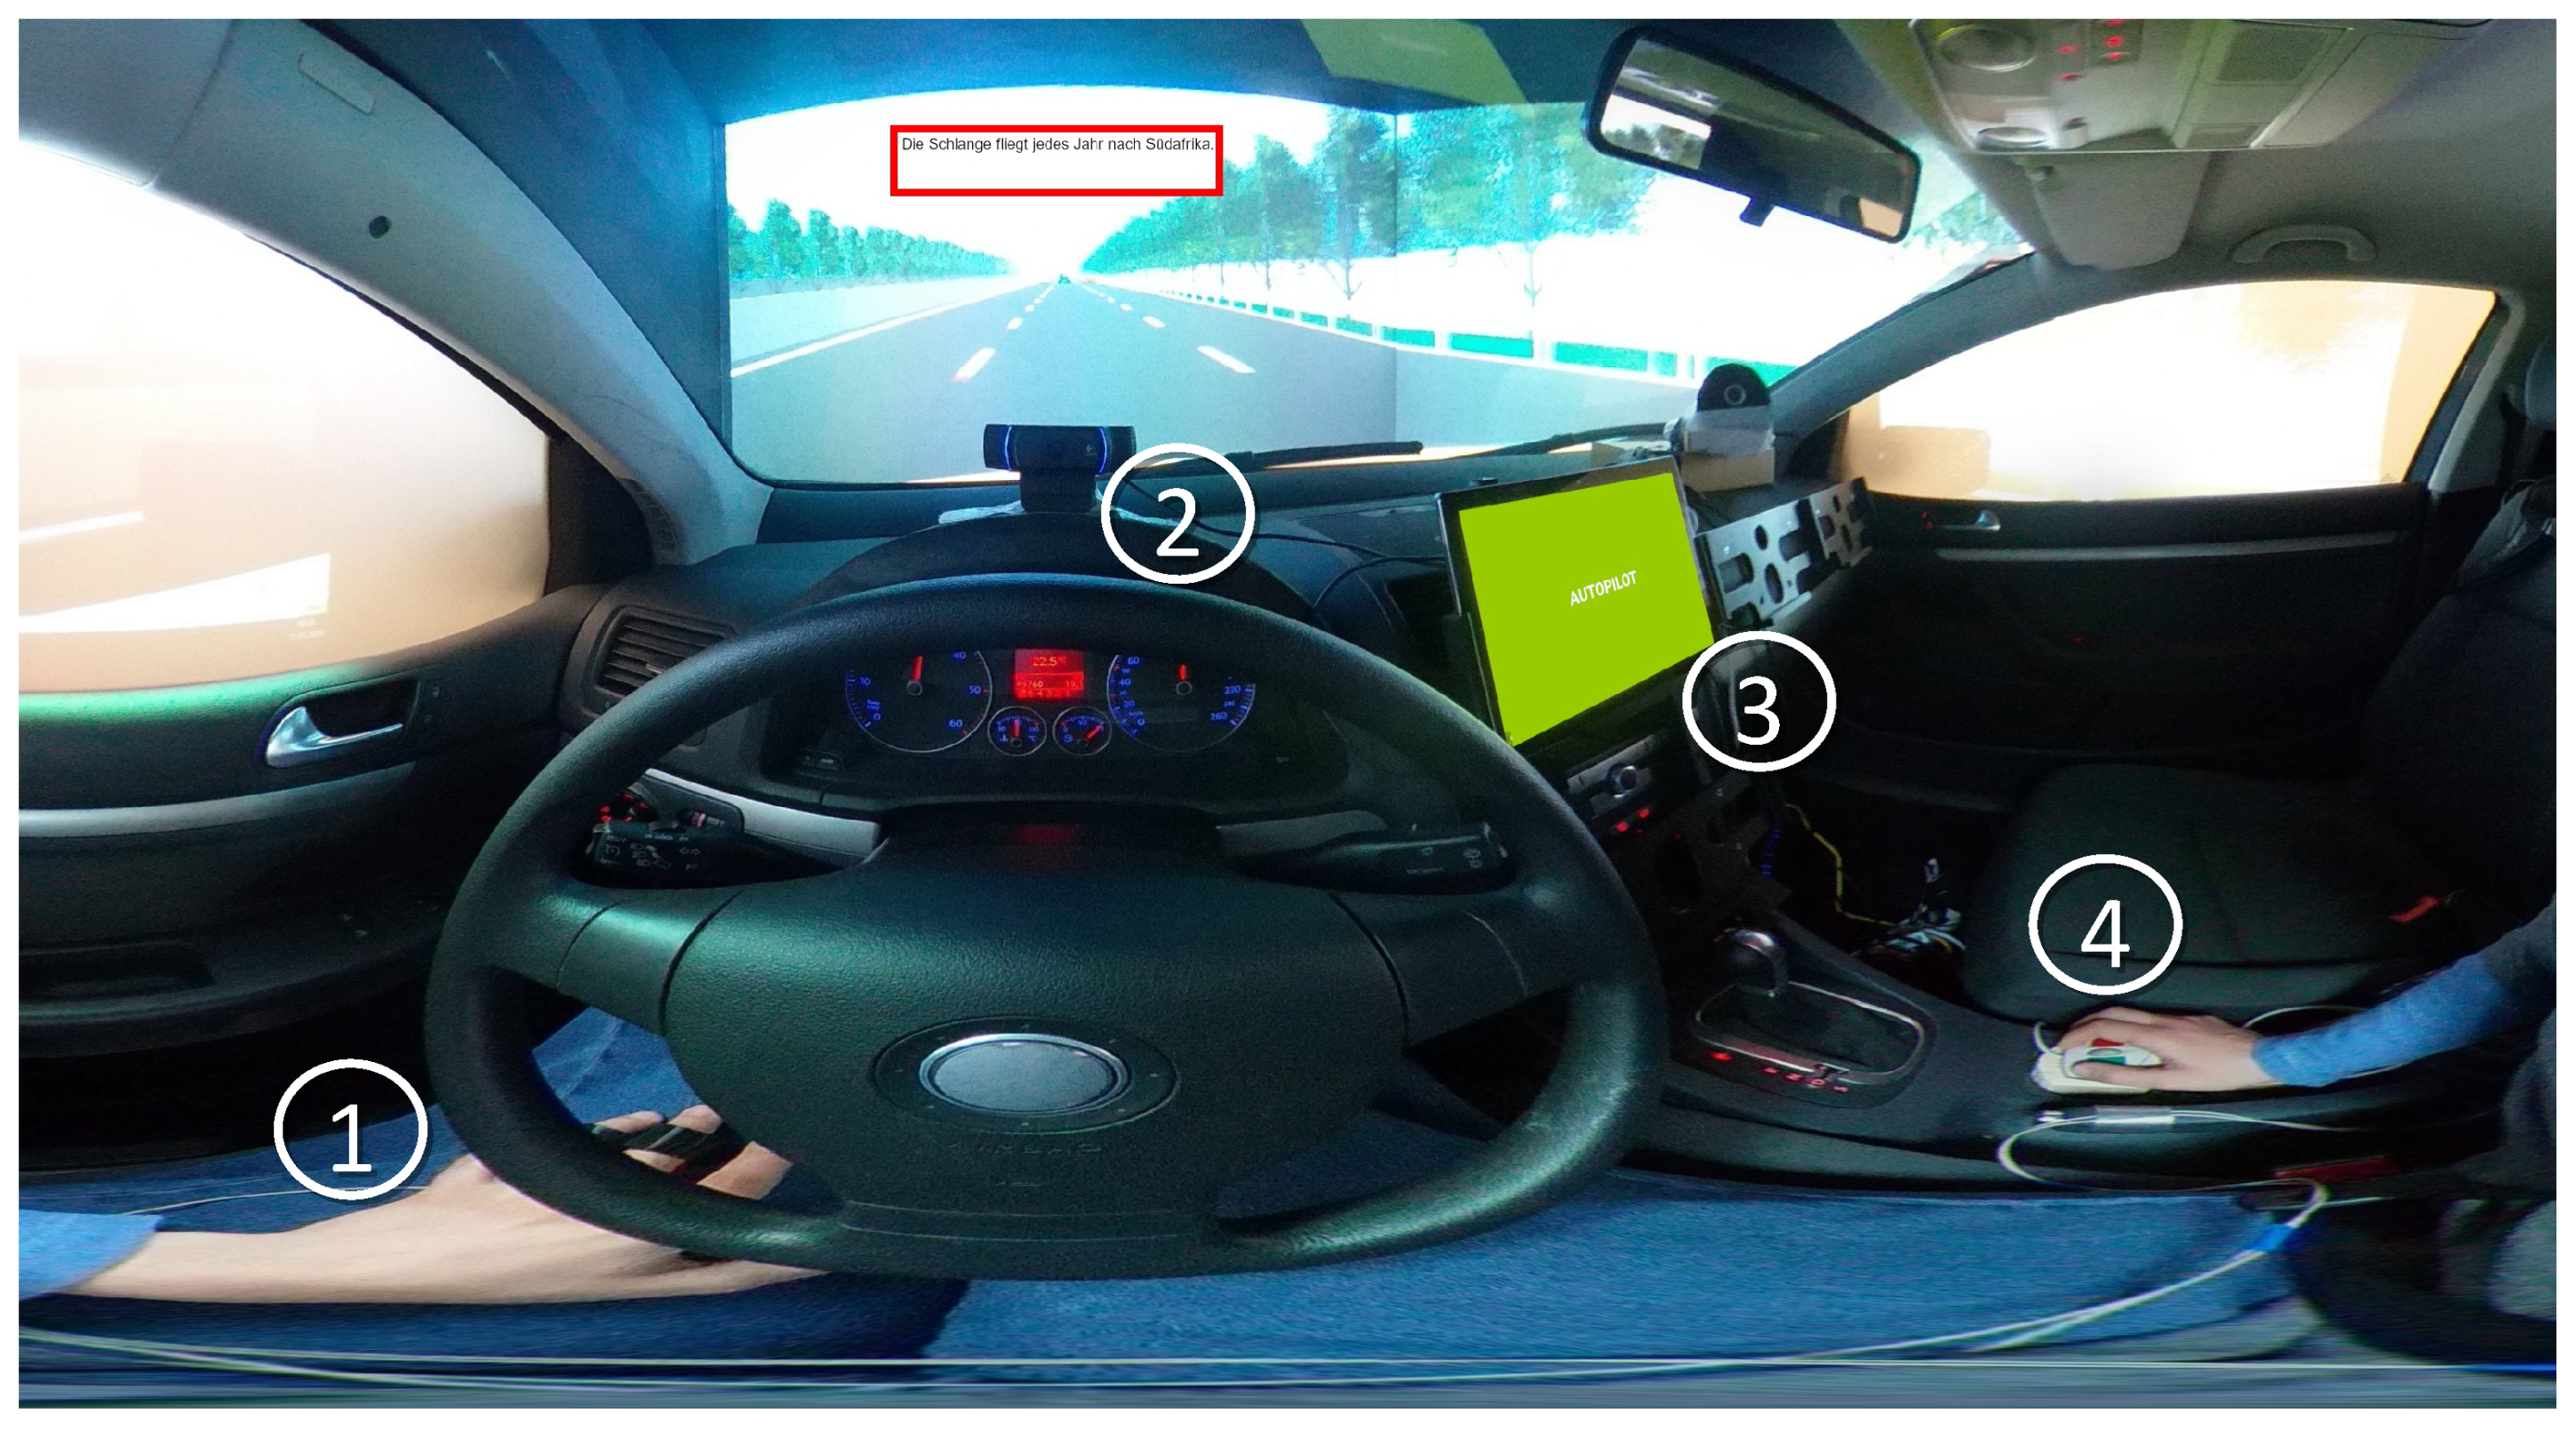
2.1. Implementation
Prototype
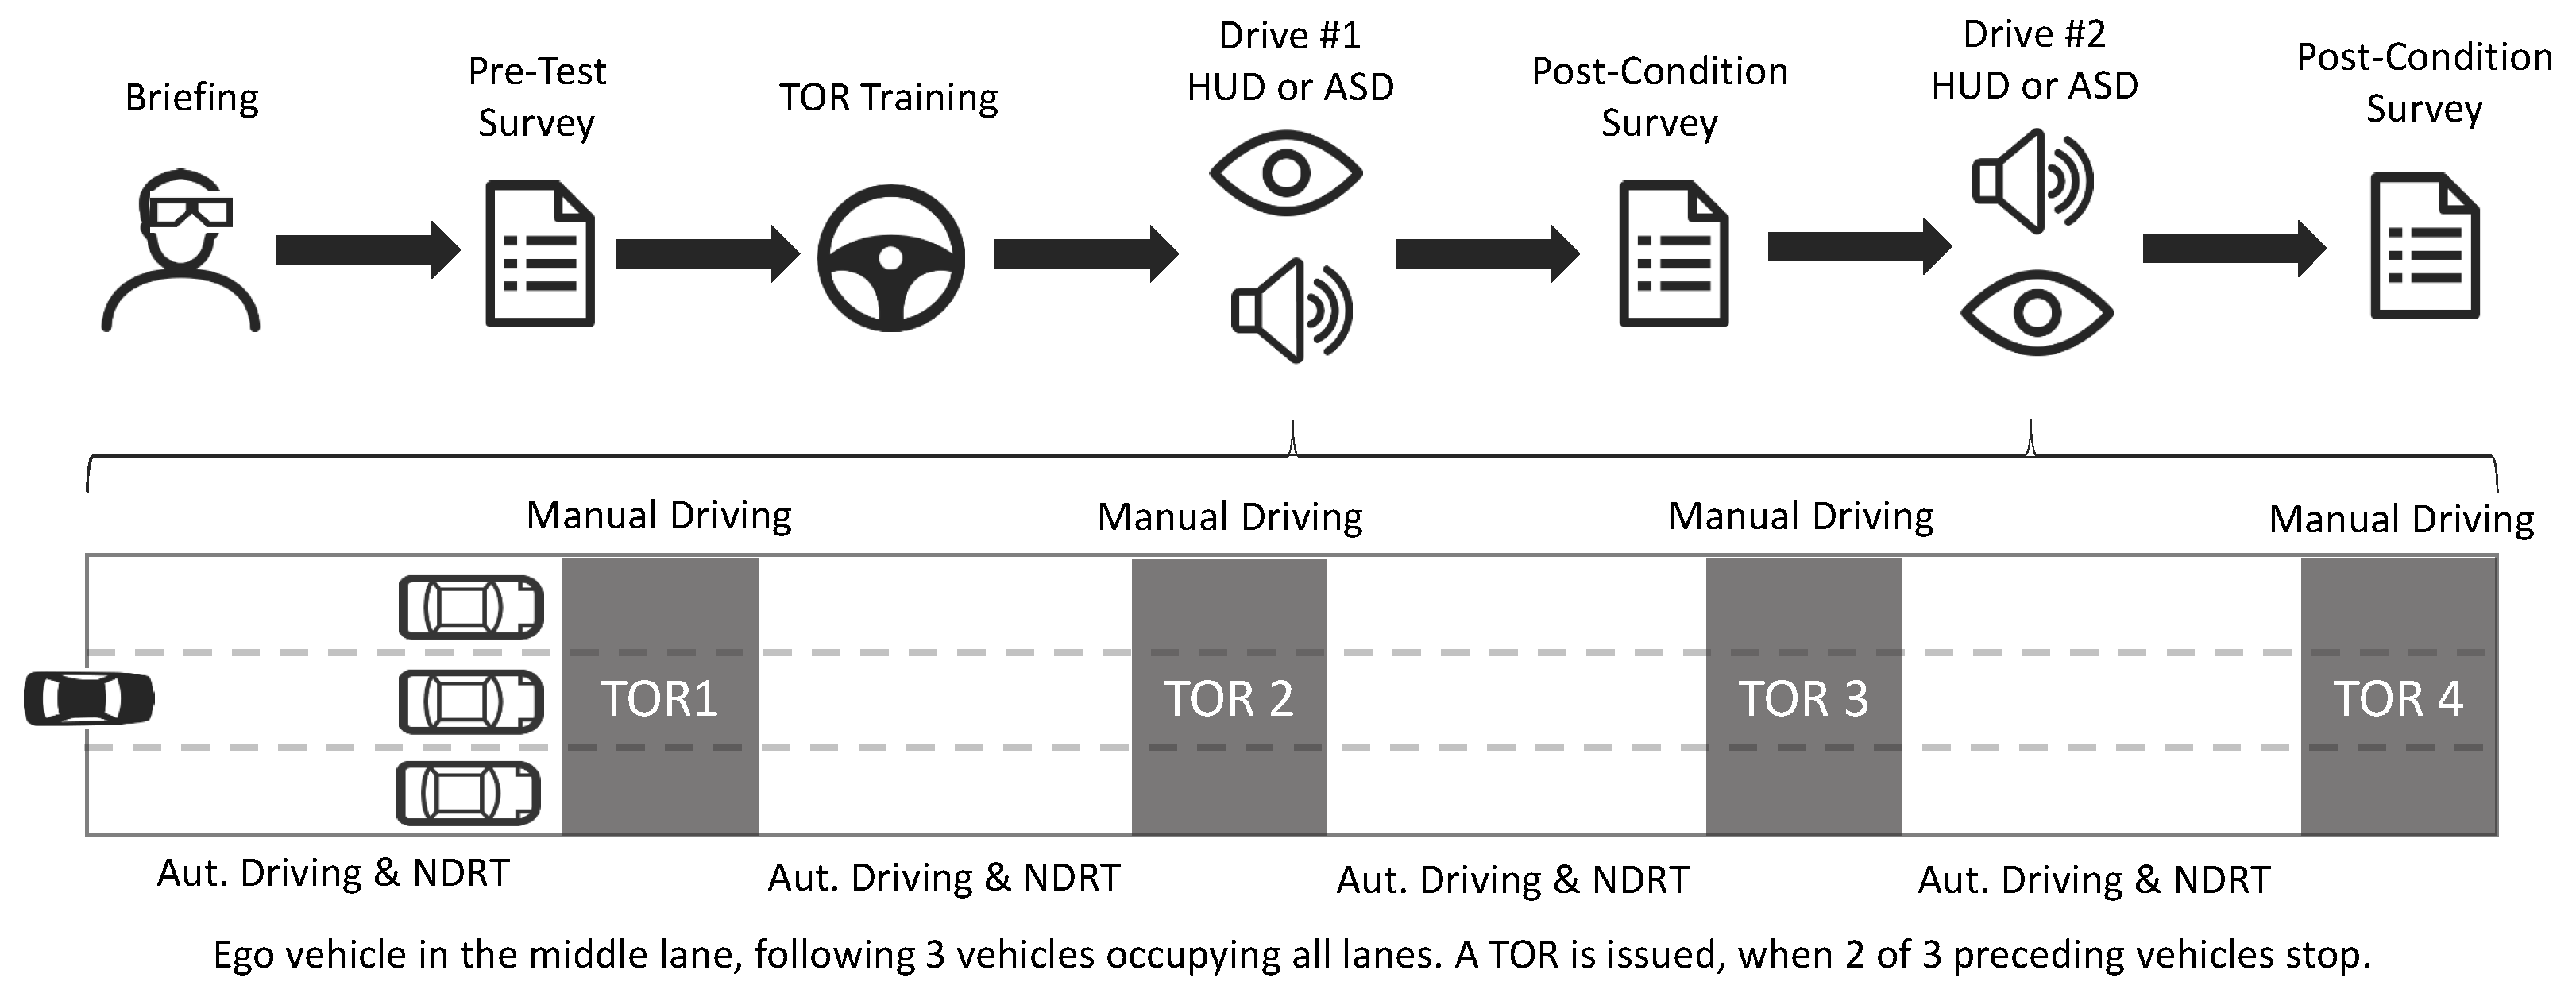
2.2. Procedure
2.2.1. Take-Over Task
2.2.2. Text Comprehension Task
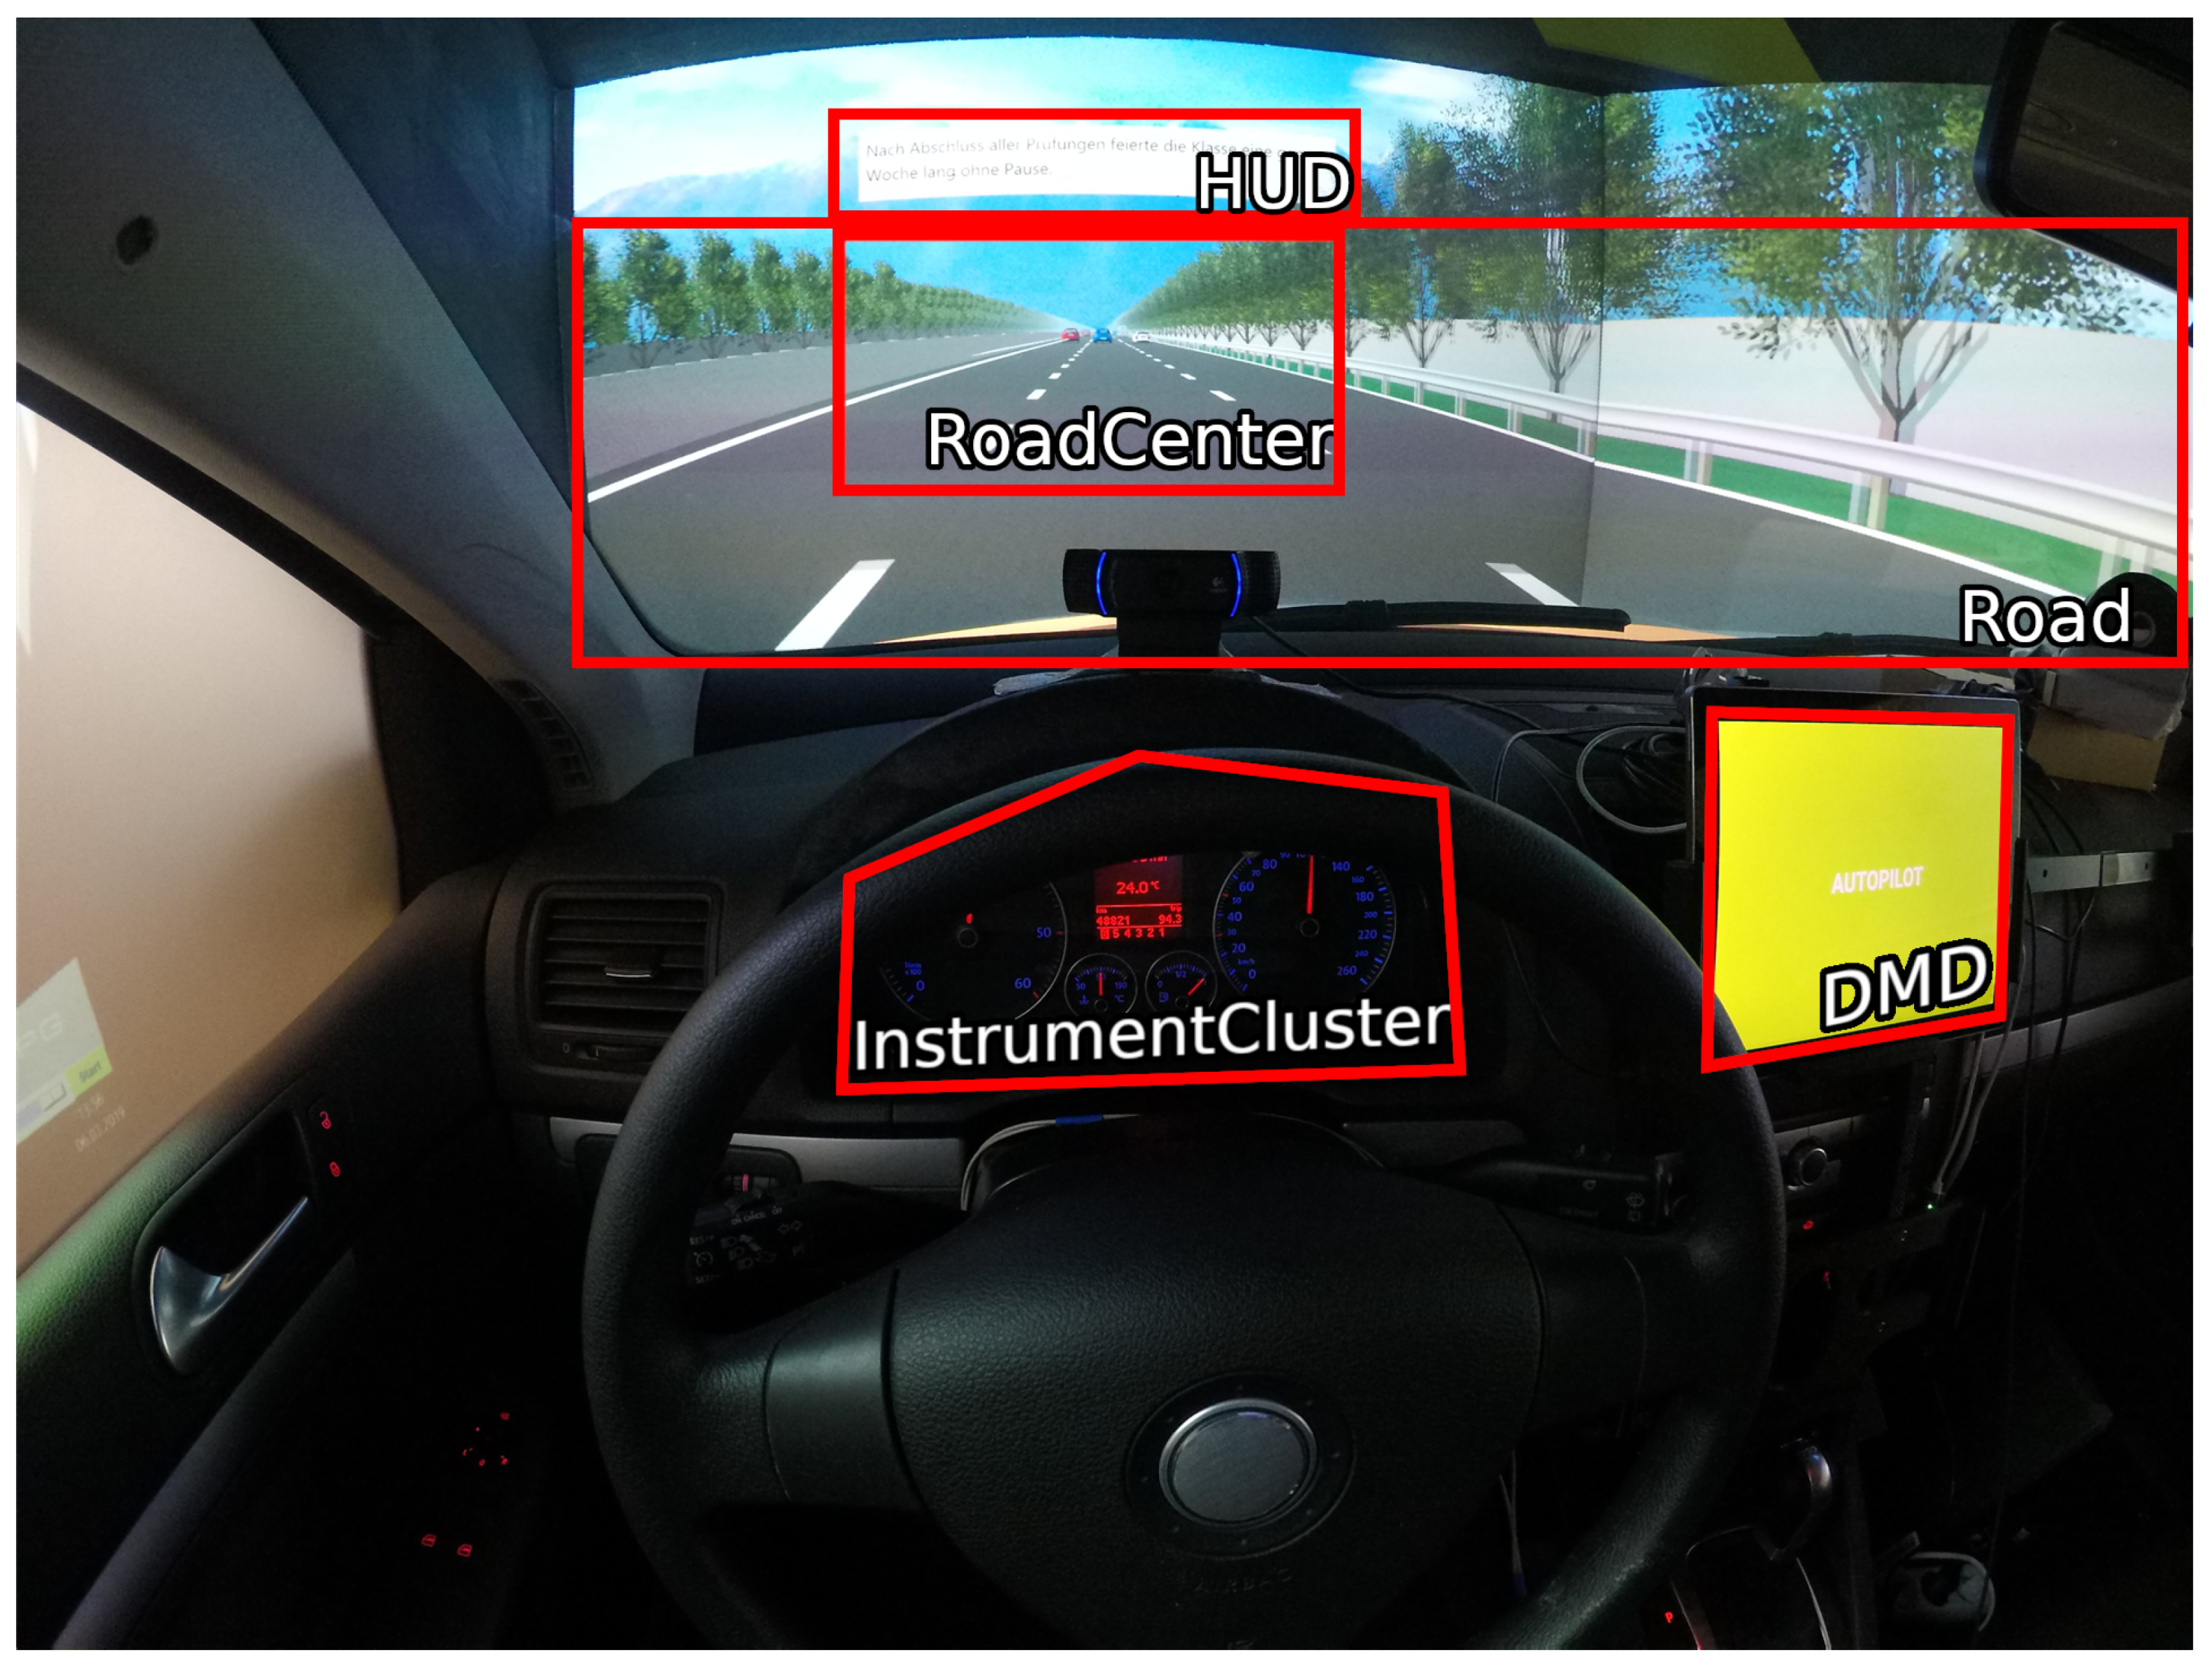
2.3. Visual Behavior Measurements
- Mean Glance Duration: mean glance duration in milliseconds.
- Glance Rate: glances towards an AoI per second, also known as glance frequency.
- Glance Location Probability: number of glances to/in the respective AoI, relative to the total number of glances.
- Percentage Road Center (PRC): total glance time on the AoI RoadCenter (relative to the driving phase duration).
- Percentage Eyes Off Road Time (PEORT): total glance time outside of AoIs Road and RoadCenter (relative to the driving phase duration).
- Percentage Transition Time: time spent during which eyes are in movement between AoIs (relative to the driving phase duration).
- Percentage Extended Glances Off Road (PEGOR): percentage of extended (>2 s long) glances outside the AoIs Road and RoadCenter. Evaluated during take-overs only.
2.4. Measurements for Safety, Productivity, Workload, and Acceptance
2.5. Software and Tests for Statistical Analyses
2.6. Participants
3. Results
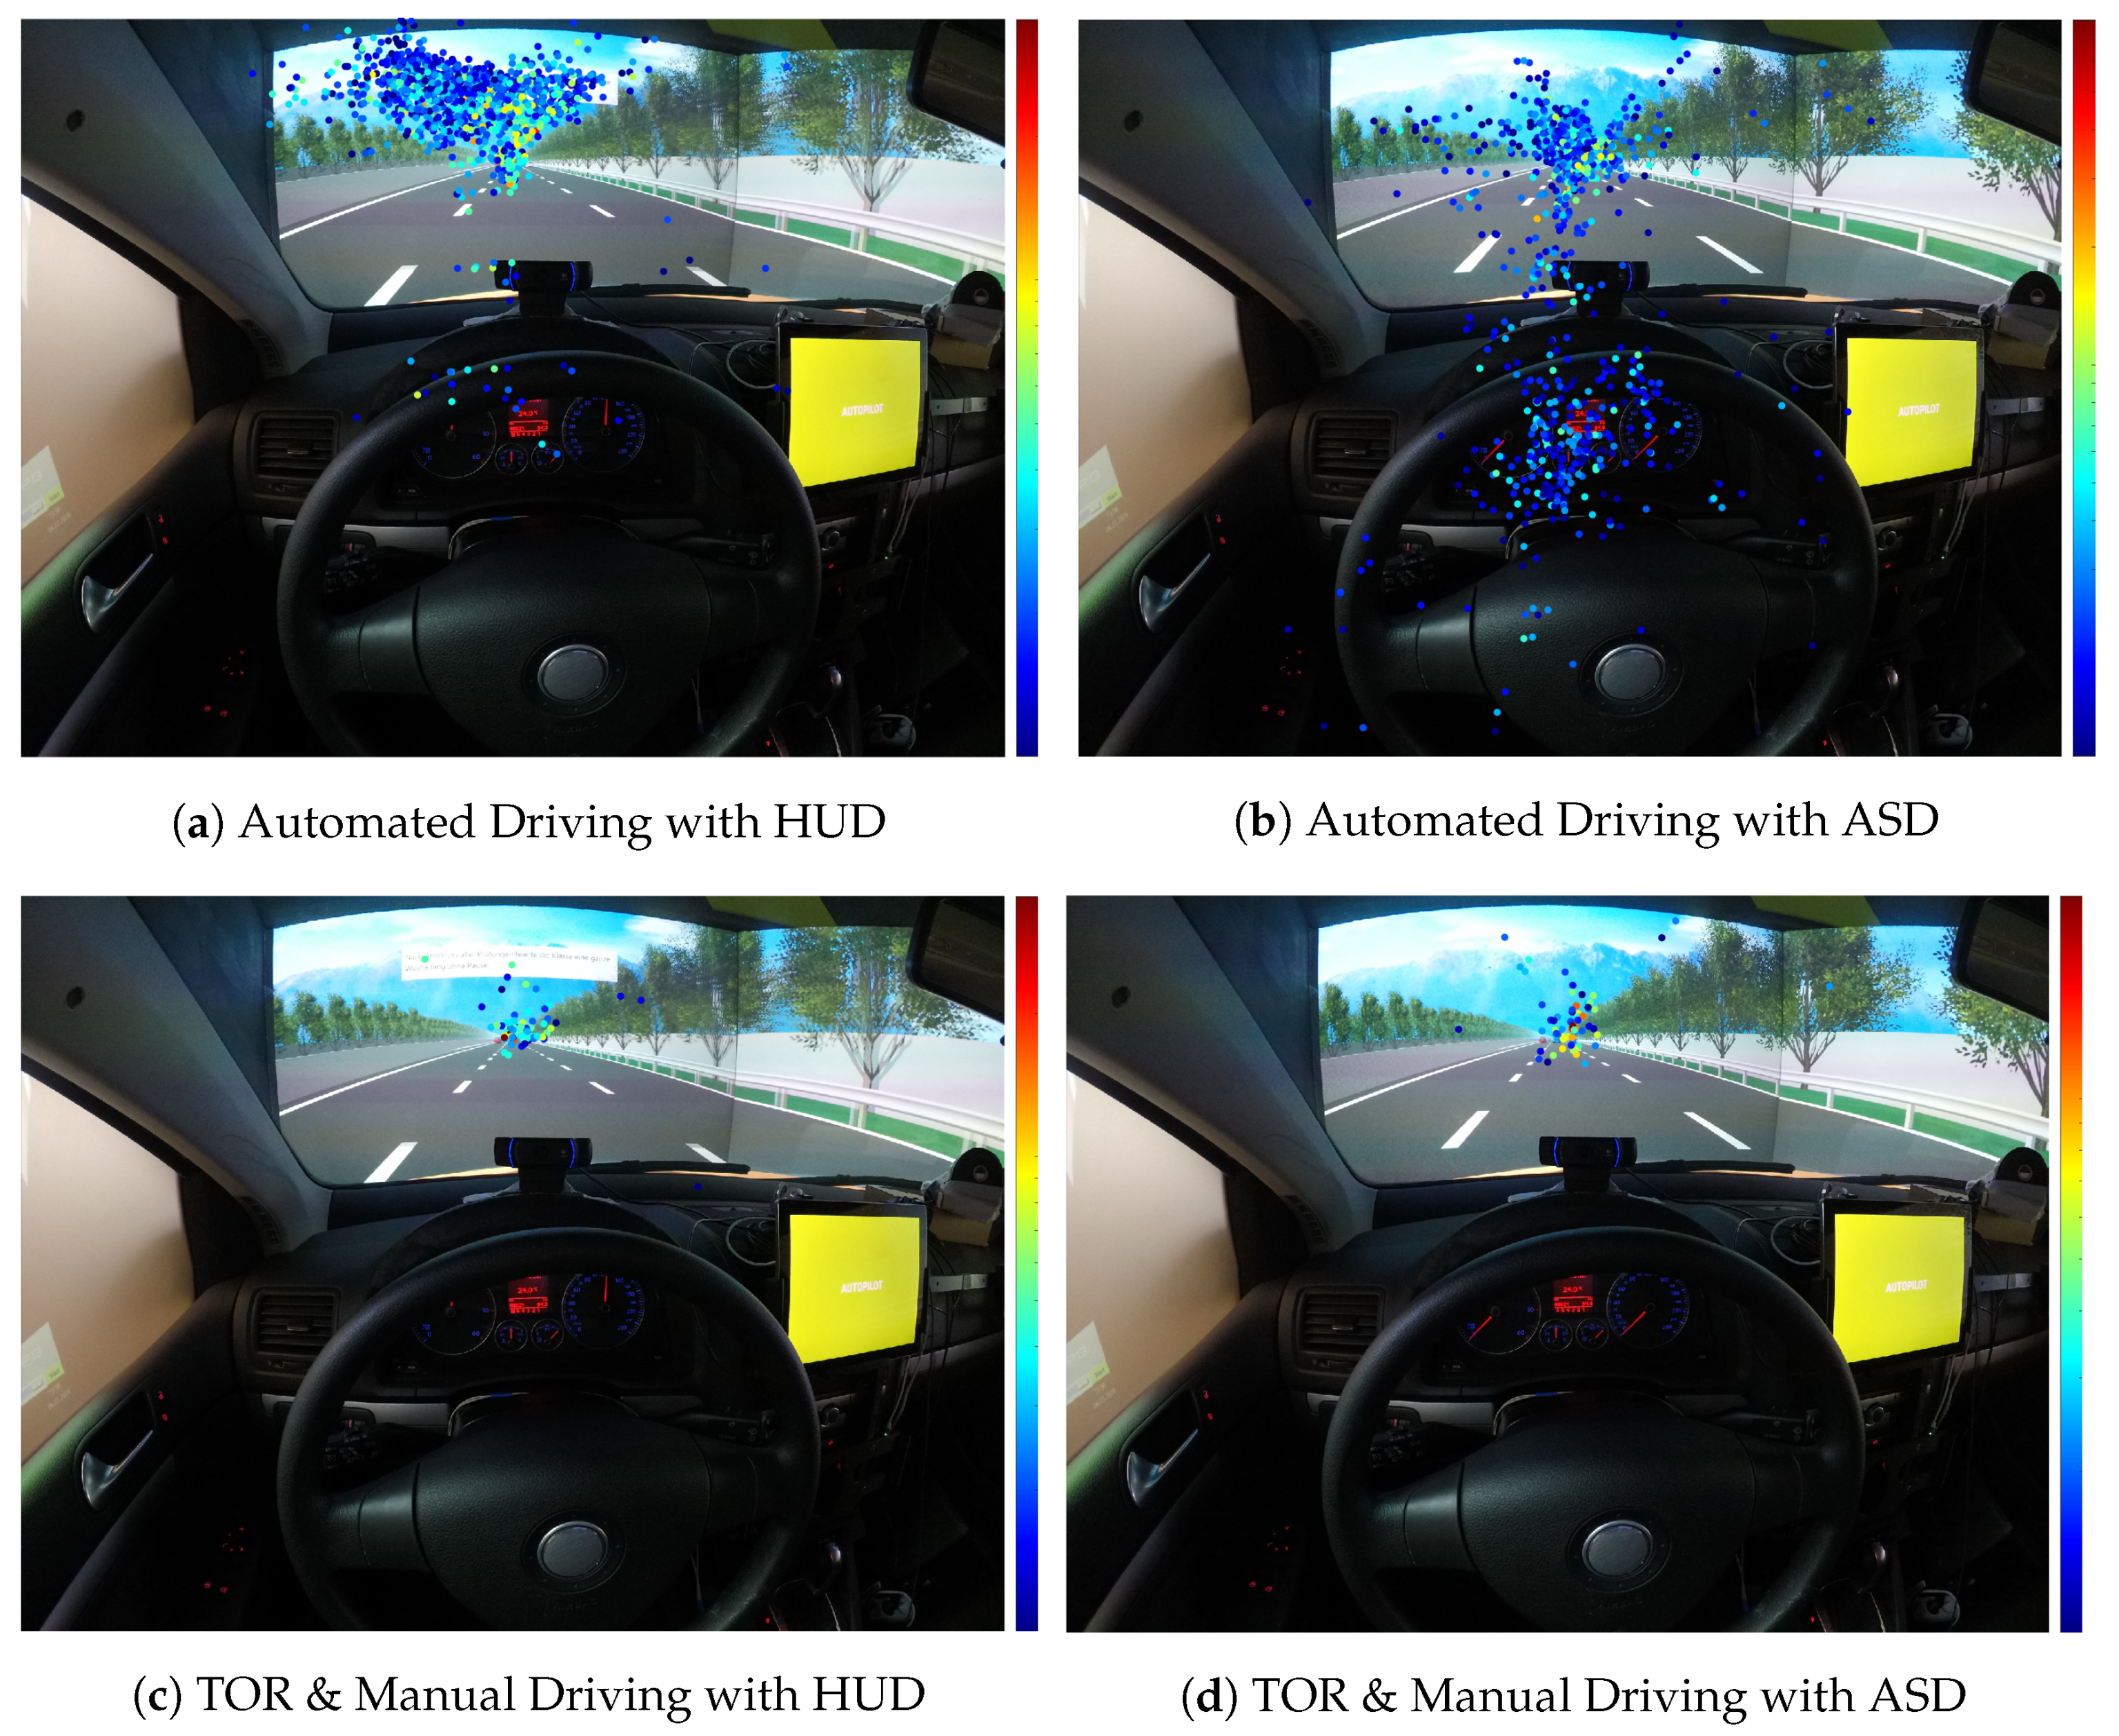
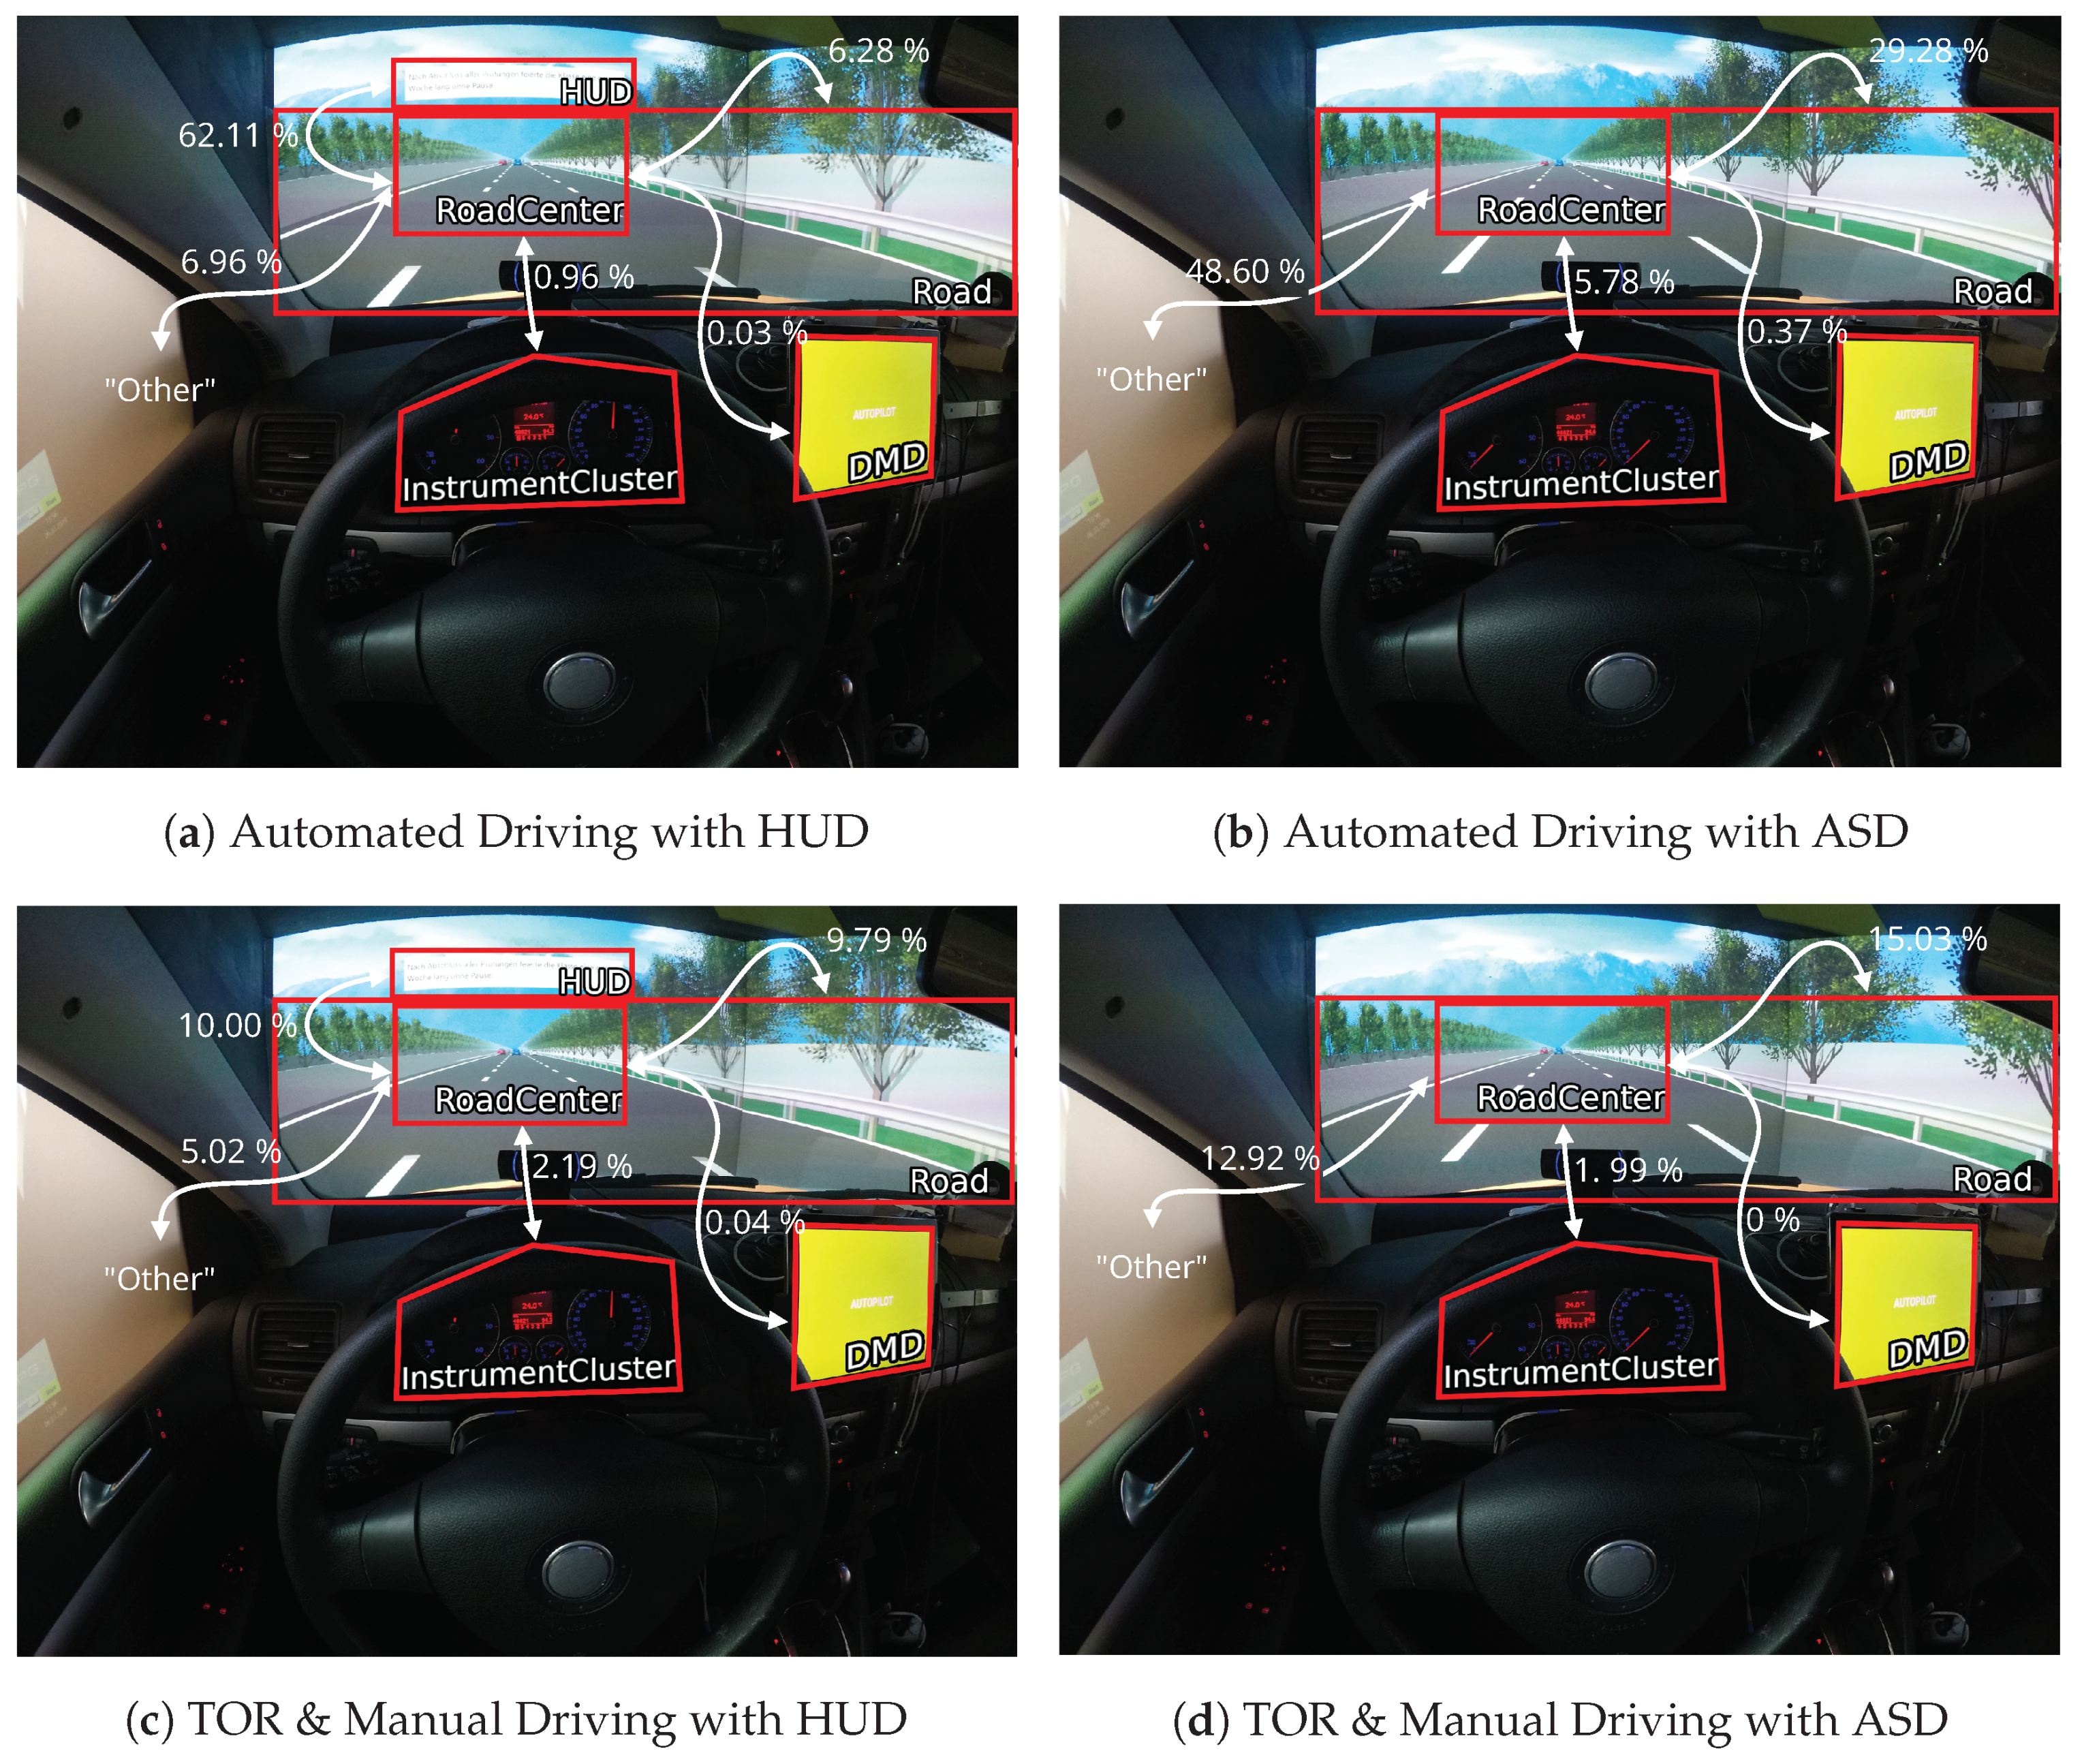
3.1. Visual Behavior
3.1.1. Area of Interest-Specific Behavior
3.1.2. Visual Distraction
3.1.3. Transitioning Behavior and Gaze Dispersion
3.2. Performance, Workload, and Acceptance
4. Discussion
4.1. Visual Behavior in Automated Driving (RQ1, H1 and H2)
4.2. Visual Behavior during Take-Overs (RQ1, H3)
4.3. Impact on Safety, Productivity and User Experience (RQ2)
4.4. Implications for Future Interfaces
4.5. Limitations
4.6. Future Work
5. Conclusions
- Users subjectively favored the ASD over the HUD, despite higher overall physiologically measured workload and worse productivity.
- HUD usage during automated driving has a distinctly negative effect on visual behavior in the take-over phase too and results in a heavier situational workload increase than the ASD.
- Driving performance measures of manual driving were not impacted in a statistically significant fashion. Hence, we assume that both NDRT display variants are still safe to use, even though the users reacted quicker to TORs in the ASD condition.
- use Auditory Speech Displays for productivity in conditionally automated vehicles (SAE L3) to maximize safety and enjoyability (acceptance and perceived workload). However, research and design should consider interaction improvement options to alleviate its productivity downsides in terms of efficiency, such as live adjustability of output parameters (e.g., pacing, rhythm).
- consider combining driving-related information with NDRT-information on HUDs to potentially alleviate its downsides in terms of situation awareness.
Author Contributions
Funding
Institutional Review Board Statement
Informed Consent Statement
Data Availability Statement
Acknowledgments
Conflicts of Interest
References
- SAE. Taxonomy and Definitions for Terms Related to Driving Automation Systems for On-Road Motor Vehicles; J3016 Ground Vehicle Standard; SAE International: Warrendale, PA, USA, 2018. [Google Scholar] [CrossRef]
- McDonald, A.D.; Alambeigi, H.; Engström, J.; Gustav Markkula, G.; Vogelphl, T.; Dunne, J.; Yuma, N. Toward Computational Simulations of Behavior During Automated Driving Takeovers: A Review of the Empirical and Modeling Literatures. Hum. Factors J. Hum. Factors Ergon. Soc. 2019, 61, 642–688. [Google Scholar] [CrossRef] [PubMed]
- Zhang, B.; de Winter, J.; Varotto, S.; Happee, R.; Martens, M. Determinants of take-over time from automated driving: A meta-analysis of 129 studies. Transp. Res. Part F Traffic Psychol. Behav. 2019, 64, 285–307. [Google Scholar] [CrossRef]
- Gold, C.; Berisha, I.; Bengler, K. Utilization of Drivetime—Performing Non-Driving Related Tasks While Driving Highly Automated. Proc. Hum. Factors Ergon. Soc. Annu. Meet. 2015, 59, 1666–1670. [Google Scholar] [CrossRef]
- Zeeb, K.; Buchner, A.; Schrauf, M. What determines the take-over time? An integrated model approach of driver take-over after automated driving. Accid. Anal. Prev. 2015, 78, 212–221. [Google Scholar] [CrossRef] [PubMed]
- Young, M.S.; Stanton, N.A. Attention and automation: New perspectives on mental underload and performance. Theor. Issues Ergon. Sci. 2002, 3, 178–194. [Google Scholar] [CrossRef]
- Feldhütter, A.; Kroll, D. Wake Up and Take Over! The Effect of Fatigue on the Take-over Performance in Conditionally Automated Driving. In Proceedings of the IEEE 21st International Conference on Intelligent Transportation Systems (ITSC), Maui, HI, USA, 4–7 November 2018. [Google Scholar]
- Weinbeer, V.; Muhr, T.; Bengler, K.; Ag, A. Automated Driving: The Potential of Non-driving-Related Tasks to Manage Driver Drowsiness. In Proceedings of the 20th Congress of the International Ergonomics Association (IEA 2018), Florence, Italy, 26–30 August 2018; Springer International Publishing: Cham, Switzerland, 2019; Volume 827, pp. 179–188. [Google Scholar] [CrossRef]
- Miller, D.; Sun, A.; Johns, M.; Ive, H.; Sirkin, D.; Aich, S.; Ju, W. Distraction Becomes Engagement in Automated Driving. Proc. Hum. Factors Ergon. Soc. Annu. Meet. 2015, 59, 1676–1680. [Google Scholar] [CrossRef]
- Hecht, T.; Feldhütter, A.; Draeger, K.; Bengler, K. What Do You Do? An Analysis of Non-driving Related Activities During a 60 Minutes Conditionally Automated Highway Drive. In Proceedings of the International Conference on Human Interaction and Emerging Technologies, Nice, France, 22–24 August 2019; Springer: Cham, Switzerland, 2020; pp. 28–34. [Google Scholar] [CrossRef]
- Pfleging, B.; Rang, M.; Broy, N. Investigating User Needs for Non-Driving-Related Activities During Automated Driving. In Proceedings of the 15th International Conference on Mobile and Ubiquitous Multimedia, Rovaniemi, Finland, 12–15 December 2016; pp. 91–99. [Google Scholar] [CrossRef]
- WHO. Global Status Report on Road Safety 2015; Technical Report; WHO: Geneva, Switzerland, 2015. [Google Scholar]
- Häuslschmid, R.; Pfleging, B.; Butz, A. The Influence of Non-driving-Related Activities on the Driver’s Resources and Performance. In Automotive User Interfaces: Creating Interactive Experiences in the Car; Meixner, G., Müller, C., Eds.; Springer International Publishing: Cham, Switzerland, 2017; pp. 215–247. [Google Scholar] [CrossRef]
- Wintersberger, P. Automated Driving: Towards Trustworthy and Safe Human-Machine Cooperation. Ph.D. Thesis, Universität Linz, Linz, Austria, 2020. [Google Scholar]
- Perterer, N.; Moser, C.; Meschtscherjakov, A.; Krischkowsky, A.; Tscheligi, M. Activities and Technology Usage while Driving. In Proceedings of the 9th Nordic Conference on Human-Computer Interaction (NordiCHI ’16), Gothenburg, Sweden, 23–27 October 2016; ACM Press: New York, NY, USA, 2016; pp. 1–10. [Google Scholar] [CrossRef]
- Hensch, A.C.; Rauh, N.; Schmidt, C.; Hergeth, S.; Naujoks, F.; Krems, J.F.; Keinath, A. Effects of secondary Tasks and Display Position on Glance Behavior during partially automated Driving. In Proceedings of the 6th Humanist Conference, The Hague, The Netherlands, 13–14 June 2018. [Google Scholar]
- Wintersberger, P.; Schartmüller, C.; Riener, A. Attentive User Interfaces to Improve Multitasking and Take-Over Performance in Automated Driving. Int. J. Mob. Hum. Comput. Interact. 2019, 11, 40–58. [Google Scholar] [CrossRef]
- Li, X.; Schroeter, R.; Rakotonirainy, A.; Kuo, J.; Lenné, M.G. Effects of different non-driving-related-task display modes on drivers’ eye-movement patterns during take-over in an automated vehicle. Transp. Res. Part F Traffic Psychol. Behav. 2020, 70, 135–148. [Google Scholar] [CrossRef]
- von Sawitzky, T.; Wintersberger, P.; Riener, A.; Gabbard, J.L. Increasing Trust in Fully Automated Driving: Route Indication on an Augmented Reality Head-up Display. In Proceedings of the 8th ACM International Symposium on Pervasive Displays (PerDis ’19), Palermo, Italy, 12–14 June 2019; Association for Computing Machinery: New York, NY, USA, 2019; pp. 1–7. [Google Scholar] [CrossRef]
- Wintersberger, P.; Frison, A.K.; Riener, A.; Sawitzky, T.v. Fostering user acceptance and trust in fully automated vehicles: Evaluating the potential of augmented reality. Presence Virtual Augment. Real. 2019, 27, 46–62. [Google Scholar] [CrossRef]
- Riegler, A.; Wintersberger, P.; Riener, A.; Holzmann, C. Augmented Reality Windshield Displays and Their Potential to Enhance User Experience in Automated Driving. i-com 2019, 18, 127–149. [Google Scholar] [CrossRef]
- Edgar, G.K.; Pope, J.C.; Craig, I.R. Visual accomodation problems with head-up and helmet-mounted displays? Displays 1994, 15, 68–75. [Google Scholar] [CrossRef]
- Gang, N.; Sibi, S.; Michon, R.; Mok, B.; Chafe, C.; Ju, W. Don’t Be Alarmed: Sonifying Autonomous Vehicle Perception to Increase Situation Awareness. In Proceedings of the 10th International Conference on Automotive User Interfaces and Interactive Vehicular Applications, Toronto, ON, Canada, 23–25 September 2018; pp. 237–246. [Google Scholar]
- Walker, B.N.; Nance, A.; Lindsay, J. Spearcons: Speech-Based Earcons Improve Navigation Performance in Auditory Menus; Georgia Institute of Technology: Atlanta, GA, USA, 2006. [Google Scholar]
- Jeon, M. Lyricons (Lyrics+ Earcons): Designing a new auditory cue combining speech and sounds. In Proceedings of the International Conference on Human-Computer Interaction, Las Vegas, NV, USA, 21–26 July 2013; Springer: Berlin/Heidelberg, Germany, 2013; pp. 342–346. [Google Scholar]
- Stratmann, T.C.; Löcken, A.; Gruenefeld, U.; Heuten, W.; Boll, S. Exploring Vibrotactile and Peripheral Cues for Spatial Attention Guidance. In Proceedings of the 7th ACM International Symposium on Pervasive Displays (PerDis ’18), Munich, Germany, 6–8 June 2018; ACM: New York, NY, USA, 2018; pp. 9:1–9:8. [Google Scholar] [CrossRef]
- Petermeijer, S.M.; Abbink, D.A.; Mulder, M.; de Winter, J.C.F. The Effect of Haptic Support Systems on Driver Performance: A Literature Survey. IEEE Trans. Haptics 2015, 8, 467–479. [Google Scholar] [CrossRef] [PubMed]
- Rose, D. Braille Is Spreading But Who’s Using It? BBC News, 13 February 2012. Available online: https://www.bbc.com/news/magazine-16984742 (accessed on 8 February 2021).
- Large, D.R.; Banks, V.A.; Burnett, G.; Baverstock, S.; Skrypchuk, L. Exploring the behaviour of distracted drivers during different levels of automation in driving. In Proceedings of the 5th International Conference on Driver Distraction and Inattention (DDI2017), Paris, France, 20–22 March 2017; pp. 20–22. [Google Scholar]
- You, F.; Wang, Y.; Wang, J.; Zhu, X.; Hansen, P. Take-Over Requests Analysis in Conditional Automated Driving and Driver Visual Research Under Encountering Road Hazard of Highway. In Advances in Human Factors and Systems Interaction; Nunes, I.L., Ed.; Springer International Publishing: Cham, Switzerland, 2018; pp. 230–240. [Google Scholar]
- Chang, C.C.; Sodnik, J.; Boyle, L.N. Don’t Speak and Drive: Cognitive Workload of In-Vehicle Speech Interactions. In Proceedings of the 8th International Conference on Automotive User Interfaces and Interactive Vehicular Applications (AutomotiveUI ’16 Adjunct), Ann Arbor, MI, USA, 24–26 October 2016; Association for Computing Machinery: New York, NY, USA, 2016; pp. 99–104. [Google Scholar] [CrossRef]
- Wickens, C.D. Processing Resources in Attention, Dual Task Performance and Workload Assessment; Academic Press: Orlando, FL, USA, 1984; pp. 63–102. [Google Scholar]
- Engström, J.; Markkula, G.; Victor, T.; Merat, N. Effects of Cognitive Load on Driving Performance: The Cognitive Control Hypothesis. Hum. Factors J. Hum. Factors Ergon. Soc. 2017, 59, 734–764. [Google Scholar] [CrossRef] [PubMed]
- Endsley, M.R. Situation awareness misconceptions and misunderstandings. J. Cogn. Eng. Decis. Mak. 2015, 9, 4–32. [Google Scholar] [CrossRef]
- Moore, K.; Gugerty, L. Development of a novel measure of situation awareness: The case for eye movement analysis. Proc. Hum. Factors Ergon. Soc. Annu. Meet. 2010, 54, 1650–1654. [Google Scholar] [CrossRef]
- van de Merwe, K.; van Dijk, H.; Zon, R. Eye movements as an indicator of situation awareness in a flight simulator experiment. Int. J. Aviat. Psychol. 2012, 22, 78–95. [Google Scholar] [CrossRef]
- Zhang, T.; Yang, J.; Liang, N.; Pitts, B.J.; Prakah-Asante, K.O.; Curry, R.; Duerstock, B.S.; Wachs, J.P.; Yu, D. Physiological Measurements of Situation Awareness: A Systematic Review. Hum. Factors 2020. [Google Scholar] [CrossRef] [PubMed]
- Schartmüller, C.; Weigl, K.; Wintersberger, P.; Riener, A.; Steinhauser, M. Text Comprehension: Heads-Up vs. Auditory Displays: Implications for a Productive Work Environment in SAE Level 3 Automated Vehicles. In Proceedings of the 11th International Conference on Automotive User Interfaces and Interactive Vehicular Applications (AutomotiveUI ’19), Utrecht, The Netherlands, 22–25 September 2019; Association for Computing Machinery: New York, NY, USA, 2019; pp. 342–354. [Google Scholar] [CrossRef]
- Schartmüller, C.; Wintersberger, P.; Riener, A. Interactive Demo: Rapid, Live Data Supported Prototyping with U.S.E. In Proceedings of the 9th International Conference on Automotive User Interfaces and Interactive Vehicular Applications, Oldenburg, Germany, 24–27 September 2017; Association for Computing Machinery: New York, NY, USA, 2017; pp. 239–241. [Google Scholar] [CrossRef]
- Tsimhoni, O.; Green, P.; Watanabe, H. Detecting and Reading Text on HUDs: Effects of Driving Workload and Message Location. In Proceedings of the 11th Annual ITS America Meeting, Miami Beach, FL, USA, 4–7 June 2001. [Google Scholar]
- Wintersberger, P.; Green, P.; Riener, A. Am I Driving or Are You are Or We Both? A Taxonomy For Handover and Handback in Automated Driving. In Proceedings of the 9th International Driving Symposium on Human Factors in Driver Assessment, Training, and Vehicle Design, Manchester Village, VT, USA, 26–29 June 2017; Public Policy Center, University of Iowa: Iowa City, IA, USA, 2017; pp. 333–339. [Google Scholar]
- Daneman, M.; Carpenter, P.A. Individual differences in working memory and reading. J. Verbal Learn. Verbal Behav. 1980, 19, 450–466. [Google Scholar] [CrossRef]
- Tobii, A. Tobii Pro Eye-Tracking-Brille 2. 2019. Available online: https://www.tobiipro.com/de/produkte/tobii-pro-glasses-2/ (accessed on 9 September 2019).
- iMotions, A/S. iMotions. 2019. Available online: https://imotions.com/ (accessed on 13 March 2019).
- Mole, C.D.; Lappi, O.; Giles, O.; Markkula, G.; Mars, F.; Wilkie, R.M. Getting Back Into the Loop: The Perceptual-Motor Determinants of Successful Transitions out of Automated Driving. Hum. Factors J. Hum. Factors Ergon. Soc. 2019, 1037–1065. [Google Scholar] [CrossRef]
- ISO. Road vehicles—Measurement of Driver Visual Behaviour with Respect to Transport Information and Control Systems—Part 1: Definitions and Parameters (ISO15007-1:2014); Technical Report; International Organization for Standardization: Geneva, Switzerland, 2015. [Google Scholar]
- Louw, T.; Merat, N. Are you in the loop? Using gaze dispersion to understand driver visual attention during vehicle automation. Transp. Res. Part C: Emerg. Technol. 2017, 76, 35–50. [Google Scholar] [CrossRef]
- Victor, T.W.; Harbluk, J.L.; Engström, J.A. Sensitivity of eye-movement measures to in-vehicle task difficulty. Transp. Res. Part F Traffic Psychol. Behav. 2005, 8, 167–190. [Google Scholar] [CrossRef]
- Green, P. Visual and Task Demands of Driver Information Systems; Technical Report UMTRI-98-16; The University of Michigan Transportation Research Institute: Ann Arbor, MI, USA, 1999. [Google Scholar]
- Driver Metrics, Performance, Behaviors and States Committee. Operational Definitions of Driving Performance Measures and Statistics; Technical Report J2944; SAE International: Warrendale, PA, USA, 2015. [Google Scholar]
- ISO. ISO 9241-11 Ergonomics of Human-System Interaction—Part 11: Usability: Definitions and Concepts; Technical Report; International Organization for Standardization: Geneva, Switzerland, 2018. [Google Scholar]
- Hart, S.G.; Staveland, L.E. Development of NASA-TLX (Task Load Index): Results of empirical and theoretical research. Adv. Psychol. 1988, 52, 139–183. [Google Scholar] [CrossRef]
- Lykken, D.T.; Venables, P.H. Direct measurement of skin conductance: A proposal for standardization. Psychophysiology 1971, 8, 656–672. [Google Scholar] [CrossRef]
- Davis, F.D. A Technology Acceptance Model for Empirically Testing New End-User Information Systems: Theory and Results. Ph.D. Thesis, Massachusetts Institute of Technology, Cambridge, MA, USA, 1985. [Google Scholar]
- IBM Corp. IBM SPSS Statistics for Windows; Version 25.0; IBM Corp.: Armonk, NY, USA, 2017. [Google Scholar]
- Cohen, J. A power primer. Psychol. Bull. 1992, 112, 155–159. [Google Scholar] [CrossRef] [PubMed]
- Palinko, O.; Kun, A.L.; Shyrokov, A.; Heeman, P. Estimating Cognitive Load Using Remote Eye Tracking in a Driving Simulator. In Proceedings of the 2010 Symposium on Eye-Tracking Research & Applications, Austin, TX, USA, 22–24 March 2010; pp. 141–144. [Google Scholar] [CrossRef]
- Yerkes, R.M.; Dodson, J.D. The relation of strength of stimulus to rapidity of habit-formation. J. Comp. Neurol. Psychol. 1908, 18, 459–482. [Google Scholar] [CrossRef]
- Borojeni, S.S.; Weber, L.; Heuten, W.; Boll, S. From reading to driving: Priming mobile users for take-over situations in highly automated driving. In Proceedings of the 20th International Conference on Human-Computer Interaction with Mobile Devices and Services (MobileHCI ’18), Barcelona, Spain, 3–6 September 2018; pp. 1–12. [Google Scholar] [CrossRef]
- Riegler, A.; Riener, A.; Holzmann, C. Towards Dynamic Positioning of Text Content on a Windshield Display for Automated Driving. In Proceedings of the 25th ACM Symposium on Virtual Reality Software and Technology (VRST ’19), Parramatta, Australia, 12–15 November 2019; Association for Computing Machinery: New York, NY, USA, 2019. [Google Scholar] [CrossRef]
- Löcken, A.; Heuten, W.; Boll, S. Enlightening Drivers: A Survey on In-Vehicle Light Displays. In Proceedings of the 8th International Conference on Automotive User Interfaces and Interactive Vehicular Applications, Ann Arbor, MI, USA, 24–26 October 2016; Association for Computing Machinery: New York, NY, USA, 2016; pp. 97–104. [Google Scholar] [CrossRef]
- Löcken, A.; Frison, A.K.; Fahn, V.; Kreppold, D.; Götz, M.; Riener, A. Increasing User Experience and Trust in Automated Vehicles via an Ambient Light Display. In Proceedings of the 22nd International Conference on Human-Computer Interaction with Mobile Devices and Services (MobileHCI ’20), Oldenburg, Germany, 5–9 October 2020; Association for Computing Machinery: New York, NY, USA, 2020; pp. 1–10. [Google Scholar] [CrossRef]
- Koulieris, G.A.; Akşit, K.; Stengel, M.; Mantiuk, R.K.; Mania, K.; Richardt, C. Near-eye display and tracking technologies for virtual and augmented reality. Comput. Graph. Forum 2019, 38, 493–519. [Google Scholar] [CrossRef]
- Li, K.; Geng, Y.; Özgür Yöntem, A.; Chu, D.; Meijering, V.; Dias, E.; Skrypchuk, L. Head-up display with dynamic depth-variable viewing effect. Optik 2020, 221, 165319. [Google Scholar] [CrossRef]
- Chuang, L.L.; Donker, S.F.; Kun, A.L.; Janssen, C. Workshop on The Mobile Office. In Proceedings of the 10th International Conference on Automotive User Interfaces and Applications, Toronto, ON, Canada, 23–25 September 2018. [Google Scholar] [CrossRef]


| AUTOMATED DRIVING | |||||||
|---|---|---|---|---|---|---|---|
| HUD | ASD | ||||||
| Variable | M (SD) | M (SD) | df | Cohen’s d | |||
| Glances at RoadCenter | Mean Glance Dur. (ms) | 2240.67 (1996.95) | 12,323.02 (16,205.70) | 47 | −4.32 | 0.000 * | 0.620 |
| Glance Rate (per sec.) | 0.17 (0.05) | 0.11 (0.05) | 47 | 7.97 | 0.000 * | 1.15 | |
| Glance Loc. Prob. (rel.) | 0.38 (0.08) | 0.49 (0.08) | 47 | −7.90 | 0.000 * | 1.14 | |
| Glances at HUD | Mean Glance Dur. (ms) | 1861.62 (561.13) | - | - | - | - | - |
| Glance Rate (per sec.) | 0.21 (0.06) | - | - | - | - | - | |
| Glance Loc. Prob. (rel.) | 0.43 (0.06) | - | - | - | - | - | |
| Glances at InstrumentCluster | Mean Glance Dur. (ms) | 940.79 (486.26) | 2498.92 (7075.92) | 32 | −1.24 | 0.224 | 0.22 |
| Glance Rate (per sec.) | 0.02 (0.04) | 0.02 (0.02) | 47 | −0.04 | 0.971 | 0.01 | |
| Glance Loc. Prob. (rel.) | 0.03 (0.08) | 0.07 (0.08) | 47 | −2.73 | 0.009 * | 0.76 | |
| Glances at Other | Mean Glance Dur. (ms) | 904.90 (850.47) | 1751.25 (4376.21) | 47 | −1.29 | 0.202 | 0.19 |
| Glance Rate (per sec.) | 0.08 (0.04) | 0.07 (0.04) | 47 | 0.55 | 0.588 | 0.08 | |
| Glance Loc. Prob. (rel.) | 0.16 (0.07) | 0.28 (0.10) | 47 | −7.01 | 0.000 * | 1.01 | |
| Visual Distraction | Perc. Transition Time (rel.) | 0.10 (0.05) | 0.09 (0.07) | 47 | 0.71 | 0.479 | 0.10 |
| PEORT | 0.62 (0.16) | 0.30 (0.17) | 47 | 10.84 | 0.000 * | 1.51 | |
| PRC | 0.36 (0.14) | 0.64 (0.18) | 47 | −9.15 | 0.000 * | 1.32 | |
| Link Value Prob. from/to RoadCenter | to/from Other | 0.07 (0.04) | 0.49 (0.22) | 47 | −13.43 | 0.000* | 1.94 |
| to/from Road | 0.06 (0.15) | 0.29 (0.15) | 47 | −9.56 | 0.000 * | 1.38 | |
| to/from TOR | 0.0003 (0.001) | 0.0038 (0.009) | 47 | −2.69 | 0.010 * | 0.39 | |
| to/from InstrumentCluster | 0.01 (0.02) | 0.05 (0.05) | 47 | −6.41 | 0.000 * | 0.92 | |
| Gaze Dispersion | Horizontal (degr.) | 8.74 (2.78) | 11.91 (3.14) | 47 | −5.978 | 0.000 * | 0.864 |
| Vertical (degr.) | 21.54 (8.11) | 43.08 (15.55) | 47 | −17.12 | 0.000 * | 1.24 | |
| TAKE-OVERS | |||||||
|---|---|---|---|---|---|---|---|
| HUD | ASD | ||||||
| Variable | M (SD) | M (SD) | df | Cohen’s d | |||
| Glances at RoadCenter | Mean Glance Dur. (ms) | 10,484.69 (4346.67) | 9782.86 (5630.95) | 47 | 0.78 | 0.440 | 0.11 |
| Glance Rate (per sec.) | 0.12 (0.04) | 0.13 (0.04) | 47 | −1.82 | 0.075 | 0.26 | |
| Glance Loc. Prob. (rel.) | 0.61 (0.14) | 0.73 (0.15) | 47 | −4.17 | 0.000 * | 0.60 | |
| Visual Distraction | Perc. Transition Time (rel.) | 0.06 (0.06) | 0.06 (0.08) | 47 | −0.003 | 0.998 | 0.00 |
| PEORT | 0.32 (0.13) | 0.30 (0.12) | 47 | 1.33 | 0.189 | 0.183 | |
| PRC | 0.63 (0.14) | 0.66 (0.13) | 47 | −1.28 | 0.207 | 0.248 | |
| PEGOR | 0.577 (0.266) | 0.177 (0.193) | 47 | 8.13 | 0.000 * | −1.72 | |
| Link Value Prob. from/to RoadCenter | to/from HUD | 0.10 (0.10) | - | - | - | - | - |
| to/from Other | 0.05 (0.07) | 0.13 (0.14) | 47 | −4.42 | 0.000 * | 0.63 | |
| to/from Road | 0.09 (0.10) | 0.15 (0.14) | 47 | −2.48 | 0.017 | 0.36 | |
| to/from DMD | 0.0005 (0.003) | 0.00 (0.00) | 47 | 1.00 | 0.322 | 0.14 | |
| to/from InstrumentCluster | 0.02 (0.05) | 0.02 (0.05) | 47 | 0.60 | 0.554 | 0.09 | |
| Gaze Dispersion | Horizontal (degr.) | 13.32 (2.35) | 13.53 (2.09) | 47 | −0.83 | 0.413 | 0.12 |
| Vertical (degr.) | 28.16 (14.80) | 29.46 (12.47) | 47 | −0.68 | 0.501 | 0.02 | |
Publisher’s Note: MDPI stays neutral with regard to jurisdictional claims in published maps and institutional affiliations. |
© 2021 by the authors. Licensee MDPI, Basel, Switzerland. This article is an open access article distributed under the terms and conditions of the Creative Commons Attribution (CC BY) license (https://creativecommons.org/licenses/by/4.0/).
Share and Cite
Schartmüller, C.; Weigl, K.; Löcken, A.; Wintersberger, P.; Steinhauser, M.; Riener, A. Displays for Productive Non-Driving Related Tasks: Visual Behavior and Its Impact in Conditionally Automated Driving. Multimodal Technol. Interact. 2021, 5, 21. https://doi.org/10.3390/mti5040021
Schartmüller C, Weigl K, Löcken A, Wintersberger P, Steinhauser M, Riener A. Displays for Productive Non-Driving Related Tasks: Visual Behavior and Its Impact in Conditionally Automated Driving. Multimodal Technologies and Interaction. 2021; 5(4):21. https://doi.org/10.3390/mti5040021
Chicago/Turabian StyleSchartmüller, Clemens, Klemens Weigl, Andreas Löcken, Philipp Wintersberger, Marco Steinhauser, and Andreas Riener. 2021. "Displays for Productive Non-Driving Related Tasks: Visual Behavior and Its Impact in Conditionally Automated Driving" Multimodal Technologies and Interaction 5, no. 4: 21. https://doi.org/10.3390/mti5040021
APA StyleSchartmüller, C., Weigl, K., Löcken, A., Wintersberger, P., Steinhauser, M., & Riener, A. (2021). Displays for Productive Non-Driving Related Tasks: Visual Behavior and Its Impact in Conditionally Automated Driving. Multimodal Technologies and Interaction, 5(4), 21. https://doi.org/10.3390/mti5040021