Information Processing and Overload in Group Conversation: A Graph-Based Prediction Model


Abstract
:1. Introduction
Related Work
2. Social Network Models
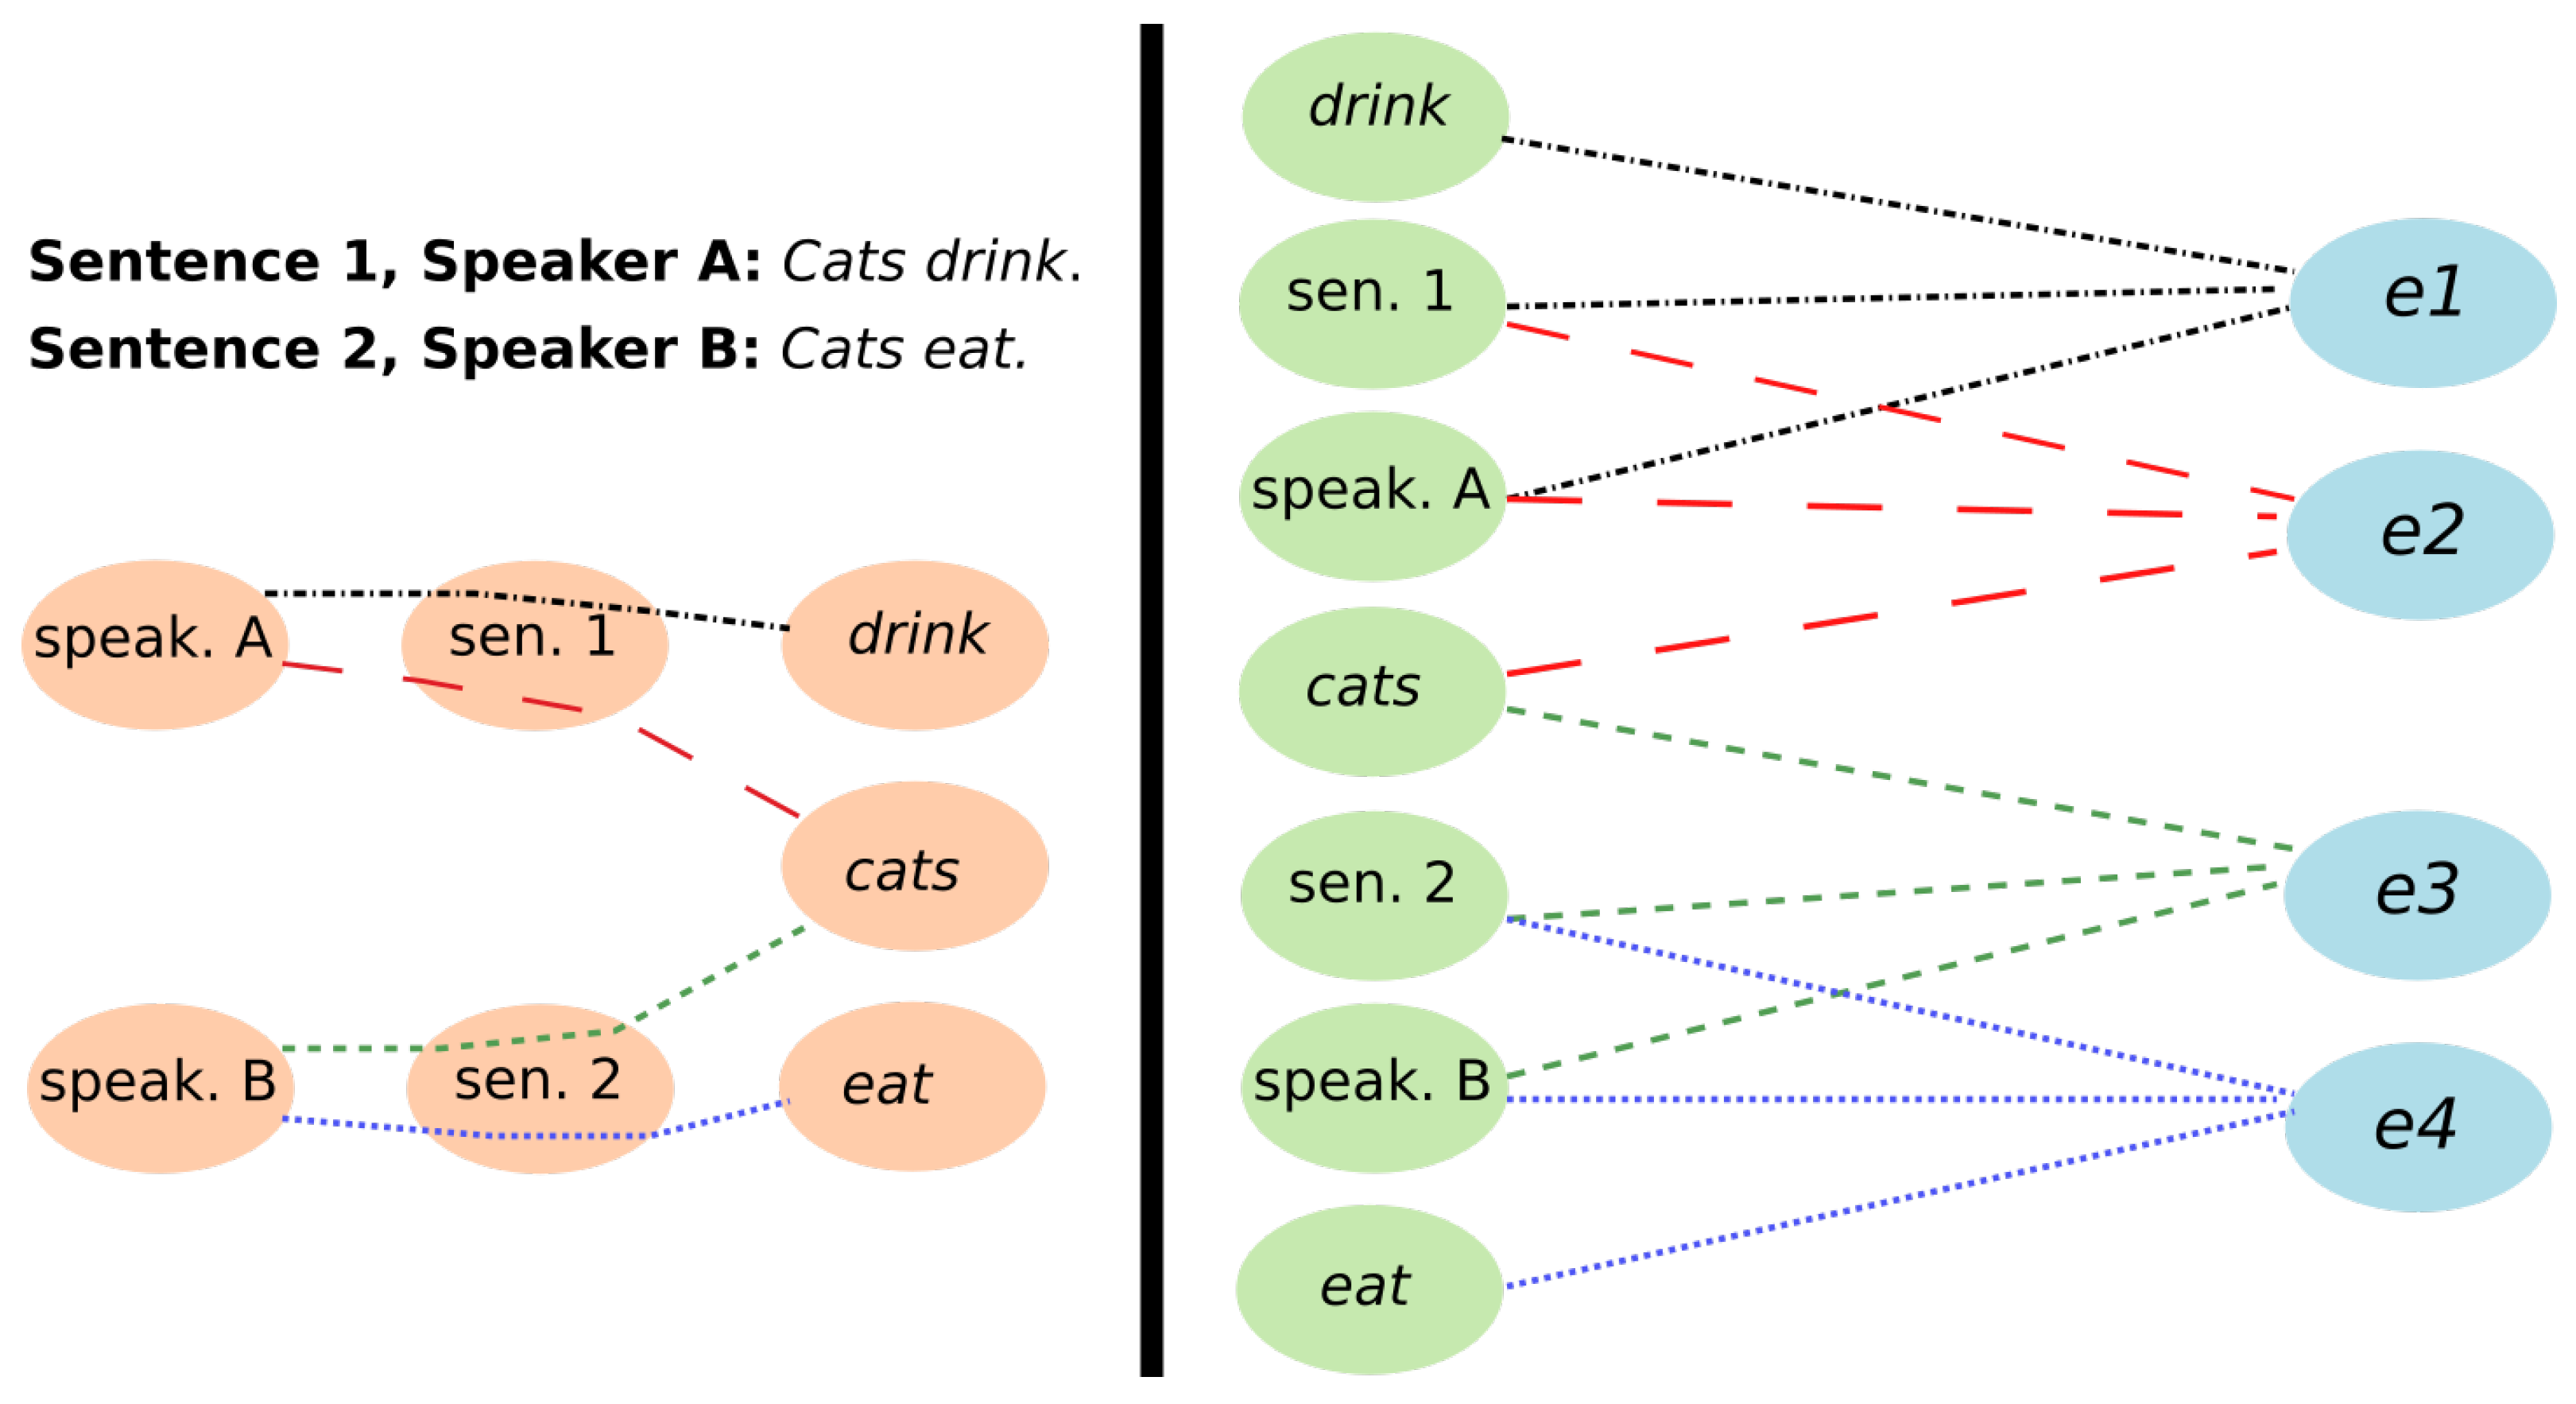
2.1. Language Graphs
- The minimum, maximum, and mean of the averaged linguistic centrality scores (, , ).
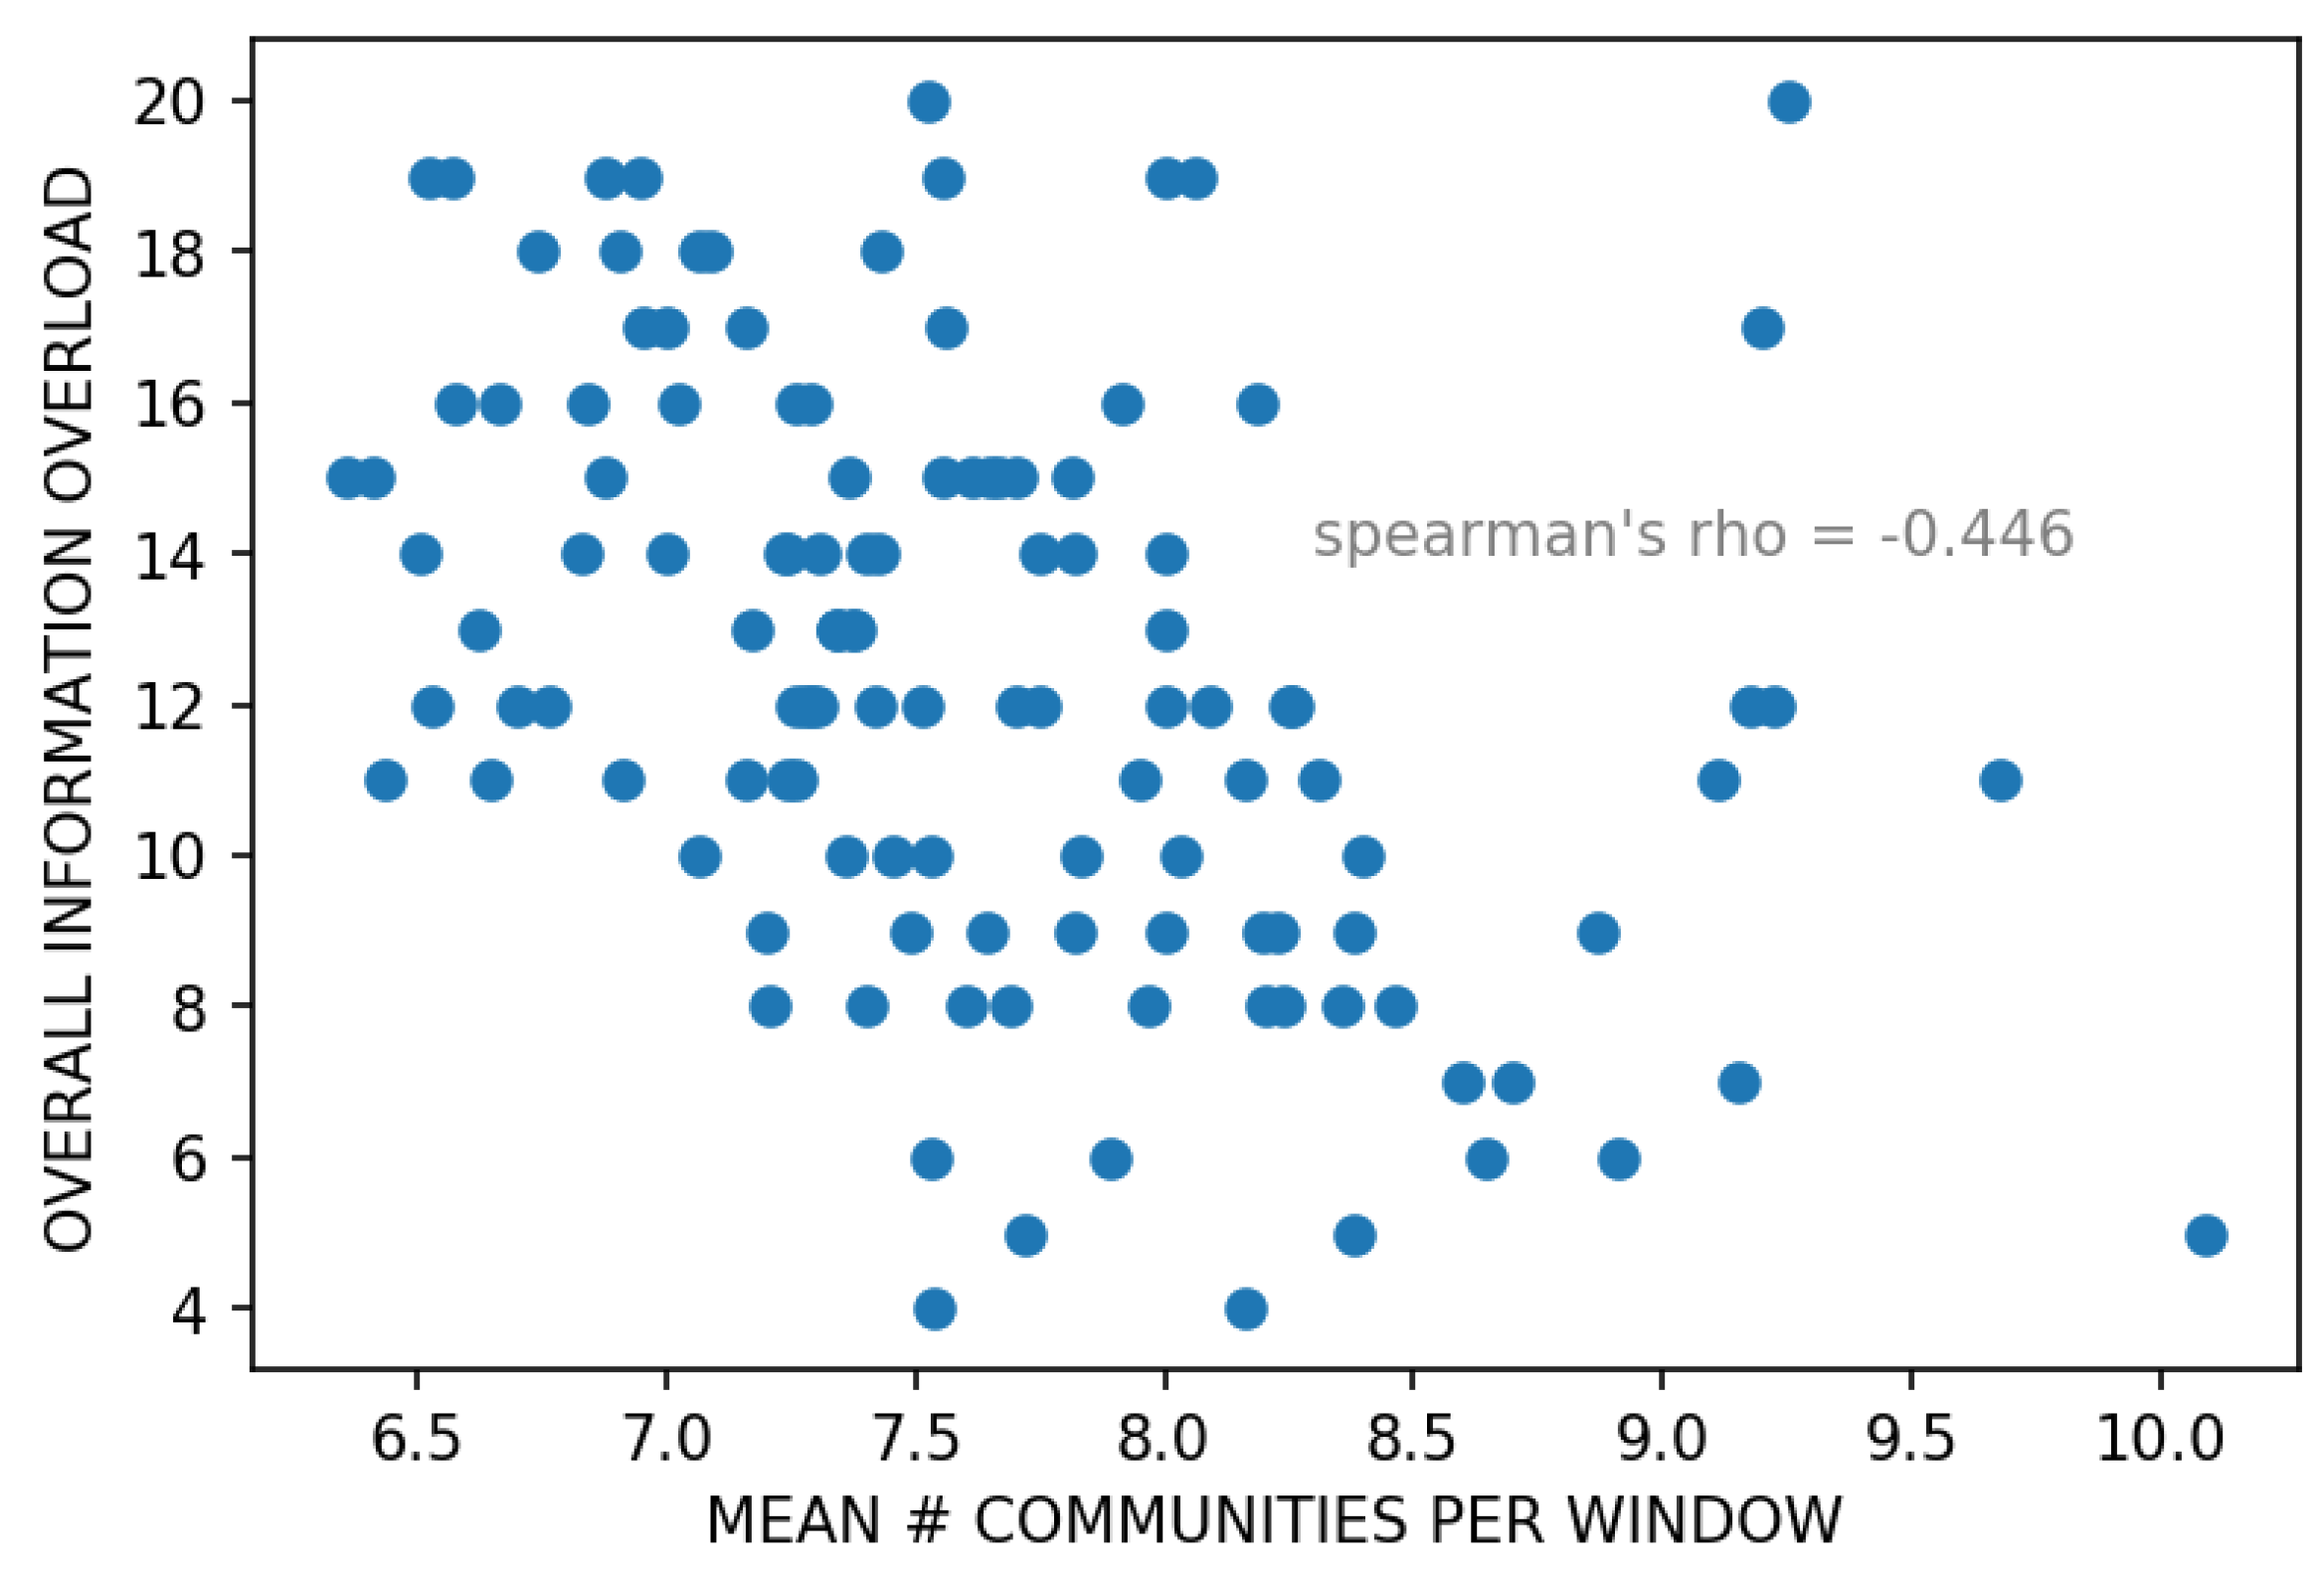
- The minimum, maximum, and mean number of communities (, , ).
- The minimum, maximum, and mean number of communities represented by sentences in each window (, , ).
- The minimum, maximum, and mean number of communities containing speakers (, , ).
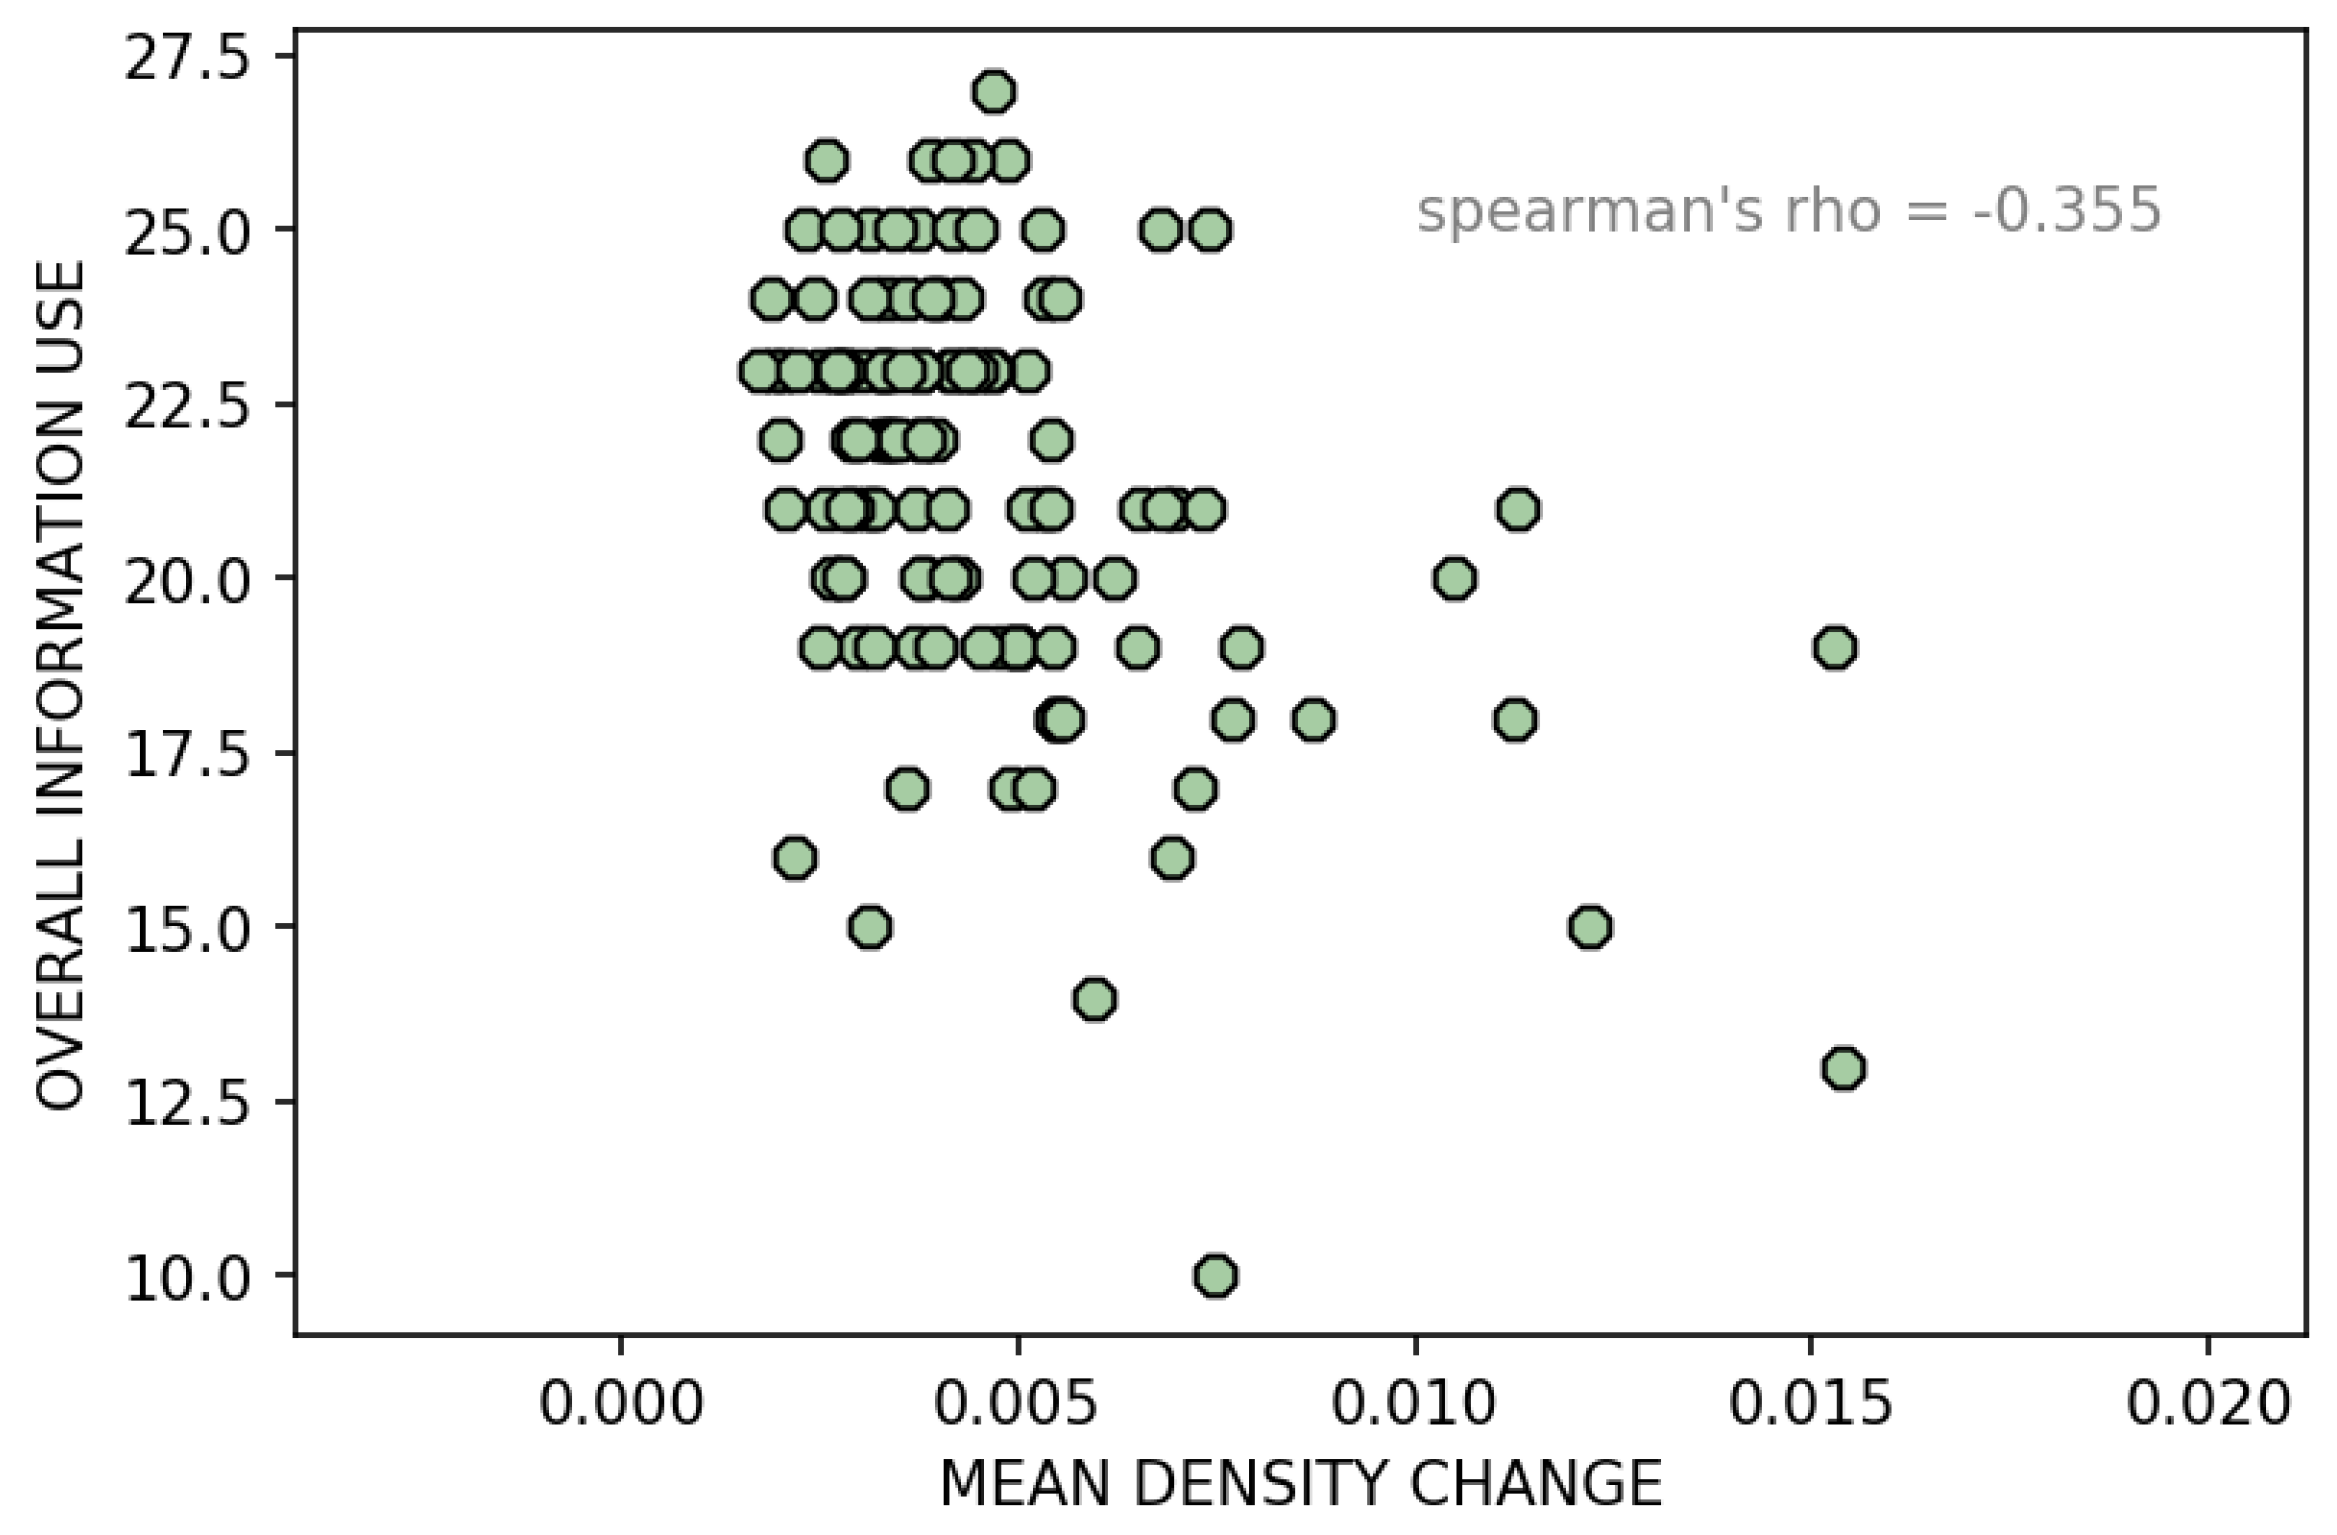
- The minimum, maximum, and mean language network density change (, , ).
2.2. Turn-Taking Graphs
- The minimum, maximum, and mean of the averaged closeness centrality scores (, , ).
- The minimum, maximum, and mean of the averaged degree centrality scores (, , ).
- The minimum, maximum, and mean of the averaged betweenness centrality scores (, , ).
2.3. Frequency Features
- The minimum, maximum, and mean of the averaged frequency scores (, , ).
3. Methods and Materials
- Q5. Information Use
- –
- “All available information is being used.”
- Q15. Information Overload
- –
- “There was too much information.”
4. Results
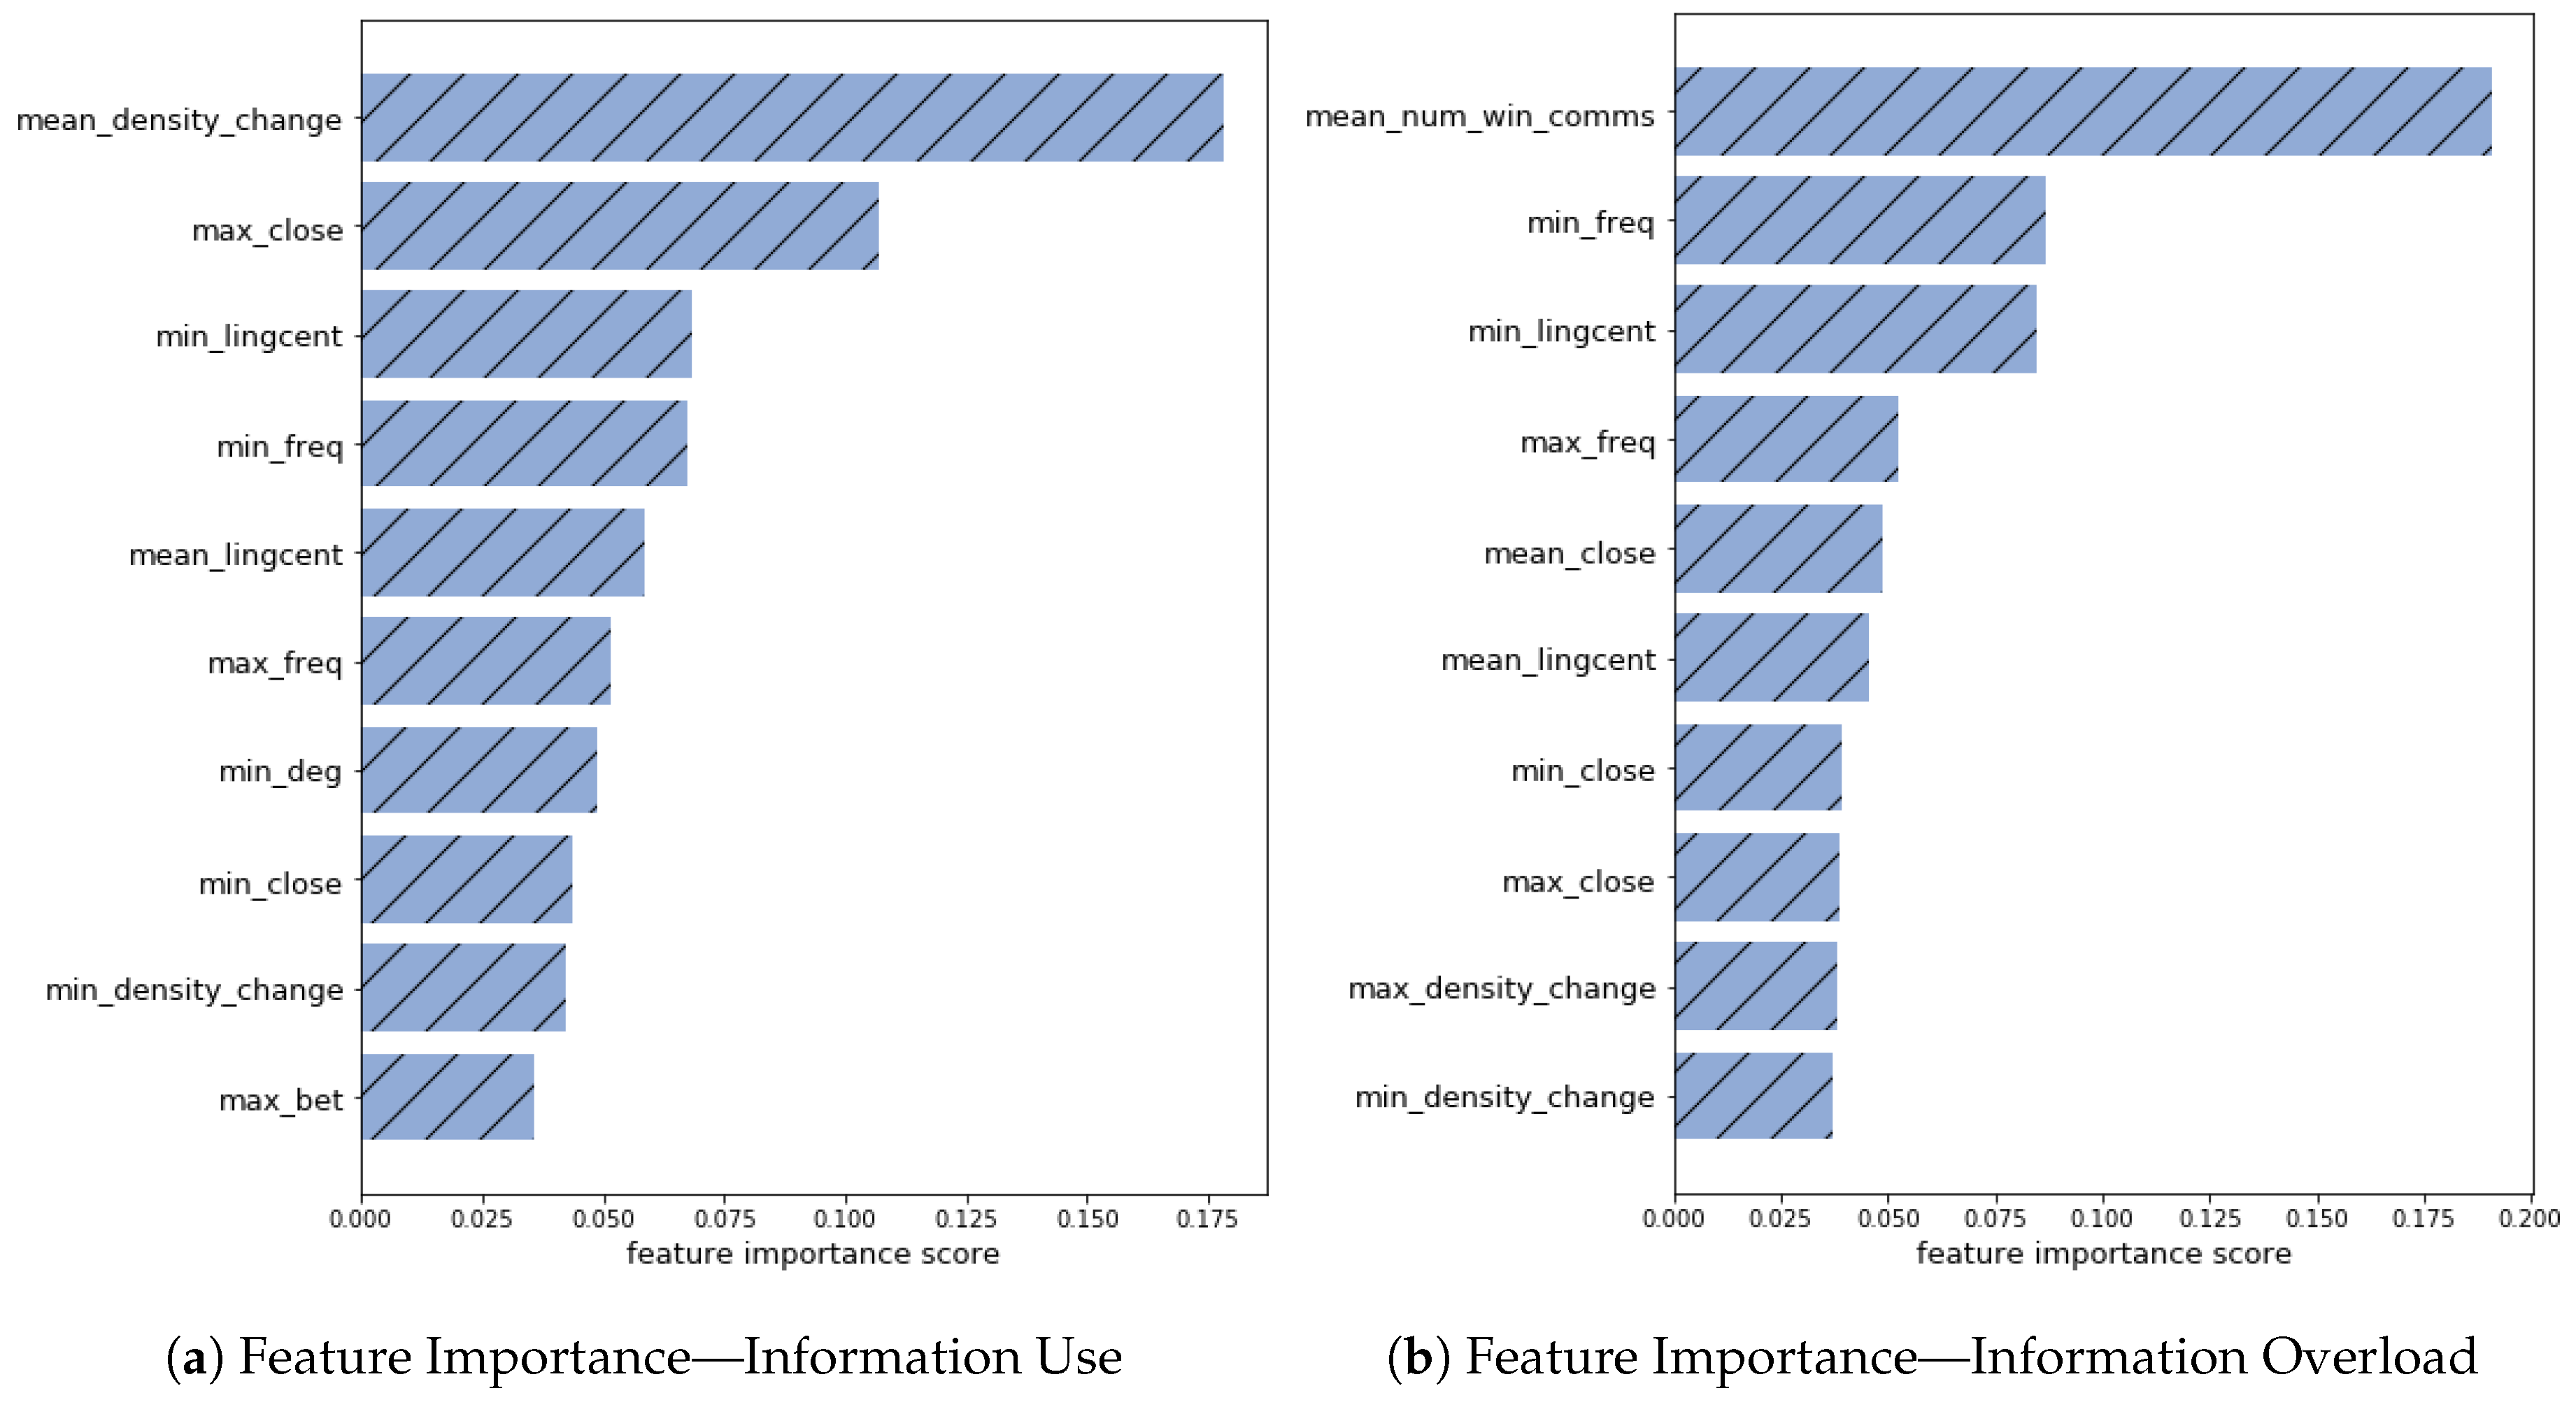
Feature Classes
5. Conclusions
Funding
Acknowledgments
Conflicts of Interest
References
- Eppler, M.J.; Mengis, J. The concept of information overload: A review of literature from organization science, accounting, marketing, MIS, and related disciplines. Inf. Soc. 2004, 20, 325–344. [Google Scholar] [CrossRef]
- Murray, G.; Kleinbauer, T.; Poller, P.; Becker, T.; Renals, S.; Kilgour, J. Extrinsic summarization evaluation: A decision audit task. ACM Trans. Speech Lang. Process. (TSLP) 2009, 6, 2. [Google Scholar] [CrossRef]
- Montavon, G.; Samek, W.; Müller, K.R. Methods for interpreting and understanding deep neural networks. Digit. Signal Process. 2018, 73, 1–15. [Google Scholar] [CrossRef]
- Mueller, S.T.; Hoffman, R.R.; Clancey, W.; Emrey, A.; Klein, G. Explanation in Human-AI Systems: A Literature Meta-Review, Synopsis of Key Ideas and Publications, and Bibliography for Explainable AI. arXiv 2019, arXiv:1902.01876. [Google Scholar]
- Sun, C.; Shrivastava, A.; Singh, S.; Gupta, A. Revisiting unreasonable effectiveness of data in deep learning era. In Proceedings of the IEEE International Conference on Computer Vision, Venice, Italy, 22–29 October 2017; pp. 843–852. [Google Scholar]
- Lai, C.; Murray, G. Predicting group satisfaction in meeting discussions. In Proceedings of the Workshop on Modeling Cognitive Processes from Multimodal Data, Boulder, CO, USA, 16 October 2018. [Google Scholar]
- Murray, G. Connecting Small Group Affect and Social Network Centrality Measures. In Proceedings of the International Conference on Computational Social Science (IC2S2), Amsterdam, The Netherlands, 17–20 July 2019. [Google Scholar]
- Raaijmakers, S.; Truong, K.; Wilson, T. Multimodal subjectivity analysis of multiparty conversation. In Proceedings of the Conference on Empirical Methods in Natural Language Processing. Association for Computational Linguistics, Honolulu, HI, USA, 25–27 October 2008; pp. 466–474. [Google Scholar]
- Avci, U.; Aran, O. Predicting the performance in decision-making tasks: From individual cues to group interaction. IEEE Trans. Multimed. 2016, 18, 643–658. [Google Scholar] [CrossRef]
- Murray, G.; Oertel, C. Predicting Group Performance in Task-Based Interaction. In Proceedings of the ICMI 2018, Boulder, CO, USA, 16–20 October 2018; pp. 14–20. [Google Scholar]
- Beyan, C.; Katsageorgiou, V.M.; Murino, V. Moving as a Leader: Detecting Emergent Leadership in Small Groups using Body Pose. In Proceedings of the 25th ACM International Conference on Multimedia, Mountain View, CA, USA, 23–27 October 2017; pp. 1425–1433. [Google Scholar]
- Sanchez-Cortes, D.; Aran, O.; Mast, M.S.; Gatica-Perez, D. A nonverbal behavior approach to identify emergent leaders in small groups. IEEE Trans. Multimed. 2012, 14, 816–832. [Google Scholar] [CrossRef]
- Gillick, D.; Riedhammer, K.; Favre, B.; Hakkani-Tur, D. A global optimization framework for meeting summarization. In Proceedings of the 2009 IEEE International Conference on Acoustics, Speech and Signal Processing, Taipei, Taiwan, 19–24 April 2009; pp. 4769–4772. [Google Scholar]
- Shang, G.; Ding, W.; Zhang, Z.; Tixier, A.; Meladianos, P.; Vazirgiannis, M.; Lorré, J.P. Unsupervised Abstractive Meeting Summarization with Multi-Sentence Compression and Budgeted Submodular Maximization. In Proceedings of the 56th Annual Meeting of the Association for Computational Linguistics, Melbourne, Australia, 15–20 July 2018; pp. 664–674. [Google Scholar]
- Tur, G.; Stolcke, A.; Voss, L.; Peters, S.; Hakkani-Tur, D.; Dowding, J.; Favre, B.; Fernández, R.; Frampton, M.; Frandsen, M.; et al. The CALO meeting assistant system. IEEE Trans. Audio Speech Lang. Process. 2010, 18, 1601–1611. [Google Scholar] [CrossRef]
- Renals, S.; Hain, T.; Bourlard, H. Recognition and understanding of meetings the AMI and AMIDA projects. In Proceedings of the 2007 IEEE Workshop on Automatic Speech Recognition & Understanding (ASRU), Kyoto, Japan, 9–13 December 2007; pp. 238–247. [Google Scholar]
- Simperl, E.; Thurlow, I.; Warren, P.; Dengler, F.; Davies, J.; Grobelnik, M.; Mladeni, D.; Gomez-Perez, J.M.; Moreno, C.R. Overcoming information overload in the enterprise: The active approach. IEEE Internet Comput. 2010, 14, 39–46. [Google Scholar] [CrossRef]
- Maes, P. Agents that reduce work and information overload. In Readings in Human–Computer Interaction; Elsevier: New York, NY, USA, 1995; pp. 811–821. [Google Scholar]
- Hiltz, S.R.; Plotnick, L. Dealing with information overload when using social media for emergency management: Emerging solutions. In Proceedings of the ISCRAM 2013, Baden-Baden, Germany, 12–15 May 2013. [Google Scholar]
- Carletta, J. Unleashing the killer corpus: Experiences in creating the multi-everything AMI Meeting Corpus. Lang. Resour. Eval. 2007, 41, 181–190. [Google Scholar] [CrossRef]
- Clauset, A.; Newman, M.E.; Moore, C. Finding community structure in very large networks. Phys. Rev. E 2004, 70, 066111. [Google Scholar] [CrossRef] [PubMed] [Green Version]
- Gerlach, M.; Peixoto, T.P.; Altmann, E.G. A network approach to topic models. Sci. Adv. 2018, 4, eaaq1360. [Google Scholar] [CrossRef] [PubMed] [Green Version]
- Blei, D.M.; Ng, A.Y.; Jordan, M.I. Latent dirichlet allocation. J. Mach. Learn. Res. 2003, 3, 993–1022. [Google Scholar]
- Reitter, D.; Moore, J.D. Alignment and task success in spoken dialogue. J. Mem. Lang. 2014, 76, 29–46. [Google Scholar] [CrossRef]
- Rahimi, Z.; Kumar, A.; Litman, D.J.; Paletz, S.; Yu, M. Entrainment in Multi-Party Spoken Dialogues at Multiple Linguistic Levels. In Proceedings of the Interspeech 2017, Stockholm, Sweden, 20–24 August 2017; pp. 1696–1700. [Google Scholar]


| Model | Inf. Use | Inf. Overload |
|---|---|---|
| baseline (mean) | 8.96 | 15.12 |
| baseline (median) | 9.30 | 15.03 |
| LM | 9.07 | 18.52 |
| GB | 7.64 | 17.86 |
| RF | 6.99 | 13.38 |
| Feature | Inf. Use | Inf. Overload |
|---|---|---|
| mean_density_change | −529.578 | −166.207 |
| min_density_change | 14.167 | 158.908 |
| max_density_change | −7.297 | −3.480 |
| mean_lingcent | 3.707 | −3.970 |
| min_lingcent | −2.196 | 6.636 |
| mean_num_win_comms | 0.677 | −1.753 |
| mean_close | 51.277 | 31.972 |
| min_close | −27.359 | −99.567 |
| max_close | −11.310 | −41.714 |
| min_freq | −0.014 | 0.510 |
| max_freq | −0.432 | 0.711 |
| max_bet | 3.110 | −16.276 |
| min_deg | 8.205 | 12.194 |
| Feature Class | Inf. Use | Inf. Overload |
|---|---|---|
| Linguistic Only | 7.48 | 13.99 |
| Turn-Taking Only | 8.03 | 15.69 |
| All Features | 6.99 | 13.38 |
© 2019 by the author. Licensee MDPI, Basel, Switzerland. This article is an open access article distributed under the terms and conditions of the Creative Commons Attribution (CC BY) license (http://creativecommons.org/licenses/by/4.0/).
Share and Cite
Murray, G. Information Processing and Overload in Group Conversation: A Graph-Based Prediction Model. Multimodal Technol. Interact. 2019, 3, 46. https://doi.org/10.3390/mti3030046
Murray G. Information Processing and Overload in Group Conversation: A Graph-Based Prediction Model. Multimodal Technologies and Interaction. 2019; 3(3):46. https://doi.org/10.3390/mti3030046
Chicago/Turabian StyleMurray, Gabriel. 2019. "Information Processing and Overload in Group Conversation: A Graph-Based Prediction Model" Multimodal Technologies and Interaction 3, no. 3: 46. https://doi.org/10.3390/mti3030046
APA StyleMurray, G. (2019). Information Processing and Overload in Group Conversation: A Graph-Based Prediction Model. Multimodal Technologies and Interaction, 3(3), 46. https://doi.org/10.3390/mti3030046