1. Introduction
Augmented reality (AR) describes the interactive experience of situating computer-generated information, within the real world. This is achieved by overlaying digital imagery onto images of the natural world in real-time, anchored to points in the environment. Due to technological advances, affordable augmented reality devices are beginning to be used to support the participatory planning process and to better inform stakeholders of design interventions in on-site and off-site sessions during planning and design research [
1,
2,
3].
Stakeholder involvement within the planning and design disciplines (including, e.g., architecture, planning, landscape architecture) has increased over the years, with the goal of workshops evolving from an initial emphasis solely on communication, towards a more participatory approach. Active stakeholder involvement has become a requirement to facilitate collaboration towards successful project outcomes. Common workshop themes include land-use planning [
4], landscape management [
5] and flood risk management [
6].
Traditionally, workshops were supported by large hard-copy maps, in combination with sheets of tracing paper. This is still current practice; however, as Geographic Information Systems (GIS) technology became widely adopted, digital technologies have often replaced base maps and tracing paper with map layers presented using GIS visualisations on a computer screen. Currently, large horizontal touch-sensitive screens, known as touch-tables are commonplace as an intermediary between hard copy base maps and desktop-based GIS visualisations [
4].
Augmented reality applications can build on the success of interactive digital touch-tables, enhancing the visual experience, while retaining the interactivity and computational advantages of digital devices over their analogue counterparts. In previous augmented reality studies, participants reported feeling comfortable with using augmented reality as a tool to explore future interventions [
7]. Furthermore 3D exploration within augmented reality has been shown to improve users spatial cognition of design interventions [
8]. Touch-tables provide a familiar interface with traditional hard copy base maps but are limited in their ability to display and interact with 3D data, and remain constrained to a single perspective, shared between multiple users. In contrast, augmented reality software excels in displaying 3D information within the real world, with each user having a unique perspective and control over how the data presented.
In this paper, we demonstrate an augmented reality enabled planning and design application used for exploring cartographic visualisations, to enhance traditional planning and design workshops. We document a set of software pipelines to convert industry standard digital elevation models (DEM) into interactive terrain visualisations to support workshops, public communication and researchers alike. The aim of this open software is to support and encourage further investigation using augmented reality as a workshop tool in planning and design. This paper aims to detail the technical capabilities of the software and demonstrate the potential range of case study applications which could be enriched through this interactive, multi-user augmented reality approach.
2. Related Work
Maps provide an established medium for adding a spatial context for decision options, presenting decision alternatives and exploring spatial patterns. Despite not being easy to understand or use, maps are often stakeholders’ preferred information source in spatial decision making, with topographic maps often used as background information to support decisions [
9]. However, as technology progresses, new digital methods are being employed to enhance traditional map-based stakeholder participation activities, supporting cooperative workflows.
Computer supported cooperative work (CSCW) has a rich research tradition, seeking to understand the nature and characteristics of cooperative work, with the objective of designing digital technologies to enhance cooperative working patterns [
10]. Early CSCW work focused on discovering the principles for successful collaboration in shared digital spaces. The spatio-temporal nature of collaborative software can be characterized by a 2 × 2 matrix classifying collaborative software into four categories depending on whether activities are concurrent or disjunct in both time and place [
11]. Here we discuss existing planning and design applications of CSCW software, enabling face-to-face interactions to support shared decision making concurrent in time and place.
One current application of CSCW used in stakeholder participation in landscape architecture is the digital touch-table [
4,
12]. The touch-table is a large touch-enabled screen, which allows up to four users to work around it, recognising which user is touching it and where. The table displays an image coming from an overhead video projector that is aimed down onto the touch surface. Both the touch-table and video projector must be connected to a laptop.
Touch-tables enable face-to-face group collaboration and decision-making. The device allows users to work with computer-based spatial tools, providing a shared map interface which can complement large-format printed maps. Stakeholders are invited to work together around touch-tables to share their views about a study area. They make use of a set of digital maps to improve stakeholder understanding of the problem space, prompt exchange of local knowledge and encourage stakeholder dialogue and to identify stakeholder objectives.
In a survey of participants in a touch-table supported workshop, 70% of participants preferred the touch-table over printed maps, and 80% thought that the touch-table has an added value [
4]. These results suggest that digitisation and easy access to computational tools provide a useful addition due to the possibilities to easily choose, combine and consult maps at different levels of detail.
Since the inception of the CSCW research field, technological capabilities have improved immensely, moving away from desktop computers as tools to aid in collaboration, to developing specialised spatial computing devices using virtual and augmented reality technology [
13,
14,
15]. In turn, the specialised AR tools have become commonplace technologies embodying ubiquitous computing principles while enabling seamless integration within hybrid worlds and shared digital spaces [
16].
Expanding on the 2D cartographic visualisations of the touch-table, the AR Sandbox [
17] is a lab-based augmented reality tool used to encourage creative spatial solutions, facilitate collaborative design and explore water dynamics over an interactive landscape model [
18]. AR Sandboxes are used in both planning and design practice, as well as an educational tool with over 150 labs adopting the technology [
18].
Like the touch-table, the AR Sandbox uses an overhead projector to project digital information; however, by using a Microsoft Kinect scanner, and a sandbox complete with a moulded sand terrain, the project can augment a sand terrain model with accurate topographic information. The visualisation is updated in real time, as users sculpt changes to the sand topography. This innovative feedback loop of human input and reactive simulation allows multiple users to manipulate the sand terrain and simultaneously witness how a digital simulation reflects changes to a physical model in real time. The AR Sandbox includes water flow simulation, allowing digital water to flow over the surface of the sand with respect to the digitised elevation map [
18].
The main benefit of the AR Sandbox was reported to be the rapid visualisation of landscape changes, creating a useful tool to engage participants in spatial design, without depending on map-reading ability [
17]. As such, it is especially suited to collaborative design exercises in a workshop setting. However, the medium of sand poses several drawbacks. Firstly, the sand restricts the process to low-detail terrain models with significant overhead in creating an initial terrain mould. This is compounded by the fact that terrain modelling in sand is a destructive process, as changes cannot easily be undone, and contributions from multiple users cannot be tracked. Furthermore, the format does not easily support a multi-workshop workflow, as insights created in a design focused workshop cannot easily be recreated for continued evaluation in a follow-up workshop.
In contrast to augmenting physical objects with digital information, pure augmented reality systems create entirely virtual objects with which to share and interact. Mobile augmented reality systems have had a long history of development using custom hardware. An early example of this is the Transvision mobile augmented reality collaborative work software [
14], which enabled users to view and reposition virtual objects through a mobile screen. Further developments establishing methods to edit virtual objects collaboratively through transferable object ownership [
15].
In this paper, we set out to build a mobile augmented reality tool which captures the dynamic nature of the AR Sandbox, while also implementing the multiple-workshop workflows supported through map annotations and spatial analysis on the touch-table. In contrast to early CSCW applications, we use off-the-shelf hardware to demonstrate the burgeoning maturity of augmented reality as a collaborative medium. Building on early progress in computer-supported collaborative work systems using mobile augmented reality [
19], we show complex collaborative interactions including manipulations, annotations, object editing, focused on supporting multi-user design and planning workshops.
3. Methods and Materials
We aim to create an augmented reality application to support collaborative landscape design and flood visualisation in planning and design workshops, which is accessible through a variety of augmented reality hardware, suitable for both on-site and lab-based demonstrations.
3.1. Augmented Reality Visualisation
Augmented reality requires that a digital device can overlay digital information over the real world, and maintain accurate tracking of the digital object as a user freely explores the space around it. Currently, tracking is achieved through two primary methods, fiducial markers and environmental tracking. Fiducial marker tracking overlays the digital augmentation over a fixed, highly salient image in the environment, such as a QR code. In a workshop setting, this has the advantage of providing a single, central location for multiple users to focus upon. Each user perceives the same digital model in the same physical place. Alternatively, environmental tracking finds naturally salient points in an environment, which enables a user to anchor their digital models to an arbitrary place in space. This enables users to place a model as they see fit, and do not have to orbit the same physical point. While less suitable for workshops, environmental tracking enables the AR explorations to take place simultaneously in remote locations, or in the field.
Here we utilise the Unity Game Engine, which supports both fiducial marker and environmental tracking, and has a strong presence in the planning and design literature, with applications in public participation [
7], spatial cognition [
8] and flood risk communication [
20]. It is further suited to develop an augmented reality planning and design application, due to supporting a myriad of AR frameworks, including Vuforia for platform-independent AR, Google ARCore for Android devices, Apple ARKit for iOS devices and Windows Mixed Reality for the Microsoft Hololens.
Importantly, to support landscape visualisation, the Unity Game Engine contains an extensible terrain system, capable of displaying large landscape meshes, with the ability to customise how the terrain is textured through the custom material shaders. Finally, to enable user interactions within our software, the Unity Game Engine supports an array of input modalities, including touch and gesture inputs for mobile devices.
3.2. Data and Materials
We visualise two separate locations to illustrate our software. First, we visualise a section of Los Osos from the Diablo Canyon Power Plant (DCPP) LIDAR and Imagery dataset distributed by Open Topography [
21]. The DCPP Los Osos project study area is located in San Luis Obispo County, California, and encompasses approximately 675 square kilometres. Here we model a 13 square kilometre area centred on Avila Beach, which suffered from severe flooding in March of 2018. Secondly, we visualise flood plane progression using a section of the lower Rio Puerco arroyo dataset in north-central New Mexico, collected initially to study overbank flood dynamics and distributed by Open Topography [
22].
All data displayed in the application are based on 2D image files, which can be generated through GIS software. Polygon data is not yet supported for visualisation. Instead, polygon data must be rasterised before being integrated into the visualisation pipeline.
3.3. Terrain Visualisation Pipeline
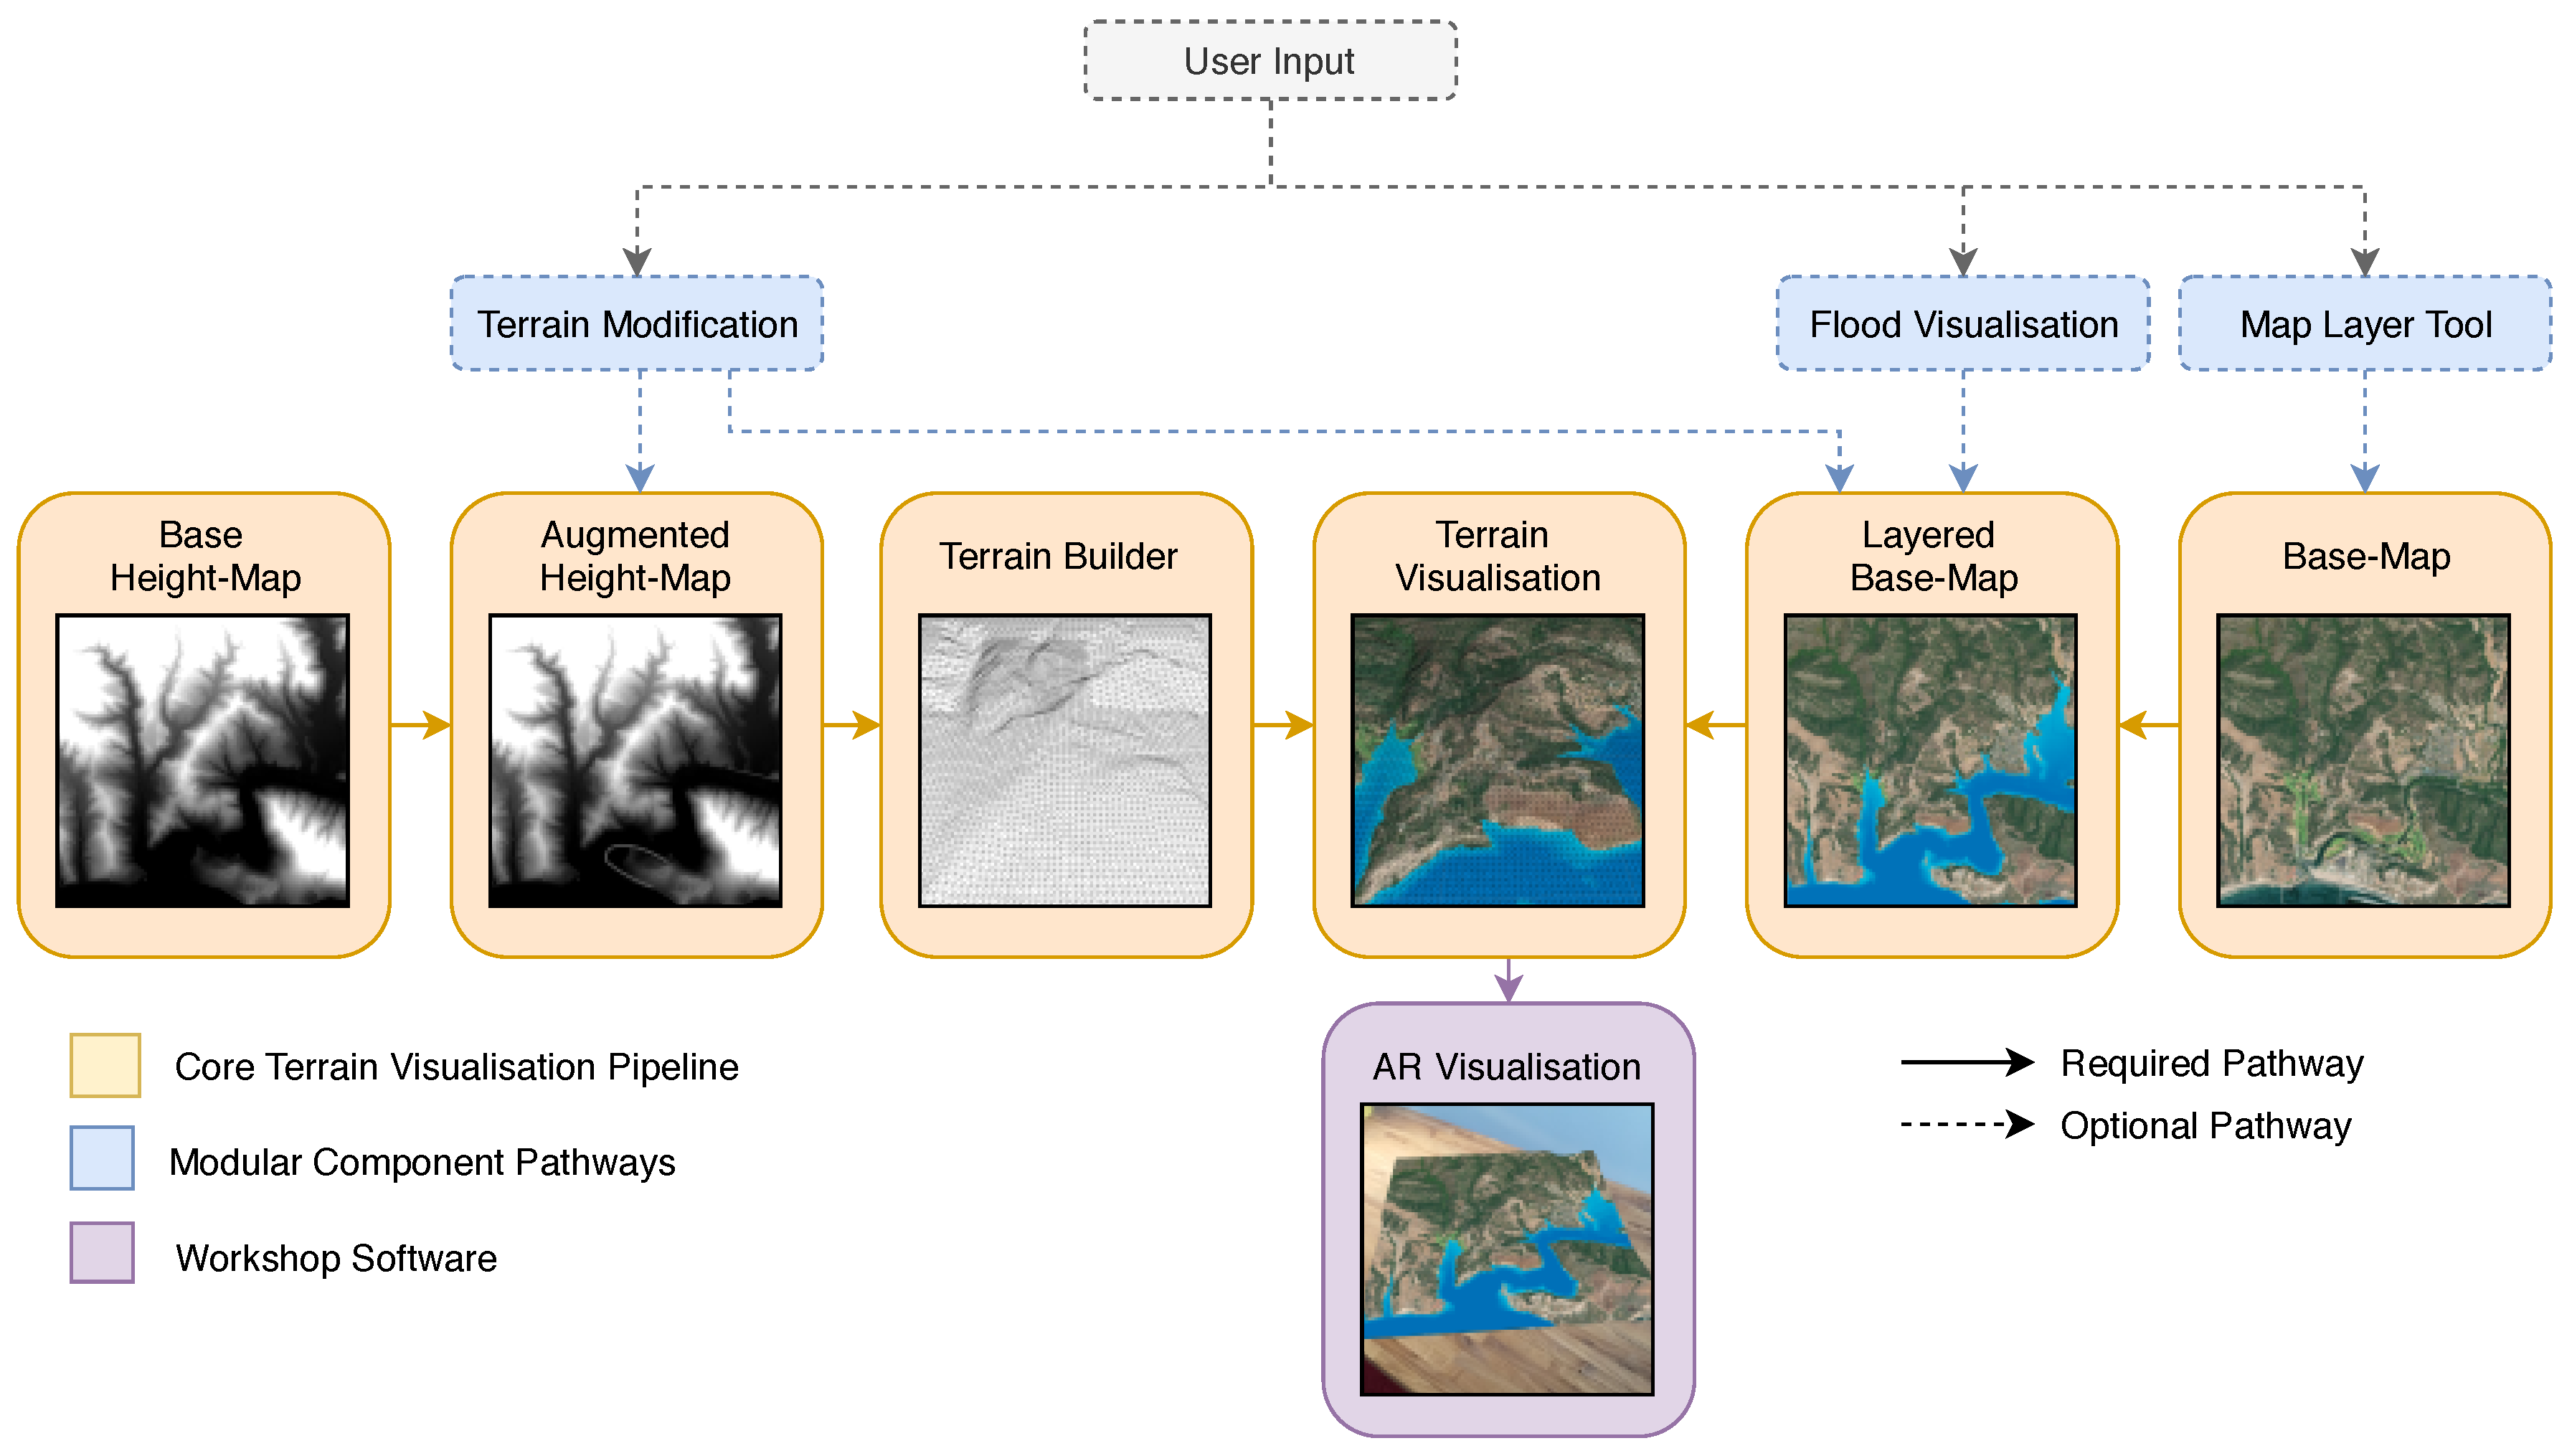
In order to create a terrain visualisation, we require only two sets of data. First, a digital elevation model in the form of a grayscale rasterised height map. Our Terrain Builder component automatically converts the height map into a terrain mesh, based on a regular grid extracted from the height map. Secondly, a base texture for the visualisation is required, which we use to visualise the terrain mesh. Further visualisation options are available to create a more immersive and dynamic experience. We provide a map layer tool to dynamically change the base map while retaining any additionally visualised data layers. All geospatial imagery is in the form of static images that are prepared in advance, currently supporting a single level of detail per map instance.
Figure 1 shows the pipeline for creating the landscape visualisation, starting on the left with the base height map and on the right with the base map. A terrain mask can be optionally supplied, to limit the terrain visualisation to a particular shape, in order to restrict the visualisation to a land boundary or feature. Our core pipeline, shown in yellow in
Figure 1, is built to provide several extendable points to act as a basis for all further visualisations and interactions documented in this paper.
We provide a selection of components to accomplish interactive visualisations. The default terrain visualisation component takes a single base map, to drape over the terrain. Other components have been created to enable specific interactions or computations, such as flood risk visualisation (
Figure 2), and terrain modification (
Figure 3), which augment the base map with simulation or annotation data.
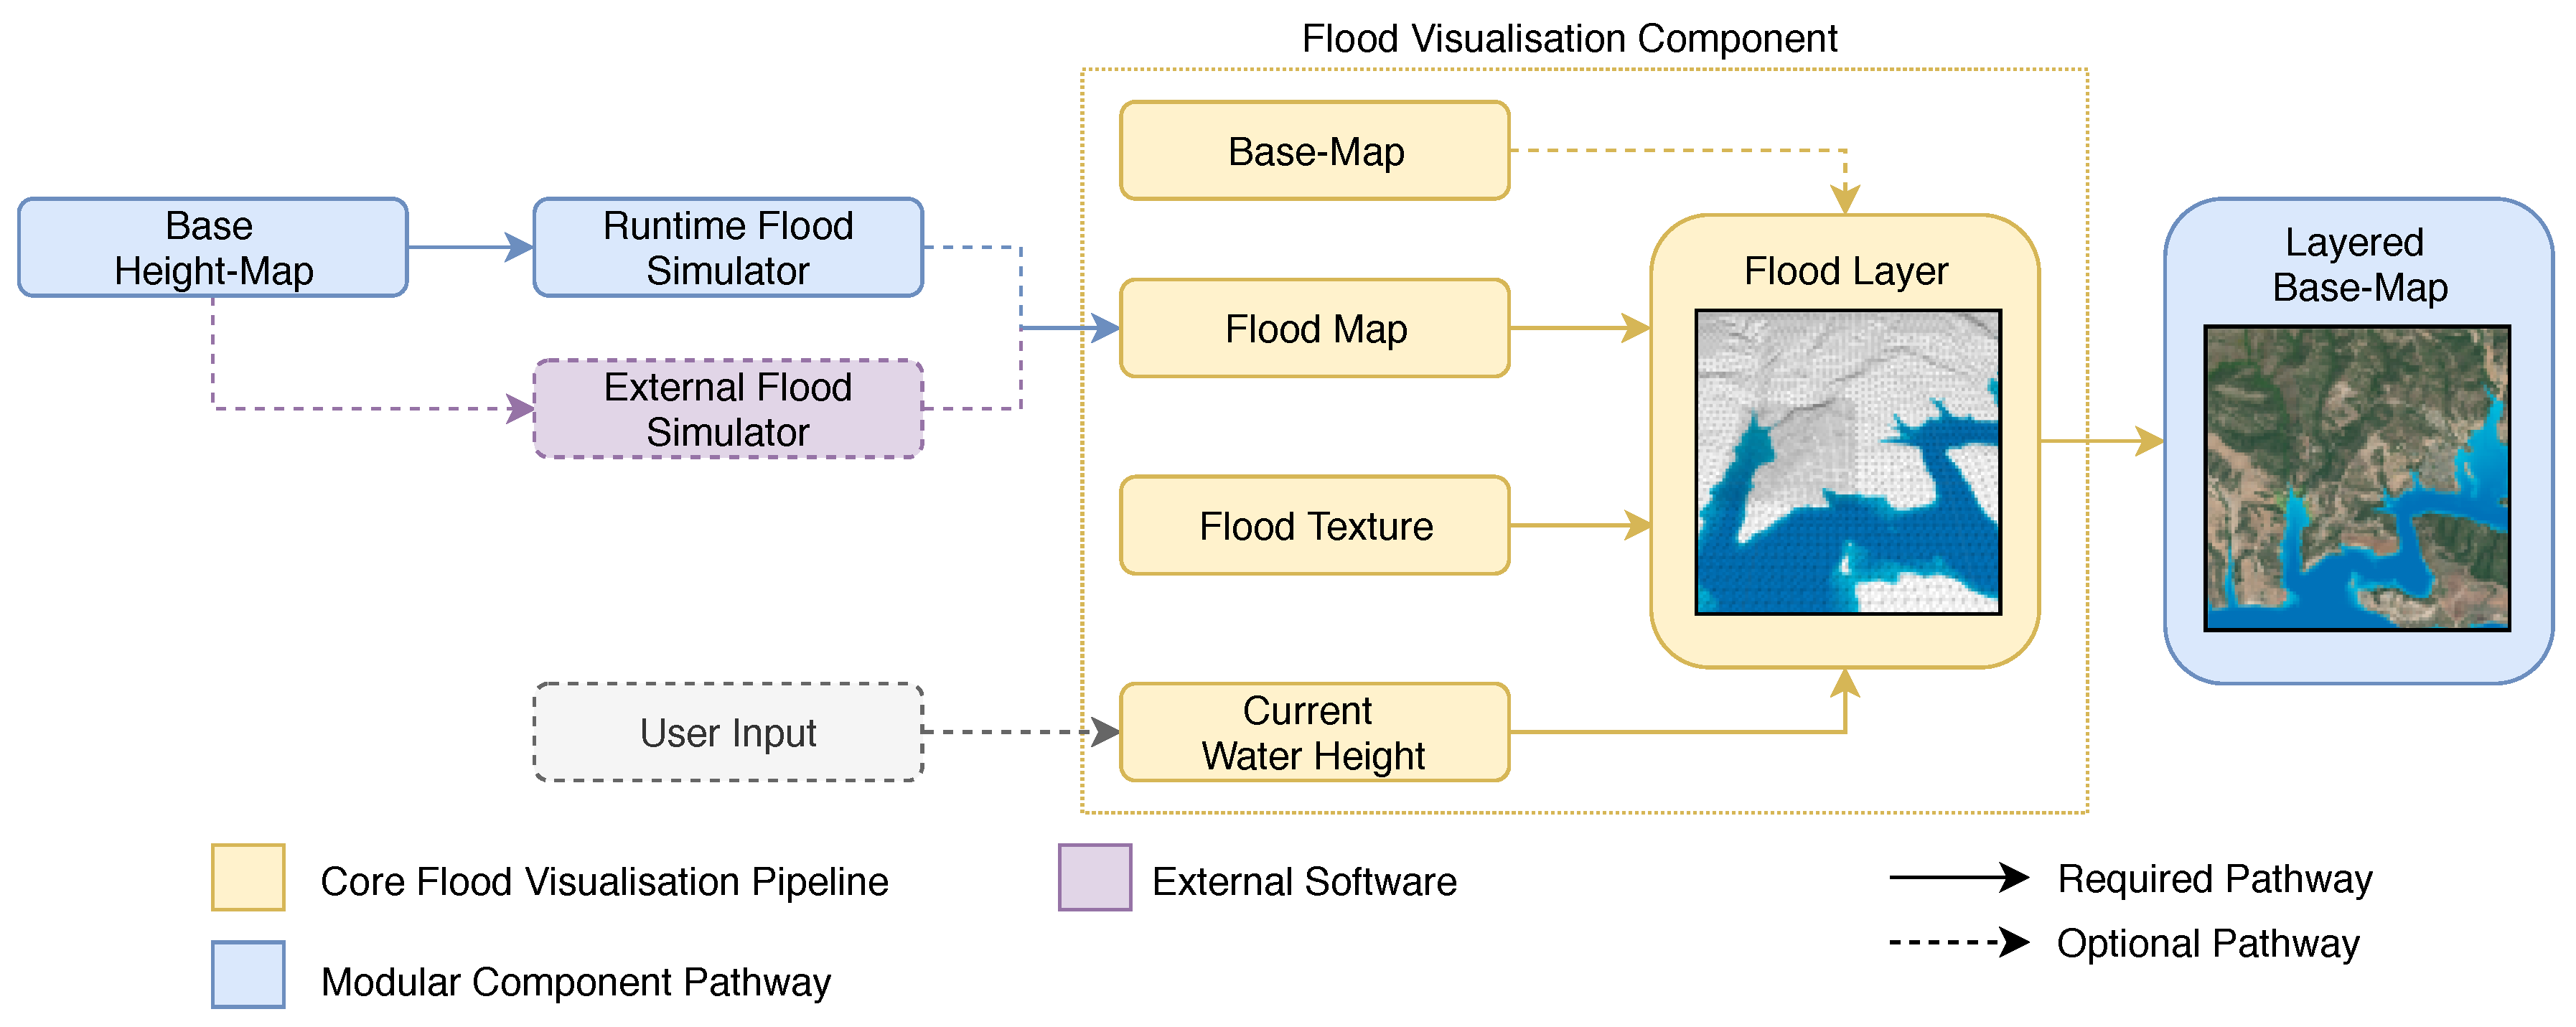
3.4. Flood Visualisation Pipeline
In this section, we do not aim to improve upon current hydrological modelling methodologies. Instead, we aim to promote dynamic visualisation as a method to encourage stakeholder discussion with the goal of informing design, comprehension and evaluation of proposed landscape interventions. To accomplish this, we have designed a pipeline which is independent of the flood simulation method used, requiring only that a flood-stage map is provided, as shown in
Figure 2. This enables the tool to either utilise complex hydrological models in a research capacity [
23,
24] or simplified conceptual models as a communication tool [
25].
To enable real-time flooding in response to real-time terrain modification, we provide an efficient implementation of a hydrologically connected “bath-tub” model of flood propagation, which removes flow dynamics, to enable a computationally efficient algorithm suitable for flood risk assessment and scenario modelling [
25,
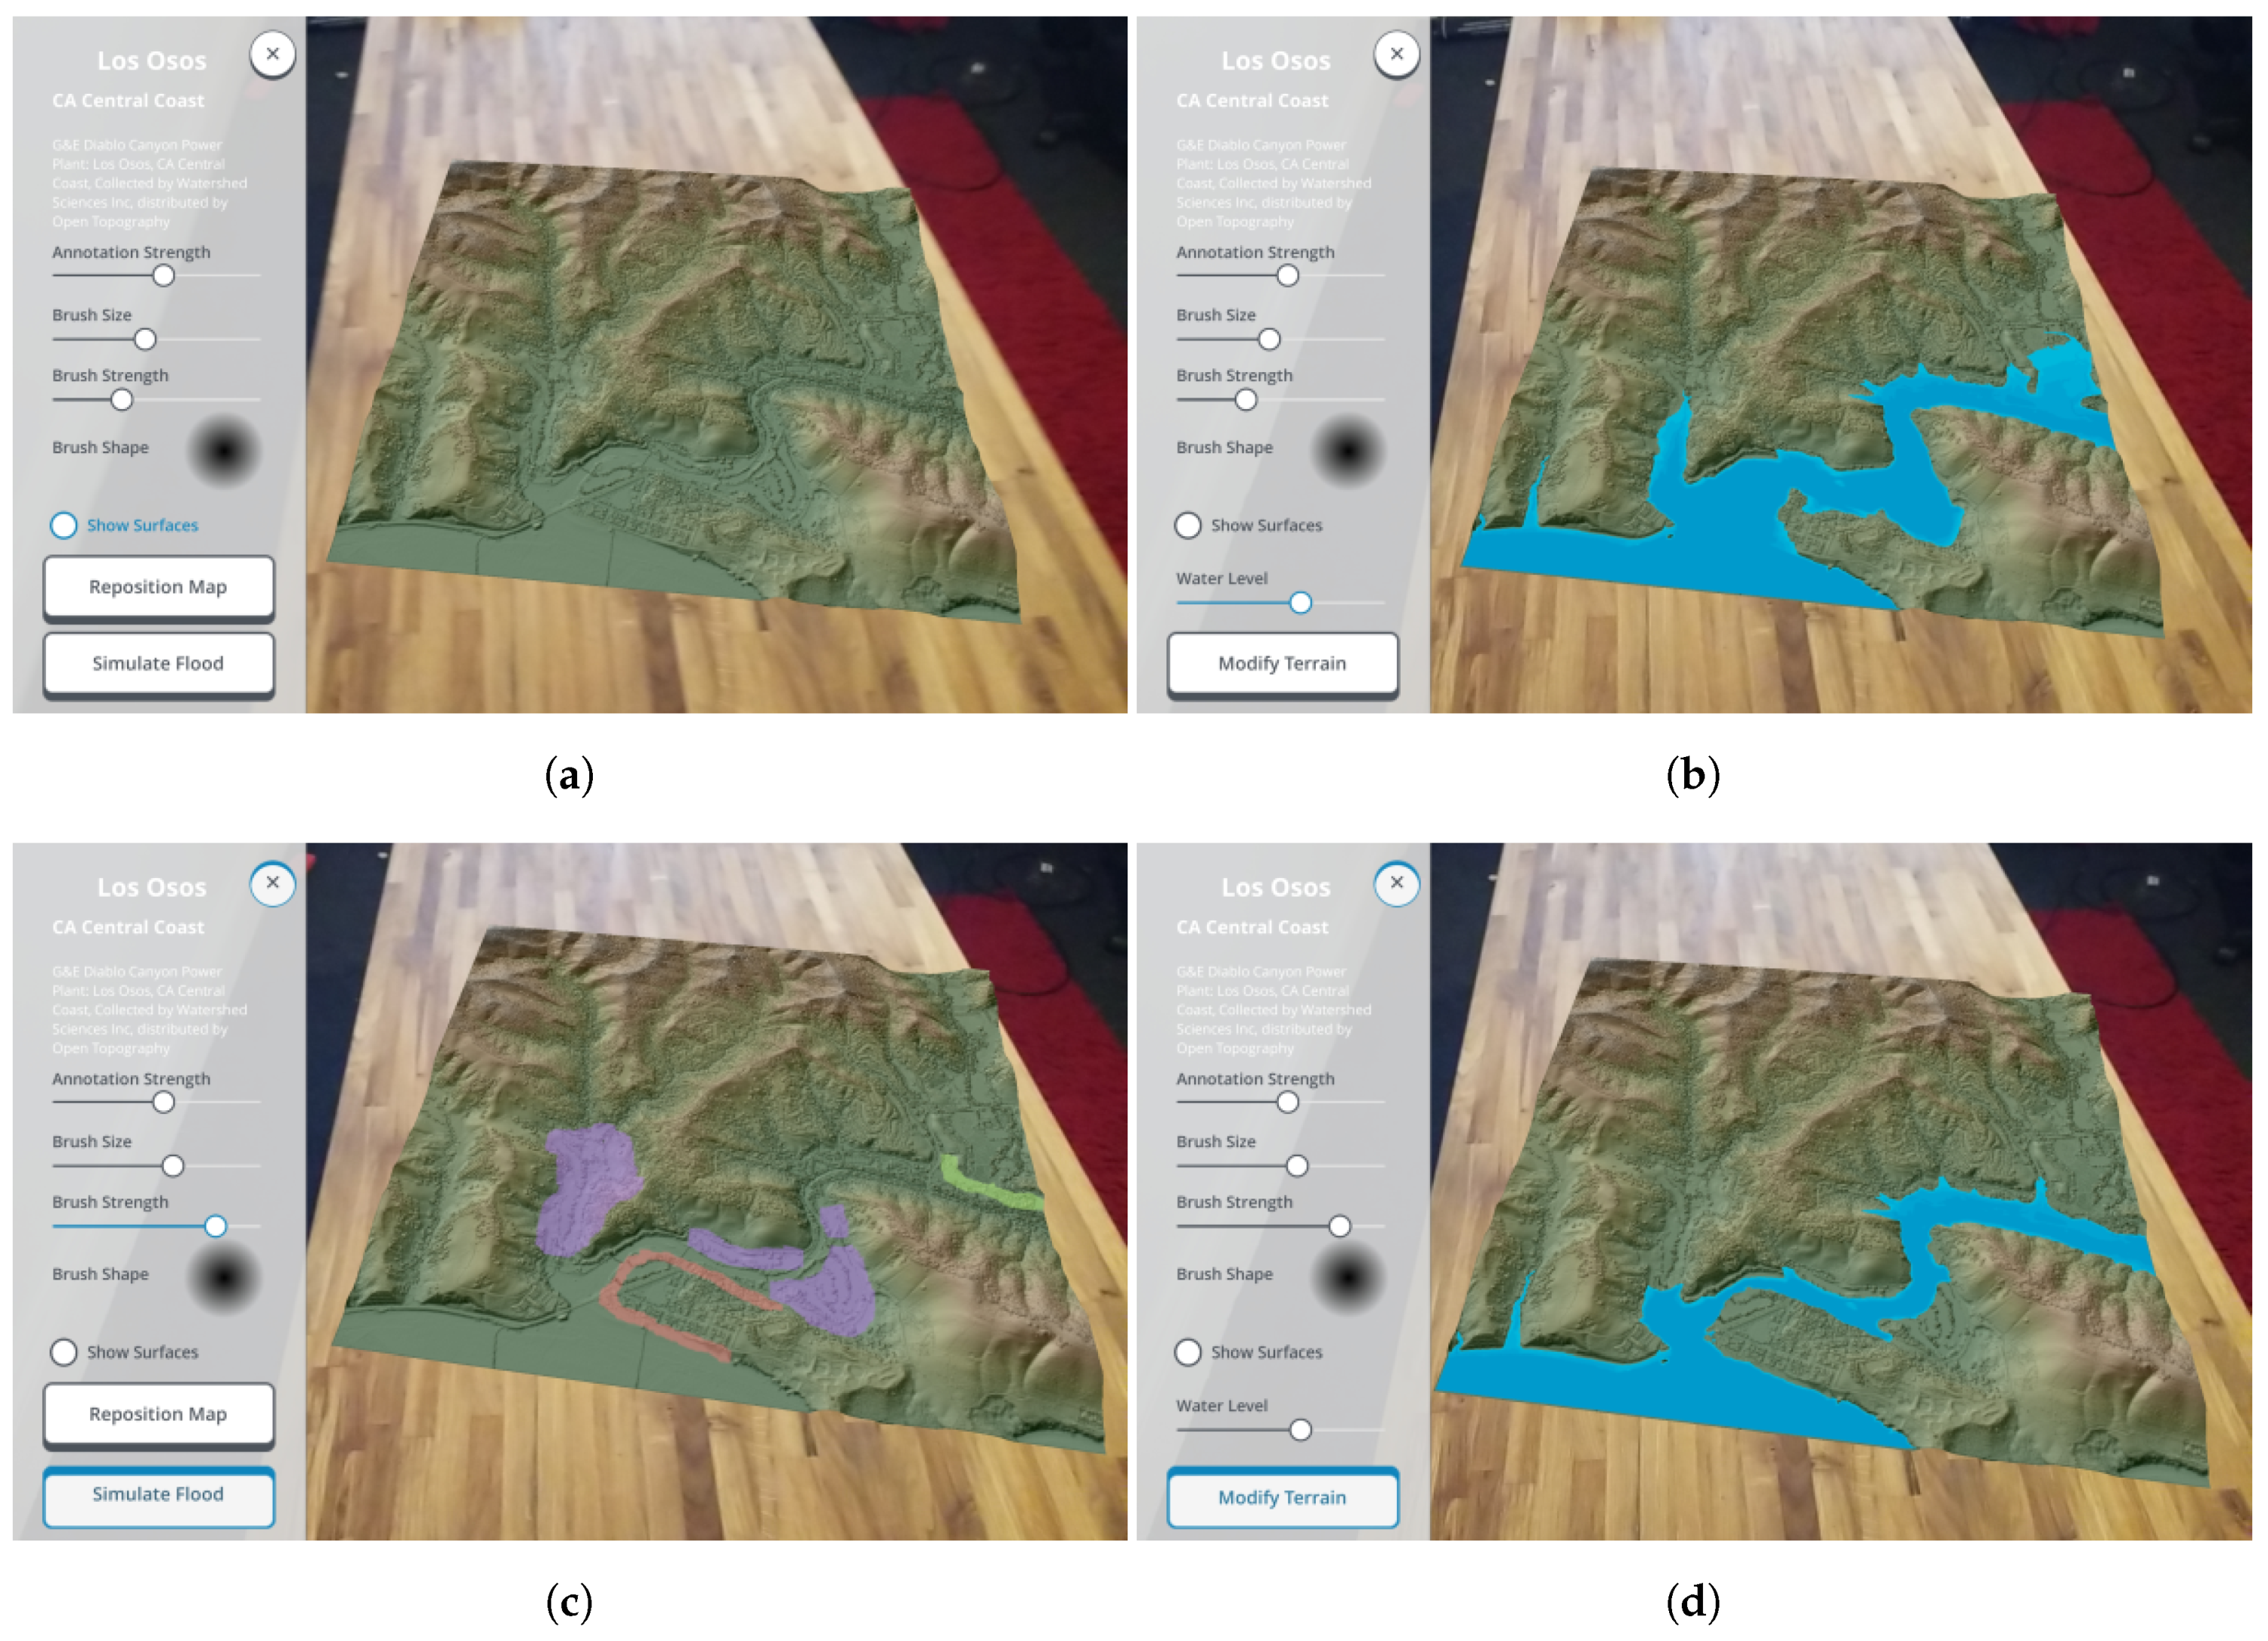
26]. Our simulation remains computationally tractable, to provide expedited user feedback during design exercises. The flood map can be dynamically recalculated at run-time natively on the AR device, giving the ability to update the flood map with respect to underlying changes in the base height map created through terrain modification. Floodwaters are visualised to encode the water depth as a gradient in colour, with darker colours representing deeper water. Users can vary this flood height to visualise the flood progression in real time.
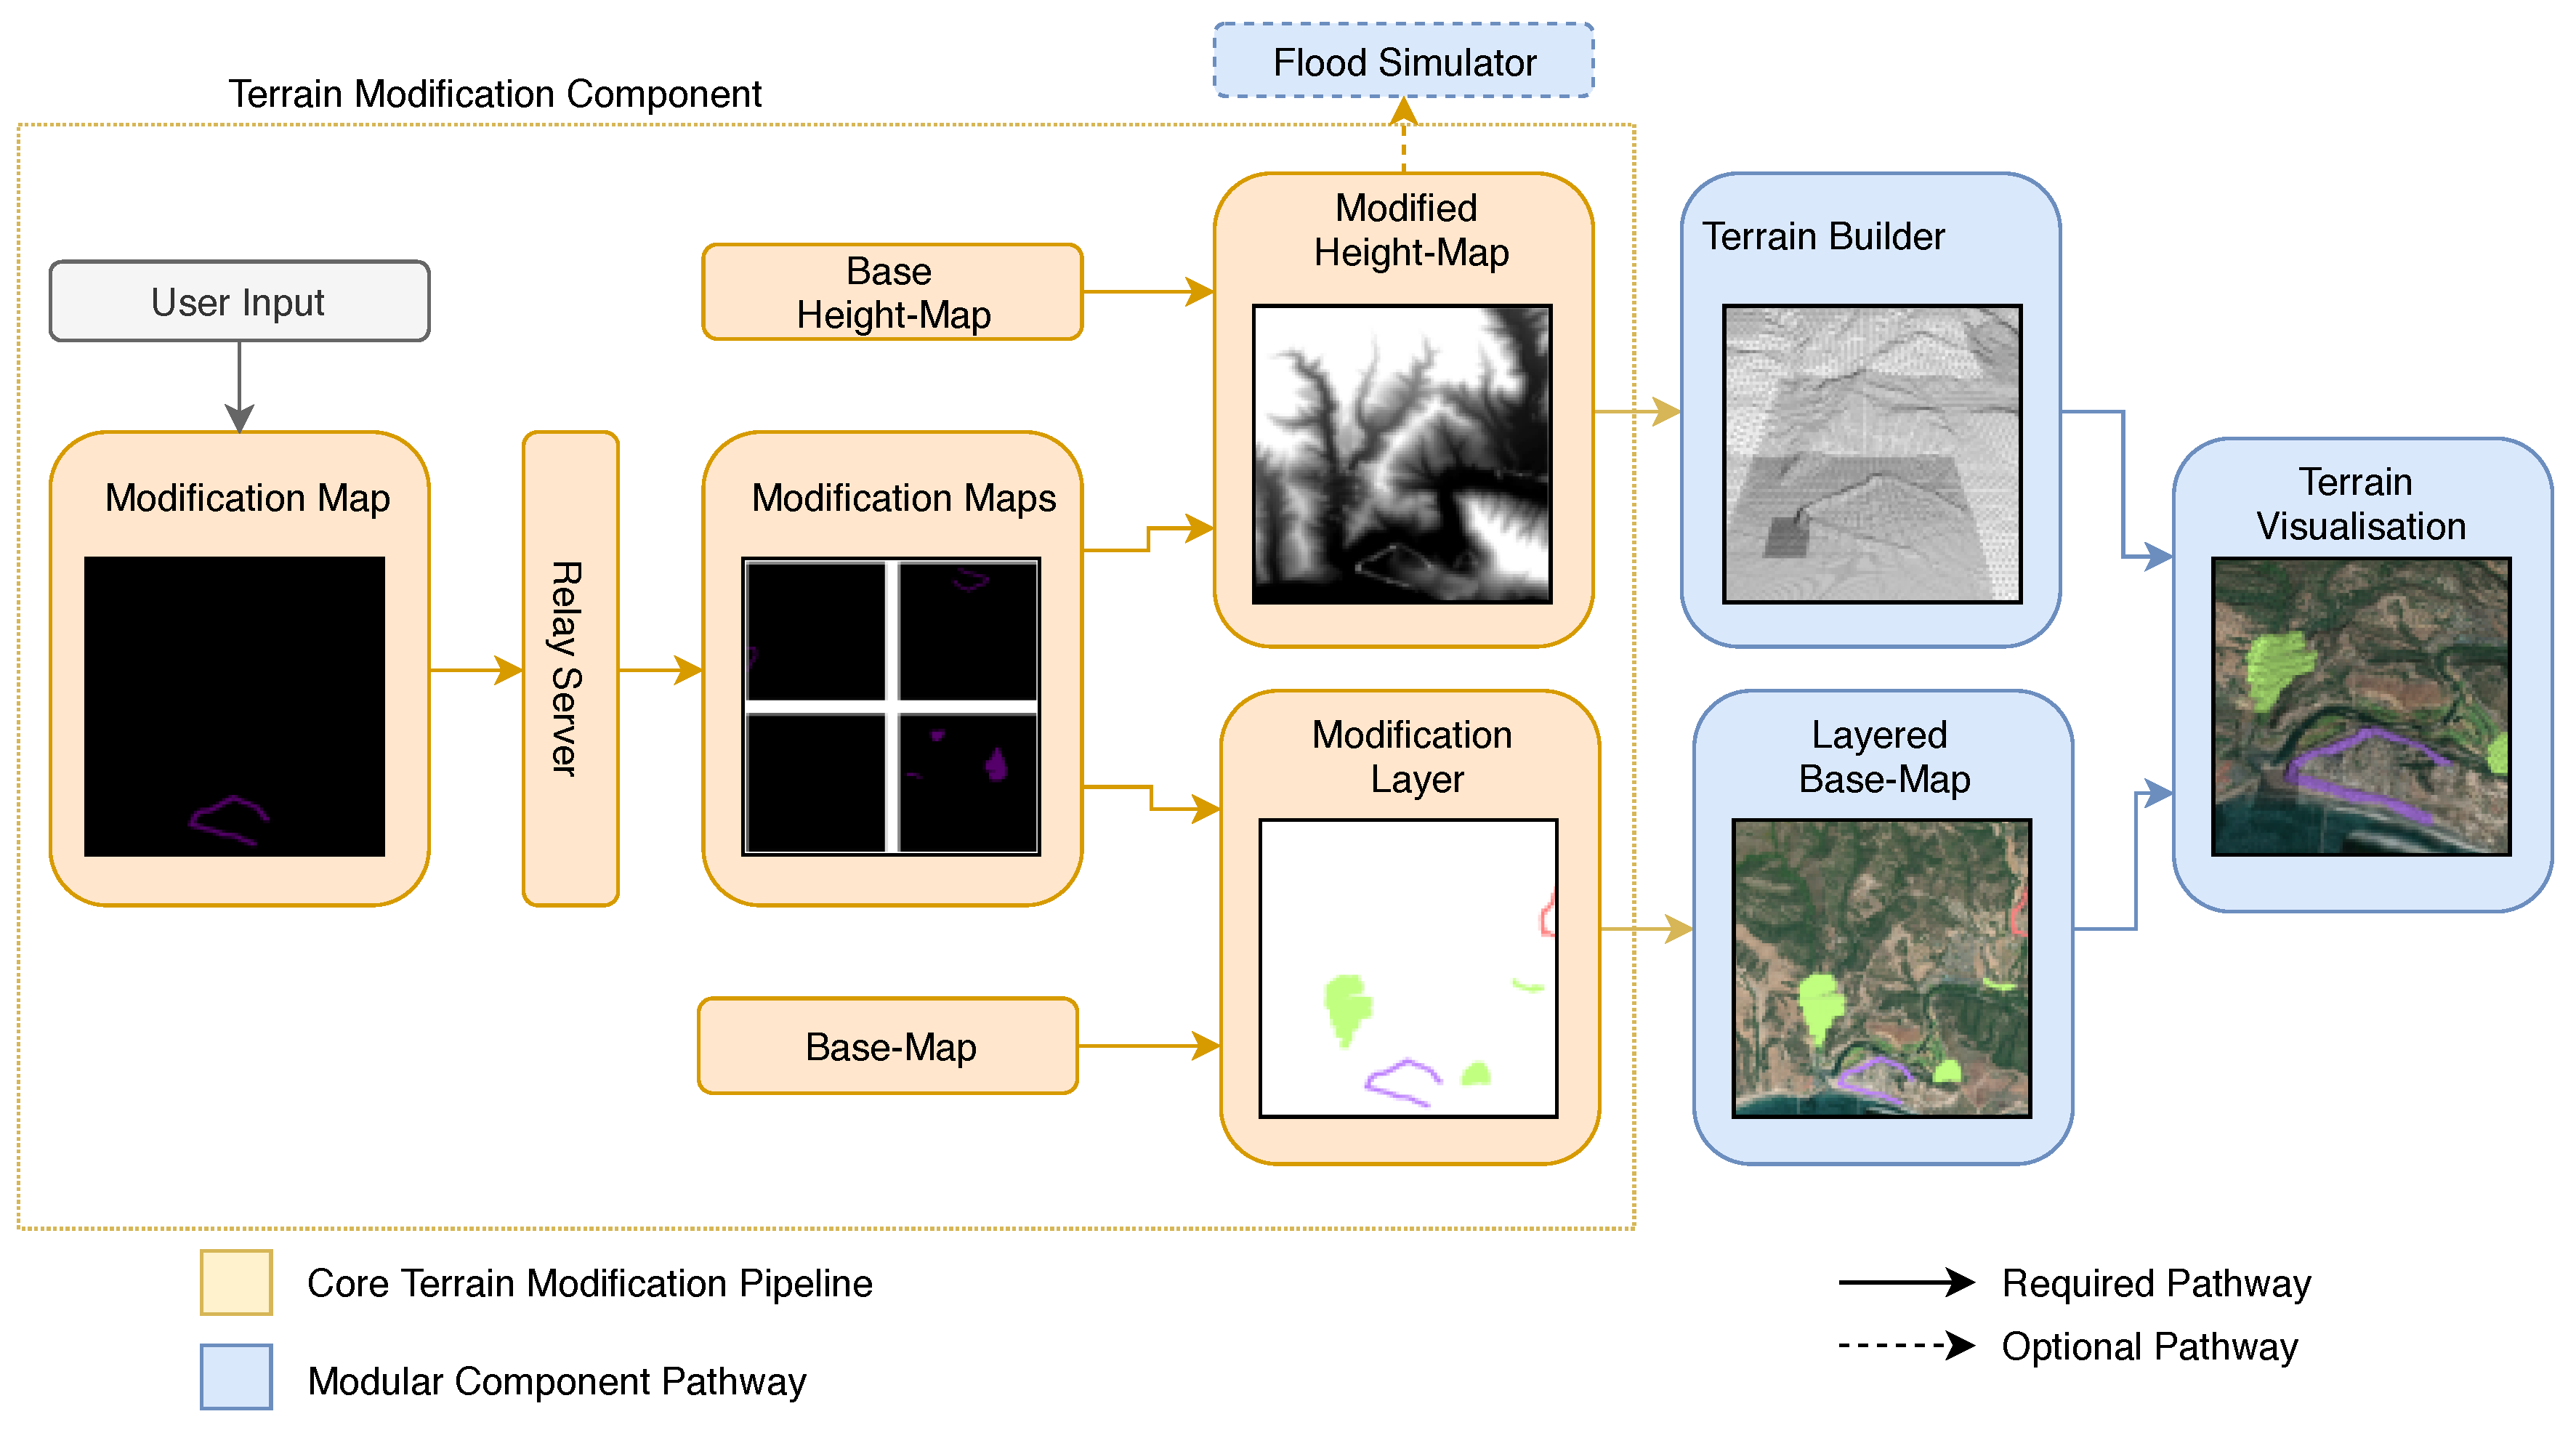
3.5. Terrain Modification Pipeline
Real-time multi-user terrain modification poses a clear advantage for augmented reality in cartographic visualisation, complimenting the 2D visual representations of traditional base maps. Here we describe a pipeline to enable synchronised terrain modification, capable of interacting with our reactive flood modelling system. We built the Terrain Builder upon a two-way conversion between a DEM height map and a corresponding terrain mesh, and as such additions to the underlying height map are reflected in the terrain mesh. A two-way link between map and terrain provides a convenient method to craft terrain modifications through DEM painting. We provide paintbrush tools which can be applied directly to the 3D terrain to raise, lower and flatten areas, conforming to a specific brush shape, size and strength. Brush shapes are specified as a 2D texture with the opacity of each pixel contributing to the intensity of the height modification .
When a modification is triggered at terrain point , we iterate over a subset of the DEM data, centred on with the subset dimensions equal to , corresponding to the brush pixel width and height respectively, scaled by the brush size parameter.
For each
point in the DEM subset, we modify the terrain height by
in accordance with the following equation:
where
is the time between frames rendered in the application,
is the user-specified brush strength parameter between [0..1], and
is the spatial scaling factor introduced by the 2D brush texture, defined as:
where
is the scale factor used to increase or decrease the brush dimensions.
is a function which returns the pixel intensity of the brush texture for a given (x,y) co-ordinate. This function maps the scaled brush co-ordinates to the original brush coordinates, enabling arbitrarily large or small brushes when modifying the terrain.
Each user builds up their own modification map which represents their additions to the underlying terrain. The final terrain is composed of the base height map and a pixel-wise linear combination of each users modification map. Contributions can be colour-coded by the user, augmenting the base map, to support terrain annotations.
Real-time collaboration is achieved through a native client-server interface, such that any user can set up the experience and become the server, with other users connecting as clients. On launching the application, the user is prompted to either create a server instance or connect to an on-going instance through a direct IP connection. Once created, each user (client and server) interacts with an identical interface, with networking established in the background to synchronise terrain modification and annotations. Networking is supported within the Unity application through the “Forged Networking Remastered” asset and requires no additional hardware or software.
The nominated-server is solely responsible for distributing user commands for map modification updates to all other users in real time, as shown in
Figure 3. All other terrain computations, such as flooding and mesh changes are carried out on the local devices to achieve low latency, to enable scaling for larger groups by ensuring minimal overheads on the device acting as a server. We use buffered Remote Procedure Calls to ensure that new users are caught up to date with past additions on joining the server.
5. Discussion
We have presented a novel augmented reality compliment to augment current planning and design workshop tools. We aim to provide new ways to support collaborative decision making in stakeholder participation exercises, by enabling novel methods for interactive planning and design generation.
We have sought to address several drawbacks presented in previous digital tools while retaining the advantages digital tools have over hard-copy maps. The digital touch-table facilitated up to 4 simultaneous users [
4], which could be a significant limitation in a larger workshop setting. As we are not bound to a single device when using augmented reality, we have developed our solution to support up to 10 users simultaneously, with scope to extend this depending on individual hardware capabilities.
Furthermore, due to the networked approach to our software, we can expand on the collaborative element seen in the AR sandbox, which is limited to lab-based exhibitions. Our software supports both lab-based and on-site discussions through the use of environmentally tracked visualisation, with the added possibility for collaborations at a distance, working on the same designs in different locations in real time.
In practice, planning workshops can take place over multiple sessions, in which each session embodies a different role, for example, communication, spatial analysis and collaboration. For an effective workshop process, the output of one workshop influences the materials presented at the next, creating a workshop workflow. The first session ensures that all participants are familiar with the site to be studied. Next, participants can analyse the site to get a better understanding of the processes and interactions which govern the site, to better define an intervention scenario. Finally, collaboration workshops seek to use the distributed expertise of stakeholders to convene upon a variety of design solutions to solve previously identified concerns.
We have designed our software to meet the demands of a multi-user, multi-workshop workflow, enabling the gradual build-up of knowledge through interactive exploration.
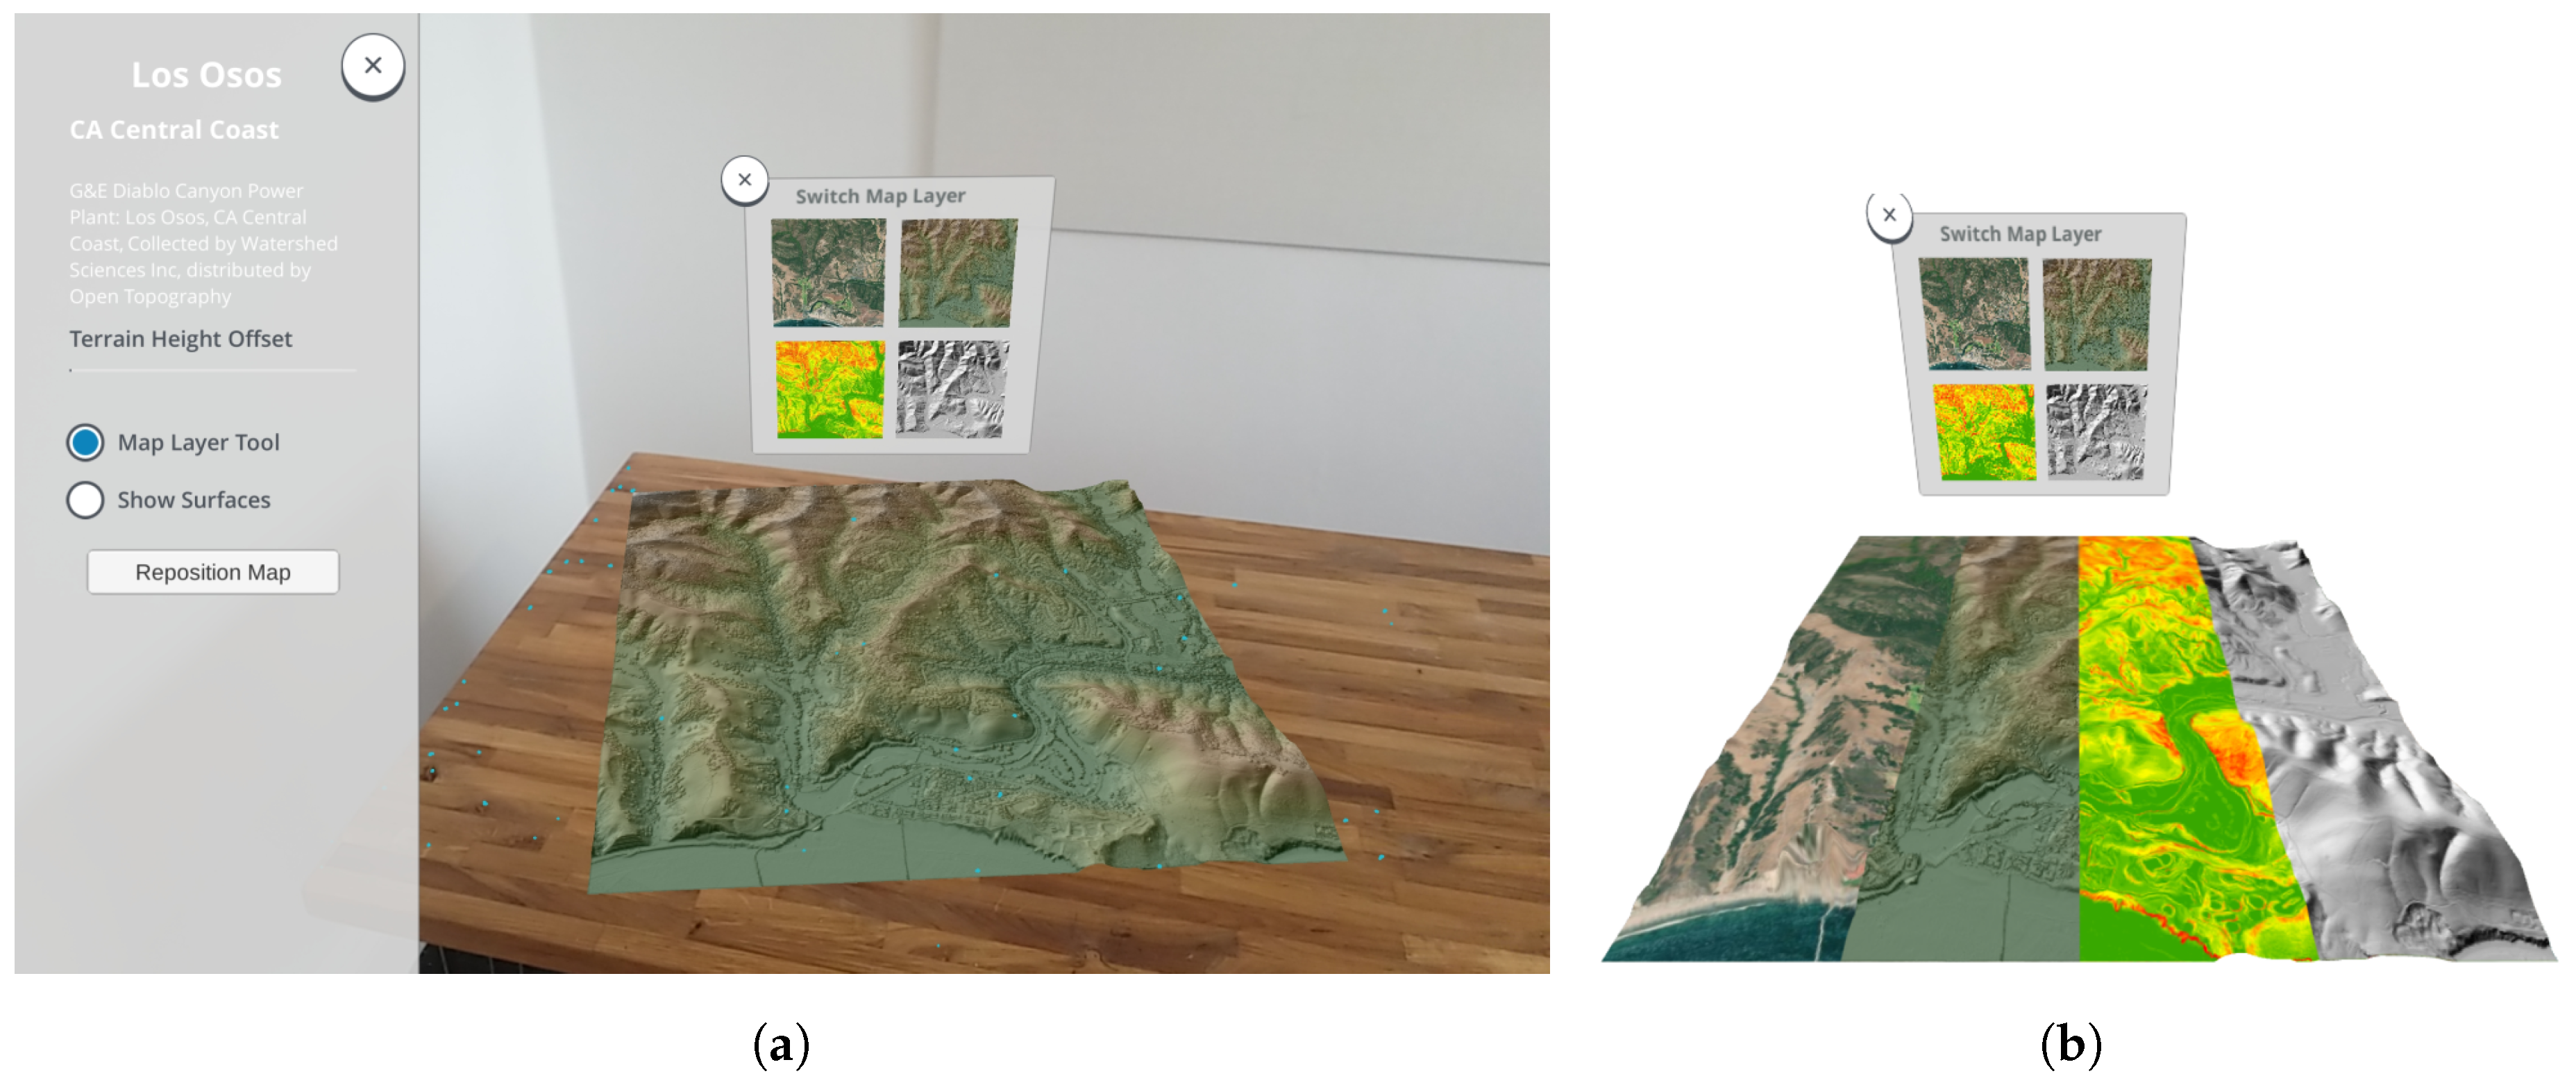
Figure 6 shows an example application of our software in a multi-workshop workflow, progressing through the stages of communication, spatial analysis and collaboration, where each workshop builds on the result of the preceding workshops.
Here we discuss our software with respect to a potential future multi-workshop scenario. The workshop series would seek to engage stakeholders in designing landscape-based flood interventions over the course of 3 workshops, detailed as follows:
Communication: An instructor led discussion of the local area, its features and topography.
Spatial Analysis: An interactive exploration of flood risk in the area, to identify at-risk areas.
Collaboration: Create a potential landscape intervention to reduce flood risk in previously identified areas.
Figure 6b shows how terrain can be used to visualise base maps in 3D. The terrain can be updated by the workshop instructor to show a progression of cartographic representations (such as those shown in
Figure 4b), to give a good impression of the site as part of the communication workshop. Users can explore the terrain at will, without affecting the information presented to the group. This provides additional flexibility over the single point of information shared by previous tools, such as the AR Sandbox, interactive touch-table, and hard-copy maps.
Secondly as part of a follow-up workshop focused on spatial analysis,
Figure 6b shows how users could undertake a detailed analysis of a spatial problem using interactive flood visualisations. The ability to raise and lower floodwaters gives an intuitive way to identify which areas are most at risk, and help identify suitable sites for landscape intervention.
Finally, building on the knowledge gained through previous spatial analysis exercises, our terrain modification and reactive flood plane visualisations provide a platform for multi-user collaboration to design solutions to address identified flood risk concerns. The ability to combine the design and analysis of potential design, encourages rapid interactive design and evaluation.
Further work will assess the effectiveness of this software within a structured workshop setting as part of the Adaptive Urban Transformation project (
http://www.adaptiveurbantransformation.com/). Further development will refine and improve our support for standard workshop practices. We suggest that, while the tactile nature of hard-copy maps will not be supplanted by innovative technology, it can be complemented with new technological capabilities. Augmented reality presents a variety of unique improvements over other digital media, such as touch-tables, with the ability to support both global and personal perspectives on presented data within a shared space. However, the high-barrier of entry for software development will limit its adoption. Through this open software, we hope to encourage adoption in both research and practice.


