1. Introduction
There are many different definitions for learning disabilities in the literature [
1,
2,
3,
4,
5]. According to Hammill [
4], learning disabilities describe a heterogeneous group of difficulties related to listening, speaking, reading, writing, reasoning, or mathematical abilities which are intrinsic to the individual and persist for their whole life. These difficulties make it harder for affected children to enhance their social, emotional and behavioral skills and to improve their educational performance at school [
6]. Thus, children who encounter difficulties in learning should ideally attend a specially designed educational program that meets their individual needs. However, a prerequisite is that the child has been officially diagnosed with one or more learning difficulties. The diagnostic procedure to determine this is a time-consuming process, which can last up to two hours, due to the multitude of methods involved in the examination such as documenting the child’s historical records, observation of the child’s behavior, questionnaires and specific weighted tests [
7,
8]. In the present paper we use the term “learning difficulties” to characterize children who encounter difficulties in learning including, but not limited to, children with emotional difficulties, intellectual disability, or attention disorders such as Attention Deficit Hyperactivity Disorder (ADHD), and who should attend a special educational needs (SEN) program (SEND: special education needs or/and disabilities [
9]).
This paper presents a game-based evaluation of learning difficulties using a tool named Kinaesthetic Learning Difficulties Diagnosis (Kin-LDD). The previous version of Kin-LDD was presented in Chatzidaki et al. [
10] before it was used by children. Kin-LDD stands for Kinaesthetic Learning Difficulties Diagnosis, and is a “serious game” [
11] that gamifies a part of the diagnostic process. More specifically, Kin-LDD provides a Natural User Interface (NUI) through gestures and comprises activities related to spatial and time orientation. Additionally, the gestures in the game enhance and simplify the diagnostic process by providing of a set of key performance indicators (KPIs) for special educators. Moreover, it provides a more fun environment during diagnosis by allowing children to actively participate in the process through playing the game. The motivation for this work was: (a) to enhance the diagnosis of learning difficulties using an NUI through gestures, whilst digitalizing and automating some of the current assessment activities related to time and spatial orientation; (b) to improve the procedure by incorporating meaningful metrics to assist special educators while reducing the time required for the identification of learning difficulties regarding spatial and time orientation activities; and most importantly (c), to enhance children’s experience, by introducing the fun factor into the examination, which keeps them engaged, motivated and more concentrated in their tasks for longer periods of time compared to conventional assessment methods.
The study presented in this paper, demonstrates the results of using Kin-LDD during the actual diagnostic procedure for 30 children. During this procedure, children who had been identified with learning difficulties, but had not been formally diagnosed or categorized, played the Kin-LDD game guided by the special educator. The results from Kin-LDD were collected in the form of KPIs, which were generated from the actual assessment and contributed towards the diagnosis during the quantitative and qualitative analysis that took place in the post-processing phase.
The paper is structured as follows: the next section presents a literature review and related work in this field;
Section 3 presents the methodology of the study, the Kin-LDD, the participants and the research hypotheses;
Section 4 and
Section 5 describe the results of the study and analysis of the findings. In the final section of the paper we discuss the practical implications of this work, the limitations and ideas on further research in this area.
2. Literature Review and Related Works
2.1. Learning Difficulties and the Diagnostic Procedure
According to Kirk [
3] the term “learning disabilities” describes children who show a heterogeneity in their behavior and psychological performance, which restricts their learning capabilities and is the reason they need to attend a special educational program [
3]. However, the terms “learning disabilities” and “learning difficulties” are often used interchangeably in different sources in the literature [
12]. Moreover, the terminology for the same conditions that affect learning may differ between countries [
13,
14,
15]. This paper uses the term “learning difficulties”.
The identification of learning difficulties is not a straightforward process and there is not one way, or one evaluation tool, that specialists can use to derive a diagnosis. Thus, each learning difficulty category requires a combination of methods, approaches and processes for identification and intervention. In Greece, as in many European countries, if a child expresses signs of learning difficulties in school, it is the teacher’s responsibility to conduct a pre-assessment review, collaborate with and inform the parents and then refer the child to a specialist [
14]. Teachers are expected to fill in a form for each student, describing the student’s behavior and educational performance and emphasizing any potential relationships between these and characteristics of learning difficulties. The next step is the actual diagnostic procedure for children who have expressed potential signs of one or more learning difficulties. The diagnosis of children with learning difficulties in Greece, according to national law 3699/2008, takes place in Center for Differential Diagnosis, Diagnosis and Support and is carried out by a multidisciplinary team which is specifically assigned to each case. This procedure is mandatory should parents want their children to attend a special educational program tailored to their individual child’s needs. The team always comprises a special educator who is responsible for collecting the data, performing the main assessment and making the final decision. On a case by case basis, the special educator might collaborate with a child psychologist or a pediatrician, a psychologist, a social worker or a speech therapist. During the assessment, the special educator works with the child to complete a series of questionnaires and exercises which are mostly pen-and-paper tests. The duration of the whole process is extensive and could last up to two hours. During such long sessions, both parties are required to maintain intense levels of concentration and constant engagement, so the process eventually becomes a frustrating experience for children. Moreover, children feel that they are being evaluated on their intelligence and are required to remain seated for long periods of time. Even if the results of the assessment are ultimately used for the children’s benefit, i.e., to ensure that they receive equal learning opportunities, the procedure remains a frustrating, inconvenient and unpleasant experience.
The available diagnostic tools for special educators are a combination of questionnaires, weighted tests, interviews with parents for recording their child’s history and general observations of the child’s behavior. One of the most popular tests, is the Wechsler Intelligence Scale for Children (WISC) [
8,
16], which has been translated into many different languages. The WISC generates a full-scale IQ (Intelligence Quotient) representing the general intellectual ability of the child. Moreover, it provides primary index scores which represent the child’s abilities in discrete cognitive categories such as working memory and processing speed. Another well-known diagnostic tool is the Detroit Tests of Learning Aptitude (DTLA) [
7,
17] which assesses cognitive functions and evaluates specific mental abilities in children. More specifically, it measures basic abilities and presents the effects of language, attention and motor skills on test performance. DTLA-4 includes different subtests targeted towards various categories of evaluation such as story construction, story sequences and word opposites. Additionally, many of the public or private centers for the identification of learning difficulties develop their own questionnaires based on general weaknesses that children may exhibit. Thus, the specialist uses a combination of the available tools to derive a more accurate characterization of the learning difficulties that the child being assessed is dealing with.
2.2. Related Work and Games for Children with Learning Difficulties
Educational environments that include physical activities show a positive impact on academic performance [
18], enhance memory [
19] and students’ attention [
20]. Moreover, the use of a natural means of interaction in an educational environment enhances learners’ participation and increases their motivation and engagement in learning activities [
21]. Several recent studies have focused on learning activities that emphasize students’ motor skills, with the use of gestures being the new trend in educational environments, acting as a communication channel between the user and the computer [
22]. Interaction through gestures and body movement allows users to be more active and engaged in the learning procedure, meanwhile enhancing children’s motivation, improving their learning performance and increasing concentration on educational activities [
23,
24,
25]. Furthermore, the use of an NUI that provides gestures could be more fun and realistic, and enhance children’s motor skills [
25,
26] especially when children dealing with learning difficulties are involved [
27].
In many cases, children with learning difficulties encounter difficulties in distinguishing different directions, and determining distance and speed [
28]. They also exhibit spatial disorientation [
29] and also present restricted capacity for awareness of time [
30]. In studies where gesture-based games have extensively been used, positive results in terms of improvements in cognitive and motor skills and in learning performance for preschool children have been presented [
25,
31]. The Microsoft Kinect sensor [
32] which can be used to detect gestures, body movements, voice commands and for facial recognition, has been increasingly used in the last decade to develop games with hand gesture and body movement interfaces. It seems to be a promising, motivating and helpful tool for learning [
33]. Moreover, Kinect has extensively been used in several studies focusing on children with ADHD [
34,
35], motor impairments [
36], intellectual disabilities [
37], reading and writing difficulties [
38], autism [
39,
40,
41], and children receiving physical rehabilitation [
42], and encouraging results have been shown. Therefore, multiple studies have been published showing increased engagement in games in educational activities for children with learning difficulties. By providing an NUI using gestures and body movements, among other benefits, a fun parameter is included in the learning context and contributes to a play-like educational experience for the student. Theories of cognition about embodied learning propose that the execution of appropriate gestures can enhance learning [
43]. Additionally, when an educational process includes gestures performed by students themselves, their learning is enhanced [
44].
Serious games which are performed on a typical personal computer using a keyboard and mouse have also been used for the identification of learning difficulties. The Continuous Performance Test (CPT) of Conners [
45,
46] is a task-oriented test, which evaluates the user’s performance in areas of inattentiveness, impulsivity, sustained attention, and vigilance. CPT could be used for the assessment of attention disorders, such as ADHD. The Cognitive Profile System (CoPS) [
47] is a set of eight computer-based tests for cognitive abilities including short-term visual memory, auditory-verbal memory, auditory discrimination and phonological activities. The supermarket [
48] is a game that could be used for the diagnosis of ADHD. The game contains a maze that users have to cross while gathering some items shown in their shopping list. Another tool that could be used for assessing learning abilities is the Mental Attributes Profiling System (MAPS) [
49]. MAPS is a group of eight computer-based and language-independent tests that evaluate different aspects of learning, such as visual-auditory memory, visual-auditory discrimination and navigation. eMaDysis [
50] is a software for the assessment of reading disabilities for children. Some of the categories that eMaDysis examines are: text reading, text spell-checking, frequency discrimination, and word-picture matching. Another study focused on the assessment of ADHD through a 3D virtual world classroom [
51]. The children attended a virtual class and received multiple stimuli such as audio, visual and mixed distractions and their movements were tracked in order to provide metrics for hyperactivity.
In comparison to the available tools that could be used in the diagnostic procedure mentioned above, Kin-LDD differs in terms of the type of interaction with the user, its content and the metrics that it collects. Specifically, it uses gestures as a communication channel with the user and it features gameplay of progressively increasing difficulty while it gathers indicators in real-time to be used for further analysis. Additionally, Kin-LDD collects the child’s performance metrics for cognitive abilities and motor skills and provides them to the special educator for further analysis.
3. Research Methodology and Hypotheses
The evaluation of Kin-LDD took place over the course of nine months during which a total of 30 children participated as part of their official diagnostic procedure. The extended duration of the study resulted from the difficulty in locating appropriate candidates and our commitment to reach the number of 30 participants before proceeding with the statistical analysis of the results, to ensure higher confidence intervals. Children identified as having learning difficulties but who had not yet been formally diagnosed and categorized, used Kin-LDD while being supervised by the same special educator who performed the actual diagnosis. The special educator collected the KPIs generated from the assessment and used these, along with her notes and observations, during the quantitative and qualitative analysis that took place in the post-processing phase.
From our research perspective, the aim was to investigate the use of Kin-LDD, as an alternative, more active and fun approach for the diagnosis of learning difficulties, as well as to evaluate the effectiveness of the Kin-LDD KPIs in providing correlations and trends that could provide to the special educators with additional information for the identification of the learning difficulties (with regards to time and spatial orientation). Therefore, the hypotheses of the study were formulated as follows:
H1: Kin-LDD is considered a fun experience by children during the diagnostic process for learning difficulties.
H2: Kin-LDD contributes to the diagnostic procedure by providing useful KPIs to special educators.
H3: Analysis of KPIs from the Kin-LDD game results shows a high correlation with the results of the diagnosis.
Hypothesis 1 is related to the primary goal of this study, to add fun into a lengthy and stressful examination for the children. Hypothesis 2 is related to the effectiveness of the game as a supportive tool, which provides meaningful metrics to the special educators, in relation to cognitive abilities and motor skills of the children. Hypothesis 3 investigates if the analysis of Kin-LDD’s KPIs could aid to the categorization of children into particular learning difficulty groups.
3.1. The Kin-LDD
The motivation behind the design and development of the Kin-LDD was to enhance the diagnostic procedure by introducing elements, which not only make the assessment more fun and attractive for the children, but also simultaneously enhance the special educator’s task through the provision of advanced metrics. Kin-LDD is a computer-based game where in-game mechanics utilize Microsoft Kinect technology to provide hand gesture recognition for its interface. As children accomplish predefined tasks, their cognitive abilities are evaluated, and the game also collects metrics for their motor skills. During the game, a series of activity screens, each of which is compiled by placing multimedia content, graphics audio and text, onto a pre-generated background, are presented to the child. The goal of the game is for the child to accomplish a series of tasks based on the instructions shown on each activity screen. This can be achieved by performing the appropriate gestures to execute the required actions, “select” or “grab and release”, on active elements in each activity screen. The Kin-LDD gameplay is divided into two modules, the spatial and the time orientation. Each module is then broken down into groups which examine similar perceptual attributes. Finally, each group consists of one or more activity screens which contain the task that the child needs to complete.
Figure 1 presents the two modules with their respective groups and activity screens.
The spatial orientation module consists of 18 different activity screens and the time orientation module of 10 screens, with gradually increasing complexity. Each activity screen contains instructions on how to complete the task, both as a textbox element and as an audio file announced by a narrator. Furthermore, the background and static graphics that make up the screen’s inactive contents and finally the dynamic graphics where actions can be performed, complete the screen. During gameplay, the game records a set of metrics which measure the performance of the child on every activity screen. The performance metrics differ between the two modules and after every module is completed, a success message appears on the screen to further motivate the child.
The main difference between the two modules is that the underling feature of the spatial orientation module is directionality, while the time orientation module uses time perception. Another important difference relates to the gameplay itself. While the instructions on the spatial orientation modules instruct the user to choose an active element, the time orientation module requires the placement of active items in the correct order to form a sequence of events. Therefore “select” is the available action on the former module and “grab and release” on the latter. The last key difference between the two game modules are the KPIs collected. In addition to the duration to completion for each activity screen, correct and incorrect user responses and overall game duration are gathered on both modules, and the unsuccessful attempts are also recorded on the spatial orientation module. An unsuccessful attempt is related to the accuracy of the selection and it counts the number of times the user attempted to select an object unintentionally. All KPIs are recorded per user, are time stamped and stored by the game. Examples of activity screens are presented in
Figure 2 and
Figure 3.
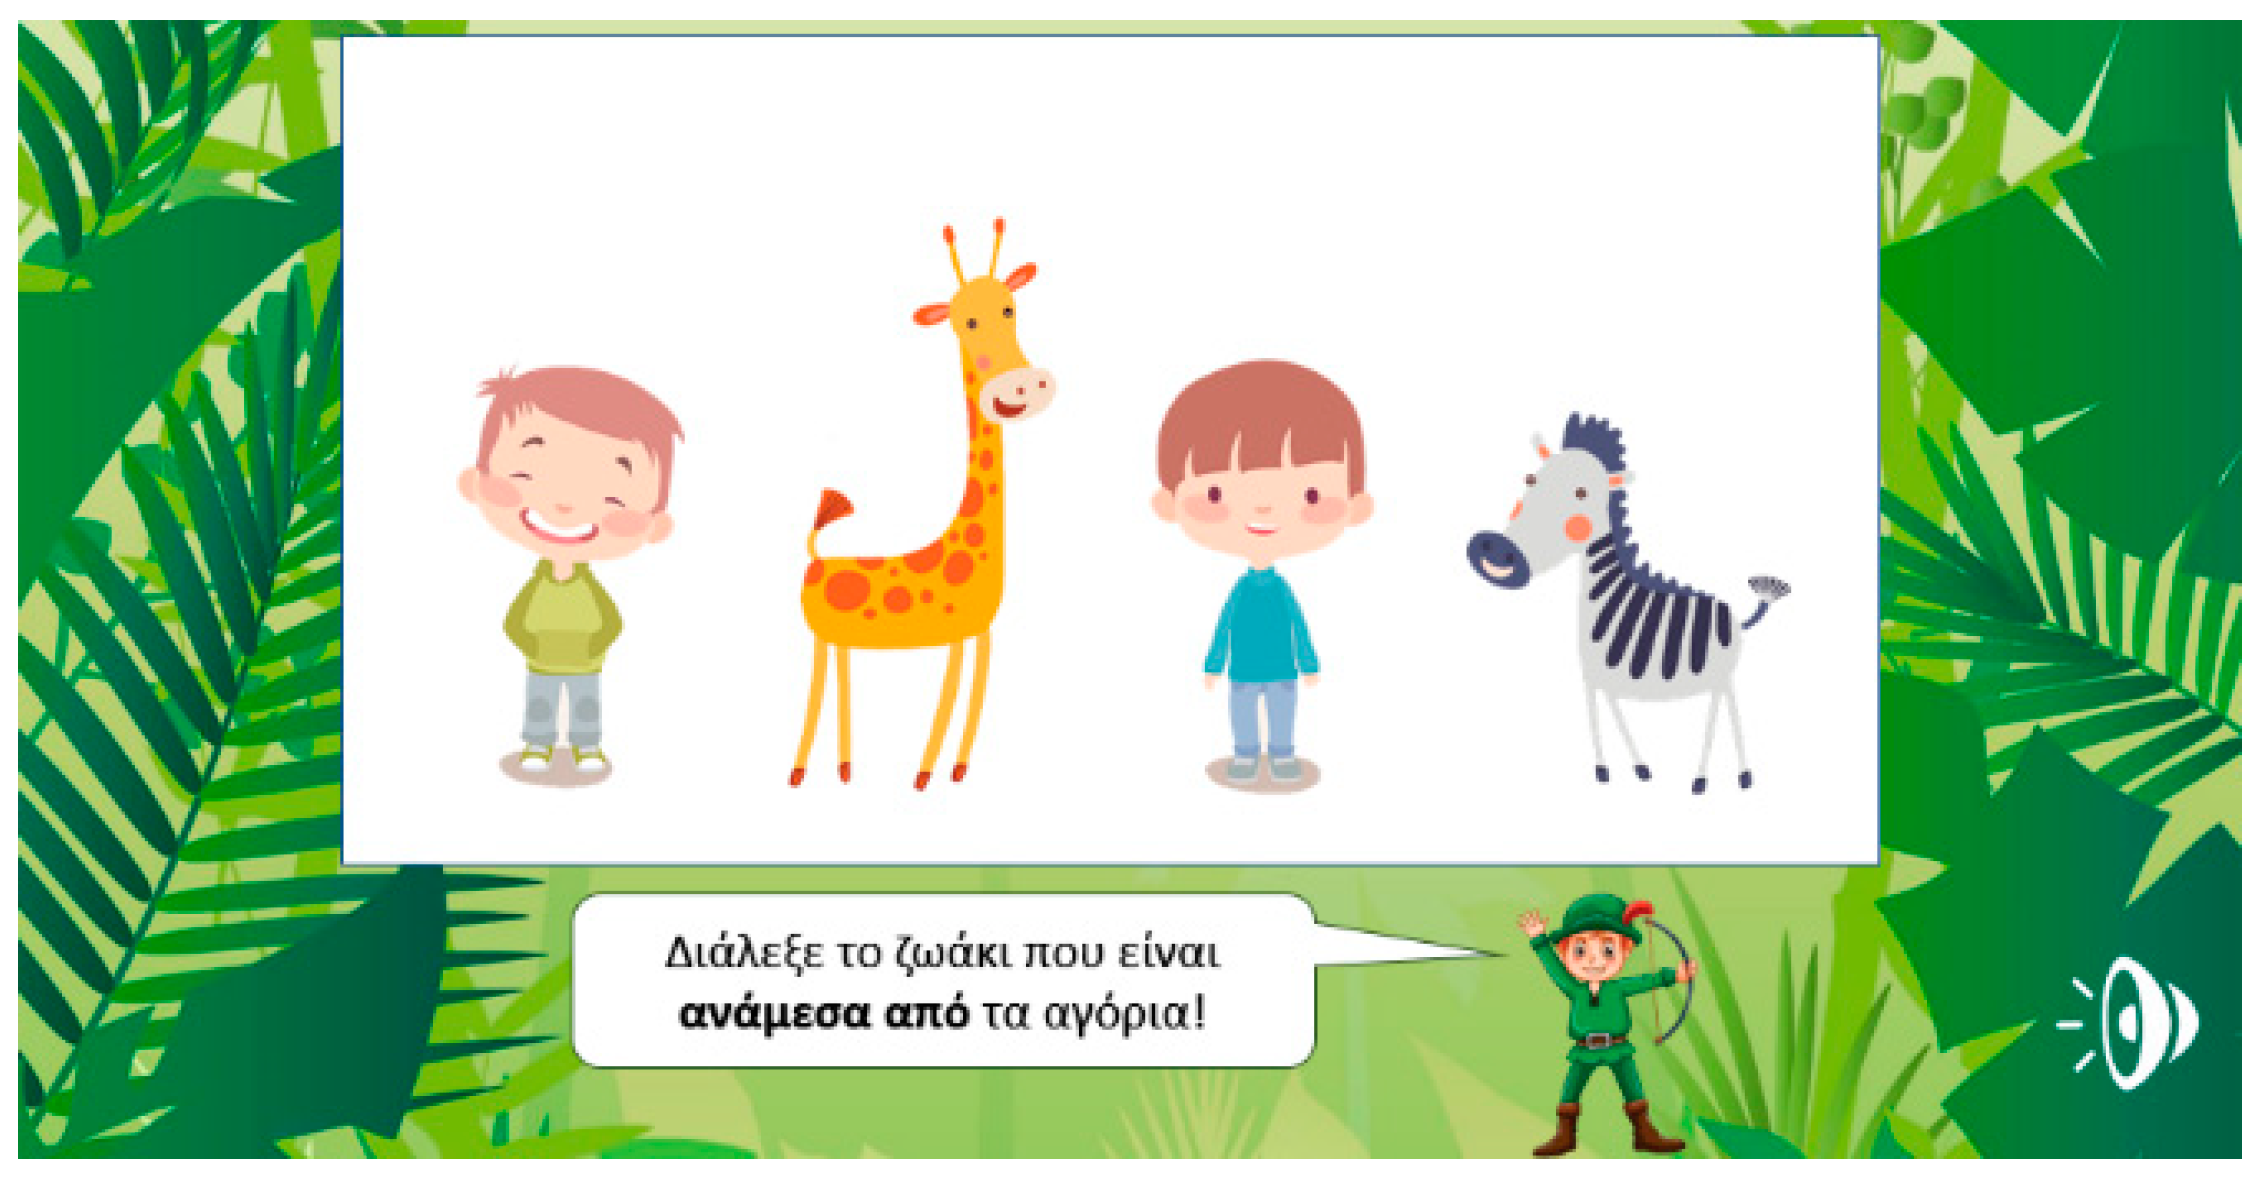
Figure 2 presents the “Between” activity screen which belongs to Group D from the spatial orientation module. In this activity the task for the children is to select the animal “between” the boys.
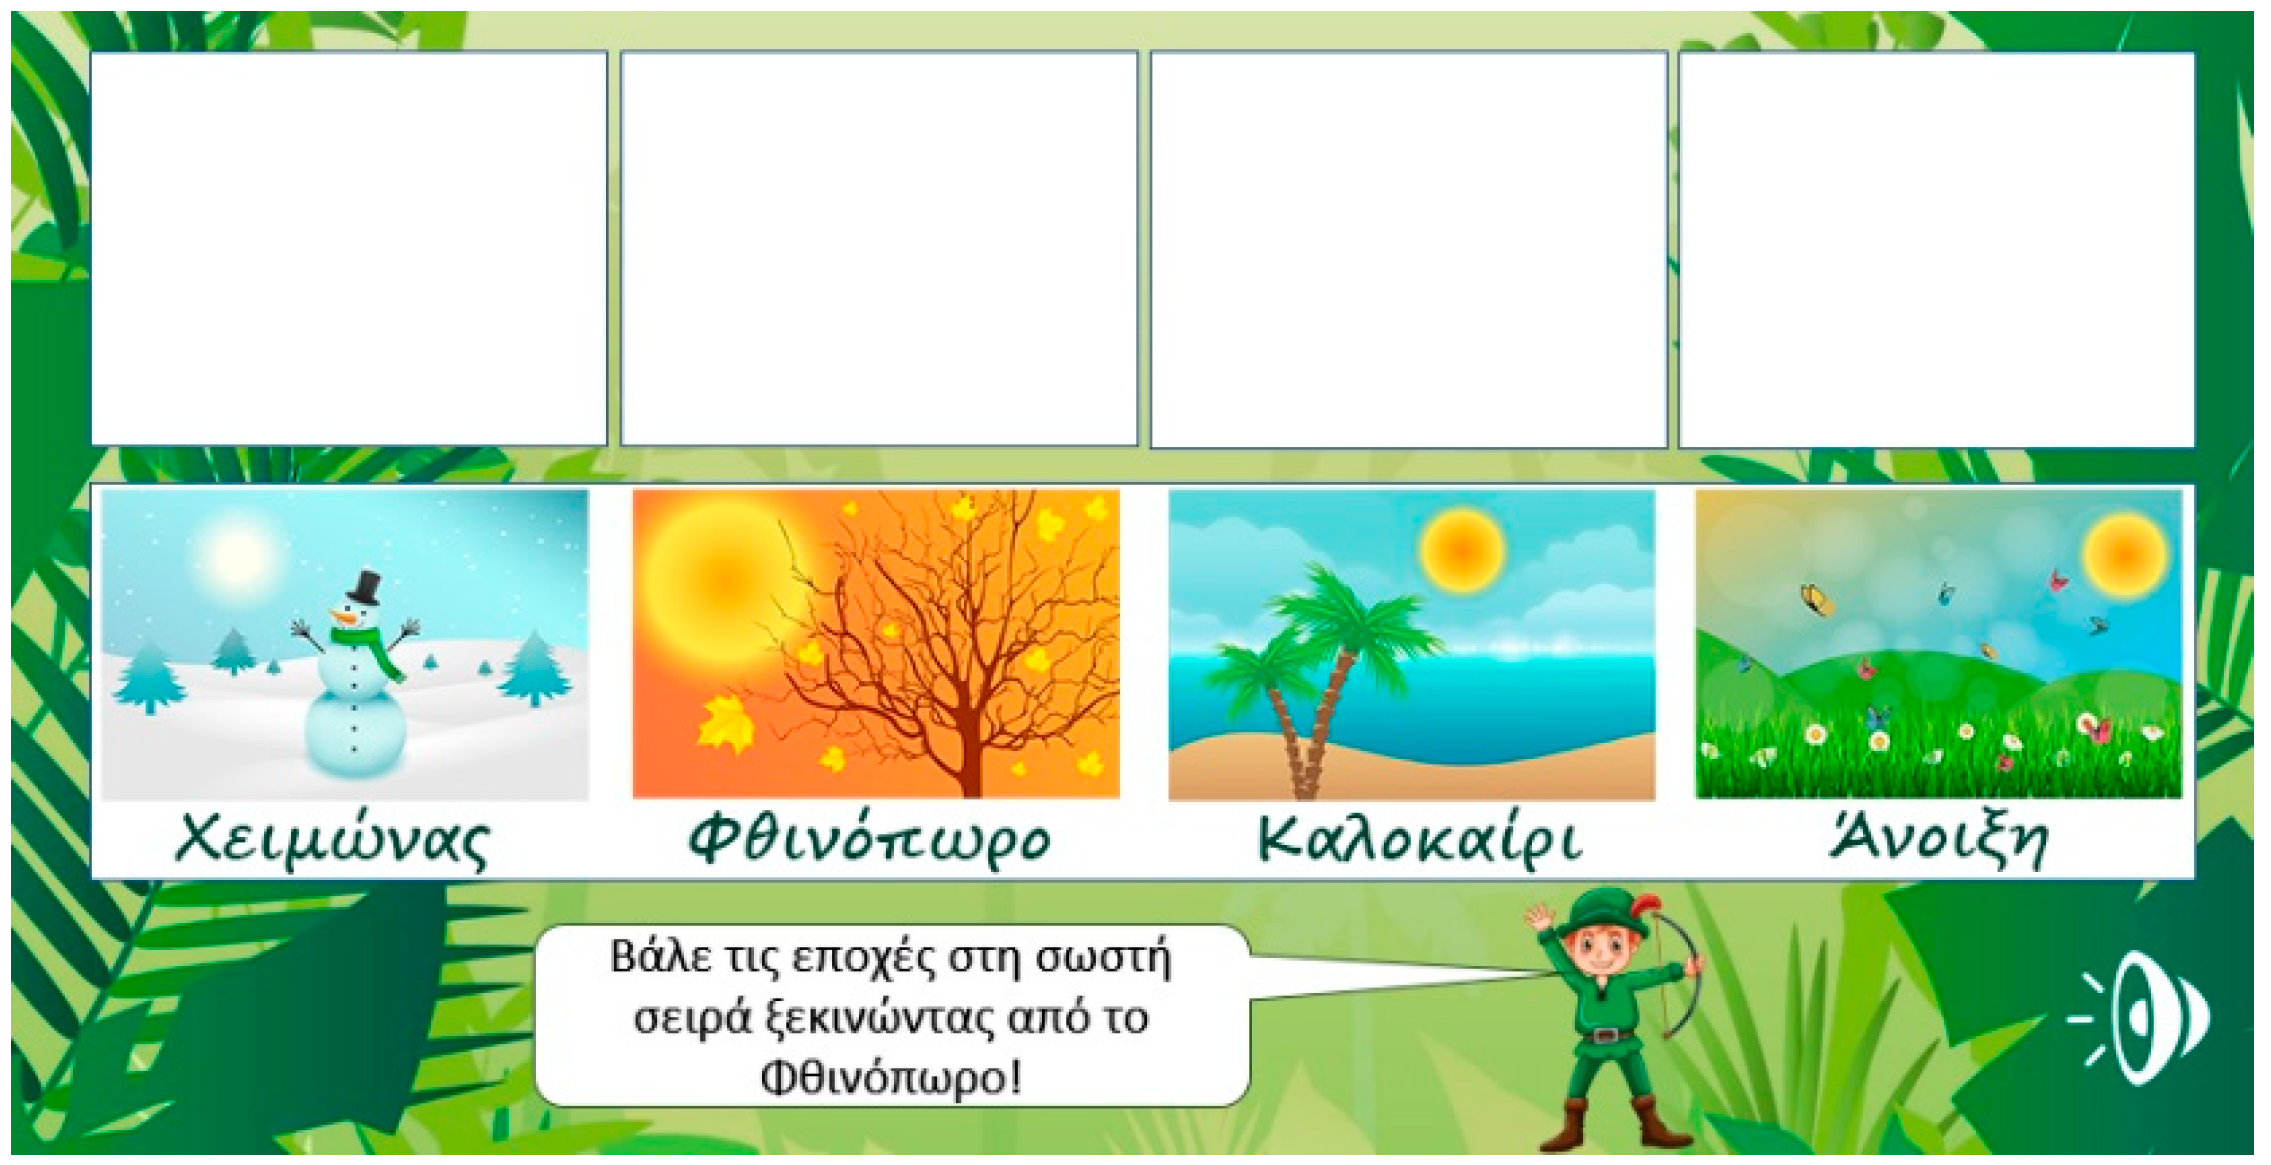
Figure 3 shows the activity screen “Seasons” which belongs to chronological ordering group from the time orientation module. The task in the “Seasons” activity screen is to place the images of seasons in the correct order, starting with autumn.
3.2. Participants and the Process
The participants were 30 children, consisting of 13 females and 17 males, between seven and eleven years old. All these children had been referred by a teacher for further assessment by a special educator. Teachers had already detected links between the children’s exhibited behavior and learning difficulty characteristics from the initial assessment at school. However, the final diagnosis from the special educator had not been officially confirmed. All the parents of the children who participated were informed of the purposes of this study and volunteered to collaborate. The examination process took place in the Center for Differential Diagnosis, Diagnosis and Support in Athens, Greece.
The experiment was conducted in two phases. The first phase was the typical diagnostic process for learning difficulties through a one-to-one session with the special educator. During this phase the children were assessed using a pen-and-paper test and questionnaires available at the Center for Differential Diagnosis, Diagnosis and Support with regards to their spatial and time orientation capabilities. The second phase was the use of the Kin-LDD game, which also provided spatial and time orientation activities, by the child with the supervision of the special educator who participated in the first phase.
After the end of each assessment session with the use of Kin-LDD, a short interview with the special educator was conducted to collect qualitative data concerning children’s overall experience and their perceived enjoyment. Another interview took place after the special educator had reached their diagnosis, focusing on how the analysis of KPIs, reported by the tool, was helpful and in accordance with their notes. This was a lengthy process and justified the long duration of the study.
3.3. Research Tools
For the investigation of the first hypothesis, quantitative data were collected through the Fun Toolkit [
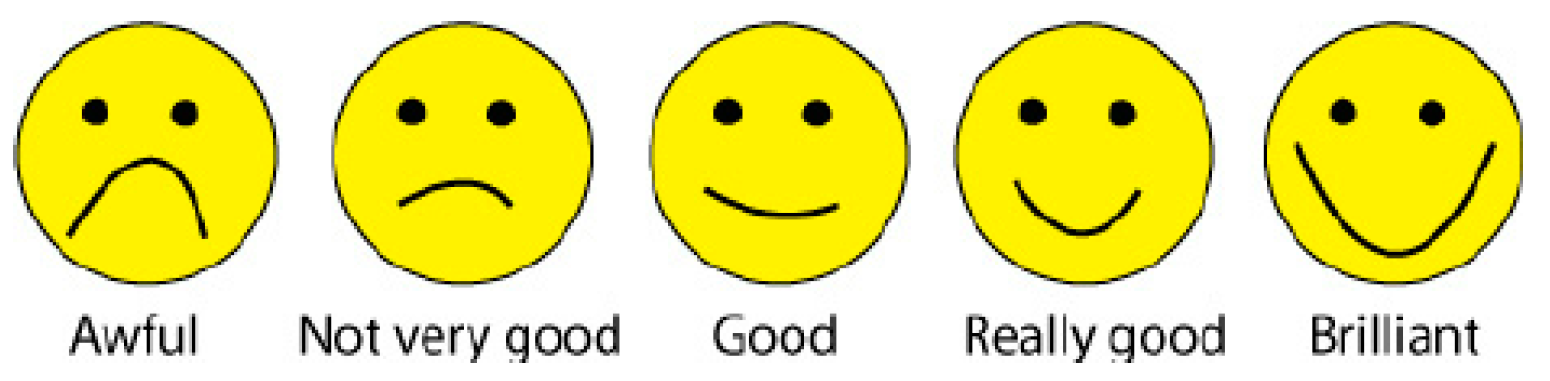
52] and qualitative data through the first interview with the special educator right after the assessment session. From the Fun Toolkit we used the “Smileyometer” and the “Again-Again” table. The “Smileyometer” was a 5-point Likert scale in response to the question “How much fun was it to do this activity?” with scores from 1 to 5, where 1 represented “awful” and 5 represented “brilliant”, as shown in
Figure 4. The “Again-Again” was a table comparing the two different tools by answering the question “Would you like to do it again?” with “No”, “Maybe”, or “Yes”. When the children completed each phase (pen-and-paper and Kin-LDD game), they filled in the “Smileyometer” and when they finished the whole process, they completed the “Again-Again” table.
We chose the Fun toolkit because it is “
fun, fast and fair” [
53] for children. According to Read [
53,
54] the “Smileyometer” is more valid for children of older ages, because younger children tend to select “brilliant” irrespective of how the real experience was for them. Since we expected the results to be skewed towards “brilliant” with younger children the analysis of the results was crosschecked with the special educator’s qualitative comments from the interview and the “Again and Again” table.
For the investigation of the second hypothesis, we used the qualitative results from the two interviews with the special educator: The first, right after the end of each assessment and the second right after the diagnosis was made for each child. Finally, for the investigation of the third hypothesis, the KPIs from the game were exported to Microsoft Excel 365 ProPlus to be organized and pre-processed, and then analyzed using IBM SPSS Statistics v20.0.
4. Study and the Results
The children who participated in the experiment were referred to the special educator without prior knowledge of which learning difficulty they may be diagnosed with. On completion of both sessions one being pen-and-paper and other using the Kin-LDD game, the special educator reached a decision on whether children had learning difficulties, and if so, in which group would they be categorized, using the results from both sessions. The 30 participants were then classified into nine categories based on their learning difficulty, which was obtained from the official diagnosis as presented in
Table 1.
4.1. H1: Kin-LDD as a Fun Experience
The analysis of the results for using the “Smileyometer” and the “Again-Again” table for both phases of the examination showed highly polarized results. As expected, the “Smileyometer” results for younger children were in accordance with Read [
53,
54]. In fact, all 30 children who participated in the study evaluated the Kin-LDD game as “brilliant” in terms of fun and joy (rightmost icon in
Figure 4). On the contrary, 27 children evaluated the pen-and-paper procedure of the diagnostic process as “awful” (leftmost icon in
Figure 4), while only three of them assessed it as “not very good”. This was also confirmed by the qualitative comments from the special educator, such as: “The child was very excited to play the game and while she was rather sad and annoyed during the pen-and-paper examination, she started to laugh and have fun while playing with Kin-LDD”. Another comment from the special educator was that the fact that the children had to play the game standing up and wave their hands around attributed to them taking a more active participation role. She commented on the increased expressiveness of the children, stating that during the session "even the shyest of the children were talking loudly and adopted a more assertive posture which is a testament to them feeling more comfortable and less frustrated compared to the conventional diagnosis session. She also mentioned that “both factors, using hand gestures and using an interface of this type, attributed to the children being more focused and concentrated while playing the game.” Additionally, the multimedia content of the game, which was presented in a simple, easy to understand form, had a positive impact on the whole experience for the children”. Moreover, the special educator noted that one of the most important contributions for her was that she saw the happiness and excitement on the face of the children who participated and even experienced less discomfort herself compared to the typical pen-and-paper session.
Similar to the “Smileyometer” results were the results from the “Again-Again” table. All 30 children answered positively to the question “Would you like to do it again?” for the Kin-LDD game, whilst only 2 children answered “maybe” for the same question for the paper-based screening procedure of the learning diagnosis and the remaining 28 answered “No”. Moreover, based on special educator comments, most of the children insisted on playing the game again and even asked if they could play it at home. Furthermore, no usability issues were reported by the special educator and, in all cases, following initial guidance, the children navigated through the game easily without needing any further instructions.
In conclusion, based on the quantitative results that were highly in favor of using the Kin-LDD, as well as the qualitative comments from the special educator, the Kin-LDD game had a positive effect on the learning difficulties diagnostic process for children, by adding fun and enjoyment into a lengthy and tedious procedure. Moreover, the fact that the children interacted through an NUI and therefore had to stand up from their chair and move around to play, had added significant value in terms of including fun in the assessment process.
4.2. H2: Kin-LDD KPIs Usefulness for the Special Educator
Based on the interviews that followed completion of the diagnosis, the special educator confirmed that Kin-LDD could be a part of the learning difficulties diagnosis procedure. She also mentioned that the duration of the whole process could be decreased by digitizing more parts of it and that in the future she would use Kin-LDD for the spatial and time orientation tasks. Moreover, according to her notes, the children responded better when presented with multimedia sources of information from the game, such as audio instructions, images and text, compared to the conventional material used in the diagnosis. She also observed that all the children were very excited, and showed better cooperation with her, compared to the pen-and-paper procedure. Another important argument was that children felt more comfortable playing a game rather than sitting in a chair answering paper-based questionnaires. To this extent, the special educator added that she could direct the entirety of her attention to the child while he or she was distracted by playing the game, identifying characteristics which could in other circumstances be missed or neglected, such as motor skill performance.
Furthermore, the introduction of accuracy indicators (selection and unsuccessful attempt KPIs) provided additional value to the assessment. Moreover, during the analysis of the KPI metrics that Kin-LDD produced, interesting results, clusters and patterns emerged, increasing the confidence in the diagnosis. This was achieved by identifying common and distinct characteristics between participant groups, which aided in the categorization of the underlying learning difficulty group, further contributing to the diagnostic procedure.
4.3. H3: Statistical Analysis of KPIs and Diagnosis Results
The aim of Kin-LDD is for it to be used by special educators as a tool which introduces fun into the examination process, by allowing children to play a game through an NUI. The Kin-LDD automatically records scores and duration, and this information was provided to special educators during the analysis phase. The third hypothesis went beyond this and investigated if some of the results of the KPIs could be used as a form of “suggestion” for the special educator. Towards this goal, the results from the 30 children who used the Kin-LDD and were diagnosed by the special educator were used as a form of knowledge base from which to derive some preliminary conclusions. This analysis has no goal of substituting for the special educator’s important work and is intended only to serve as a learning difficulty category suggestion mechanism.
Based on the findings from the 30 children classified in the categories shown in
Table 1, statistically significant correlations were found between some of the Kin-LDD KPIs and the final diagnosis results from the special educator. These results are discussed in the following section.
5. Analysis and Discussion of the KPI Results
For the investigation of the third hypothesis, the KPIs that were produced by Kin-LDD for each activity screen for both the spatial and time orientation modules were analyzed. As dependent variables, we used Tx = total time to complete all activity screens of module x (x = t for time or x = s for spatial orientation), Cx = number of correct activity screens (or correct selections) in each module, and Us = number of unsuccessful attempts (for spatial orientation). The latter has meaning only in the spatial orientation (Us), since in the time orientation module the child can sort the dynamic elements using different gestures; therefore the metric Ut was not used. The descriptive statistics results for the main dependent variables are shown in
Table 2. Our analysis included the responses in each individual activity screen (success and time for each activity screen).
The Kin-LDD KPIs included not only the activity screen results (correct/incorrect selection and time), but also additional data valuable to the special educator, such as the number of unsuccessful attempts. All the stored data were useful for the special educator (since these KPIs constituted a more accurate and detailed note set) and were the main reason for accepting the second hypothesis. As independent variables, we investigated the final characterization of the child following diagnosis. Where feasible, we combined diagnostic groups due to the small numbers of children in some learning difficulty categories.
For the dependent variables Ts and Tt (for spatial and time orientation. respectively) the Shapiro–Wilk test showed that the assumption of normality was not violated, for Ts p = 0.532 and for Tt p = 0.390, and therefore parametric tests were used for the analysis. A two-tailed independent samples t-test comparing means for Ts and Tt revealed that the results were statistically significantly similar (p = 0.003). Therefore, all time-related KPIs for both the spatial and time orientation activity screens offered comparable data. Since the assumption of normality was violated for the dependent variables Cs, Us and Ct (the Shapiro-Wilk test showed p = 0.000, p = 0.057, and p = 0.001, respectively) non-parametric tests were used for the analysis of these variables. For the purpose of completeness, we investigated gender as an independent variable as well. In fact, a two-tailed independent samples t-test revealed that using the children’s gender as the independent variable (M = 17, F = 13), no statistically significant differences were found in either group: for Ts F = 0.965, p = 0.706 and for Tt F = 1.390, p = 0.843.
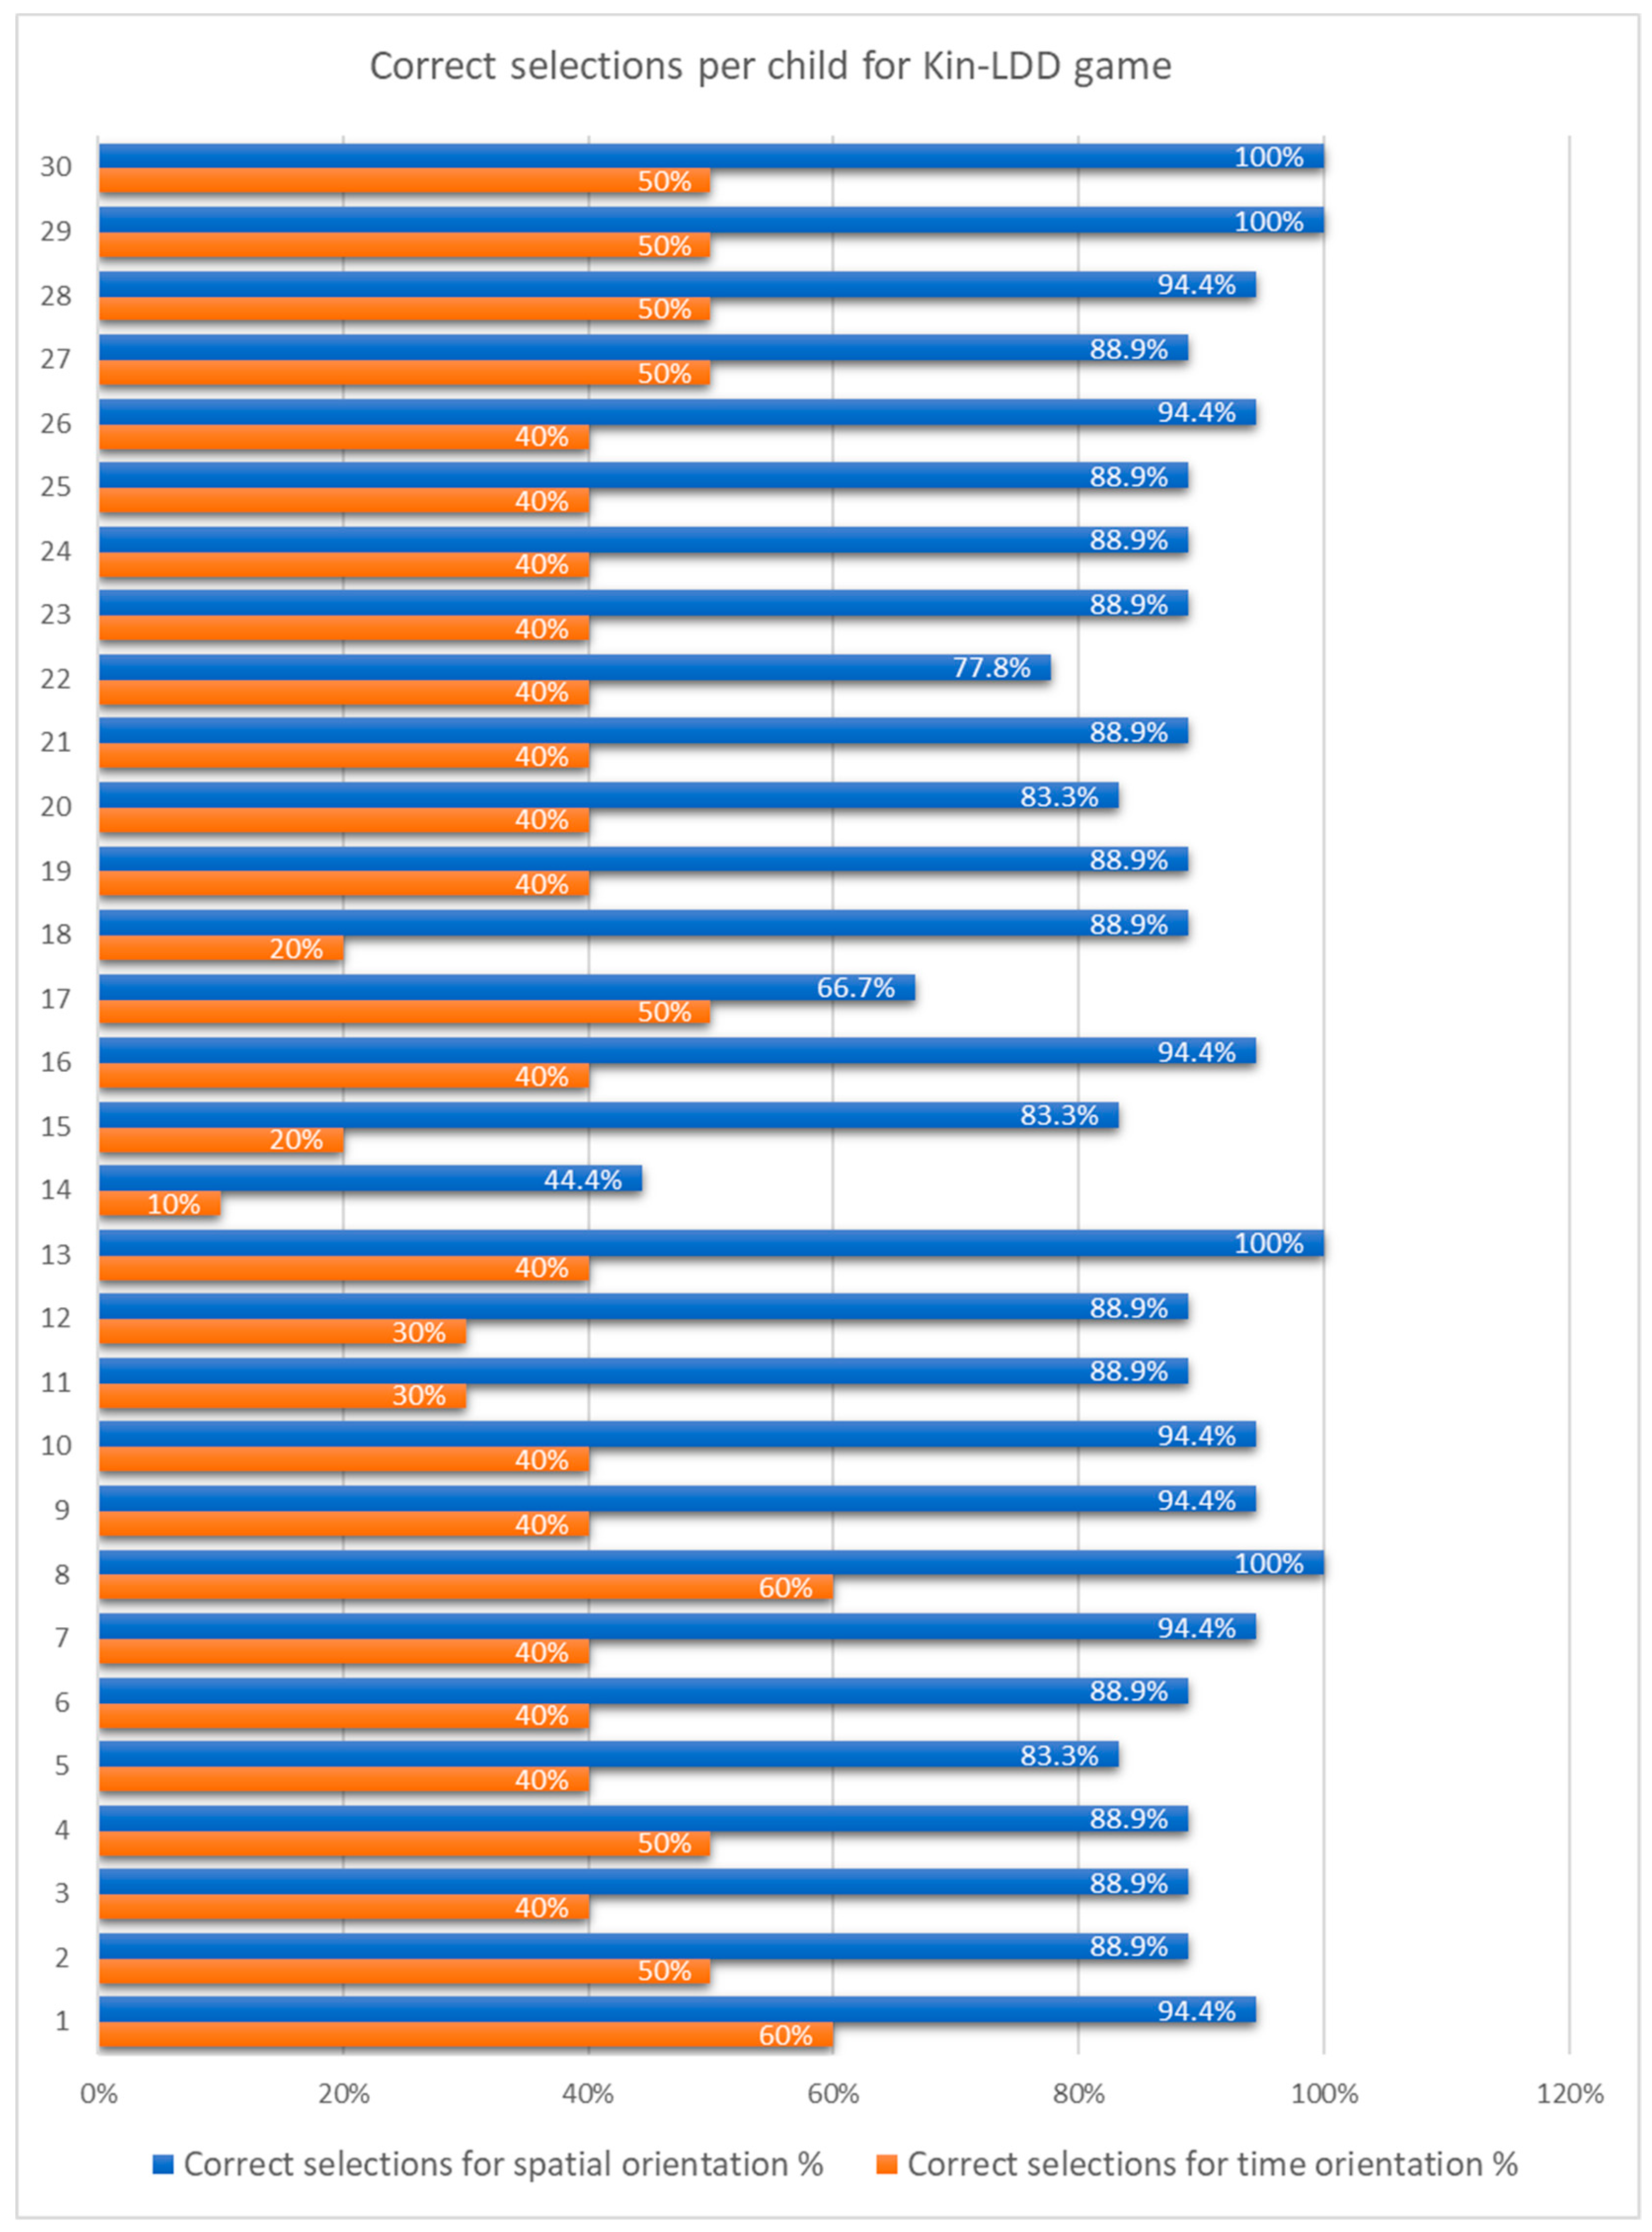
The dependent variables Cs and Ct (number of correct activity screens per child for the spatial and time orientation modules, respectively), as presented in
Figure 5, revealed that most of the children made more correct selections in the spatial orientation module. This was expected due to the complexity of the time orientation module and the multiplicity of possible errors.
Four children (with IDs 8, 13, 29, 30), managed to achieve a perfect score for all 18 activities in the spatial orientation module. They also had higher scores compared to other children on the time orientation module. Interestingly, three of these four children were diagnosed into the same learning difficulty group, dysgraphia.
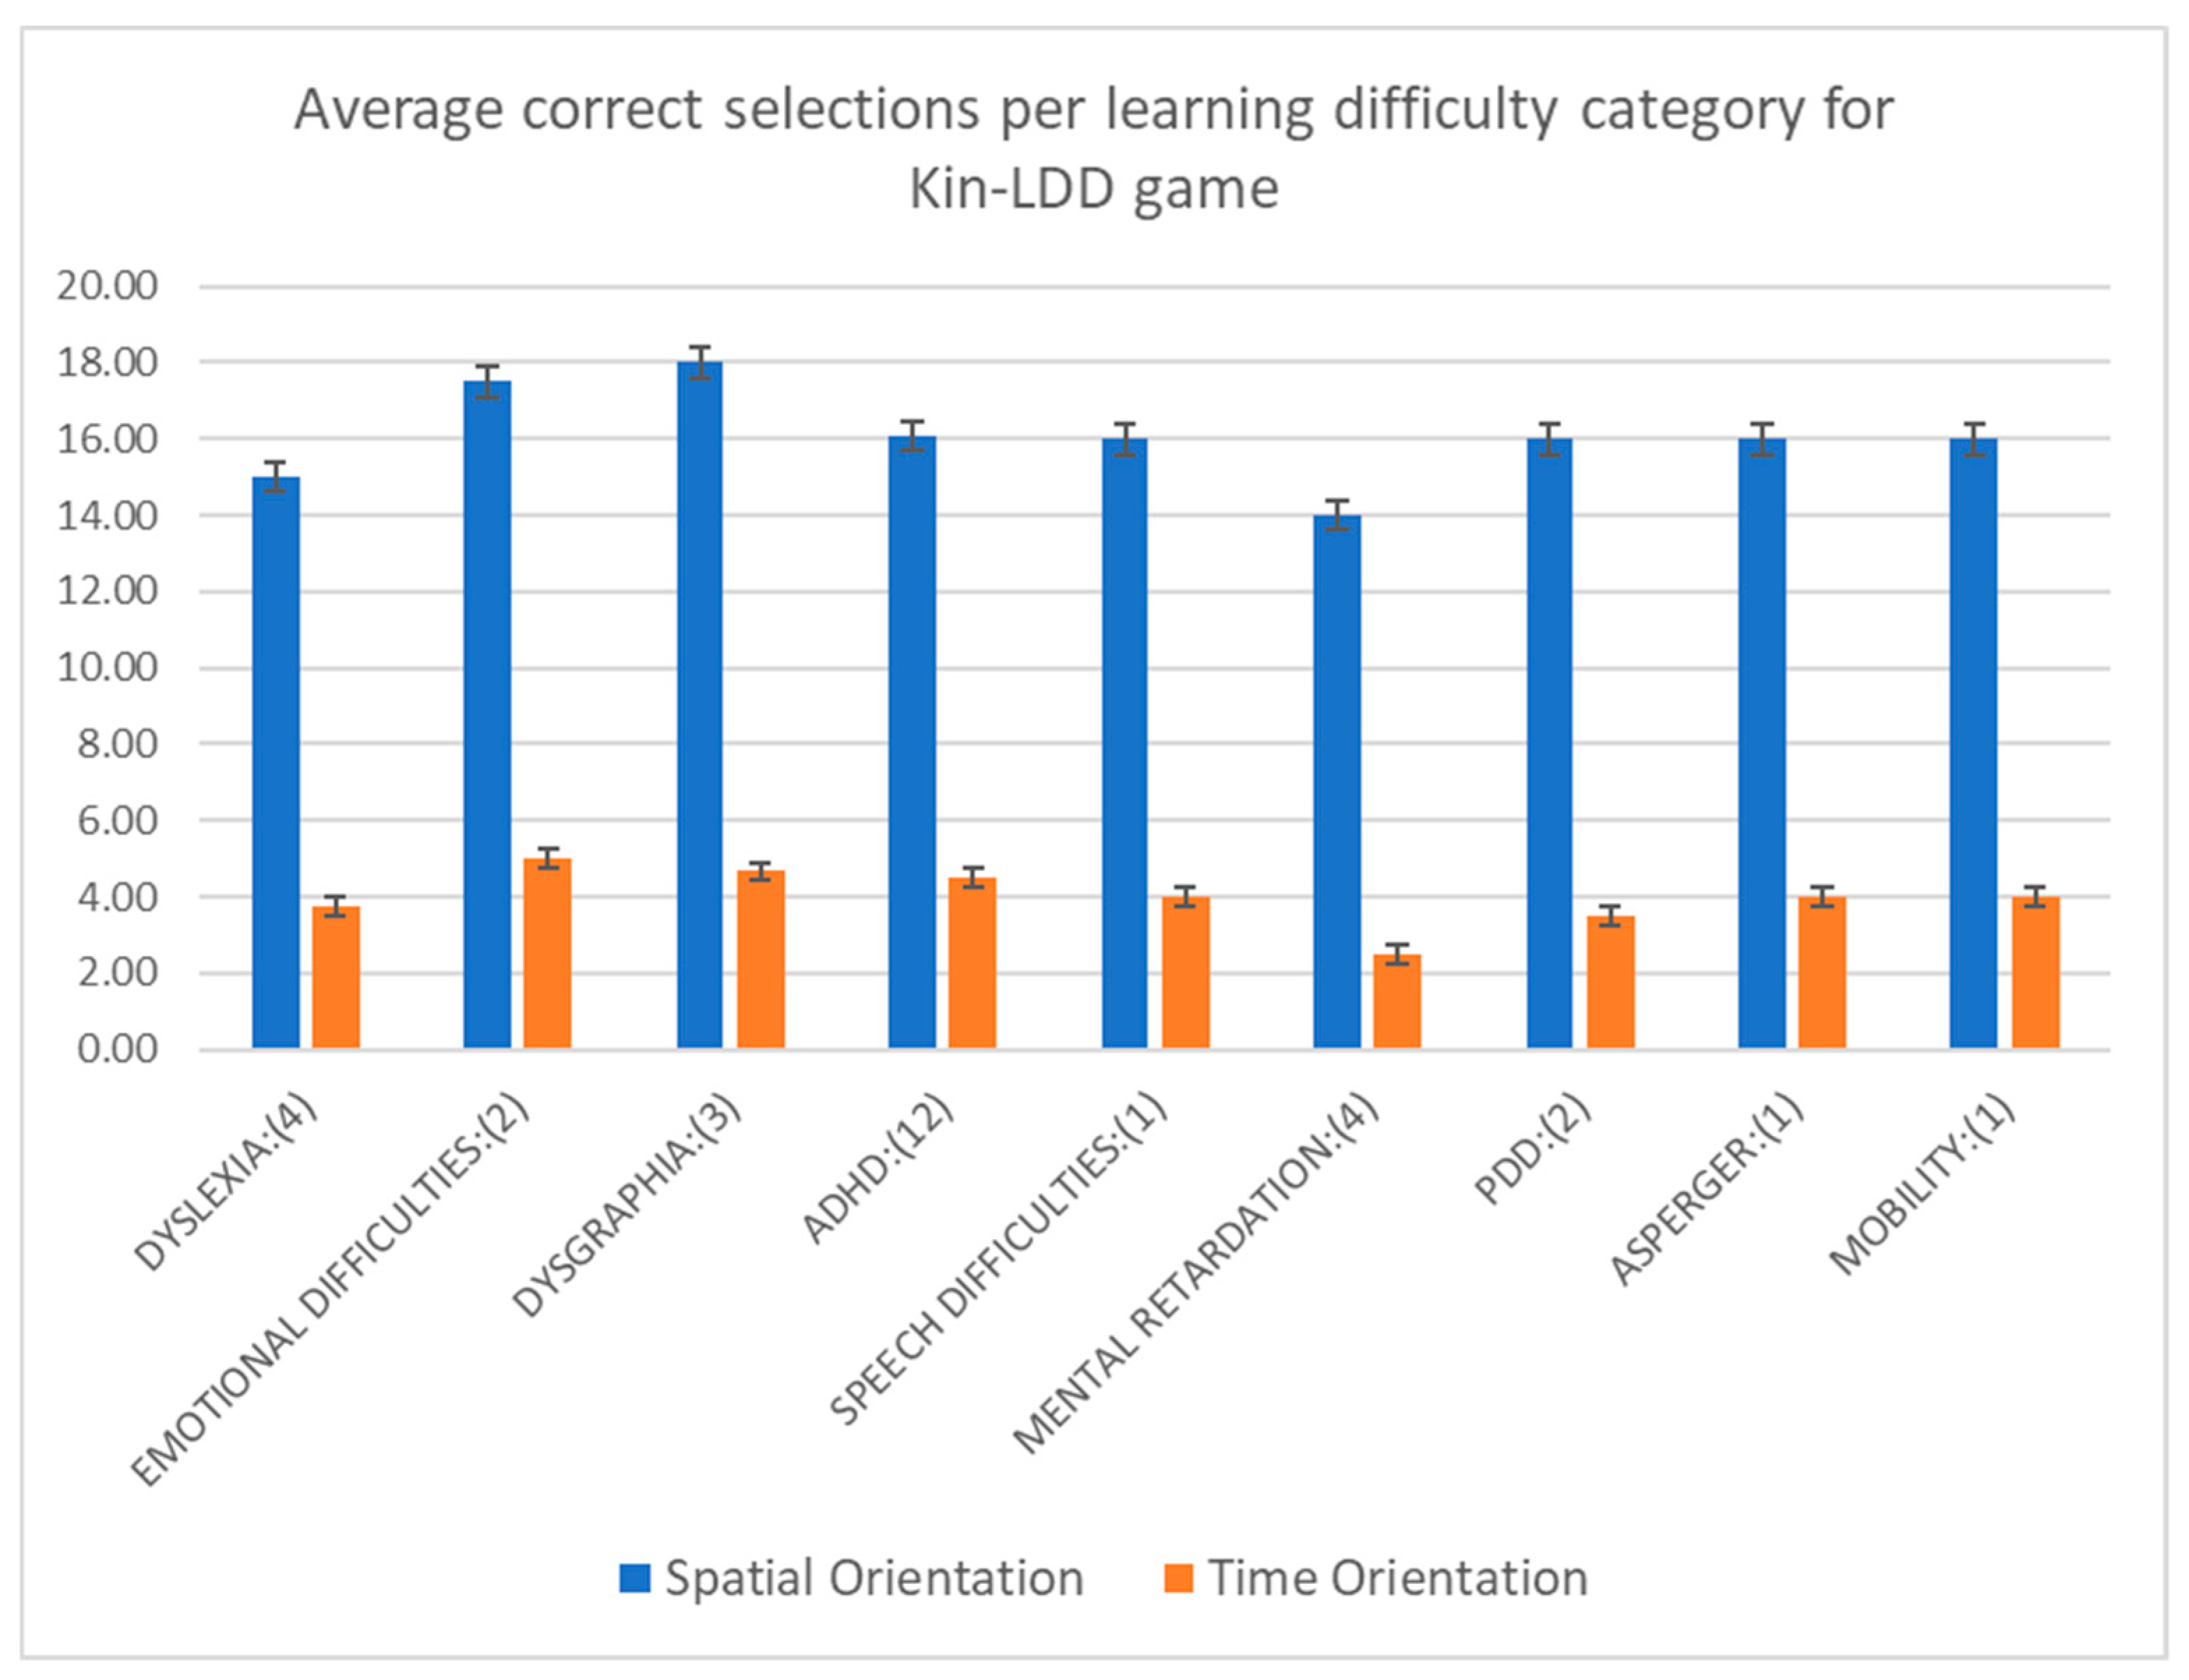
The average number of correct selections for the spatial and time orientation modules per learning difficulty category is presented in
Figure 6. The dysgraphia group had the most correct answers on average, while the mental retardation group was the one that had the most incorrect answers. Also, all children characterized by dysgraphia managed to y complete the spatial orientation module flawlessly. Finally, children who had on average more correct answers on the spatial orientation module, also scored better on average on the second module of the game.
5.1. Spatial Orientation
In the spatial orientation module, there are six groups comprising 18 different activity screens. Each group varies in the number of activity screens it contains (
Figure 1). and each group’s screens examine similar perceptual abilities. For example, Group A contains four activity screens and is concerned with left and right orientation principles. For the spatial orientation module, the data gathered by the KPIs include the sum of correct and incorrect selections, the total number of unsuccessful attempts, the time taken to complete each activity screen and the total duration of the whole module for each child. For the analysis of the results, the above KPIs were combined with the learning difficulty category assigned by the official diagnosis. The average number of correct selections for each group for spatial orientation module is presented in
Figure 6. Out of all the groups with at least three children, the dysgraphia group scored the highest, while the ADHD group had the second-highest scores.
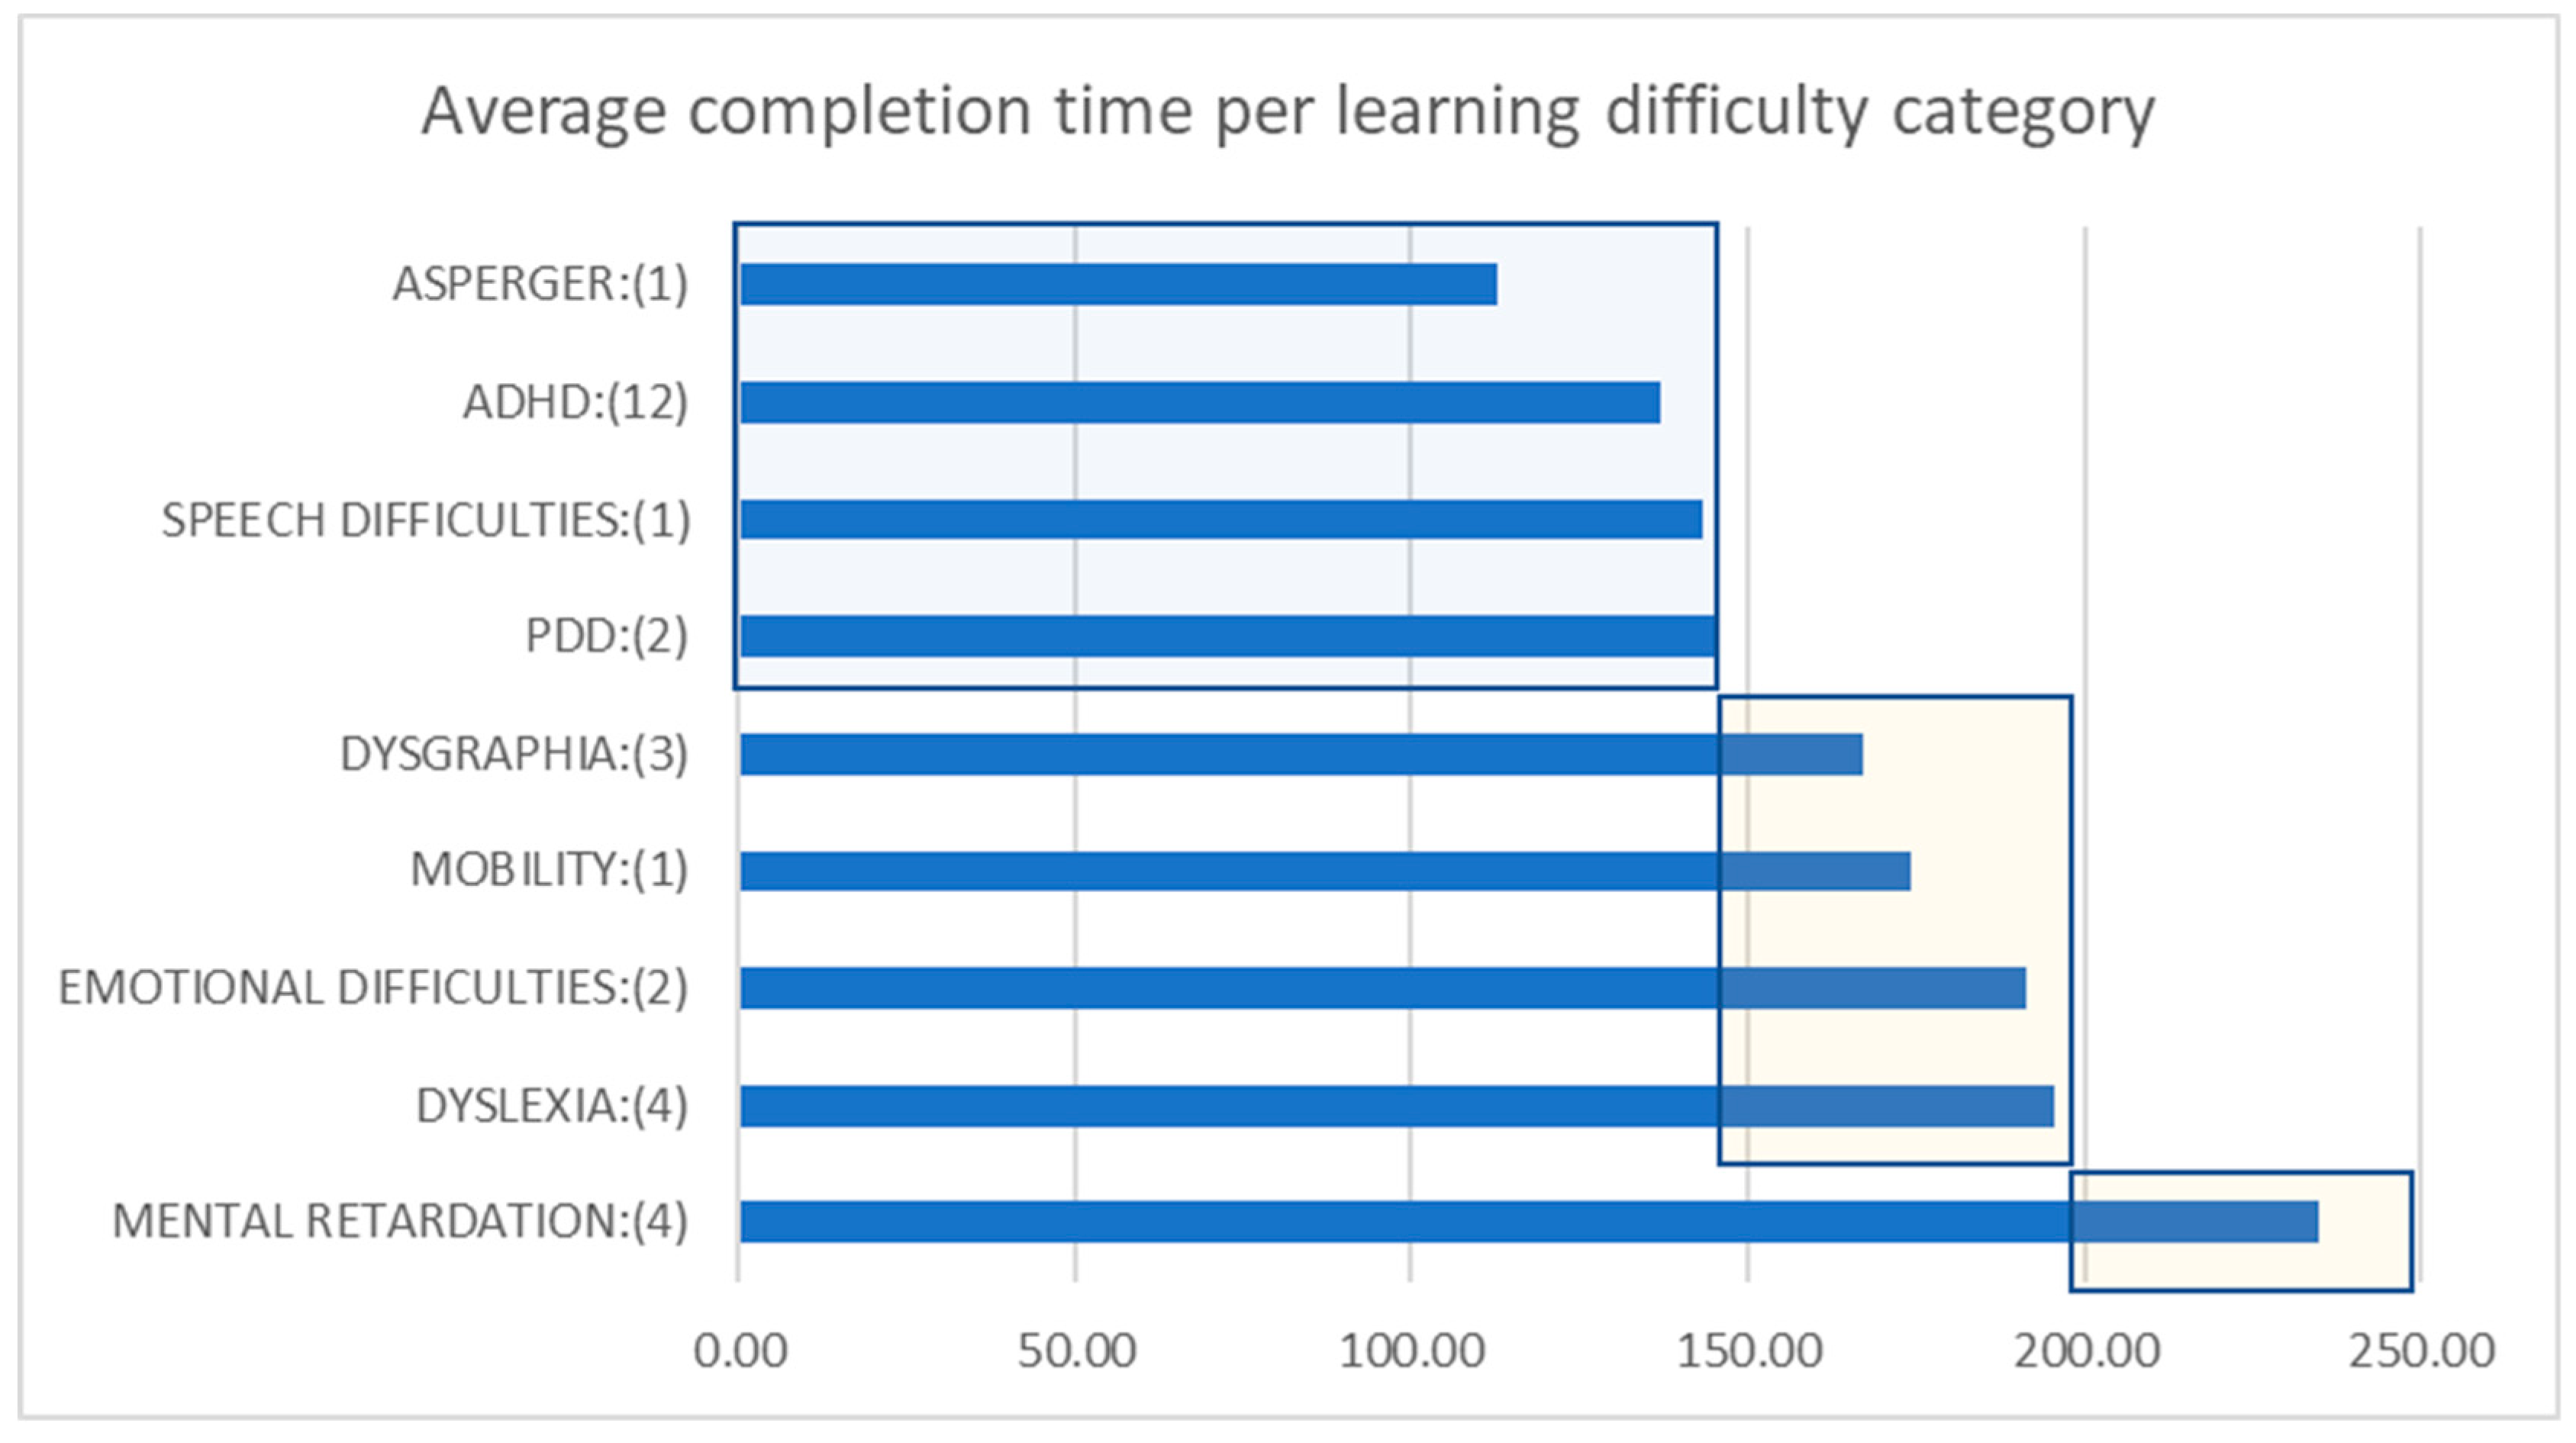
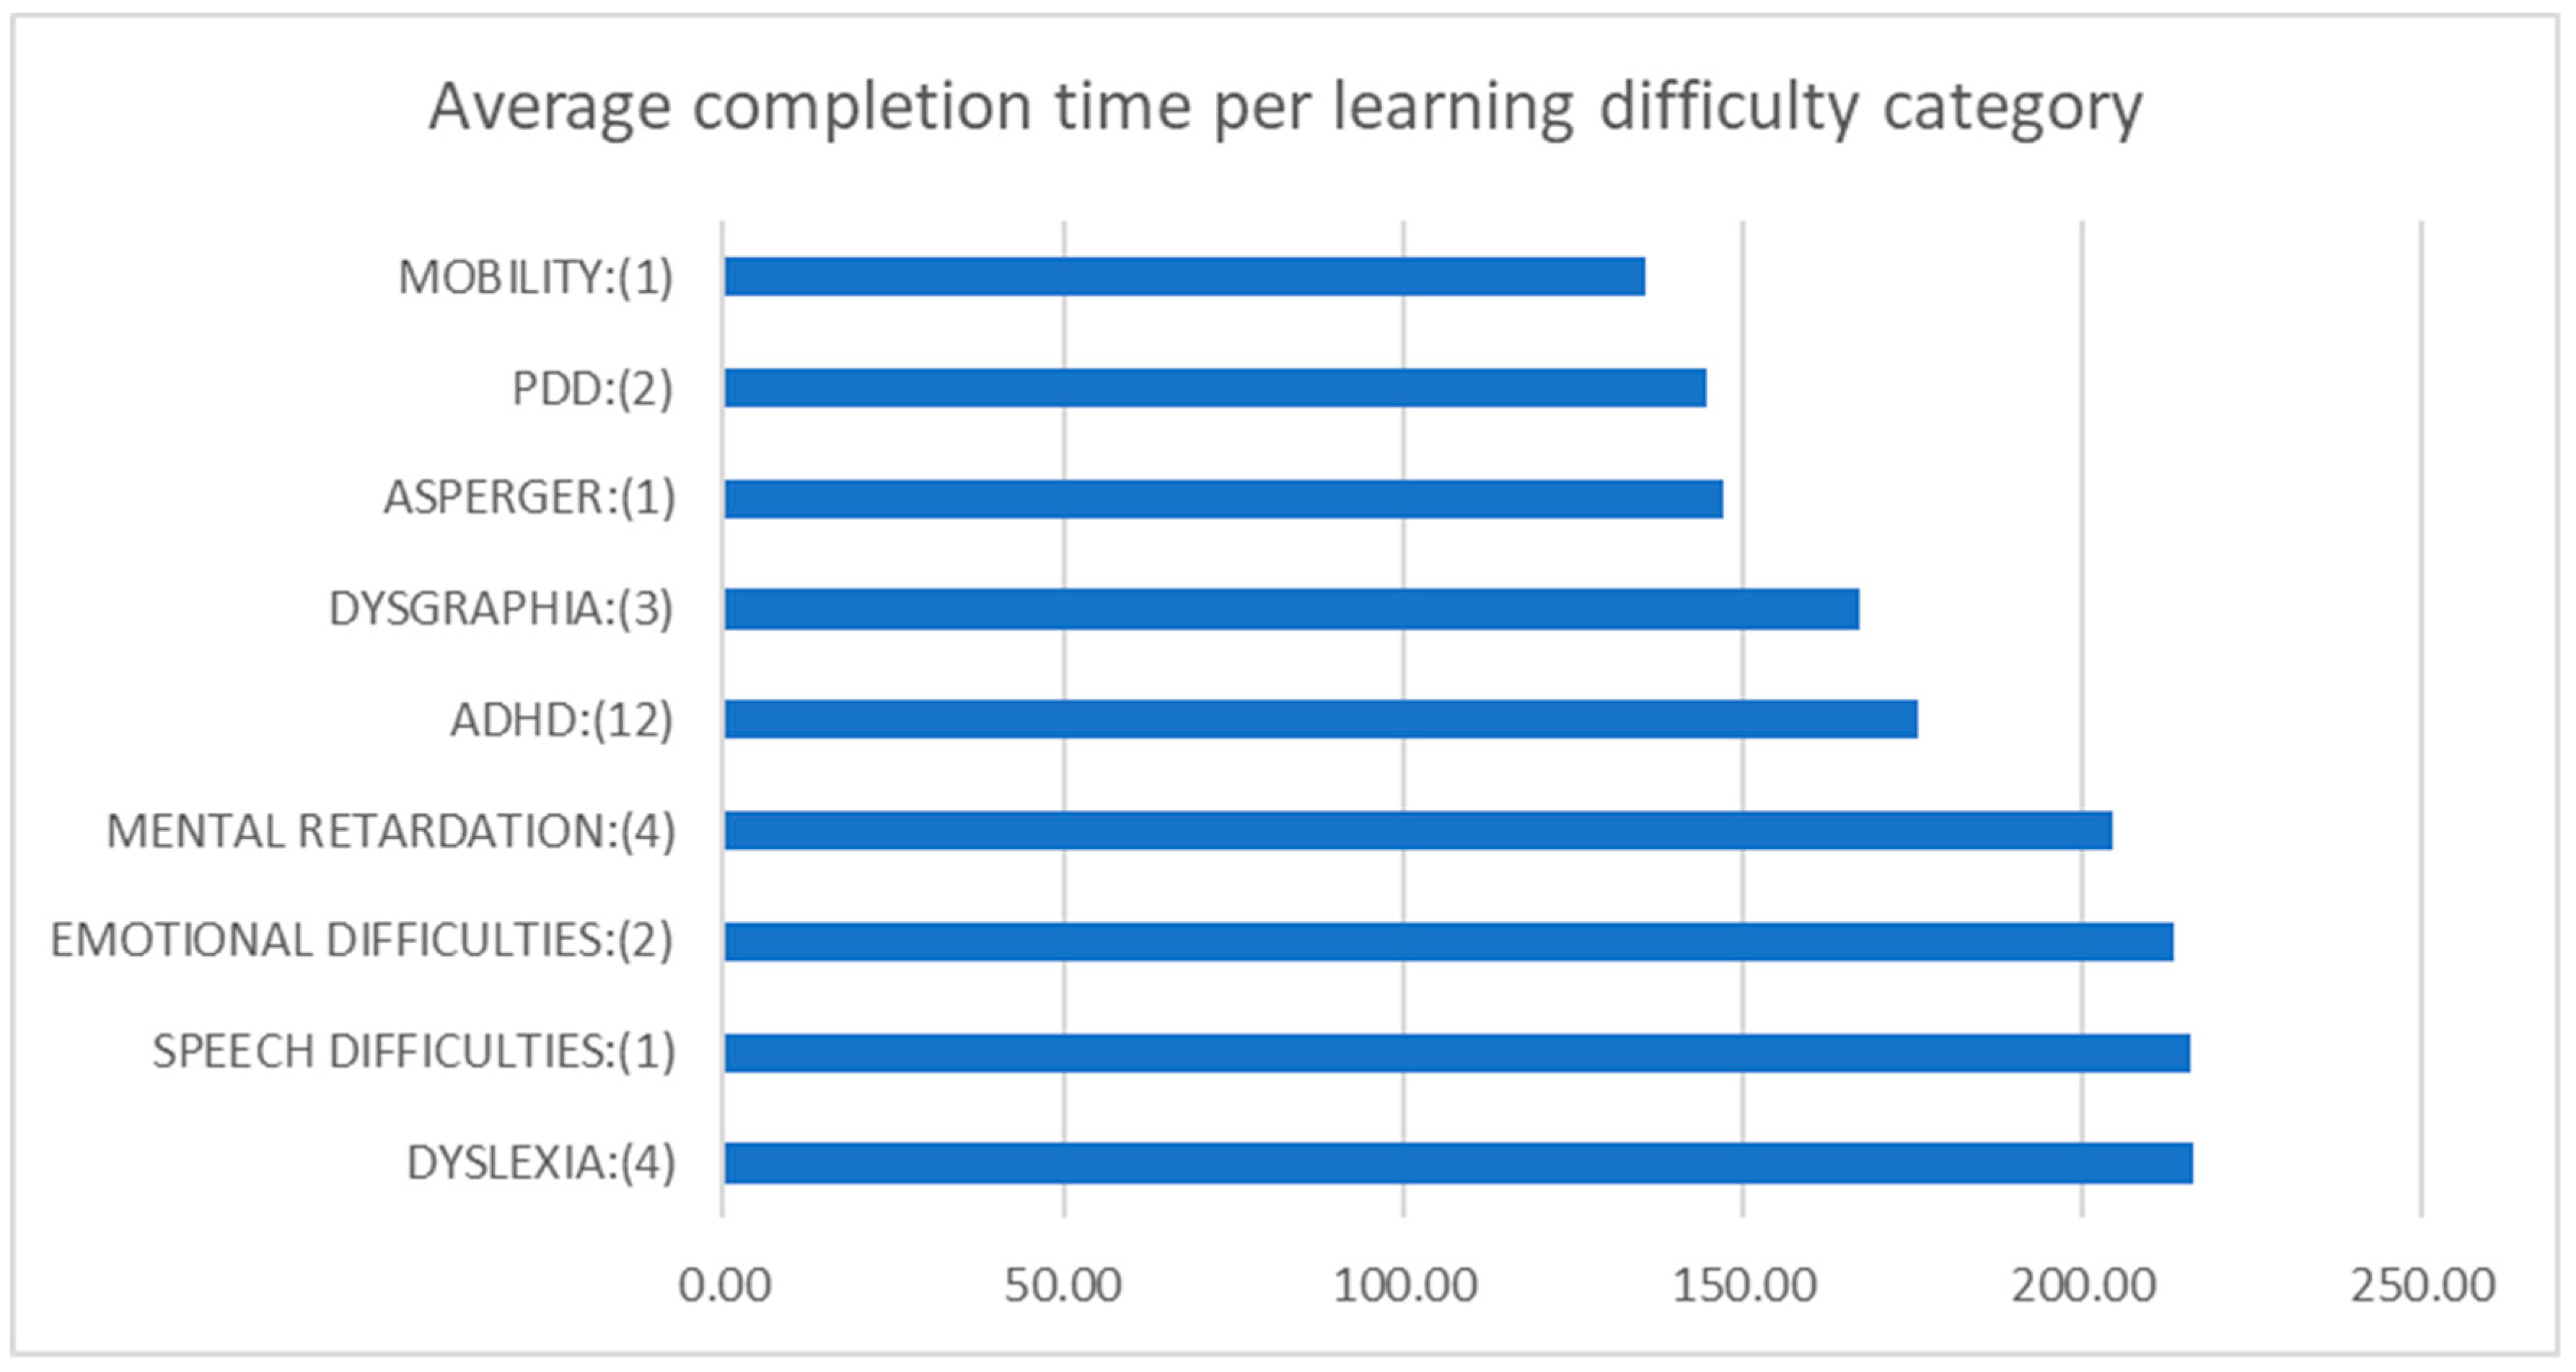
Figure 7 presents the average completion time per learning difficulty group. Out of all the groups with at least three children, the ADHD group was by far the fastest in completing the spatial orientation module, irrespective of whether the participants made a correct or incorrect selection. Out of all these groups, the mental retardation group was by far the slowest in completing this module.
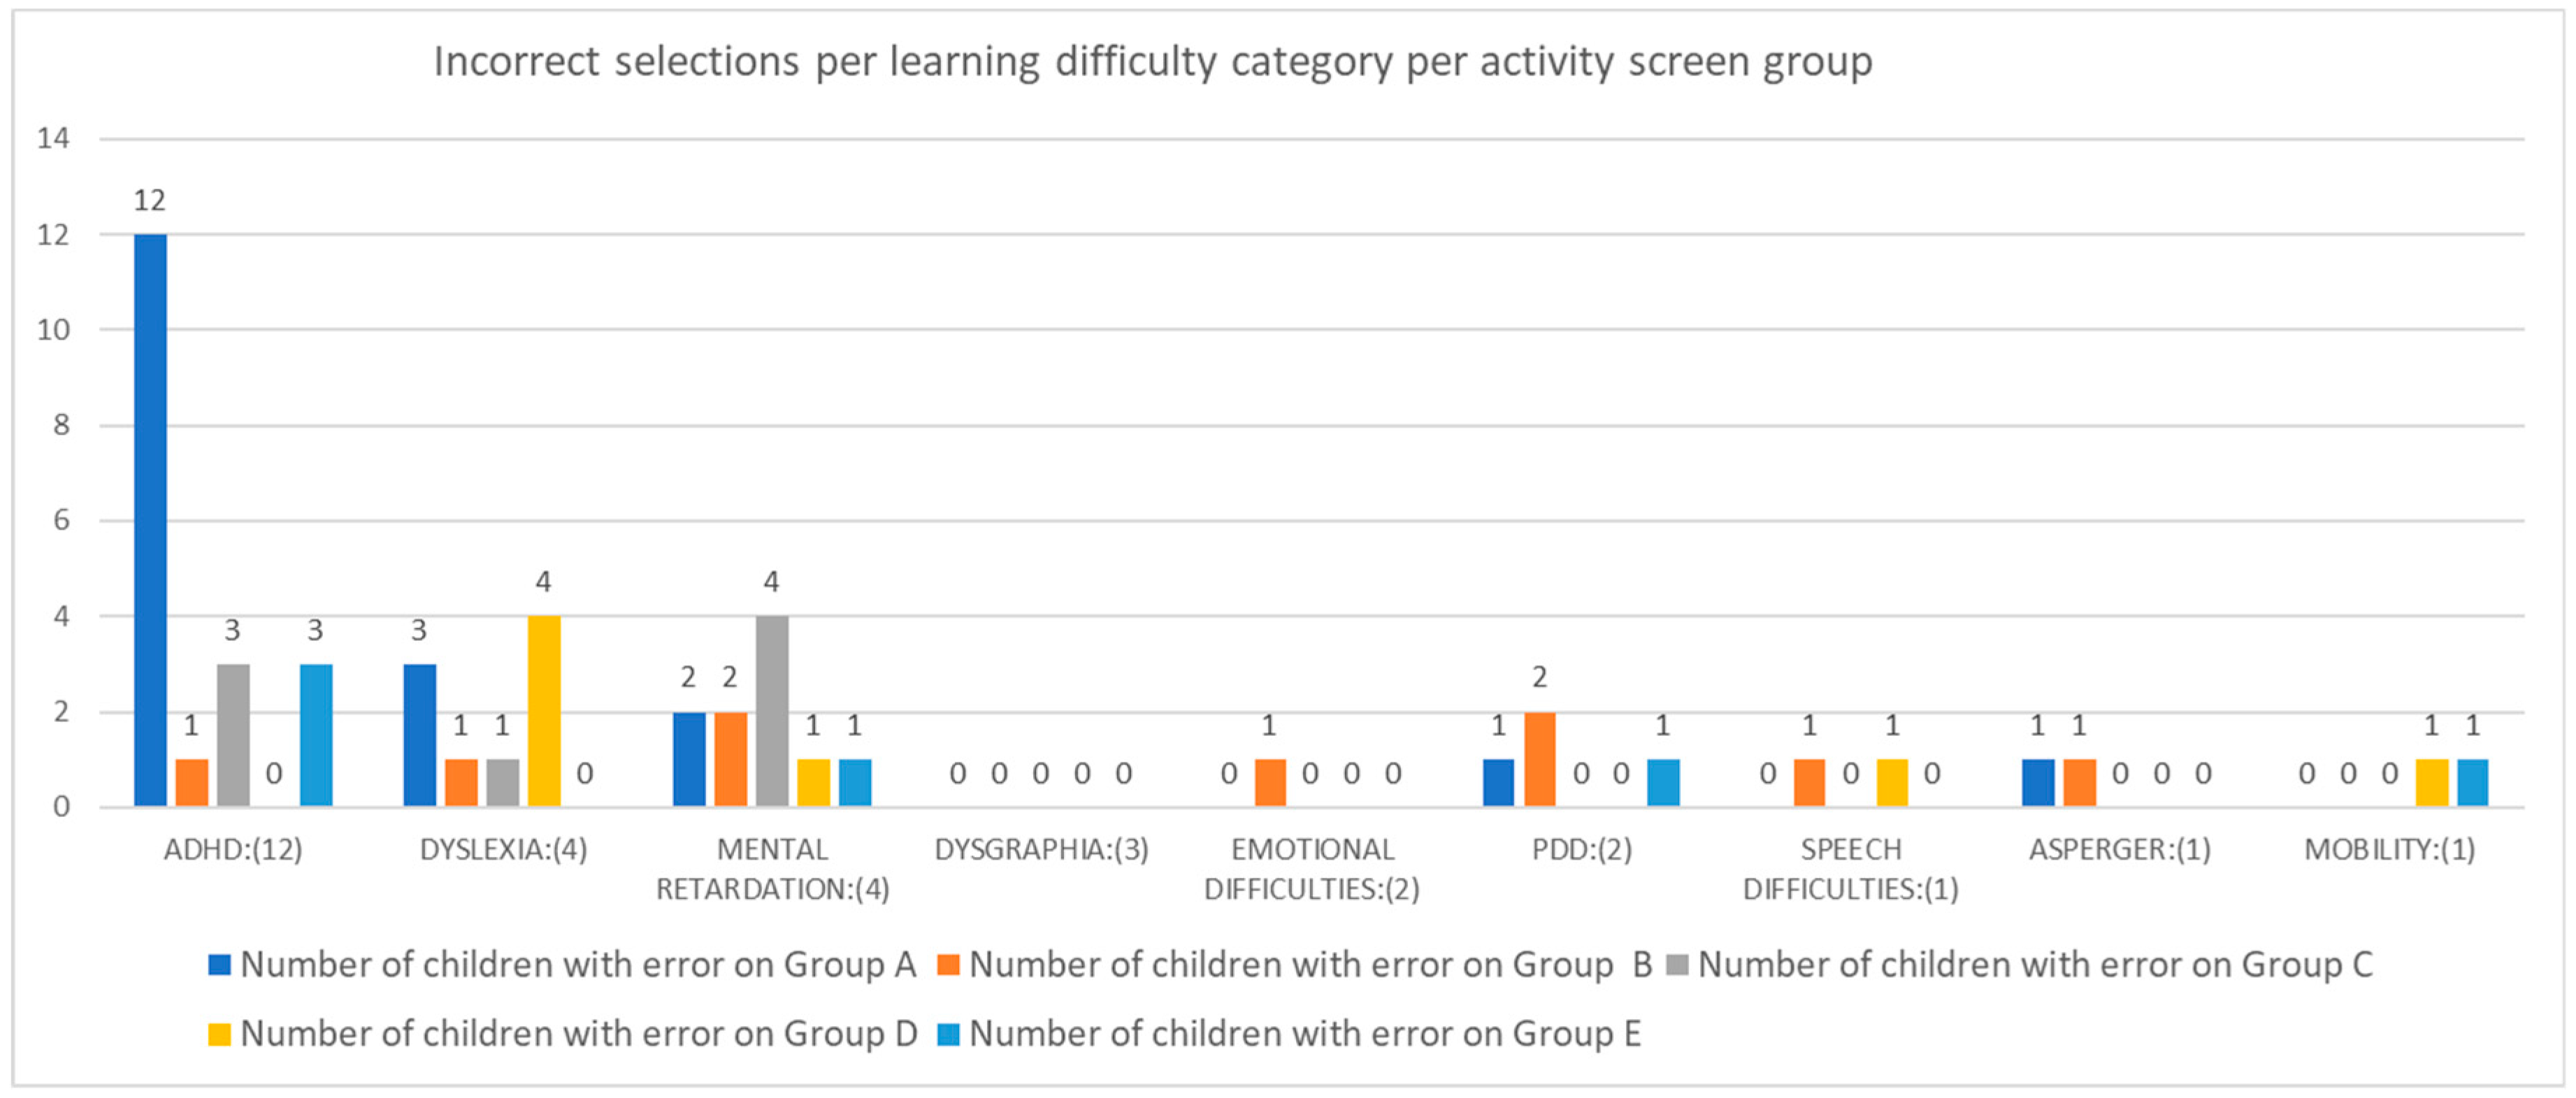
Figure 8 presents the number of the children that had incorrect selections for each learning difficulty category and per activity screen group. It is worth noting that out of all the groups with two or more children, only in the ADHD group did every child make at least one incorrect selection in the “Left—Right” activities (Group A). Furthermore, the children characterized as dyslexic made at least one error in the “Between—In the Middle” activities (Group D). Children in the mental retardation group made at least one incorrect selection in the “In Front of—Behind” (Group C). Finally, the dysgraphia group was the only group that made all selections correctly in all activity screens in the spatial orientation module.
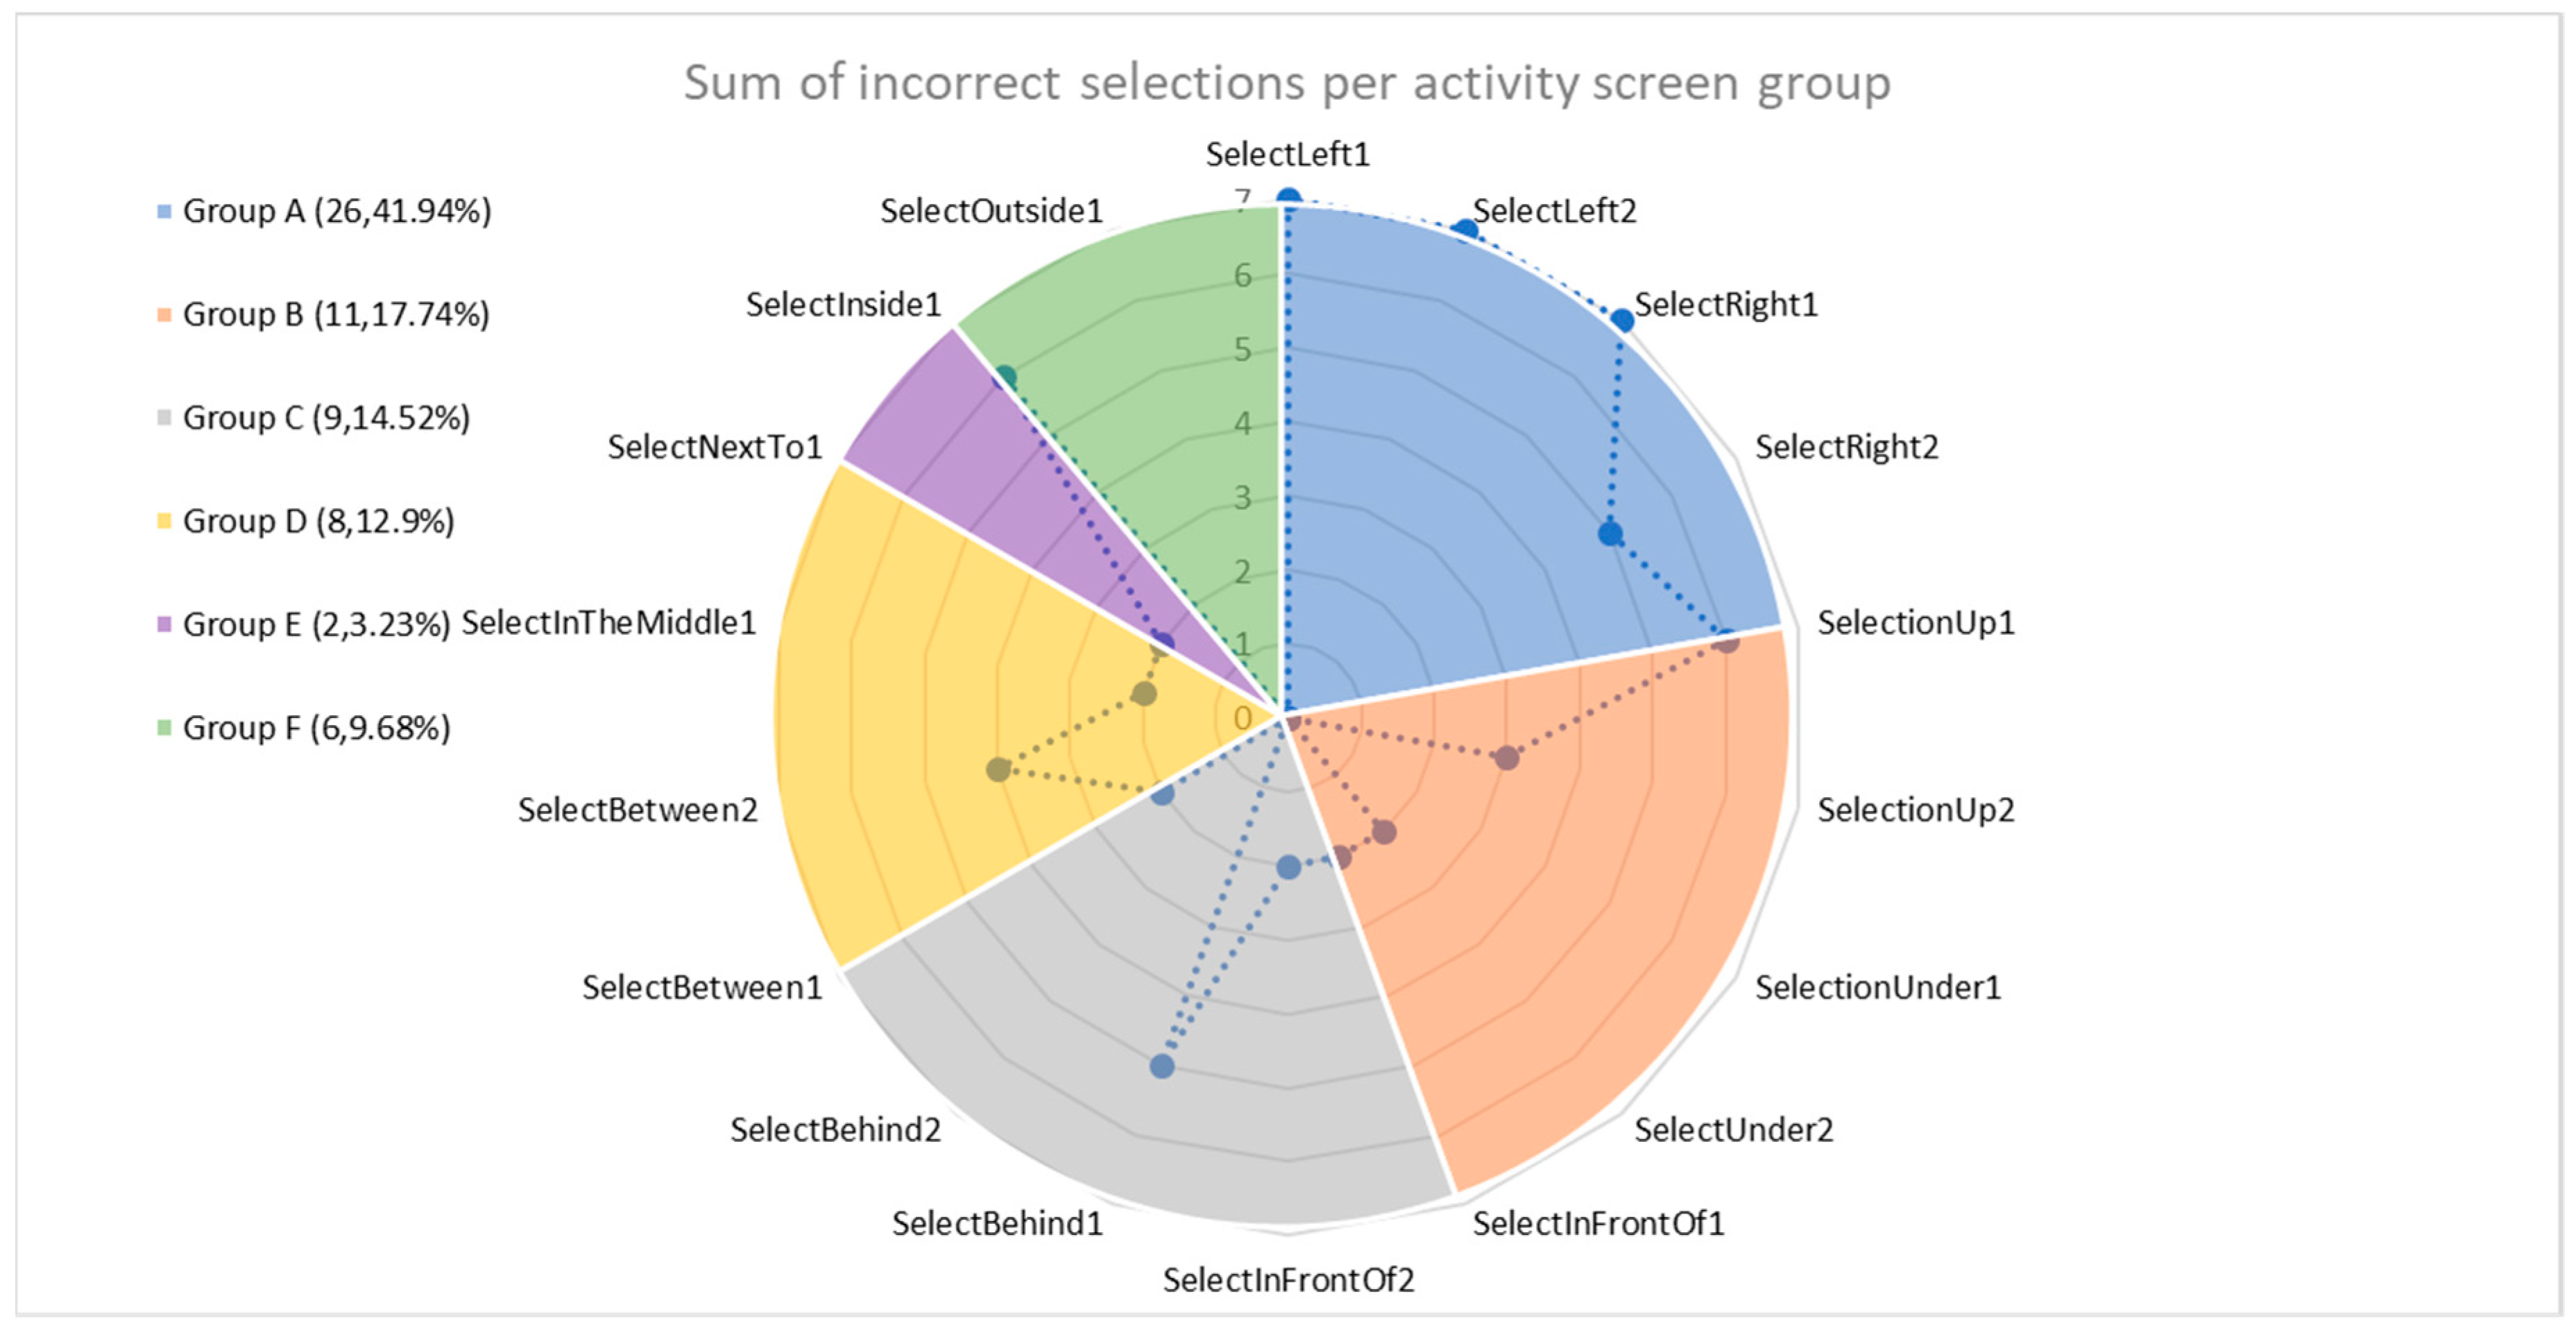
The
Figure 9 displays the breakdown of errors per activity screen group for all children in this module. It is evident that that majority of the children found Group A’s “Left—Right” questions to be the hardest of the whole module. This group of activity screens produced the highest number of errors (26 in total) which equates to 41.94% of the total errors in the module. Furthermore, the activities that the children had no incorrect selections for were “SelectUnder2”, “SelectBehind2” and “SelectOutside1”.
As presented, the descriptive statistics results revealed interesting findings that facilitated diagnosis and could be used as a form of “suggestion” for the special educator. A more detailed group prediction was not feasible, since as shown in
Table 1, most of the learning difficulty categories had a very small number of children, thus the effect size of such an analysis is quite small. However, grouping the children into two groups (those who had been classified as ADHD in one group and all the remaining children in the other), with 12 and 18 children in each group, respectively, a two-tailed independent samples t-test revealed statistically significant differences between these two groups for spatial orientation, F = 0.539, p = 0.001. Repeating this analysis for the mental retardation group (with two groups of 4 and 26 children, respectively) a two-tailed independent samples t-test also revealed statistically significant differences between these two groups for spatial orientation, F = 2.700, p = 0.000. These results showed that Ts was a good indicator for “suggesting” some learning difficulty categories, which validates the third hypothesis. However, further analysis is required when all learning difficulty groups have more children. This (low group size) was the main reason the non-parametric tests did not reveal any further differences for the dependent variables (Cs, Us) for spatial orientation.
5.2. Time Orientation
For the time orientation module analysis, we combined the data of the diagnosed learning difficulty category, the sum of correct and incorrect answers, the time taken to complete each activity screen and the total duration of the whole module per participant. There are 10 screens in this module in total, accounting for four different activity screen groups (
Figure 1). An immediate observation from the results shown in
Figure 5 is that none of the experiment participants answered all the questions correctly. This was attributed to the fact that the module was developed with more complex activity screens by design.
Figure 6 presents the average correct selections also for the spatial orientation module. The emotional difficulties group scored the highest, but had only two participants. The second-highest score was by the dysgraphia group, where its three participants, consistently scored highly on both modules, followed by the ADHD group with 12 children. The mental retardation group scored the lowest out of all the groups.
The average completion time on the time orientation module for each learning difficulty group is presented in
Figure 10. Out of all the groups with at least three children, the fastest average completion time was performed by the dysgraphia group followed by the ADHD and mental retardation groups, respectively.
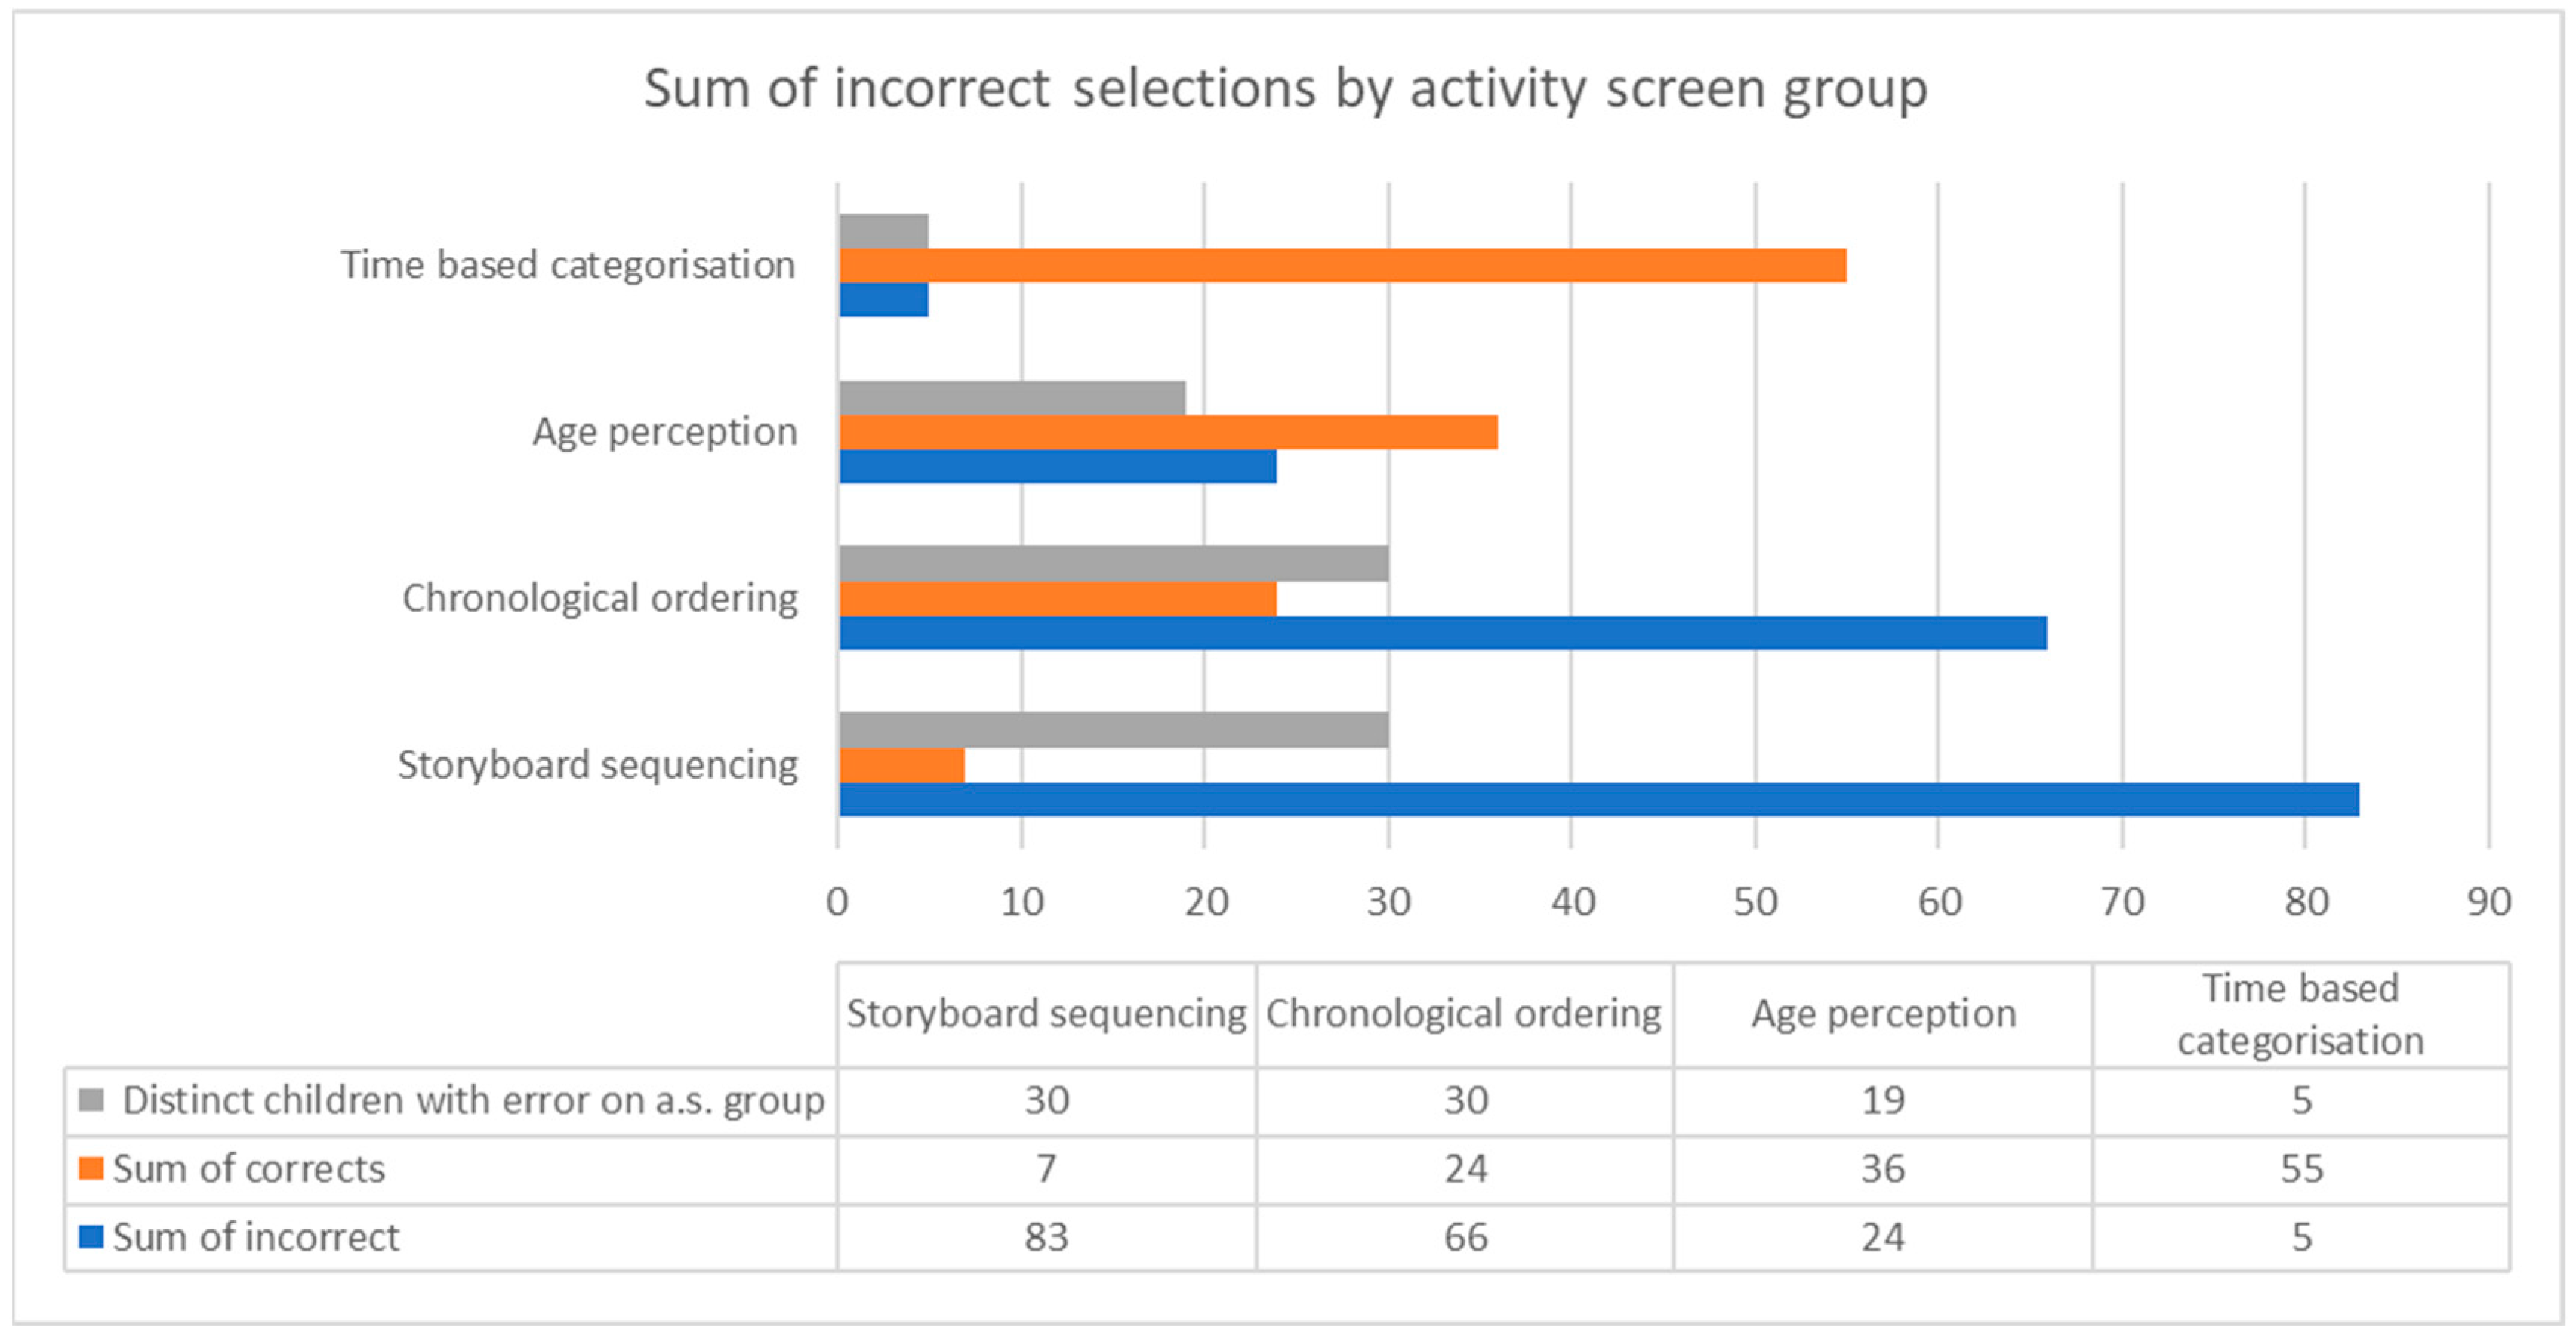
Figure 11 shows the sum of errors per activity screen group and the graph makes it instantly apparent that the results confirmed the intended design of the game by converging towards the gradual increase of complexity in the activity screens. As expected, out of the four activity screen groups, the highest number of correct responses were given for “time-based categorization”, since this contained the first and easiest set of screens in the series of the module. Most of the children (83.33%) answered correctly, providing a total of 55 correct responses, however, the “age perception” group of activity screens yielded only 36 correct responses. The declining trend of correct answers continues with the “chronological ordering”, where all the children made at least one error in one of the activity screens concluding with “storyboard sequencing” which was the hardest set of activity screens in the whole game.
For the time orientation activity screen, dividing the children into two groups (those who had been diagnosed with ADHD in one group and all the remaining children in the other group), with 12 and 18 children in each group, respectively, a two-tailed independent samples t-test did not reveal statistically significant differences between these two groups for time orientation, F = 0.030, p = 0.391. The same result was produced using the mental retardation as the grouping variable (F = 1.283, p = 0.266).
6. Conclusions, Limitations and Future Goals
In conclusion, Kin-LDD is considered by children to be a fun game and by the special educator, to be a valuable tool that could contribute to the diagnostic procedure of learning difficulties by providing additional information related to spatial and time orientation tasks. The introduction of KPIs offering detailed metrics (time, success or failure, attempts, time taken for each attempt) can provide significant value to the diagnostic process. Moreover, Kin-LDD produced interesting results, clusters and patterns, such as the completion time of the spatial orientation module, which can be utilized to enhance the diagnosis. Finally, Kin-LDD contributed to the diagnostic procedure by identifying characteristics between groups of children, which can aid with the identification of the underlying learning difficulty. The study presented, leads to a promising research path for the diagnosis of learning difficulties, from the perspective of both children and special educators. Kin-LDD could help special educators with the hard work that they must accomplish, meanwhile increasing the fun parameter considered to be an essential factor when working with children. The results are very promising and confirmed the initial expectations about the effectiveness of Kin-LDD in the diagnosis of learning difficulties.
This study is not without limitations. From a statistical perspective, a sample of 30 children is rather small, but considering similar studies in the same research field and the special conditions related to finding and collecting data from such groups of children, the sample size does not pose a strict limitation for the conclusions of this study. Attracting a larger sample incorporating children from all learning difficulty groups is a future goal. Although we have collaborated with more special educators from the Center for Differential Diagnosis, Diagnosis and Support of Athens in previous stages, only one of them was selected to participate in the diagnostic procedure using Kin-LDD, in order to avoid introducing a third parameter in our analysis (the special educator). We have conducted many interviews and focus groups with special educators during the design process of Kin-LDD game, which gave us initial promising feedback, but the evaluation of the tool’s effectiveness by more special educators and comparing results remains a future goal. Finally, since all activity screens are in Greek, localization and adaptation to other languages is a future goal, since this is a task requiring careful re-design and goes far beyond simple translation. Another interesting future goal is the extension of the game’s activity screens to incorporate the evaluation of other cognitive abilities and skills, such as working memory and attention. Finally, another goal, is the collection of more data for the recording of performance metrics from each individual activity screen, ultimately constructing a prediction model which would potentially categorize children into a learning difficulty group based on the KPIs generated by Kin-LDD.
Author Contributions
Conceptualization, E.C.; Methodology, E.C. and M.X.; Software, E.C.; Formal Analysis, E.C. and M.X.; Investigation, E.C., M.X.; Resources, E.C. and C.M.; Data Curation, E.C. and M.X.; Writing—Original Draft Preparation, E.C.; Writing—Review and Editing, E.C., M.X. and C.M.; Visualization, E.C.
Funding
This research received no external funding.
Acknowledgments
We would like to thank all the children who participated in this study, their parents for volunteering, and the special educators from the Center for Differential Diagnosis, Diagnosis and Support of Athens for their valuable collaboration and active involvement in the study.
Conflicts of Interest
The authors declare no conflict of interest.
References
- Kass, C.E.; Myklebust, H.R. Learning Disability: An Educational Definition. Learn. Disabil. 1969, 2, 377–379. [Google Scholar] [CrossRef]
- Silver, L.B. A review of the federal government’s Interagency Committee on Learning Disabilities report to the US Congress. Learn. Disabil. Focus 1988, 3, 73–80. [Google Scholar]
- Kirk, S.A. Specific learning disabilities. J. Clin. Child Adolesc. Psychol. 1977, 6, 23–26. [Google Scholar] [CrossRef]
- Hammill, D.D. On Defining Learning Disabilities: An Emerging Consensus. J. Learn. Disabil. 1990, 23, 74–84. [Google Scholar] [CrossRef] [PubMed]
- Siegel, L.S. Issues in the Definition and Diagnosis of Learning Disabilities: A Perspective on Guckenberger v. Boston University. J. Learn. Disabil. 1999, 32, 304–319. [Google Scholar] [CrossRef] [PubMed]
- Bender, W.N.; Wall, M.E. Social-Emotional Development of Students with Learning Disabilities. Learn. Disabil. Q. 1994, 17, 323–341. [Google Scholar] [CrossRef]
- Hammill, D.D. DTLA-4: Detroit Tests of Learning Aptitude; Pro-ed.: Austin, TX, USA, 1998. [Google Scholar]
- Wechsler, D. Wechsler Intelligence Scale for Children–Fifth Edition (WISC-V): Technical and Interpretive Manual; Pearson Clinical Assessment: Bloomington, MN, USA, 2014. [Google Scholar]
- Department for Education. Special Educational Needs and Disability Code of Practice: 0 to 25 Years; Department for Education: London, UK, 2014.
- Chatzidaki, E.; Xenos, M.; Machaira, C. A natural user interface game for the evaluation of children with learning difficulties. In Proceedings of the 6th Workshop on Child Computer Interaction (WOCCI 2017), Glasgow, Scotland, 13 November 2017. [Google Scholar]
- Breuer, J.; Bente, G. Why so serious? On the relation of serious games and learning. J. Comput. Game Cult. 2010, 4, 7–24. [Google Scholar]
- Mir, G.; Nocon, A.; Ahmad, W.; Jones, L. Learning Difficulties and Ethnicity; Department of Health: London, UK, 2001; pp. 1–84.
- Beale, S.; Sanderson, D.; Sanniti, A.; Dundar, Y.; Boland, A. A scoping study to explore the cost-effectiveness of next-generation sequencing compared with traditional genetic testing for the diagnosis of learning disabilities in children. Health Technol. Assess. 2015, 19, 1. [Google Scholar] [CrossRef] [PubMed]
- Europe, R. Support for Children with Special Educational Needs (SEN); European Commission: Brussels, Belgium, 2013. [Google Scholar]
- Robson, C. Students with Disabilities, Learning Difficulties and Disadvantages: Statistics and Indicators; Organisation for Economic Cooperation and Development: Paris, France, 2005. [Google Scholar]
- Kaufman, A.S.; Raiford, S.E.; Coalson, D.L. Intelligent Testing with the WISC-V; John Wiley & Sons: Hoboken, NJ, USA, 2015. [Google Scholar]
- Hammill, D.D.; Bryant, B.R. Detroit Tests of Learning Aptitude–Primary, 3rd ed.; Pro-Ed.: Austin, TX, USA, 2005. [Google Scholar]
- Gao, Z.; Hannan, P.; Xiang, P.; Stodden, D.F.; Valdez, V.E. Video Game–Based Exercise, Latino Children’s Physical Health, and Academic Achievement. Am. J. Prevent. Med. 2013, 44 (Suppl. 3), S240–S246. [Google Scholar] [CrossRef]
- Pesce, C.; Crova, C.; Cereatti, L.; Casella, R.; Bellucci, M. Physical activity and mental performance in preadolescents: Effects of acute exercise on free-recall memory. Ment. Health Phys. Act. 2009, 2, 16–22. [Google Scholar] [CrossRef]
- Castelli, D.; Glowacki, E.; Barcelona, J.M.; Calvert, H.G.; Hwang, J. Active education: Growing evidence on physical activity and academic performance. Active Living Research. 2015, pp. 1–5. Available online: http://activelivingresearch.org/sites/default/files/ALR_Brief_ActiveEducation_Jan2015.pdf (accessed on 2 February 2019).
- Chatzidaki, E.; Xenos, M. A case study on learning through natural ways of interaction. In Proceedings of the Global Engineering Education Conference (EDUCON), Athens, Greece, 25–28 April 2017. [Google Scholar]
- Sheu, F.-R.; Chen, N.-S. Taking a signal: A review of gesture-based computing research in education. Comput. Educ. 2014, 78, 268–277. [Google Scholar] [CrossRef]
- Lee, W.-J.; Huang, C.W.; Wu, C.J.; Huang, S.T.; Chen, G.D. The effects of using embodied interactions to improve learning performance. In Proceedings of the 2012 IEEE 12th International Conference on Advanced Learning Technologies, Rome, Italy, 4–6 July 2012. [Google Scholar]
- Ayala, N.A.R.; Mendívil, E.G.; Salinas, P.; Rios, H. Kinesthetic Learning Applied to Mathematics Using Kinect. Procedia Comput. Sci. 2013, 25, 131–135. [Google Scholar] [CrossRef]
- Hsiao, H.-S.; Chen, J.-C. Using a gesture interactive game-based learning approach to improve preschool children’s learning performance and motor skills. Comput. Educ. 2016, 95, 151–162. [Google Scholar] [CrossRef]
- Ibánez, J.G.; Wang, A.I. Learning recycling from playing a kinect game. Int. J. Game-Based Learn. 2015, 5, 25–44. [Google Scholar] [CrossRef]
- Westendorp, M.; Hartman, E.; Houwen, S.; Smith, J.; Visscher, C. The relationship between gross motor skills and academic achievement in children with learning disabilities. Res. Dev. Disabil. 2011, 32, 2773–2779. [Google Scholar] [CrossRef] [PubMed]
- Satz, P.; Morris, R. Learning disability subtypes: A review. In Neuropsychological and Cognitive Processes in Reading; Academic Press: Cambridge, MA, USA, 1981; pp. 109–141. [Google Scholar]
- Nicolson, R.I.; Fawcett, A.J. Automaticity: A new framework for dyslexia research? Cognition 1990, 35, 159–182. [Google Scholar] [CrossRef]
- Smith, A.; Taylor, E.; Warner Rogers, J.; Newman, S.; Rubia, K. Evidence for a pure time perception deficit in children with ADHD. J. Child Psychol. Psychiatry 2002, 43, 529–542. [Google Scholar] [CrossRef] [PubMed]
- Kourakli, M.; Altanis, I.; Retalis, S.; Boloudakis, M.; Zbainos, D.; Antonopoulou, K. Towards the improvement of the cognitive, motoric and academic skills of students with special educational needs using Kinect learning games. Int. J. Child-Comput. Interact. 2017, 11, 28–39. [Google Scholar] [CrossRef]
- Zhang, Z. Microsoft Kinect Sensor and Its Effect. IEEE Multimed. 2012, 19, 4–10. [Google Scholar] [CrossRef]
- Dehkordi, S.R.; Ismail, M.; Diah, N.M. A Review of Kinect Computing Research in Education and Rehabilitation. Int. J. Eng. Technol. 2018, 7, 19–23. [Google Scholar]
- Retalis, S.; Korpa, T.; Skaloumpakas, C.; Boloudakis, M.; Kourakli, M.; Altanis, I.; Siameri, F.; Papadopoulou, P.; Lytra, F.; Pervanidou, P. Empowering children with ADHD learning disabilities with the Kinems Kinect learning games. In European Conference on Games Based Learning; Academic Conferences International Limited: Berlin, Germany, 2014. [Google Scholar]
- Lewandowski, L.; Wood, W.; Miller, L.A. Chapter 3—Technological Applications for Individuals with Learning Disabilities and ADHD. In Computer-Assisted and Web-Based Innovations in Psychology, Special Education, and Health; Luiselli, J.K., Fischer, A.J., Eds.; Academic Press: San Diego, CA, USA, 2016; pp. 61–93. [Google Scholar]
- Altanis, G.; Boloudakis, M.; Retalis, S.; Nikou, N. Children with motor impairments play a kinect learning game: First findings from a pilot case in an authentic classroom environment. Interact Des. Archit. 2013, 19, 91–104. [Google Scholar]
- Puspitasari, W.; Ummah, K.; Pambudy, A.F. KIDEA: An innovative computer technology to improve skills in children with intelectual disability using Kinect sensor. In Proceedings of the 2013 IEEE International Conference on Industrial Engineering and Engineering Management, Bangkok, Thailand, 10–13 December 2013. [Google Scholar]
- Sales, E.S.S.E.B.; Cavalcante, D.M.; Marques, L.B.; das Graças, D.S. A Game for Teaching Children with Disability in Reading and Writing in Portuguese Using Voice Recognition and Kinect Sensor. In Proceedings of the X Brazilian Symposium on Computer Games and Digital Entertainment, Salvador-Bahia, Brazil, 7–9 November 2011. [Google Scholar]
- Uzuegbunam, N.; Wong, W.H.; Cheung, S.C.S.; Ruble, L. MEBook: Kinect-based self-modeling intervention for children with autism. In Proceedings of the 2015 IEEE International Conference on Multimedia and Expo (ICME), Turin, Italy, 29 June–3 July 2015. [Google Scholar]
- Bartoli, L.; Corradi, C.; Garzotto, F.; Valoriani, M. Exploring motion-based touchless games for autistic children’s learning. In Proceedings of the 12th International Conference on Interaction Design and Children, New York, NY, USA, 24–27 June 2013. [Google Scholar]
- Doenyas, C.; Şimdi, E.; Özcan, E.Ç.; Çataltepe, Z.; Birkan, B. Autism and tablet computers in Turkey: Teaching picture sequencing skills via a web-based iPad application. Int. J. Child-Comput. Interact. 2014, 2, 60–71. [Google Scholar] [CrossRef]
- Chang, Y.-J.; Chen, S.-F.; Huang, J.-D. A Kinect-based system for physical rehabilitation: A pilot study for young adults with motor disabilities. Res. Dev. Disabil. 2011, 32, 2566–2570. [Google Scholar] [CrossRef] [PubMed]
- Paas, F.; Sweller, J. An evolutionary upgrade of cognitive load theory: Using the human motor system and collaboration to support the learning of complex cognitive tasks. Educ. Psychol. Rev. 2012, 24, 27–45. [Google Scholar] [CrossRef]
- Lajevardi, N.; Narang, N.S.; Marcus, N.; Ayres, P. Can mimicking gestures facilitate learning from instructional animations and static graphics? Comput. Educ. 2017, 110, 64–76. [Google Scholar] [CrossRef]
- Conners, C.K.; Staff, M.H.S.; Connelly, V.; Campbell, S.; MacLean, M.; Barnes, J. Conners’ Continuous Performance Test II (CPT II v. 5); Multi-Health Syst Inc.: New York, NY, USA, 2000; Volume 29, pp. 175–196. [Google Scholar]
- Conners, C.K.; Sitarenios, G. Conners’ continuous performance test (CPT). In Encyclopedia of Clinical Neuropsychology; Springer: Berlin, Germany, 2011; pp. 681–683. [Google Scholar]
- Singleton, C.; Thomas, K.; Horne, J. Computer-based cognitive assessment and the development of reading. J. Res. Read. 2000, 23, 158–180. [Google Scholar] [CrossRef]
- Andrade, L.C.V.D.; Carvalho, L.A.V.; Lima, C.; Cruz, A.; Mattos, P.; Franco, C.; Soares, A.; Grieco, B. Supermarket Game: An Adaptive Intelligent Computer Game for Attention Deficit/Hyperactivity Disorder Diagnosis. In Proceedings of the 2006 Fifth Mexican International Conference on Artificial Intelligence, Mexico City, Mexico, 13–17 November 2006. [Google Scholar]
- Aristodemou, E.; Taraszow, T.; Laouris, Y.; Papadopoulos, T.; Makris, P. Prediction of reading performance using the MAPS (Mental Attributes Profiling System) multimodal interactive ICT application. In Proceedings of the 7th European Conference on e-Learning, Ayia Napa, Cyprus, 6–7 November 2008. [Google Scholar]
- Protopapas, A.; Skaloumbakas, C. Traditional and computer-based screening and diagnosis of reading disabilities in Greek. J. Learn. Disabil. 2007, 40, 15–36. [Google Scholar] [CrossRef] [PubMed]
- Rizzo, A.A.; Bowerly, T.; Shahabi, C.; Buckwalter, J.G.; Klimchuk, D.; Mitura, R. Diagnosing attention disorders in a virtual classroom. Computer 2004, 37, 87–89. [Google Scholar] [CrossRef]
- Read, J.C.; MacFarlane, S.; Casey, C. Endurability, engagement and expectations: Measuring children’s fun. In Interaction Design and Children; Shaker Publishing Eindhoven: Maastricht, The Netherlands, 2002. [Google Scholar]
- Read, J.C. Validating the Fun Toolkit: An instrument for measuring children’s opinions of technology. Cogn. Technol. Work 2008, 10, 119–128. [Google Scholar] [CrossRef]
- Read, J.C.; MacFarlane, S. Using the fun toolkit and other survey methods to gather opinions in child computer interaction. In Proceedings of the 2006 Conference on Interaction Design and Children, Tampere, Finland, 7–9 June 2006. [Google Scholar]
© 2019 by the authors. Licensee MDPI, Basel, Switzerland. This article is an open access article distributed under the terms and conditions of the Creative Commons Attribution (CC BY) license (http://creativecommons.org/licenses/by/4.0/).


