3.1. The Analytic Method
The data items subjected to analysis in the present paper are educational videos specifically selected to represent the three basic video lecture presentation styles defined by Chorianopoulos and Giannakos [
28]: (a) a “talking head and board” or “picture in picture” presentation with a visible instructor and accompanying presentation slides; (b) “slides and animation” voice-over presentation without the video feed of the instructor; and (c) a video capture of a “drawing board” with instructor voice-over (a presentation style made prominent by the Khan Academy). These videos were all selected to address the same broad topic, “statistical correlation”, to facilitate comparison across content, organization, and reception.
The analysis methodology we employed draws on our extensive experience with a broad range of quite varied media, stretching from technical documents to narrative film. A common problem faced by almost all researchers attempting to embark on the analysis of multimodally complex artifacts and performances is setting out clearly the particular kinds of material support that distinct media offer for meaning-making. These media “affordances” are important because they restrict the distinct kinds of presentational forms, or
semiotic modes [
27,
29], that may be mobilized and it is semiotic modes that determine precisely what should subsequently be annotated during data analysis. In [
7] (104–110), we identified several dimensions of description capturing essential material properties of media and which lead to different ranges of presentational forms, and consequently allow different kinds of communication strategies. These dimensions include: staticity/dynamicity (i.e., whether the material of the medium allows depictions unfolding in time), dimensionality (2D/3D), immersive-participatory/observational (i.e., whether the user of the medium is situated “within” the depiction or is external to that depiction), immutable/editable (i.e., whether the user of the medium can change depicted content), and permanent/transient (i.e., whether an inscribed depiction remains perceptually accessible or fades with time). A classification of this kind also helps separate out cases of media “embedding” more effectively, so that the individual contributions of the participating media are not conflated. This occurs in several of the videos we analyzed—for example, where a drawing board or a powerpoint presentation is displayed. The affordances of the embedded medium are different to those of the embedding medium (the video itself) and so support different sets of communication strategies.
Our analysis then proceeded in three steps. First, the essential material properties of the media employed were classified along the dimensions just given. Second, the distinct presentational forms, or semiotic modes, mobilized were identified so that the presentational forms occurring in the data can be appropriately annotated. Third, discourse hypotheses licensed by the semiotic modes at work were selected for specific correlational studies, thereby making it possible to triangulate the multimodal description against behavioral and other reception effects. A central claim of the approach is that this general method, proceeding from media affordances, via semiotic modes, to discourse functions, can apply uniformly across all kinds of multimodal communication, thereby offering a more robust foundation for transferring empirical results across distinct forms.
Concrete analysis for
time-based media of the kind at issue here (i.e., dynamic, 2D, observational, immutable and partially transient) proceeds by defining “annotation tracks”, or “tiers”, grouped according to semiotic modes. Each semiotic mode defines a set of materially-realized forms that may be identified and consequently tracked across a video. These forms are used to define “controlled vocabularies” that provide labeling schemes that an annotator applies to selected temporal intervals in any video being annotated. In the case of the work described here, these annotation tiers were defined as coding schemes within the ELAN video analysis tool developed by the Max Planck Institute for Psycholinguistics in Nijmegen [
30] (
https://tla.mpi.nl/tools/tla-tools/elan/). The use of this and similar tools for corpus-based multimodal work is described in detail in Bateman [
31]. As is usual within corpus-based discourse studies (e.g., [
32]), it is then possible to explore correlations between the coded categories and further categories characterizing discourse distinctions. This is also the methodology pursued here, extended to operate multimodally.
Examples of the presentational forms identified by the semiotic modes at work in the videos considered here include various forms of written representations, such as written language, graphs, tables, and mathematical formulae, as well as “second-order” visual resources for navigation such as circles, underlining, arrows, boxes and other segmentation and connection techniques. In addition, second-order multimodal
cohesive resources [
33], such as shared colors across related elements, similar or reoccurring forms or “phrasing”, and so on, are also commonly deployed and so are annotated similarly. Finally, if a video display includes a visual display of someone speaking, then all the resources associated with (mediated) face-to-face interaction are potentially relevant. If, however, only a voice-over is used, then the resources associated with non-face-to-face spoken language become relevant. Our analyses of the videos can therefore be seen to provide a fine-grained differentiation of expressive resources that, on the one hand, teases apart the diverse semiotic statuses of the presentational forms used, while, on the other hand, nevertheless remaining capable of revealing similarities when appropriate. Crucially, from the perspective of multimodality research, this highly complex media landscape is already considered the “normal case” and so it is possible to apply a broad range of existing analytic models (e.g., [
7]).
3.2. Applying the Methodology: Example Analyses
Data analysis for any video proceeds broadly in the manner just indicated, recording results as tracks within the multi-tier annotation system derived from the semiotic modes and their respective material distinctions. We illustrate the practical process of this annotation as follows, addressing the opening few minutes of the first video from our selected dataset. As described above, the video is first segmented according to the material distinctions recognized, placing segmentations within annotation tiers as required. The distinctions so characterized are considered as basic “behavioral units”, or presentational micro-events (PMEs). These are usually distinguishable bottom-up on the basis of the material distinctions they rely on and top-down on the basis of the ways of making meaningful forms given by the semiotic mode. Annotation is then always in terms of temporal extents ranging over specified subsegments of the analyzed video and is never frame-based; our use of single frames in the figures shown below are therefore solely for the purposes of illustration.
Conceptually, a PME is a perceptually-bounded unit of meaningful behavior that may be distributed across several coordinated sensory channels, but which need not necessarily be so distributed. For example, a cry of pain will be simultaneously expressed in both visual (gestural, body posture, and facial expression) and aural sensory channels, whereas a localization arrow or circle appearing (soundlessly) on a display as occurs in our videos will be purely visual. The granularity of a PME also depends on a recipient’s familiarity with that PME’s semiotic mode and the degree of automatization that holds. Thus, when watching someone writing text, the units will generally be larger and individual pen, pencil, chalk, etc. movements will no longer be differentiated; similarly, larger units hold for spoken language as well.
Turning concretely to our Video 1, the video begins visually with a blank (black) screen which immediately resolves itself to be a digital blackboard with a writing tool because a displayed simulated pen begins writing (white) text in the upper-left of the frame (
Figure 1a). The forms marked out by the pen are almost immediately recognizable as letters and so a semiotic mode of written language becomes relevant; this then provides top-down indications of the movements and material traces that need to be considered relevant. Annotation thus includes tiers for written language and one segment is begun as soon as the pen leaves a visible trace. Annotation is always temporally-based in this way and segments characterize individual units as defined by the semiotic mode: that is, for written language, words, clauses, sentences, lines of text, etc. Additional features available for annotation include typographical information, such as the color of the written text, size and so on.
Information of this kind means that recipients can already be predicted to have an approximate media-classification of what is being shown and an accompanying set of expectations about the relevant semiotic modes to apply. That further semiotic modes will be required beyond written text quickly becomes plausible when the pen presents discrete words and numbers that do not combine grammatically and draws a horizontal line beneath the textual elements and a vertical line separating the word “Student” from the numbers. These latter two PMEs, clearly manifested materially as distinct “strokes”, require their own interpretation as they are not motivated by standard written text typography. Thus viewers (and equally analysts) are invited to deduce (or, more accurately, to abductively hypothesize) that the more diagrammatic semiotic mode of “tables” might play a role. Under this hypothesis, the PMEs of written text already identified are made intelligible as the headers of the table. This interplay of bottom-up cues and top-down hypotheses is fundamental to how semiotic modes are seen to operate, both theoretically and in terms of perception. Transcription of this kind is thus of necessity an interpretation on the part of the analyst, albeit one that leads directly to empirical questions for its validation due to the close linking maintained with the material forms present in the data. Automatic recognition and segmentation of particular aspects of rich data of this kind is consequently also an active area of research (cf., e.g., [
34]).
The interpretative hypotheses annotated so far are then further strengthened by simultaneously occurring PMEs in the audio-track, where voice-over information accompanies the information visually-presented. Genre expectations that the sound-track and what is being shown will have something to do with one another are immediately confirmed by intermodal cohesive cross-references: for example, the voice-over talks of “four students” having taken a math exam and a statistic exam just as the pen writes “Students” (actually the German equivalent, as the original videos are all in German) followed by the digits 1, 2, 3 and 4 demarcated by whitespace. Following this, the voice-over states “this is the points that the students achieved in the maths exam; which we will label as ‘x”’, while the pen writes (in a different color) the word “Math points” and, separated by whitespace, an “x”—all written to the left of the vertical line drawn previously. Following completion of each written number, the pen moves to the appropriate place to begin writing the next number (
Figure 1b).
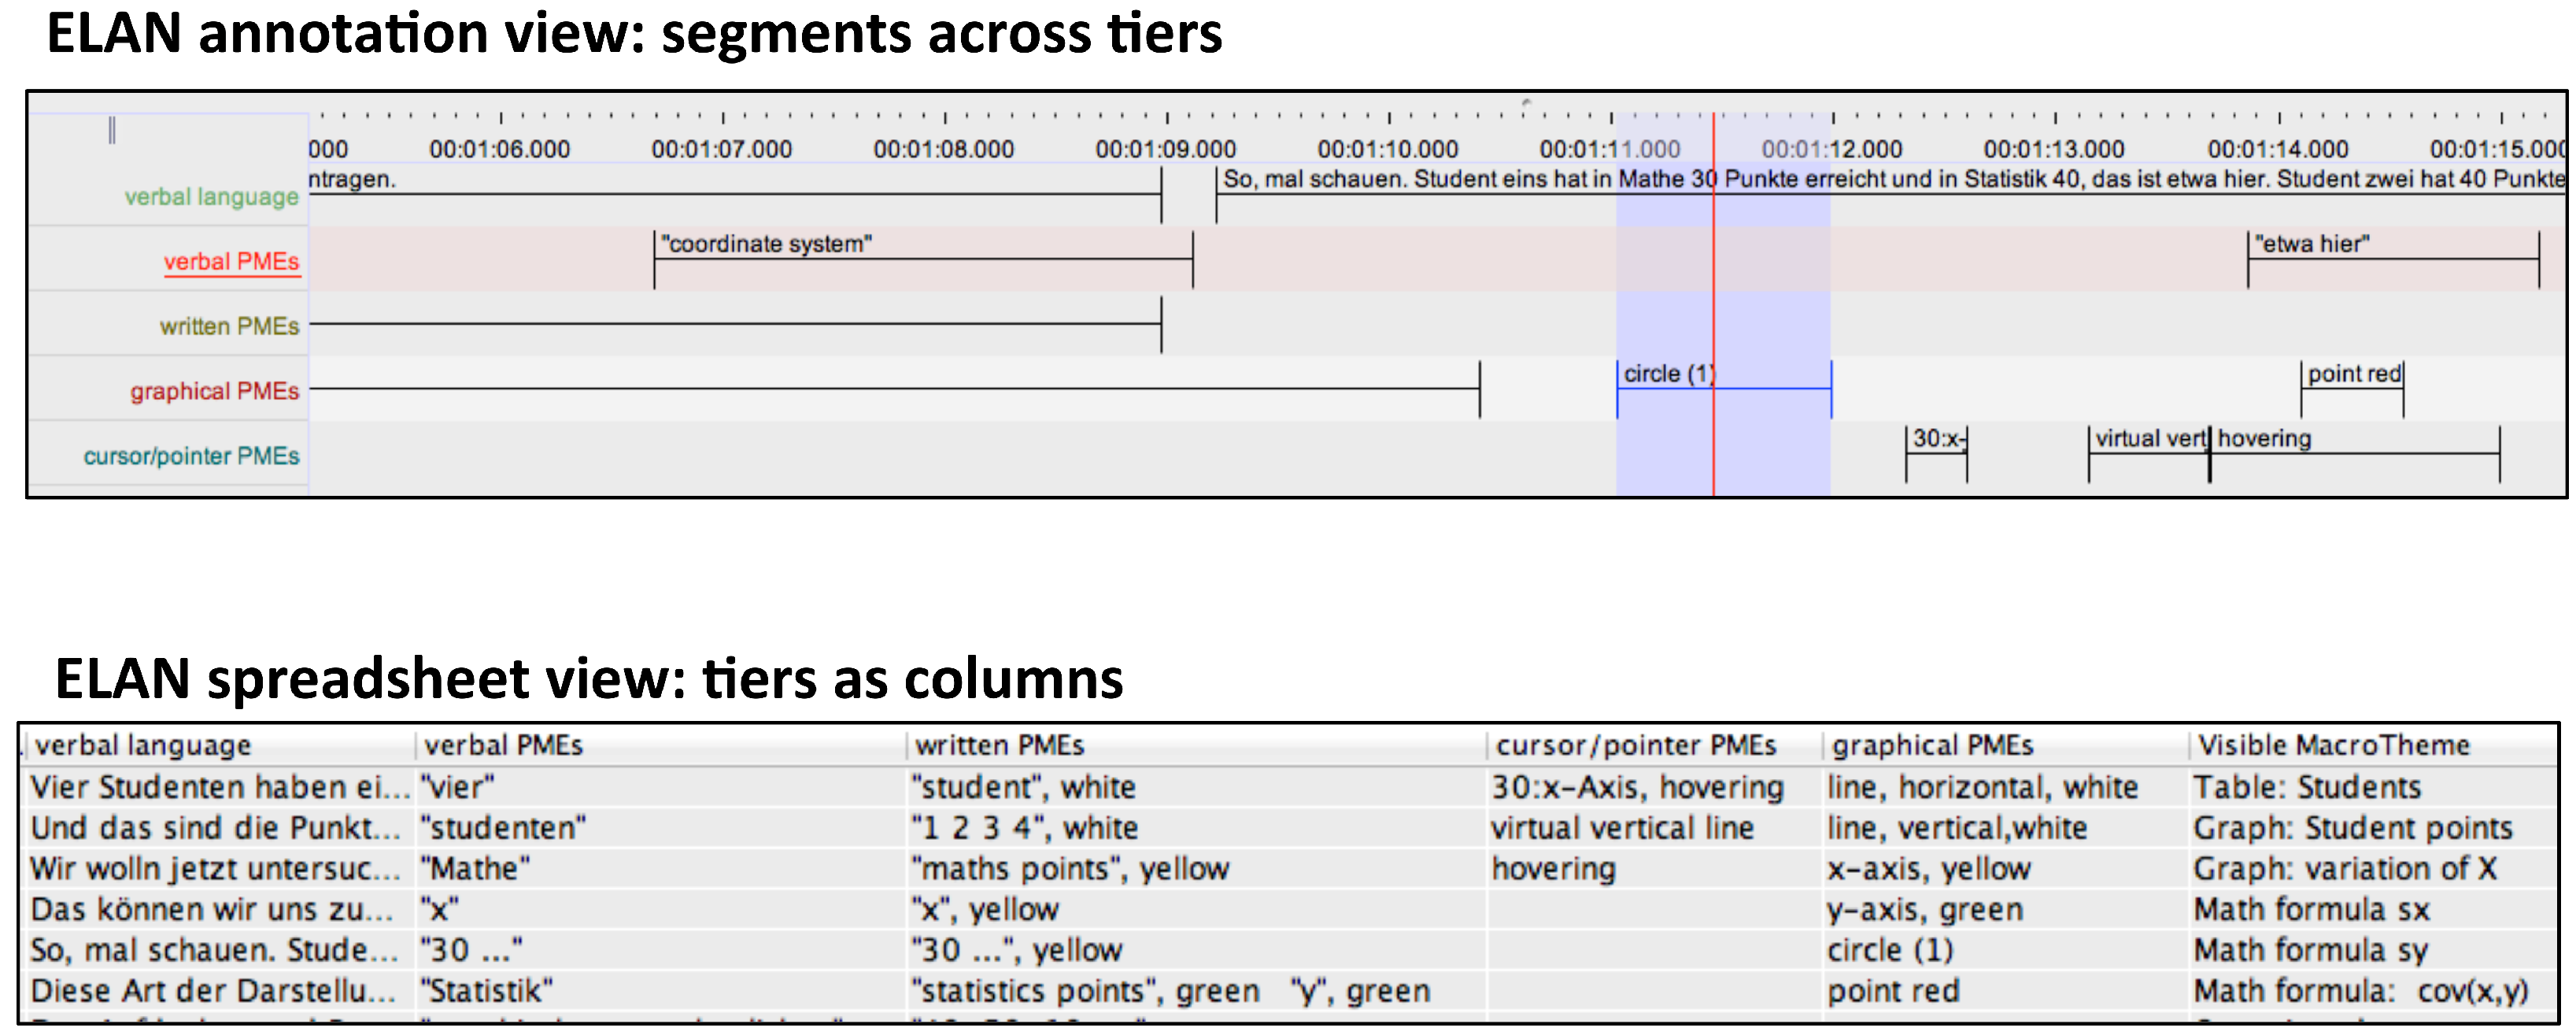
The result of annotation is then a set of tiers each containing labeled segments of the analyzed videos characterizing the identified PMEs. The ELAN tool provides several forms of access to such tiers as well as export facilities for further statistical processing. An extract of the annotation corresponding to what has been discussed so far is illustrated in
Figure 2, depicting two ELAN views on the annotated data. The tiers identified contain the verbally-expressed PMEs, the written language PMEs, graphical PMEs (lines, curves, points, etc.) and “cursor”/“pointer” PMEs, which are times when the cursor is used to direct attention to particular areas of the display. These segments are then used following the constraints given by their particular semiotic modes as evidence for the annotation of more abstract groupings. For example, the existence of a row of text PMEs in a spatial configuration with the two graphical PMEs of a vertical and a horizontal line motivates the adoption of a table as noted above. On this basis, a larger segment can be added into the annotation indicating the temporal interval over which that table is present. Similar steps are taken to identify the graph that later becomes visible in
Figure 1e,f. The presence of these units at higher “levels” of annotation can be seen in the final column shown in the spreadsheet view of
Figure 2, headed “Visible MacroTheme”; we return to the use of this information below.
Within the general account of multimodality adopted here, therefore, PMEs located within any objects of analysis are always seen as potential cues that license further discourse hypotheses. The specific discourse hypotheses possible are defined by the semiotic modes that apply. Consequently, semiotic modes “claim responsibility” for combinations of PMEs and, in so doing, offer semantic and discoursal interpretations that recipients must evaluate for their contributions to discourse coherence overall [
24]. The potential ambiguity here between the activities of recipients and the activities of
analysts is quite deliberate: an analysis is evaluated precisely by its correspondence with the interpretative processes that it claims to hold for recipients. That is, when the analytic methodology leads to statements that recipients “must evaluate” particular discourse hypotheses, we are simultaneously asserting that there should be measurable empirical evidence for this evaluation. Within multimodality research such evidence is pursued with a variety of techniques, ranging from questionnaires and corpus-based distributional methods, to physiological measures such as eye-tracking and brain studies (cf., [
7], 139–168). For the purposes of the current paper, we focus below on correlations between particularly selected discourse statuses and a variety of reception measures obtained with respect to the videos analyzed.
The analysis of the voice-over during the first seconds of Video 1 consequently indicates that several discourse entities are introduced. These include the students, the fact that they have written two exams, and that those exams each had 50 points (cf. the verbal PMEs displayed in
Figure 2). The visual elements on display by this stage are also no doubt sufficient (although this could naturally be subjected to empirical validation whenever necessary) for the video’s intended recipients to mobilize the semiotic mode of tables made up of columns and rows, rather than written language alone. The observed distribution of visual PMEs is thereby considered “explained” (both for the analyst and for the recipients) because the semiotic mode of tables can plausibly claim responsibility for the spatial organization present and assign that organization meaning, increasing overall discourse coherence [
24,
35].
Analysis and segmentation continue in the manner just described for the rest of Video 1 and for the other videos as well. In the particular case of Video 1, the voice-over and the pen go on to introduce the scores for the statistics exam. That this information will indeed be presented (and is consequently expected, or “predicted”) is motivated both verbally and visually. Verbally, the spoken language establishes right at the outset of the video the topic—or
macro-theme as we describe it below ([
36], 437–443)—that there will be four students and two exams. Visually, the interpretation of visual PMEs as a table with rows and columns predicts that the cells of that table will be filled. Both sources of evidence thus make it highly likely that information about the scores in the mathematics exam will be followed by scores for the statistics exam. Again, similar to the case for the mathematics scores, the label “y” is then assigned both verbally and visually to the statistic exam scores (
Figure 1c). Finally, the distinction between the two sets of scores is explicitly indicated by color cohesion and contrast (mathematics scores in yellow and statistics scores in green), a communicative strategy that is maintained throughout the rest of the video. Such “textual” properties of the presented PMEs are also recorded in the full annotation.
Up until this point in the first video, therefore, the verbal and visual information has been maintained as highly congruent. This should not be considered in any way redundant, however, since it would be unlikely that recipients exposed only to the audio-track would be in a position to retrieve the individual scores. The table therefore functions as an externalized cognitive aid (e.g., [
37]) affording not only renewed and repeated access but comparisons and groupings; Hurst [
38] argued this to be the main motivation for the historical evolution of tables as a representational device at all. This is also, as we show below, our primary motivation for considering larger visual units of this kind as predictive macro-themes.
The spoken language in Video 1 then makes a shift to a new discourse segment by pausing and beginning a new intonation unit with “Now we want to investigate whether the scores in the maths exam stand in any kind of relation to the scores in the statistics exam”. The remaining screenshots in
Figure 1 show the subsequent development where the drawn table is progressively related to a graphical representation supporting discussion of correlation, the main topic of the video as a whole. The fact that there are indeed distinct semiotic modes in play here is also brought out clearly by virtue of the different “semiotic work” that the various PMEs are performing. For example, the horizontal and vertical lines in the table have a very different function to the horizontal and vertical lines in the graph (
Figure 1d,e). The numbers in the table also have a very different function to the numbers marking the tick marks along the graph’s axes (
Figure 1e,f). This is one of the principal reasons that broad divisions between, for example, “text” and “image” are insufficient: it is in general beneficial to relate PMEs to their “semiotic function” within particular semiotic modes directly. Relations across these representations have nevertheless been clearly expressed in the video and remain explicitly represented in the visual display by means of the color coordination and the
discourse history of their introduction, whereby PMEs are bound together both in terms of content and temporal synchronization in their presentation.
The annotation of all the videos we have selected and, indeed, of any video material, proceeds in precisely the same manner: first identifying PMEs across several tiers, and subsequently using these, media knowledge, and genre to postulate semiotic modes that are capable of grouping the PMEs into larger configurations. All of these are captured as labeled annotation segments of the kind illustrated in
Figure 2. Particular semiotic modes of page design [
39] and mathematical formalism [
40] also play major roles in all three videos and are treated similarly to the construction of tables shown above. This has the consequence that is it is relatively straightforward to
compare the effectiveness of very different kinds of artifacts, such as the three videos we analyze in this paper.
The extent of the variation in these videos is suggested by the illustrative frames from Videos 2 and 3 reproduced in
Figure 3. As explained above, the videos were deliberately selected for their diverging designs despite their similar genres and content matters. Descriptions or analyses that remain too invested in surface details will necessarily find it difficult to contrast such different designs usefully with respect to reasons for their respective effectiveness. In our case, however, they nevertheless remain comparable precisely because their respective PMEs are used to motivate discourse level annotations, as we now explain and illustrate.
3.3. Leveraging off Discourse Descriptions
Fine-grained multitrack analysis of the kind described above makes available considerable detail for subsequent investigation. The audiovisually present PMEs, including those generated by movement, spatial layout and so on, are treated as the surface expressions of developing discourse structures within each video. Discourse as such is modeled within this framework as a dynamically growing discourse structure of the kind formalized by Asher and Lascarides [
41] and extended for multimodal descriptions in Bateman and Wildfeuer [
24]. This has the important corollary that discourse expectations are made explicit, which in turn supports the formulation of testable hypotheses for recipient studies.
Discourse units and their supporting structures are also considered parts of the overall transcription carried out for the data and so are recorded as integral components of the complete analysis as explained above. Several discourse statuses can be usefully distinguished. For current purposes, we characterize each PME as assuming one of two discourse functions reflecting whether the discourse entity being picked out is new to the discourse structure or is a reference back to an element that has already been introduced. This relatively simple division draws on the well-known linguistic pragmatic categories of “given” and “new” but are extended here to operate regardless of the semiotic mode within which the introduction or reference takes place. Since discourse entities are assumed to constitute the main anchoring points for providing new information, developing these coherently across a discourse is hypothesized below to play a major role for achieving effective reception.
Presenting new information can also be performed for two broad discourse purposes: either that new information may develop the content being communicated in the video directly or it may serve more as a “map”, or guide, for content that is to come. The former discourse function will be labeled here as development and can generally be recognized by virtue of its providing additional content information that elaborates or extends what has been introduced previously. The latter discourse function, labeled here as content scaffolding, is precisely the role taken up by what we introduce above as macro-theme. Macro-themes construct frameworks for interpretation for what is to follow and so are also hypothesized here to be likely indicators of variations in recipient effects.
Verbal macro-themes have been addressed in detail in several linguistic frameworks [
36], where they are also known as topic paragraphs, questions-under-discussion, and so on. The generalized discourse function of scaffolding has, however, received relatively little attention in multimodal contexts. Although there are many ways in which scaffolding can be achieved multimodally, all must operate in essentially the same manner to serve their discourse function. In short, the visual information produced needs to be presented so that it can be interpreted as an
externalized diagrammatic representation of the upcoming discourse structure. Potential “visual macro-themes” consequently include tables with empty cells, tree structures with nodes to be filled in, mathematical formulas whose parts need to be explained or whose variables have to be replaced with values, as well as straightforward lists of overview bullet points of the discussion to come. It is likely that the effectiveness of any such visual scaffolds will depend on the quality and type of information that is given; minimally the diagrammatic representation should predict topics that will be taken up. Our annotation tiers thus include macro-themes as potential labels for discourse level functions as shown in
Figure 2.
Content (i.e., video segments developing content) can also be coded according to whether that content is presented with a supporting visual macro-theme co-present or absent. In the former case, both the visual macro-theme and the information being added to the theme’s scaffold are perceptually accessible; in the latter case, other visual material has replaced the visual macro-theme and so recipients must maintain the connection without perceptual support. These statuses can be extracted straightforwardly from the multi-tier annotations. Each macro-theme annotated is identified by a segment in a corresponding tier. Discourse entities that refer back to the macro-theme may then either be visually present within that segment or disjoint with that segment. In the former case, the macro-theme is co-present; in the latter, it is not. In our annotation, segments of the videos that are performing neither function are left unmarked.
In terms of traditional functional discourse annotations, scaffolding contributions are then PMEs that are “forward-looking”, whereas PMEs performing development work are “backward-looking” (cf. [
42], 57–59). Since, in the former, scaffolding, case, direct externalized diagrammatic support for discourse interpretation is offered, below, we empirically investigate the hypothesis that this is one condition that may impact on a video’s effectiveness. When macro-themes are not co-present, interpretation must operate instead via the mental model formed by recipients of the depicted topic structure because the actual diagram is no longer perceptually accessible. We predict that the resulting increase in cognitive load will have reception effects. In both cases, moreover, visual macro-themes can either be presented “all at once”, for example when a presentation slide is shown (Video 3), or themselves be developed progressively, as when the table concerning students and their exam scores was gradually drawn on the presentation device shown in Video 1. We subject these variations to specific empirical investigation below in order to see whether reception effects correlating with distributions of scaffolding and presenting video segments can be isolated.
As an example of this final level of discourse annotation considered in this paper, above, the video segment from Video 1 in
Figure 1 shows two visual macro-themes being developed: one layout unit containing the table of exam results, the other showing the graph. These annotations are present in the final column of the spreadsheet representation in
Figure 2. The PMEs contributing to the identification of the first layout unit as a table—that is, the first row and the horizontal and vertical lines—are consequently annotated in an additional discourse function tier with the label “scaffolding”; the remaining PMEs before the transition to discussion of the graph are annotated additionally as “developing”. This offers a generalization across the individual kinds of segments labeled in the annotation, which we can subsequently draw on to derive overviews of the discourse development followed in each video analyzed. Similarly, the PMEs setting up the axes and labels for the lower graph visible in the figure receive the classification “scaffolding”, while the actual entry of points in the graph on the basis of the figures in the table are “developing”. The point of transition from scaffolding to developing is determined by considering when recipients have enough information to predict the kind of discourse activity that is to follow: for example, filling in the cells of a table, or placing points on a graph.
3.4. Deriving Empirical Research Hypotheses from Multimodal Descriptions
These annotated discourse functions will now form a central component in our exploratory investigation of our three selected videos below. Our segmentation of the three videos along the tiers we have motivated provides the basis for comparable descriptions. The time intervals over which individual visual macro-themes are perceptually present nevertheless vary according to the designs adopted within the individual videos. A clear case of the “co-present” vs. “non-present” distinction at work can, for example, be seen in Video 3 (cf.
Figure 3), where the extent over which a visual macro-theme is visible generally falls together with the presentation of individual slides that the speaker is discussing at any point in the video. Audiences typically orient to what is shown on each slide as a visual scaffold for what is being said (e.g., [
43]) and so treating slides as visual macro-themes is well motivated. For Video 2, where there are Prezi-like transitions across slides, the situation is similar: the visual extents of visual macro-themes are the video segments depicting individual frames before panning to the next. The situation for the superficially simpler Video 1 is then actually more complex, as there is only one visual presentation throughout the entire video: that is, the blackboard, which is gradually filled. Here the extent for visual macro-themes was taken following the criteria for layout unit identification set out in Bateman [
39] for static documents extended to include their temporal development.
A layout unit is a spatially or spatiotemporally segmented region that is drawn, written or discussed verbally for a corresponding temporal segment of the video. This decision will need to be refined further because discussion and accompanying visual gestures are not necessarily restricted to lie within single layout units; we do not address this further for the current discussion, however. In addition, because in all three videos multiple input “channels” are being expanded simultaneously, it is quite possible for the predicted development of a visual macro-theme to continue verbally while at the same time a new visual macro-theme is being drawn visually: this occurs in Video 1. Further studies of this situation would be beneficial as this might also be expected to lead to higher processing costs. The annotation scheme as described so far already captures such complex configurations, however, because the PME-tiers adopted are independent of one another, in principle supporting closer examination of any combinations required.
The view on the functioning of multimodal messages suggested by this framework is in many respects a logical extension to Mayer’s contention that:
“…the cognitive theory of multimedia learning is based on the idea that learning is an active process in which the learner tries to make sense of the presented material. This sense-making effort is supported when corresponding words and pictures can be mentally integrated in the learner’s working memory”.
The issue is then what presentational strategies assist learners in pursuing the connections that they need to build to combine the information they are being given. This demands in turn a more detailed understanding on the part of producers and analysts of how multimodal messages operate: simply placing elements in proximity to one another is no guarantee that those elements will be combined or even that they should be.
Within multimedia learning research, explicitly placing markers of intended cross-modal connection is known as “signaling” [
44]. This is generally assumed to be additional to the primary “content” being communicated and can be achieved, for example, by explicit deictic verbal reference to accompanying visual material, by shared color-coding conventions, and similar generally “cohesive” techniques. Within the approach adopted here and illustrated in this section, discourse guidance of this kind is considered inherent to the workings of semiotic modes. Semiotic mode descriptions consequently claim that signaling is a constant and necessary feature of all multimodal communication: it cannot be “turned off”. This has the important corollary that materials that might traditionally be assumed not to be using signaling are instead often best seen as employing
inappropriate signaling, which can then only be compensated for by increased cognitive load. In our concluding discussions below, we return to the somewhat mixed results achieved to date with respect to signaling (Richter et al. [
45] performed a comprehensive meta-analysis) in terms of the multimodal perspective we introduce here.
The position of the present multimodal approach is, therefore, that different modes offer explicit cues concerning how any material deployed is to be integrated in the service of the discourse goals being pursued and that these cues are an intrinsic component of discourse organization. This discourse-oriented starting point organizes both our analyses and the hypotheses derived for investigation. Specifically, we investigate empirically in the following section how the three selected videos manage their presentation and development of discourse entities via the presence or non-presence of audiovisual macro-themes. Our particular hypothesis for the present paper is that the effectiveness of the videos should correlate with the patterns of discourse presentations identified in our multimodal annotations. Precisely how viewers of the videos respond to and understand the information presented is thereby established as a well-defined empirical issue.
To conclude, discourse is being assumed to offer ways of managing cognitive loads more effectively, giving rise to interpretative hypotheses on the part of recipients that selectively drive attention allocation. Returning to the notion of “proximity” drawn on by Mayer above, we can see that “proximity” (spatial, temporal and induced by signaling cues) is often a resource employed by semiotic modes for constructing larger communicative units and so results supporting the value of proximity can be predicted to hold—but only in the case that proximity aligns with discourse organization. Proximity that is not functionally motivated by discourse concerns should lead to recipients pursuing unintended interpretative hypotheses and so detract from the effectiveness of any combined message. By these means, we seek to secure a tighter hold on the boundary conditions within which communicative strategies may be expected to yield beneficial results, as we now pursue in more detail by means of our empirical study.


