1. Introduction
Understanding how users interact with information visualizations is, on the one hand, of theoretical interest. Researchers always wanted to know why and how human users achieve their goals. On the other hand, it is also relevant for empirical research and for the design of visualization systems. The identification of successful strategies for solving tasks enables designers to design systems to support these strategies. Therefore, Pike et al. [
1] argue that a science of interaction is necessary. They think that in this context the identification of sequences of interaction steps is an essential element, and that these steps should be mapped to cognitive events. There is a certain amount of research on how to design visualizations supporting human sense-making processes, but research that focuses specifically on sequences of interaction and on sense-making as a process is quite scarce. We think that such research could be valuable to inform the design of information visualizations, apart from being of theoretical interest.
In this paper, we provide an overview of research addressing these issues. There is, on the one hand, research in the area of cognitive psychology, especially in the area of thinking, reasoning and problem solving that is relevant for this topic. We would like to emphasize that interacting with information visualizations is an open and exploratory process, taking place in realistic environments. Information visualizations often represent information from ill-structured domains, e.g., medicine, intelligence analysis or analysis of social media data. These are domains where there are no readily available answers and the application of clear-cut rules for solving problems is difficult [
2]. In ill-structured domains, it is often difficult to define the problem. Information from many different and heterogeneous sources is necessary. It is often not clear when a solution is reached, and people involved in such domains often strive for a “good enough” solution instead of the best solution (often because of time constraints). Therefore, the application of formal rules (e.g., rules of formal logic) for problem solving and sense-making with information visualizations is usually difficult and does not reflect what users really do. Other approaches are necessary. Newell and Simon [
3] have proposed the term heuristic to describe problem-solving strategies that can be applied in different contexts and result in “good enough” solutions. Gigerenzer [
4] has adopted this approach and proposes that much of everyday thinking and problem solving is using such heuristics. He argues that these heuristics are often very successful. It is plausible to assume that such heuristics are also applied when interacting with information visualizations.
Another strand of research is the investigation of cognitive strategies. Especially in the area of arithmetic, strategies that problem solvers use have been investigated extensively. Heuristics and strategies are concepts that reflect the fact that people solving problems engage in this process for longer periods of time and adopt step-by-step methods to reach their goals.
Another approach that can also be valuable for the evaluation of information visualization can be found, for example, in the area of graph comprehension [
5]. This kind of research clarifies how people interpret graphs. In this context, the adoption of certain strategies is also reflected.
Another line of research that might be relevant in this context is research on everyday thinking and reasoning. Laboratory studies have often been criticized because of their lack of ecological validity. Everyday thinking and reasoning studies how people solve problems in their everyday lives. It emphasizes that people are very flexible in their methods and use different methods adapted to the task and the situation instead of one formal method.
In addition, there is research in the area of sense-making. This research topic has been discussed widely in the information visualization community. There is some consensus in the community that sense-making is a concept that is well able to describe interaction processes with visualizations. Nevertheless, there is still no generally accepted model of how sense-making with visualizations works. All these theoretical approaches are able to inform research trying to clarify the issue of sense-making strategies used for interpreting information from information visualization.
It is an open question whether sense-making strategies used for deriving insights from information visualizations are domain-dependent or -independent. It is a plausible assumption that there are some domain-dependent and some domain-independent strategies. In the area of thinking and reasoning, there is extensive research in investigating specific approaches in various domains, e.g., in medicine, in law or in science [
6].
Our goal is to show that the research conducted in these areas can inform the research on sense-making processes with information visualizations. In the discussion section, we will provide a list of relevant issues that are discussed in cognitive psychology and how they could be investigated in information visualization. We will also present two case studies that yield first results concerning these issues. In this way, we want to show that it is possible to bridge the gap between more basic research in cognitive psychology and applied research in information visualization.
The structure of the paper is as follows. First we provide an extensive overview of literature in the fields that are relevant for the investigation of sense-making with visualizations. Then we present two examples of empirical investigations that were conducted at our institute. These investigations aimed at clarifying sense-making strategies of users of information visualizations. These investigations have already been published and only serve as illustrations of the relevance of the theories described in the first part. In the discussion section we try to show the importance of the theoretical approaches described in this paper for empirical research and for developing an outline of a model for sense-making processes. We also describe a few principles derived from the theories and the empirical research that can guide future research on this topic.
3. Sense-making and Insight Generation
It has often been pointed out that deriving knowledge from information visualization systems is, in general, an open-ended and exploratory process. To model this process appropriately, the sense-making approach has been adopted. Sense-making has been defined as “a natural kind of human activity in which large amounts of information about a situation or topic are collected and deliberated upon to form an understanding that becomes the basis for problem solving and actions.” [
20] (p. 1) The goal of this process of sense-making is the generation of insight.
Pirolli and Card [
21] developed a very influential model of sense-making—the sense-making loop. It should be pointed out, however, that this system has scarcely been used to evaluate information visualization systems, probably due to the fact that the model is fairly restrictive and only represents very specific kinds of activity sequences. The model also only represents more abstract activities, which makes it difficult to test it empirically [
22].
Klein et al. [
23,
24] developed a different and more flexible approach (the data/frame model), which is based on the perspective of natural decision-making (NDM). The main focus of NDM is to analyze decision making by domain experts in complex situations. Klein et al. also discuss some common myths about sense-making which have no empirical foundation (e.g., the myth that more information leads to better sense-making, or the myth that cognitive biases are inescapable). They argue that there is no empirical foundation for these myths. The goal of Klein et al. [
23,
24] is to model sense-making activities in naturalistic settings. They assume that people develop schematic representations of the phenomena they encounter in their lives called frames. These frames can be elaborated, questioned or rejected. This model was extended by Klein et al. [
25]. Based on the previous work, Klein [
26] conducted a study to identify processes that enable people to gain insights in naturalistic settings (e.g., in scientific research). He identified five such processes: making connections, finding coincidences, emerging curiosities, spotting contradictions, and being in a state of creative desperation. These processes are not strategies in a narrow sense, but the identification of such processes can help to analyze reasoning strategies users engage in when they interact with visualizations.
Blandford et al. [
27] point out that most information visualization systems support foraging for information very well, but lack support for the sense-making stage. They argue that every domain has its own conceptual structure that should be supported by appropriate visualizations.
Insight generation as the result of sense-making processes has been widely discussed in the information visualization community (see e.g., [
28]). Nevertheless, it has become obvious that insight is a concept that is difficult to define and to measure. To clarify these issues, Chang et al. [
29] discuss the differences between the concept of insight as defined by the cognitive sciences and insight as it is used in the information visualization community. They argue that insight in cognitive sciences is seen as a process that leads to a sudden aha-moment, whereas in information visualization insight is the product of a knowledge building process. This knowledge building process is similar to the problem-solving heuristics or strategies discussed above, whereas the aha-moment is based on processes that are difficult to observe and investigate because they happen spontaneously and (seemingly) without systematic exploration or hypothesis testing. Nevertheless, researchers from the tradition of Gestalt psychology have argued recently that aha moments are often based on long-term iterative reasoning processes [
30]. The difference is that these processes are often not that obvious and less systematic than the more explicit problem-solving heuristics and strategies.
There have been several attempts in the past to identify strategies users adopt when interacting with visualizations. There has been some research in the area of reasoning provenance (see e.g., [
31,
32]). In this kind of research, reasoning processes of one analyst are reconstructed to assist another analyst. Interactions of analysts are recorded, processed and then provided in an aggregated form for inspection to other analysts. There is some relationship with the investigation of interaction strategies, but the main goal of provenance research is different.
One early example for research into interaction strategies is Pohl et al. [
33]. Based on this work a more recent investigation has been published in Pohl et al. [
33]. In this work, sequences of interactions [
34] are studied to get a more comprehensive picture of how users interact with visualizations. The results of these studies will be discussed in more detail later on. Another example is Reda et al. [
35]. They distinguish between outcome and process and argue that the emphasis of evaluations in information visualization so far has been on the analysis of outcomes, not on the process. They argue that the investigation of the process of visual exploration is an important aspect that could clarify sense-making. They used log files and thinking aloud to identify micro-patterns of activities. They distinguish between the categories of observation, building hypotheses and defining goals. They used this technique to find out which differences exist between interactions with small and large screens.
Sedig et al. [
36] investigated complementary interactions with complex 4D visualizations. They define complementary interactions as interactions that occur together in order to improve the users’ performance. There is some similarity with the investigation of interaction sequences, although the interaction sequences investigated by Pohl et al. [
33] are not necessarily complementary. It could be argued, however, that if these sequences are supposed to assist the users to get results they should somehow complement each other. Sedig et al. [
37] also developed a model for the analysis of complex cognitive activities. This is based on their work in Parsons and Sedig [
36]. The concept of complex activities seems to be essential for sense-making processes because sense-making will in general be based on such processes. They distinguish between cognitive activities, tasks (both of which are domain specific), interactions (e.g., filter, zoom, …) and events (which can be recorded by log files).
Wong [
38] describes the work of intelligence analysts as sense-making processes. It should be pointed out that intelligence analysts often work with visualizations (e.g., node-link diagrams to show relationships between offenders). Wong points out that this work is an iterative process of moving from uncertainty to certainty. In this context, analysts use various strategies, e.g., deduction, induction and abduction, depending on what data they have. They also use storytelling strategies to explain their reasoning and re-construct the situation they have to analyze. They start from a very tentative hypothesis and then search for necessary data to support this. If this is not found the hypothesis is rejected. Wong uses the Data/Frame model [
25] to explain this process.
Kodagoda et al. [
39] also investigated sense-making strategies. They did this in the context of an investigation to use machine learning to infer reasoning provenance from user interaction log data. Their research is also based on Data/Frame model [
25]. They used an adapted coding scheme to classify the users’ activities. This coding scheme also represents users’ strategies how to make sense of the data they encounter. Users can, for example, question a frame or elaborate a frame. These represent different strategies. A very important aspect in this context is how to relate the users’ activities as they appear in the log files to their associated reasoning processes. The distributed cognition approach [
40] assumes that there is a tight relationship between the users’ activity and their thought processes. Distributed cognition has been suggested by several authors as an appropriate basis for modeling reasoning processes of analysts using visualizations [
5]. The problem of relating log file data and reasoning data rather is that the one is low-level (on the level of mouse clicks and cursor movements) and the other is higher level and often domain-dependent.
4. Everyday Reasoning
There is a controversial discussion as to whether everyday thinking and reasoning are fundamentally different from formal reasoning. Everyday reasoning is defined as the method how people solve practical problems in their real lives [
41]. Garnham and Oakhill [
41] point out that problems in everyday lives are usually not well defined and, therefore, not solvable by formal methods. As a consequence, it has been questioned whether results from laboratory studies testing the application of formal methods are valid for everyday thinking and reasoning.
Woll [
10] also discusses the difference between formal reasoning vs. practical, everyday reasoning. He argues that problem solving in everyday lives is influenced by one’s background knowledge, a fact that is not reflected in laboratory studies, which tend to exclude background knowledge as a confounding variable. Everyday thinking and reasoning is characterized by personal relevance and is context-specific. Much of the knowledge involved is tacit knowledge.
Scribner [
42] provides an overview of her research in everyday thinking and reasoning. She conducted research in several areas (e.g., dairy workers, assembly workers). One of her main results is that problem solving in everyday contexts is highly flexible, in contrast to formal reasoning. In formal reasoning, problems belonging to the same logical class will be solved by similar procedures. In real life this is not the case. People adapt their methods flexibly to the situation, showing a large amount of creativity in this process. Her main research area was mathematical reasoning. She found out that mathematical procedures learned in the classroom were often not used to solve problems. She also emphasizes that the workers she studied use the environment as an external cognitive tool to support their reasoning processes. Woll [
10] points out that Scribner’s research is very interesting. Nevertheless, he argues that it is not rigorous and based on very small samples. In addition, the processes she studied are routine processes, whereas the problems studied by problem solving research are challenging and unknown.
Another well-known researcher working in this area is Jean Lave [
43]. She investigated the use of arithmetic in grocery stores. One of her main result was that buyers are very adept at using arithmetic, but the procedures they use do not resemble the kind of mathematics commonly taught in schools. She also could not find any relation between achievements at school and the ability to use arithmetic in buying processes. Shoppers could solve the vast majority of tasks in grocery stores, but were in general not very good in school mathematics.
Research on everyday thinking and reasoning has been criticized because of the lack of methodological rigor and representativeness. Unluckily, there is always a trade-off between scientific rigor and ecological validity. It should be mentioned, however, that by now there is a considerable amount of research in that area which is quite coherent in its results. Researchers especially emphasize the difference between formal reasoning and everyday reasoning and the domain specificity of everyday reasoning processes [
10].
5. Empirical Research
5.1. Motivation
In this section, we want to present two different case studies to provide examples for research concerning the usage of strategies or heuristics of users of information visualizations. There are different approaches to do this. On the one hand, investigations can focus on the interaction processes themselves as they can be observed either by direct observation or log file analysis. On the other hand, there are approaches that emphasize the reasoning processes going on inside the users’ heads. Such investigations typically use thinking aloud as a methodology. We have chosen one study using the log file approach and another study using the thinking aloud approach because they reflect different ways of modeling such sense-making processes. We also want to point out that in both cases we could identify sense-making strategies. Although these are only exploratory studies, we think that both studies indicate that these are viable possibilities of investigating sense-making strategies. We want to point out, however, that it is still not clear how these two processes (interactions on the screen and reasoning processes in the head) are related to each other. In the discussion, we will present several topics derived from the literature study that we think should be investigated in this context. Wherever possible, we briefly describe results from our research. Based on this, we argue that the application of results from basic research in cognitive psychology is possible in information visualization. The ultimate goal of the application of this kind of research is to improve the design of visualizations and adapt them to the users’ needs.
5.2. Methodological Issues
Investigating strategies of users of information visualizations requires specific methodologies. Not every evaluation methodology is appropriate for this kind of investigation. The methodologies have to reflect the actual sequences of activities the users engage in. Research methods looking retrospectively on the interaction processes, as e.g., interviews or questionnaires, are less appropriate for this kind of analysis. There are, however, research methodologies that enable the researcher to watch the characteristic aspects of the interaction processes in a step-by-step manner while the users work with a visualization [
44,
45]. Examples for such methodologies are log files, observation, eye tracking and thinking aloud. Thinking aloud (Ericsson & Simon [
46]) was developed to get insights into the thought processes of the users while they solve problems. Therefore, the results from thinking aloud analysis are able to clarify the question why users chose certain sequences of activities.
An important aspect in the context of these methodologies is how to interpret the data that is being recorded. It is necessary to develop an appropriate coding or categorization scheme for this [
47,
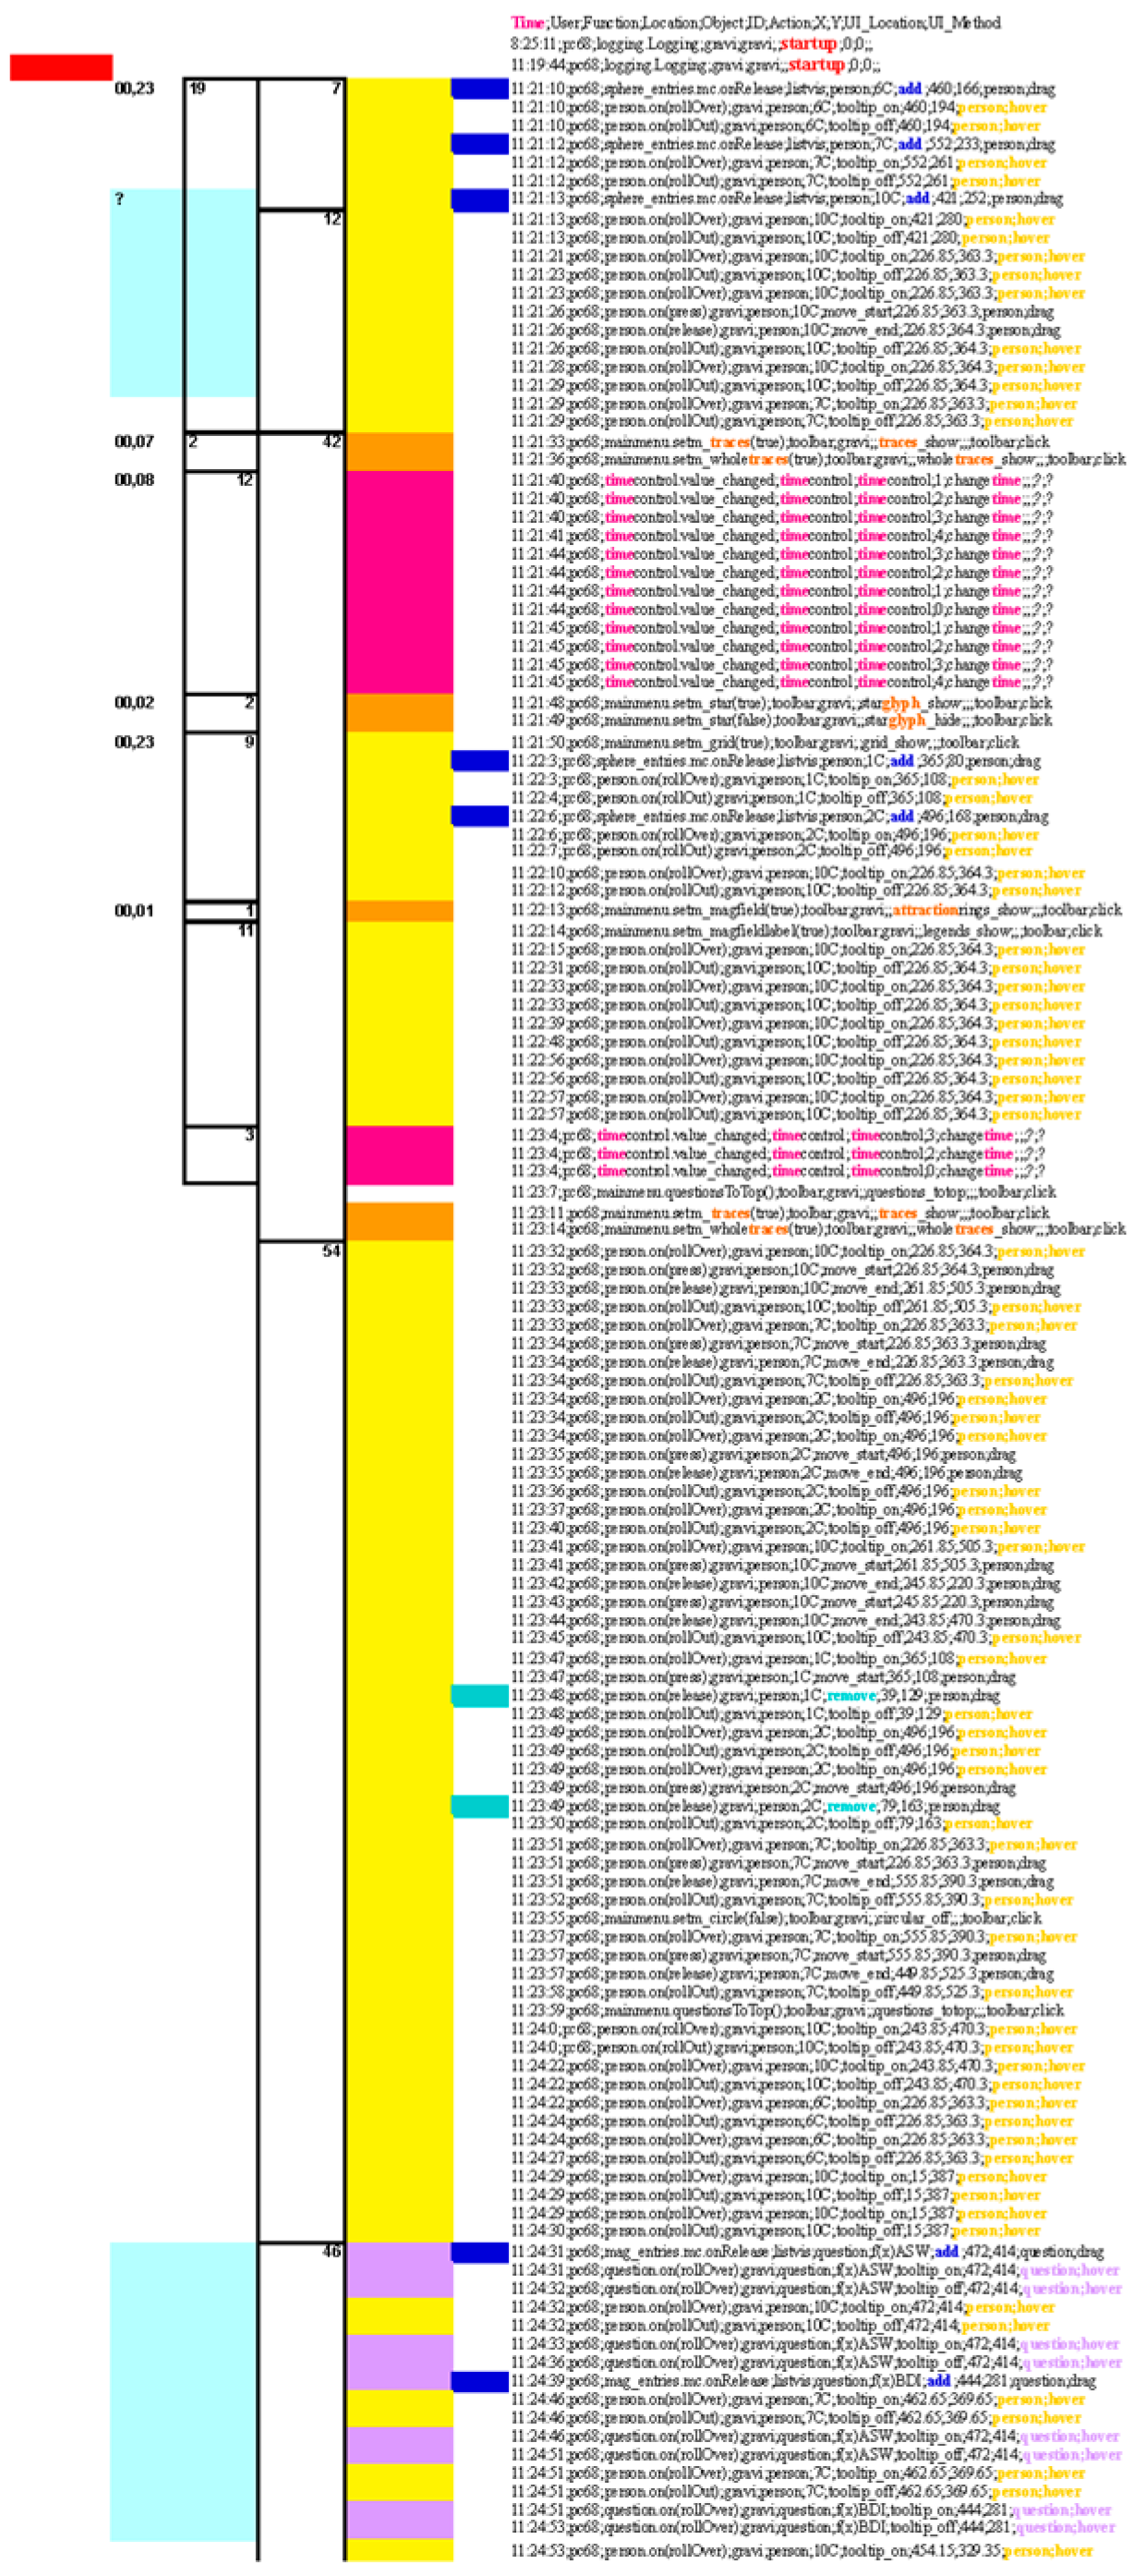
48]. Log files yield low-level data that indicate whether users clicked on a button or moved the curser from one position to another. This in itself cannot be interpreted in a meaningful way. It is necessary to code all these low-level activities on a more abstract level to interpret them. Color can be easily used to get an overview of such sequences. In
Figure 1 a sequence of “Explore” and “Abstract/Elaborate” can be seen, categories which are described in the next section.
For the log file analysis in study 1 we chose the coding scheme by Yi et al. [
49]. This coding scheme reflects the intentions of the users and describes interactions on the screen exhaustively. It is specifically adapted to describe activities of the users on the screen. Possible categories are, for example, filtering or zooming in or out. It is, therefore, quite appropriate for this purpose. Categorizing thinking aloud data is a more challenging process. The users’ utterances usually cover a wide range of topics. These utterances have to be analyzed on a more general level (Ericsson and Simon [
46]). The development of an appropriate coding scheme is a challenging task. In this case, (study 2) we used a bottom-up approach, which was also inspired by the Triple Pathway model by Klein [
26], and identified the most obvious strategies that were described the in the users’ utterances. The categories for verbal utterances have to be different from the categories for activities on the screen because they reflect different processes. Therefore, we used different coding schemes for study 1 and study 2.
In the next two sections, we will present first the results from a study using log files, and then a study using thinking aloud. Both investigations have already been published. Our goal is rather to show two possible ways how interaction processes of the users can be interpreted. There is still no comprehensive theory of how to model and interpret such interaction processes. The two investigations are first tentative results how these processes can be investigated and interpreted.
5.3. Research Based on Log file Analysis (Case Study 1)
In this section, we want to present the results from a series of studies based on the analysis of log files [
44,
45]. We conducted four studies with four different visualizations from the area of visualization of medical data. The goal of this study was to identify interactions that occur more often than others, and in addition, sequences of interactions that are adopted frequently.
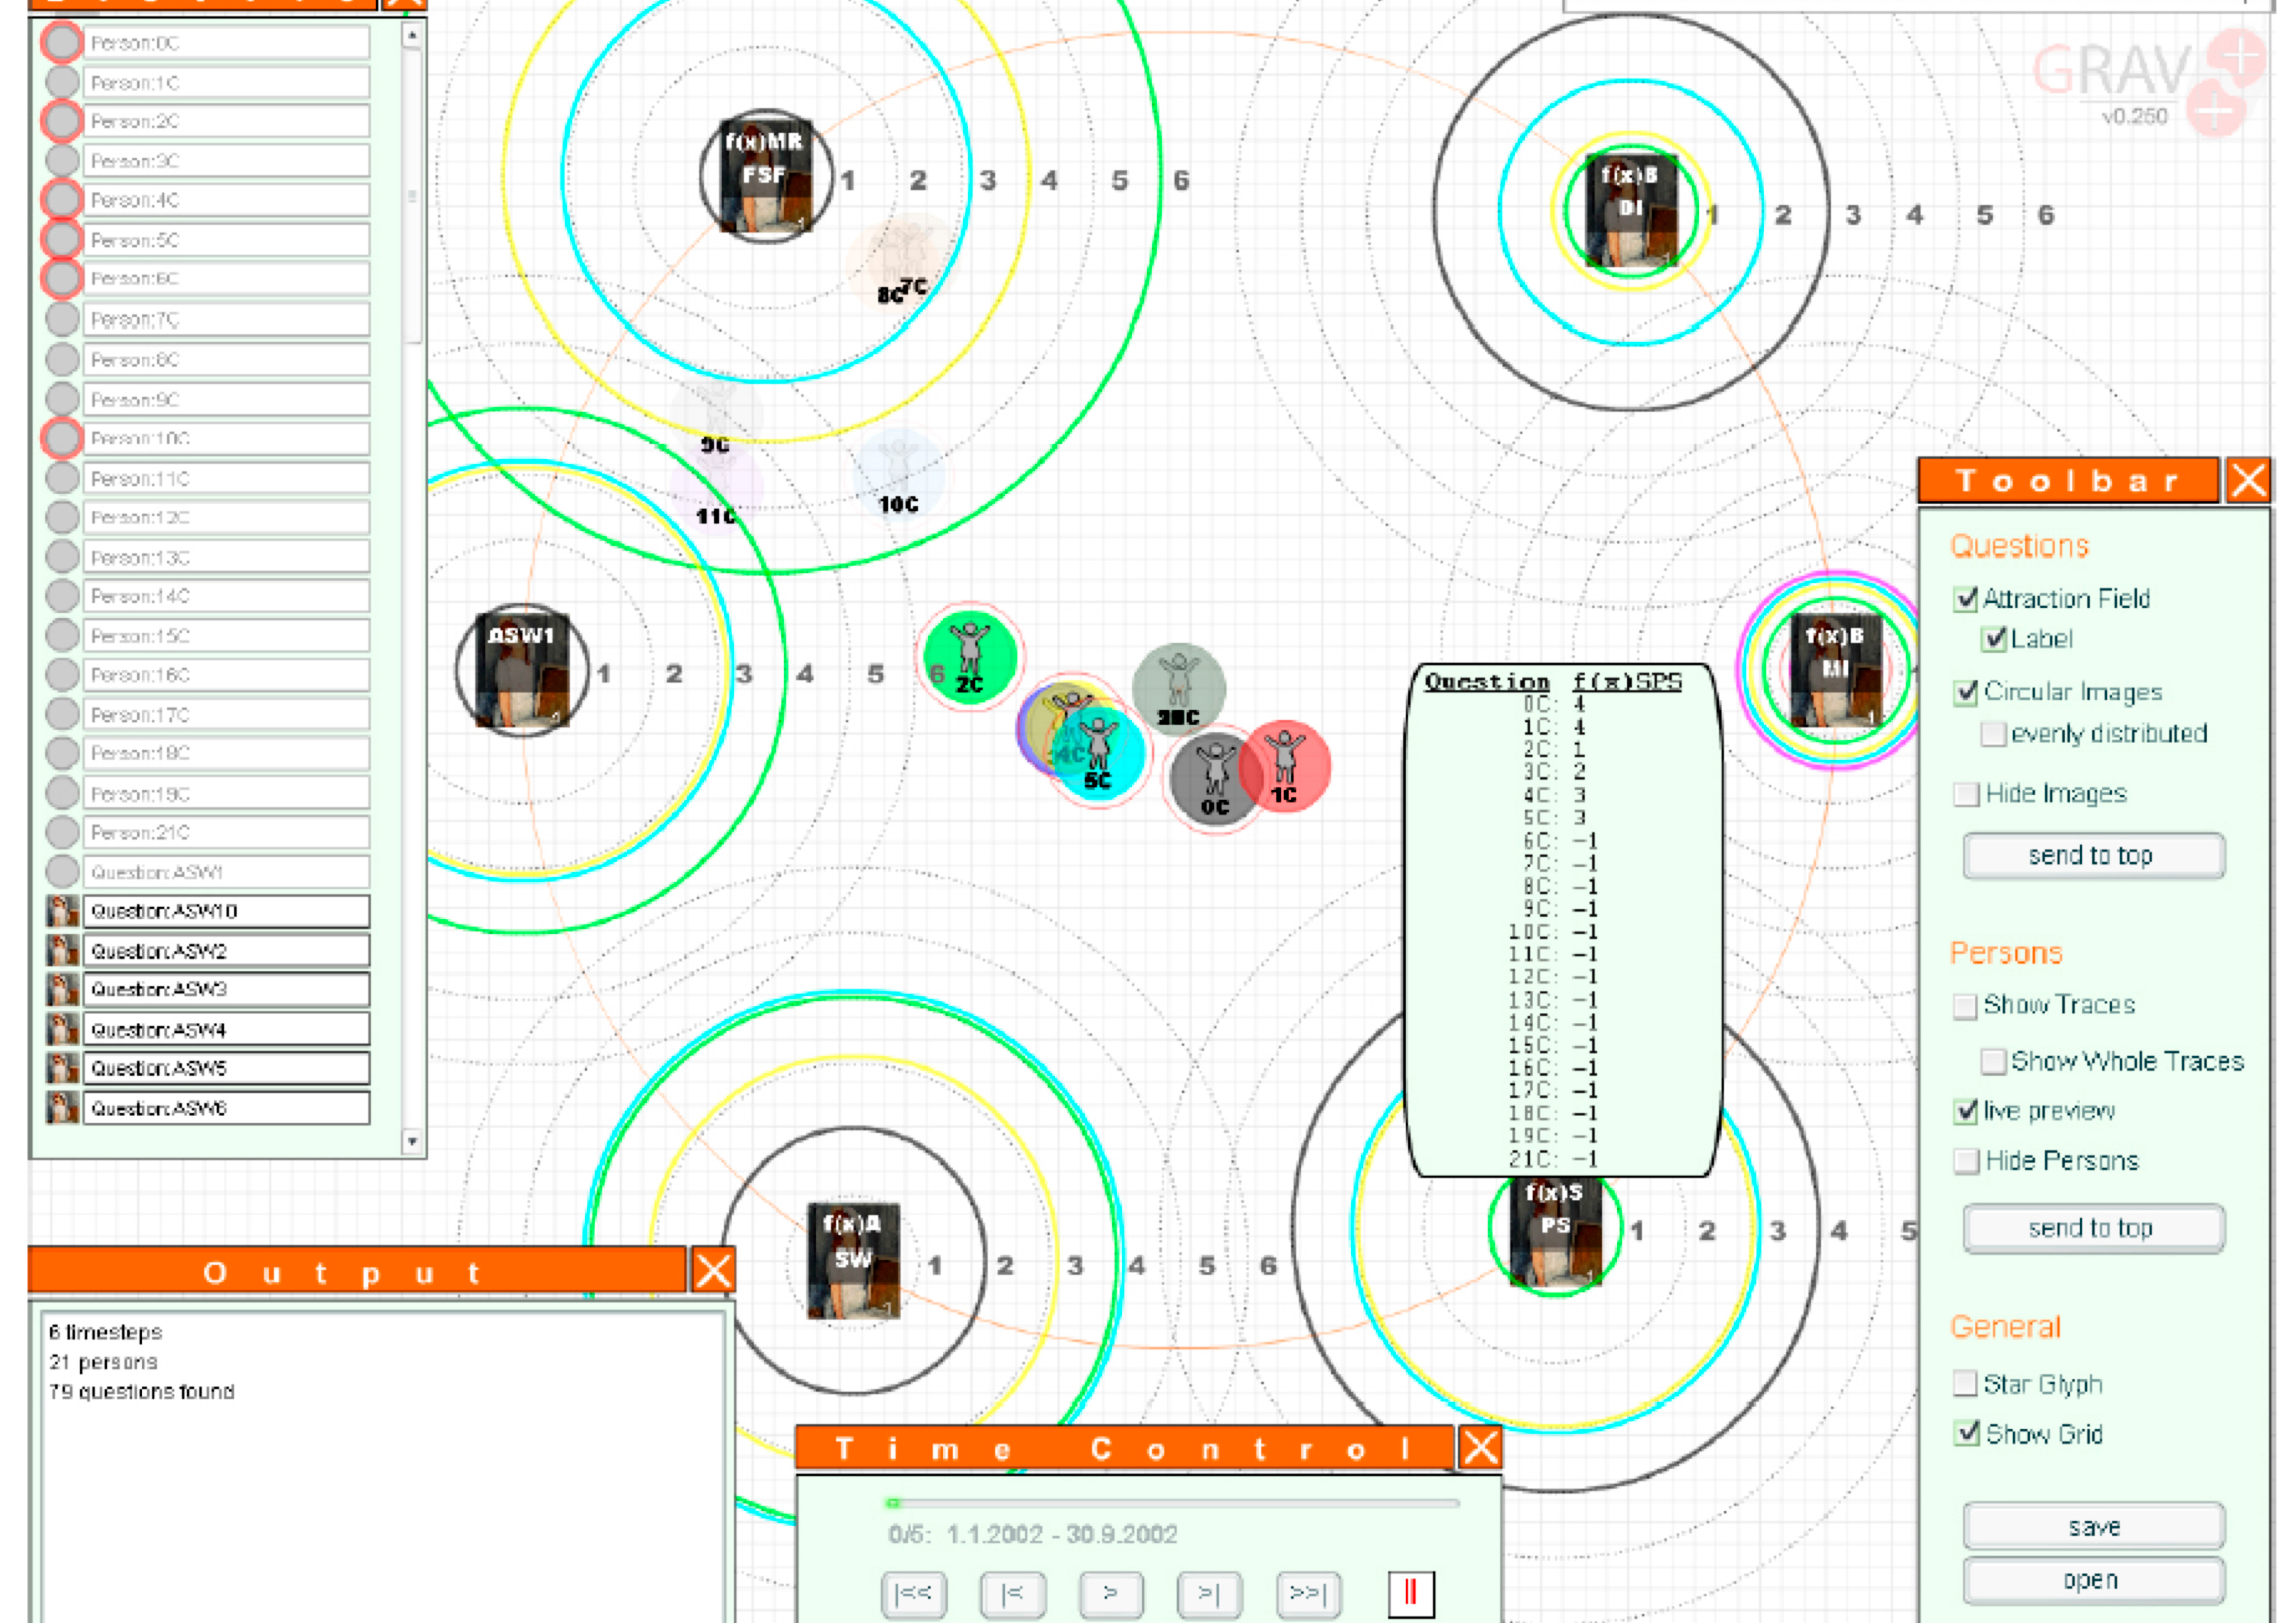
The first visualization (see
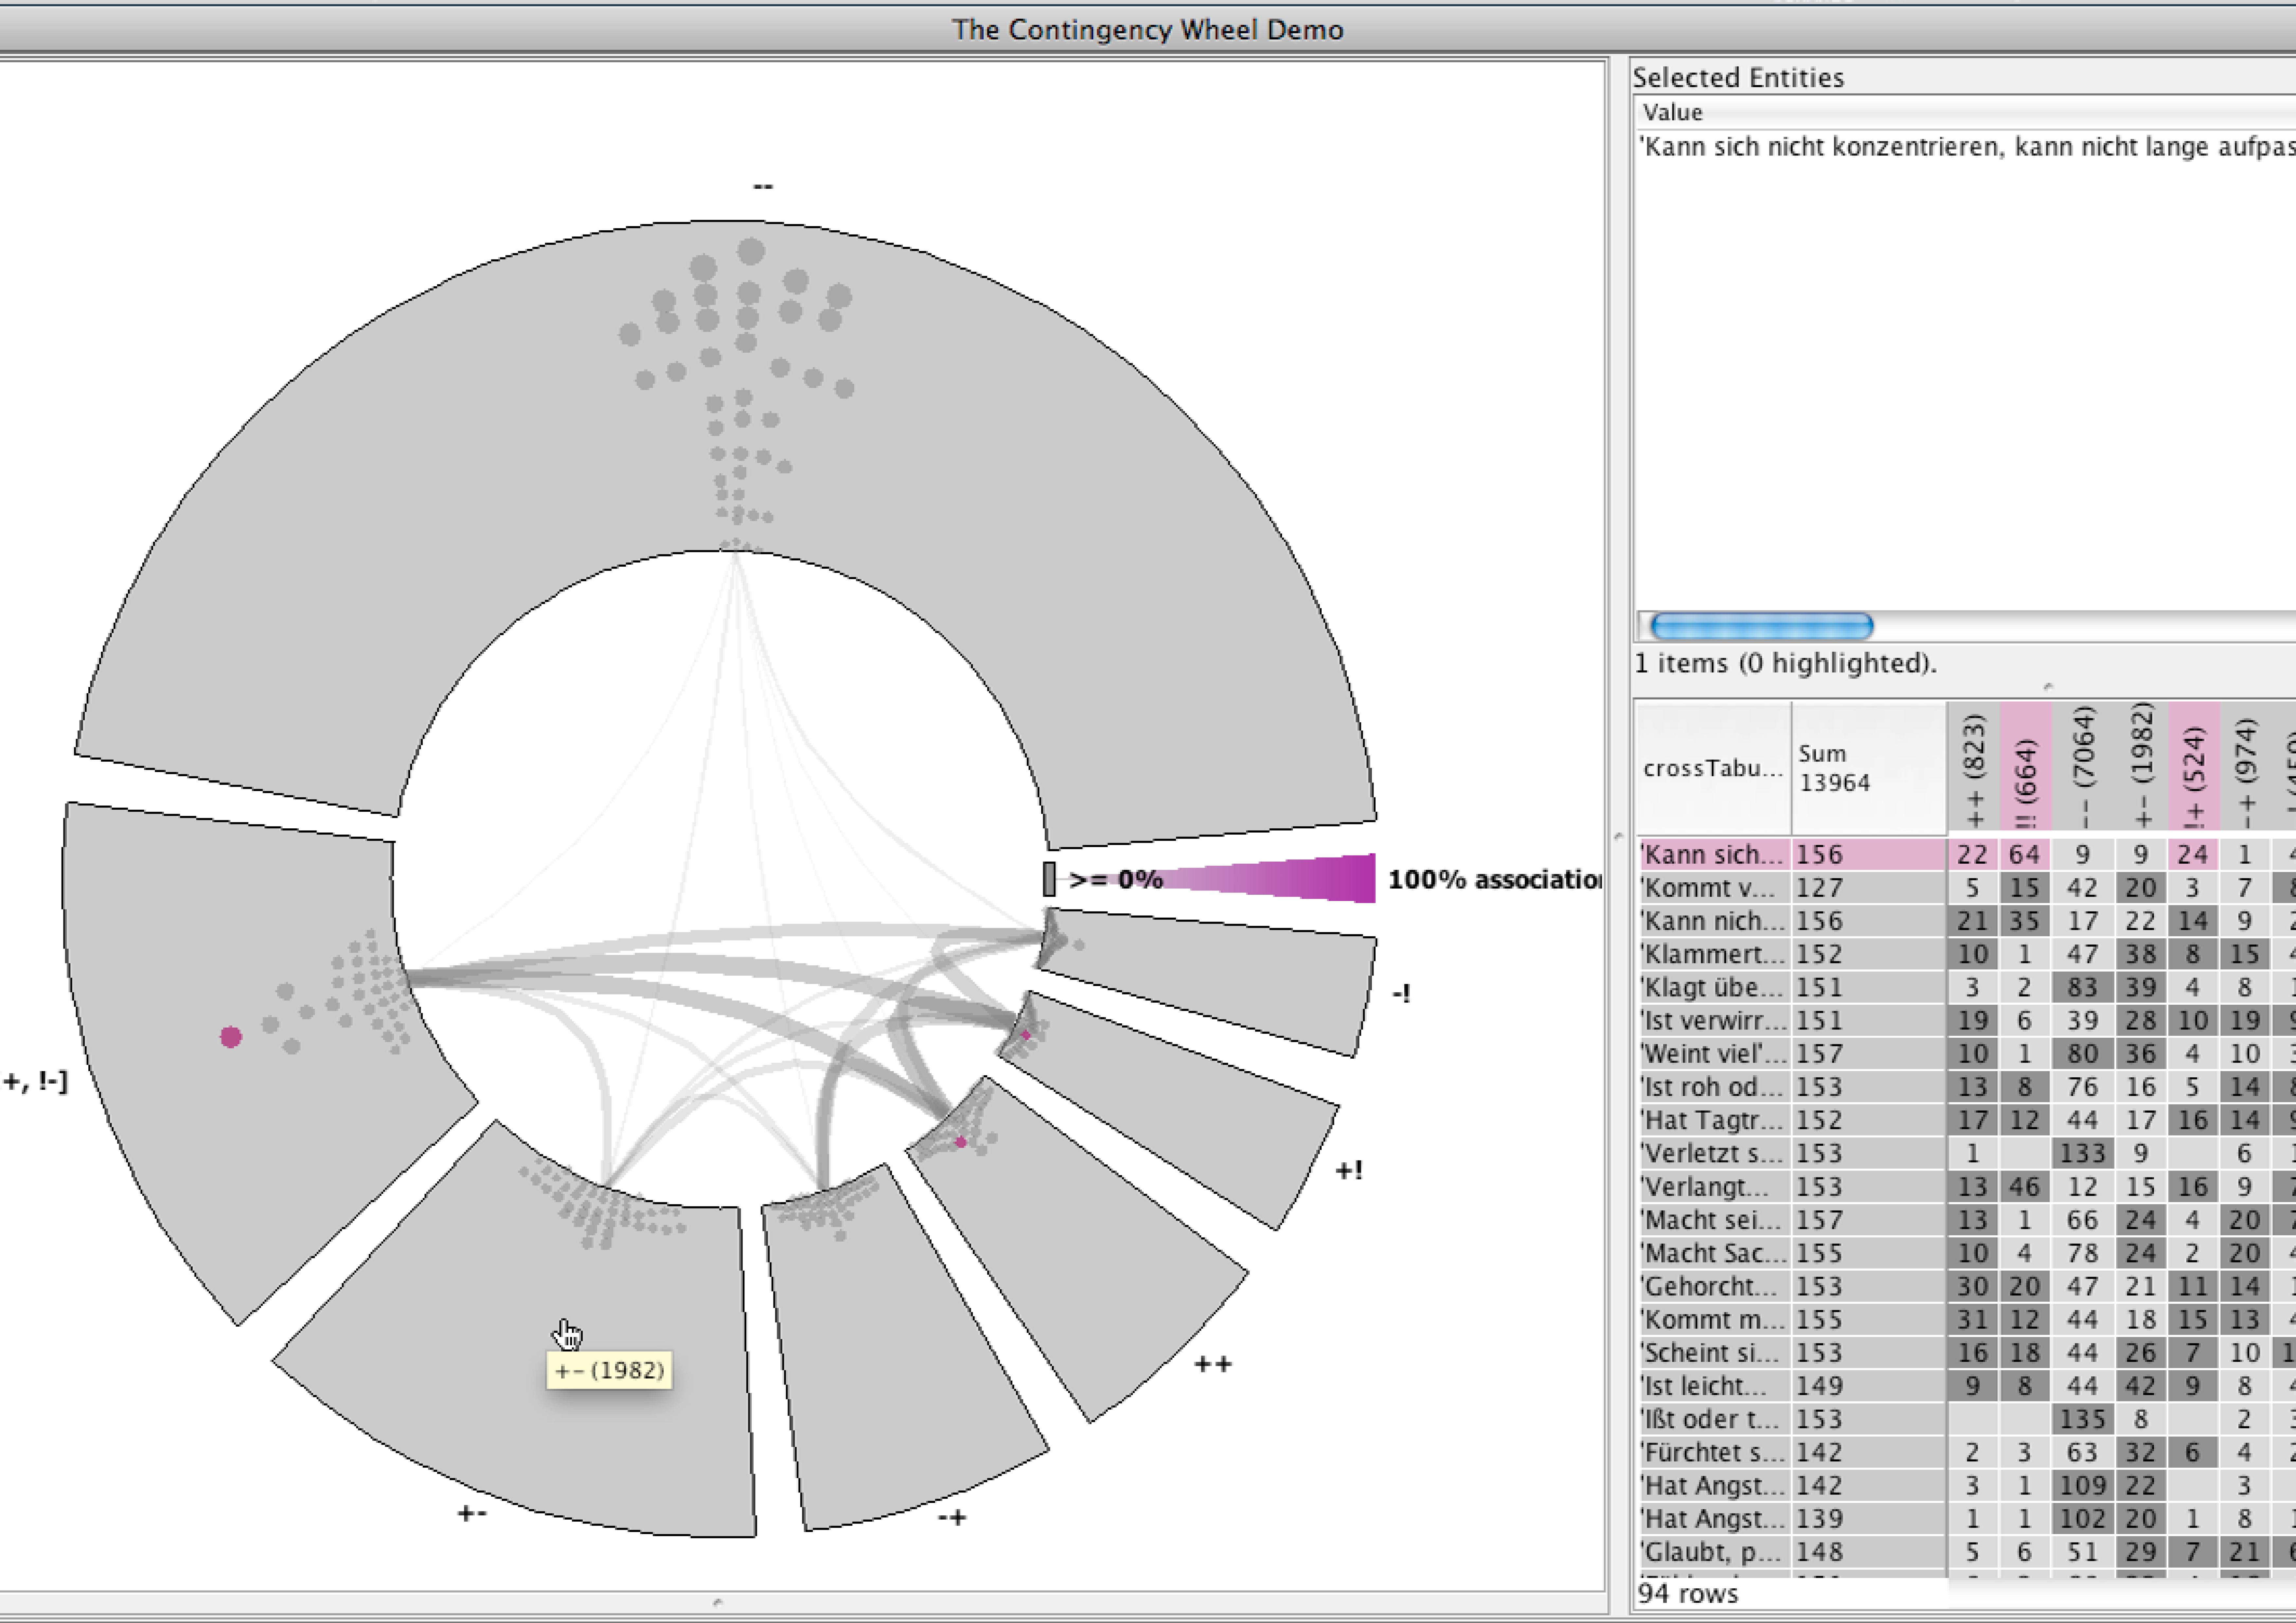
Figure 2) represented data from questionnaires of psychotherapy patients. The questions of the questionnaire were arranged in a circle around the icons of the patients. These icons were either repelled or attracted by the questions (spring metaphor), depending on how the patients answered the questions. The therapists were enabled to compare the state of the different patients with each other.
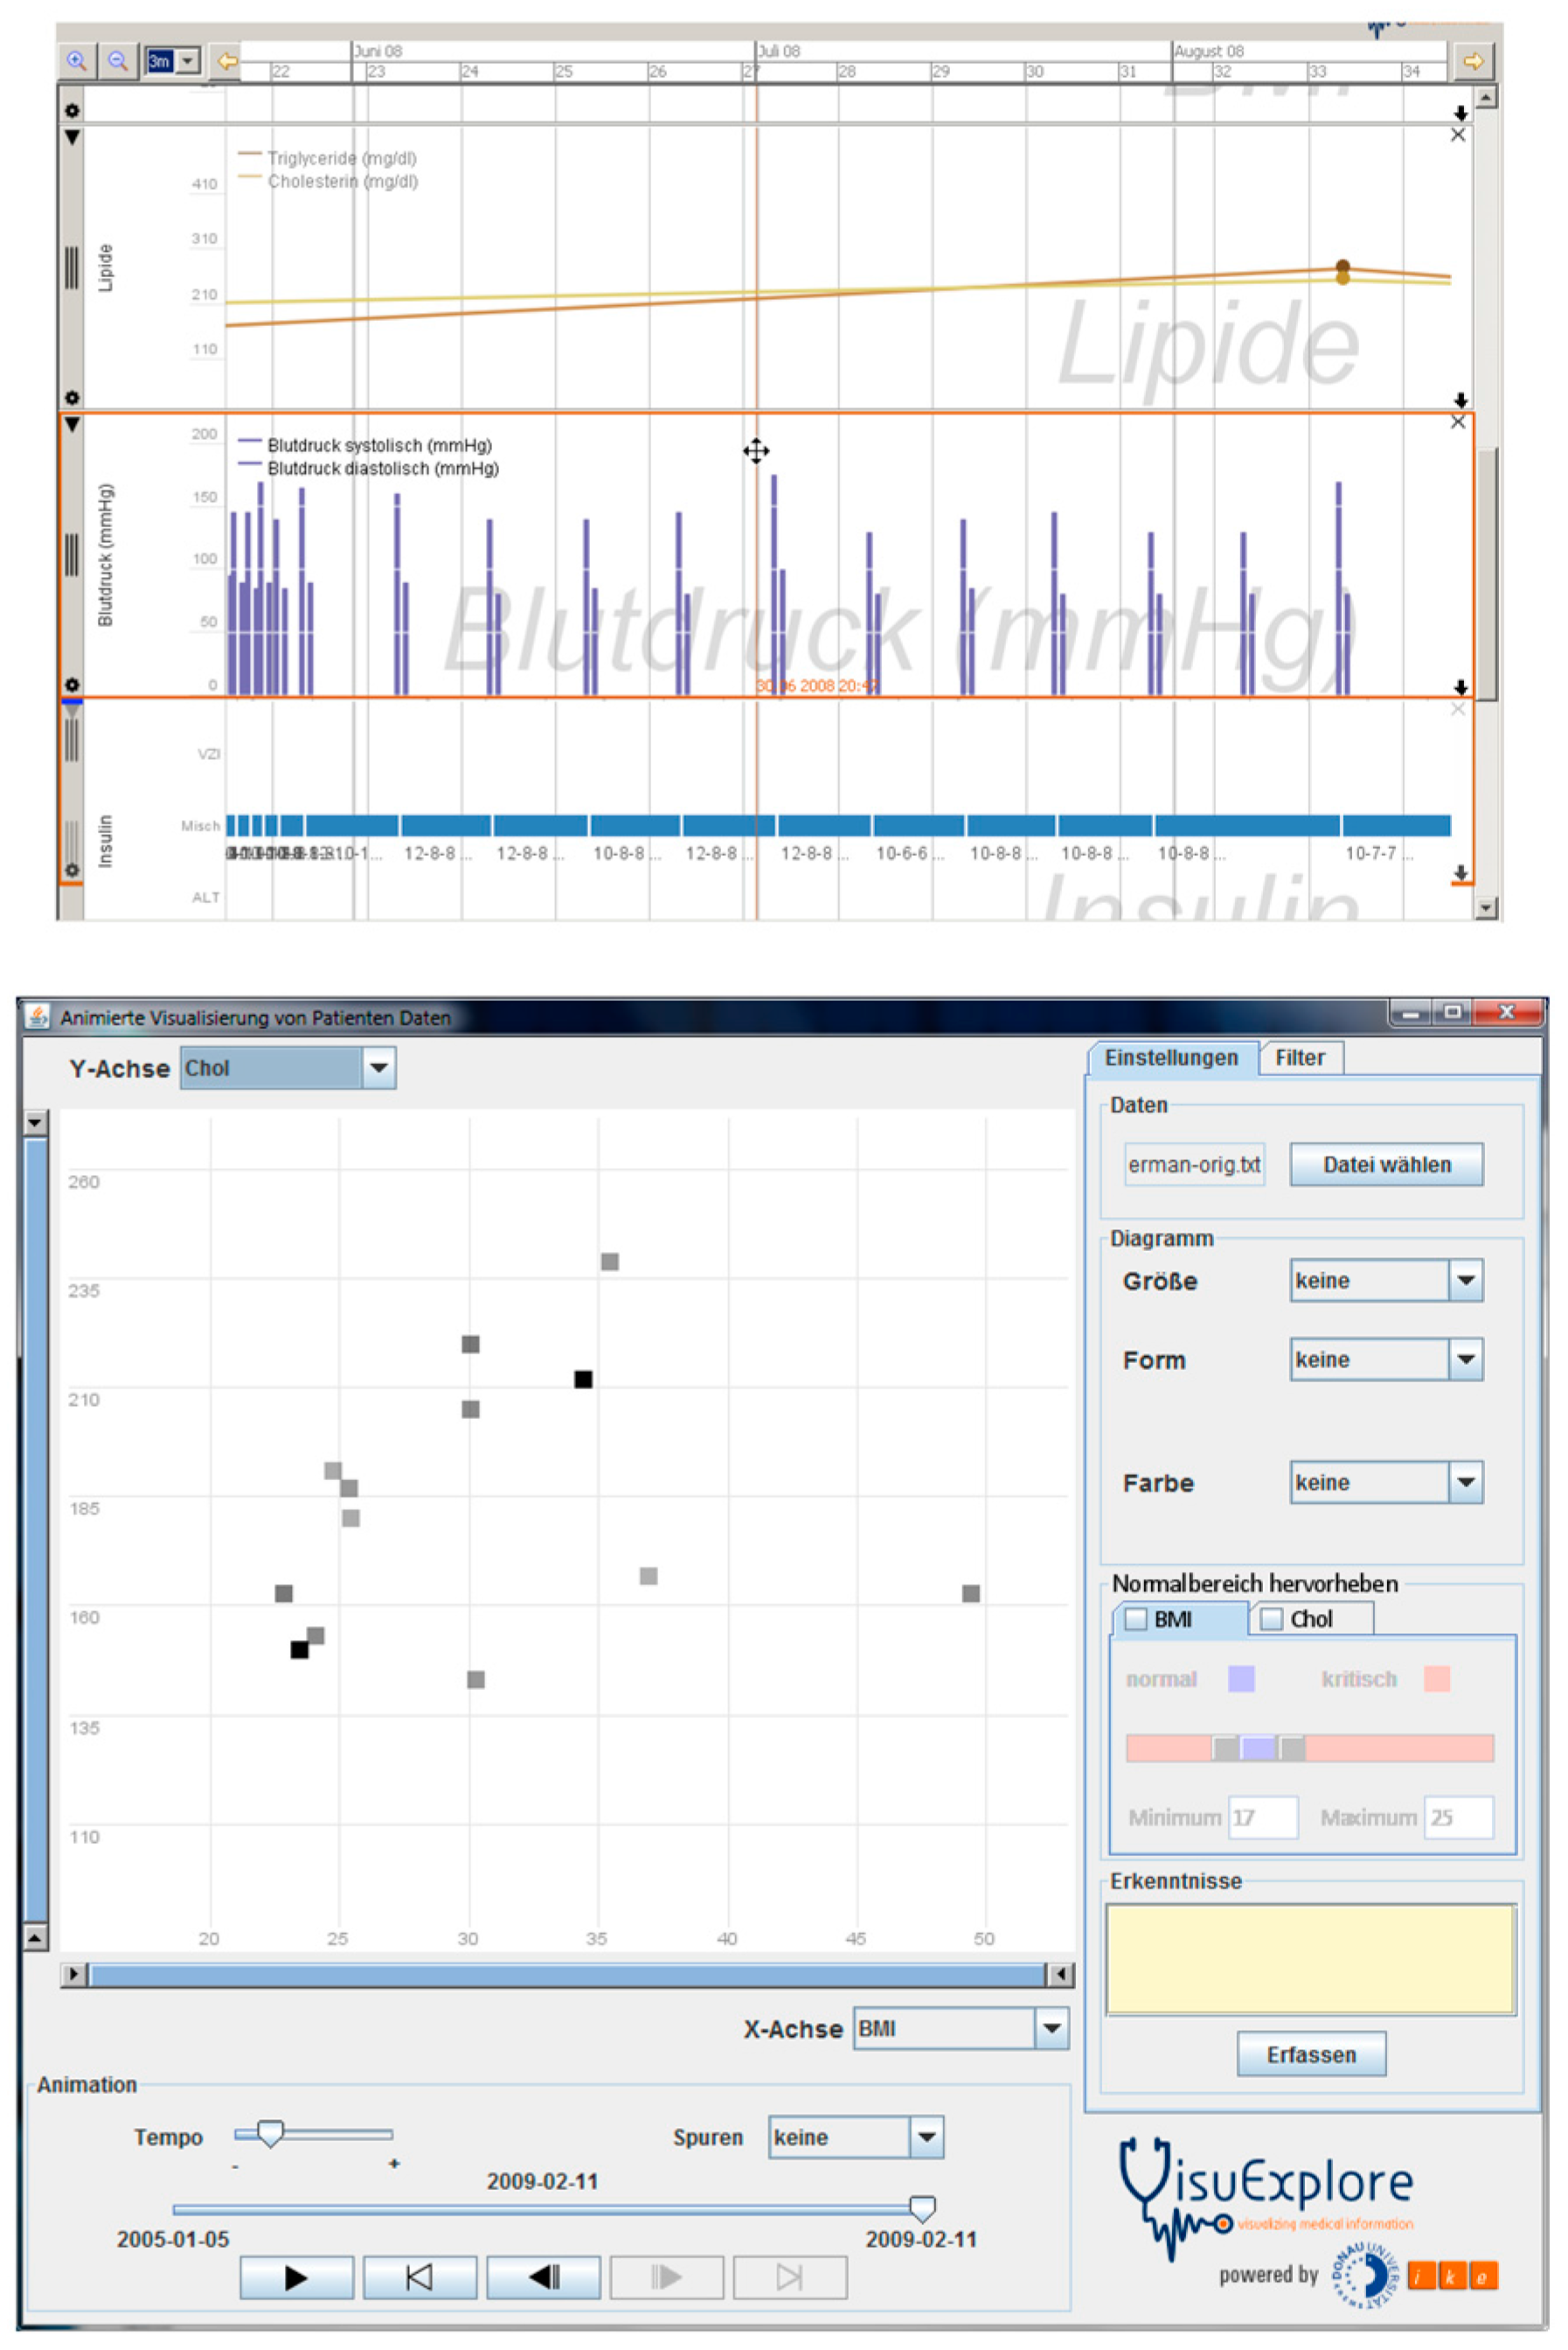
Figure 3 shows the second and the third visualization. On the left a collection of very simple line graphs and bar charts (static charts) show the temporal development of medical data of single patients (e.g., blood sugar, blood pressure, weight, …). On the right the third visualization, an animated scatterplot, shows the same data in animated form. Physicians were enabled to see the development of a group of patients over time as an animation.
The last visualization showed the data from a contingency table in visual form (see
Figure 4).
The four visualizations are very different in character. We also had diverse users (physicians and students) and diverse tasks. The tasks were all developed in cooperation with domain experts. We investigated whether there are common strategies used by participants over all these visualizations. We could find at least one such common strategy (for a description of this strategy see below). We think that this result is especially valid because we used several different visualizations, different tasks and different participants. We think that this result can be generalized because we found it for different visualizations, different tasks and different users.
We used the taxonomy developed by Yi et al. [
49] to analyze the log file data (see
Table 1). We think that this taxonomy is especially appropriate because it takes the users’ intentions into account. In the process of categorization we also noticed that the taxonomy is exhaustive and covers all possible interactions. The categorization process is fairly straightforward. The taxonomy developed by Yi et al. is based on previous research in that area. Existing taxonomies tend to be very similar and contain basic interaction possibilities of visualizations. This taxonomy enables us to group low-level interactions into more general categories. The resulting categories represent medium-level activities.
When we analyzed the categories we found the following descriptive results (
Table 2).
Table 1 shows the coding scheme for the interactions of users in this study. It also provides examples for these activities.
Table 2 indicates that users mainly use exploration and checking exact data values (Abstract/Elaborate) when they interact with visualizations, especially in the first three visualizations. It must be noted, however, that some visualizations support certain interaction possibilities better than others. It can be seen that the contingency table visualization does not support exploration and looking up exact data values very well, therefore, the numbers here are much lower. The visualization does not offer any possibilities to zoom or pan, therefore this activity does not occur very often. It is only possible in the table to the right of the visualization (see
Figure 4. This has to be taken into account in the analysis. We also identified several interaction sequences that occurred more often than others [
33]. We especially found one sequence that occurred very often—Abstract/Elaborate and Explore (and vice versa, see
Figure 1).
On the other hand, changing the appearance of the visualization on the screen is an interaction possibility that was not used very often. This was possible in three of the four visualizations. In the spring metaphor visualization, it was possible to turn the circles around the icons on or off (see
Figure 2), in the static charts it was possible to change from line charts to bar charts, and in the animated scatterplots it was possible to add traces to show temporal development. Maybe, the users are reluctant to do that to avoid inconsistencies with the mental model of the visualization they have in their mind. They tend to use interaction strategies that are known to them from their daily lives. Going round an object (explore) or going nearer or further away (Abstract/Elaborate) are well known to them from their normal activities. Changing the appearance of an object frequently (Encode, Reconfigure) is probably not very common because in general objects have the same appearance in everyday situations.
We also conducted a lag-sequential analysis [
33] for the contingency tables visualization (but not for the other visualizations). Lag-sequential analysis is a statistical method to analyze whether some sequences of interactions occur significantly more often than others. A notable result of this analysis was that the Abstract/Elaborate—Explore—Abstract/Elaborate sequence was the one that occurred most often. This is all the more surprising because these activities do not occur very often with this visualization (see
Table 2). Nevertheless, it is the only three-element sequence that occurs significantly more often than any other sequence. This is a strong indicator that this interaction sequence is very natural for users of information visualizations.
5.4. Research Based on Thinking Aloud (Case Study 2)
The second case study focuses on sense-making strategies users adopt while working with a system. Hence, thinking aloud was the method of choice to gain insights on user motivation and thinking steps. The context of this research is the evolution of social networks for criminal investigation, which was conducted in the course of the research and development project VALCRI (Visual Analytics for sense-making in Criminal Intelligence Analysis). The analysis of police data includes laborious tasks because of vast amounts of data from different sources and no clear paths to a solution. The goal of VALCRI is to ease the work of an analyst by providing different views on the data and enable fluid interaction, transparency while supporting imagination and insight generation. As part of the formative evaluation a prototype for the use case of analyzing network evolutions was build and analyzed with the focus on sense-making strategies.
We conducted a mixed-methods evaluation [
50] with qualitative and quantitative data from 31 participants with basic to high knowledge about visualization. Social networks of offenders were represented in a node-link diagram and in a matrix visualization. The participants were trained in the use of the tool before they worked on average 45 min to solve realistic tasks. The qualitative part included seven tasks to explore the data and answer questions about the evolution of a criminal network, such as, assessing the trend of the network, identifying groups that become more active or change their activities, e.g., become more violent, and looking for well-connected offenders. The think-aloud method was used and both audio and screen got captured. The quantitative data included how often users switched views, how long a view was used and how plausible the answers to a task were.
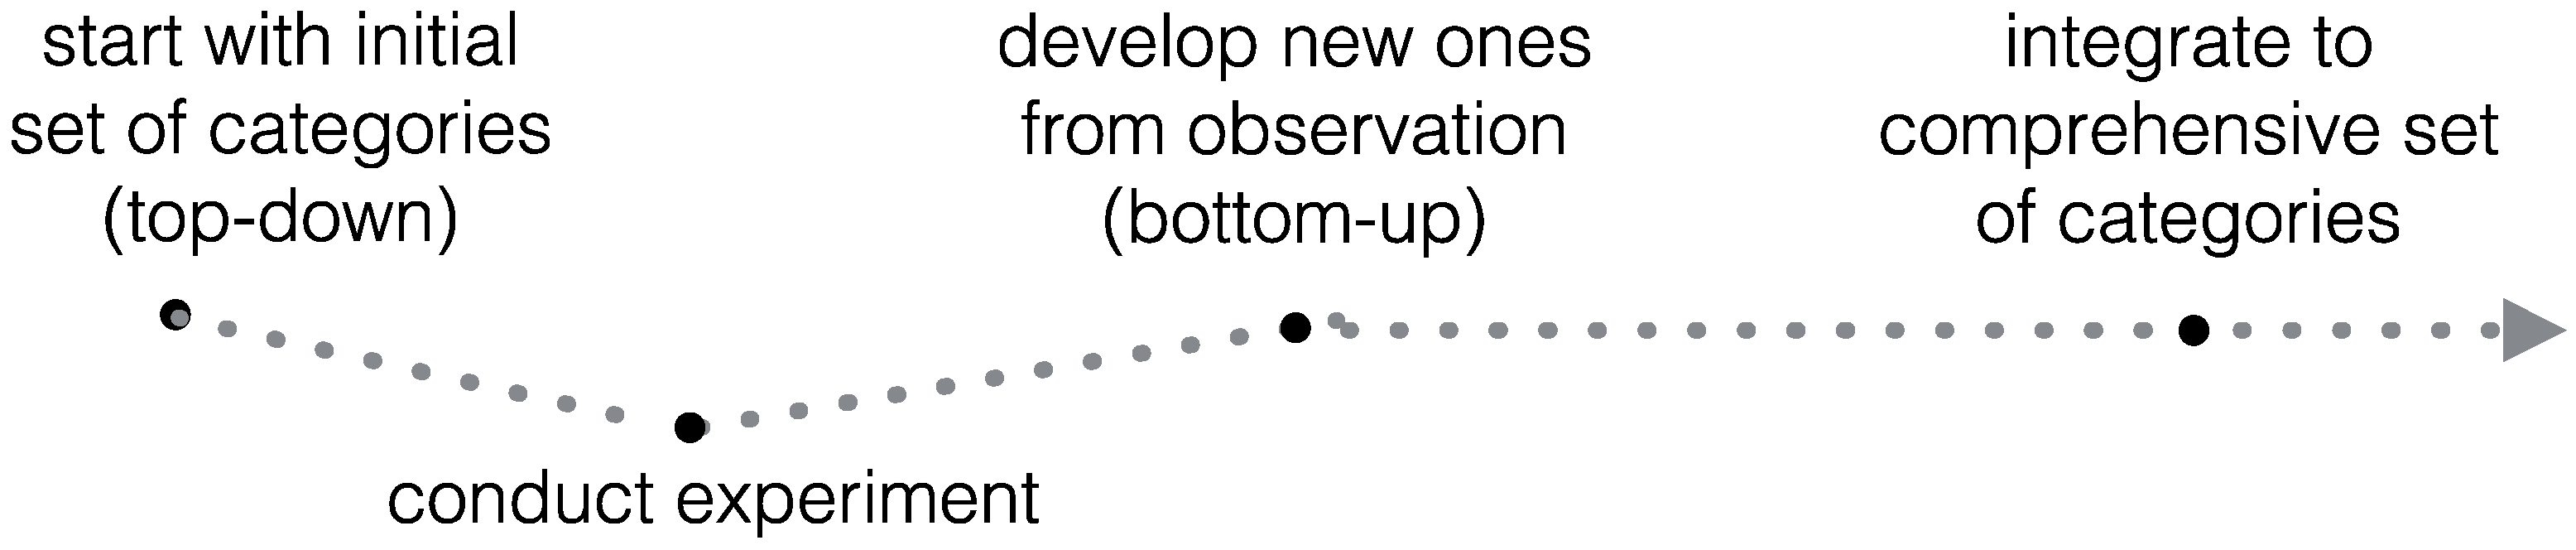
For the analysis of the qualitative data we considered Klein’s sense-making strategies as fitting and discussed possible categories before the evaluation. During the evaluation the experimenter recorded the answers and took notes about the categories. Additionally, the observation yielded further insights into the working processes and thinking steps and new category ideas were noted. After conducting the study three researchers discussed the observation notes and the possible integration of the top-down and bottom-up categories. In a first step all categories deemed reasonable were used for the coding step, i.e., the previously agreed upon strategies from the Triple Pathway Model by Klein [
26] and 12 new ones from the observation notes. In a second step categories with too few samples and similar examples got combined again which resulted in a set of ten categories. An overview of the creation process is shown in
Figure 5.
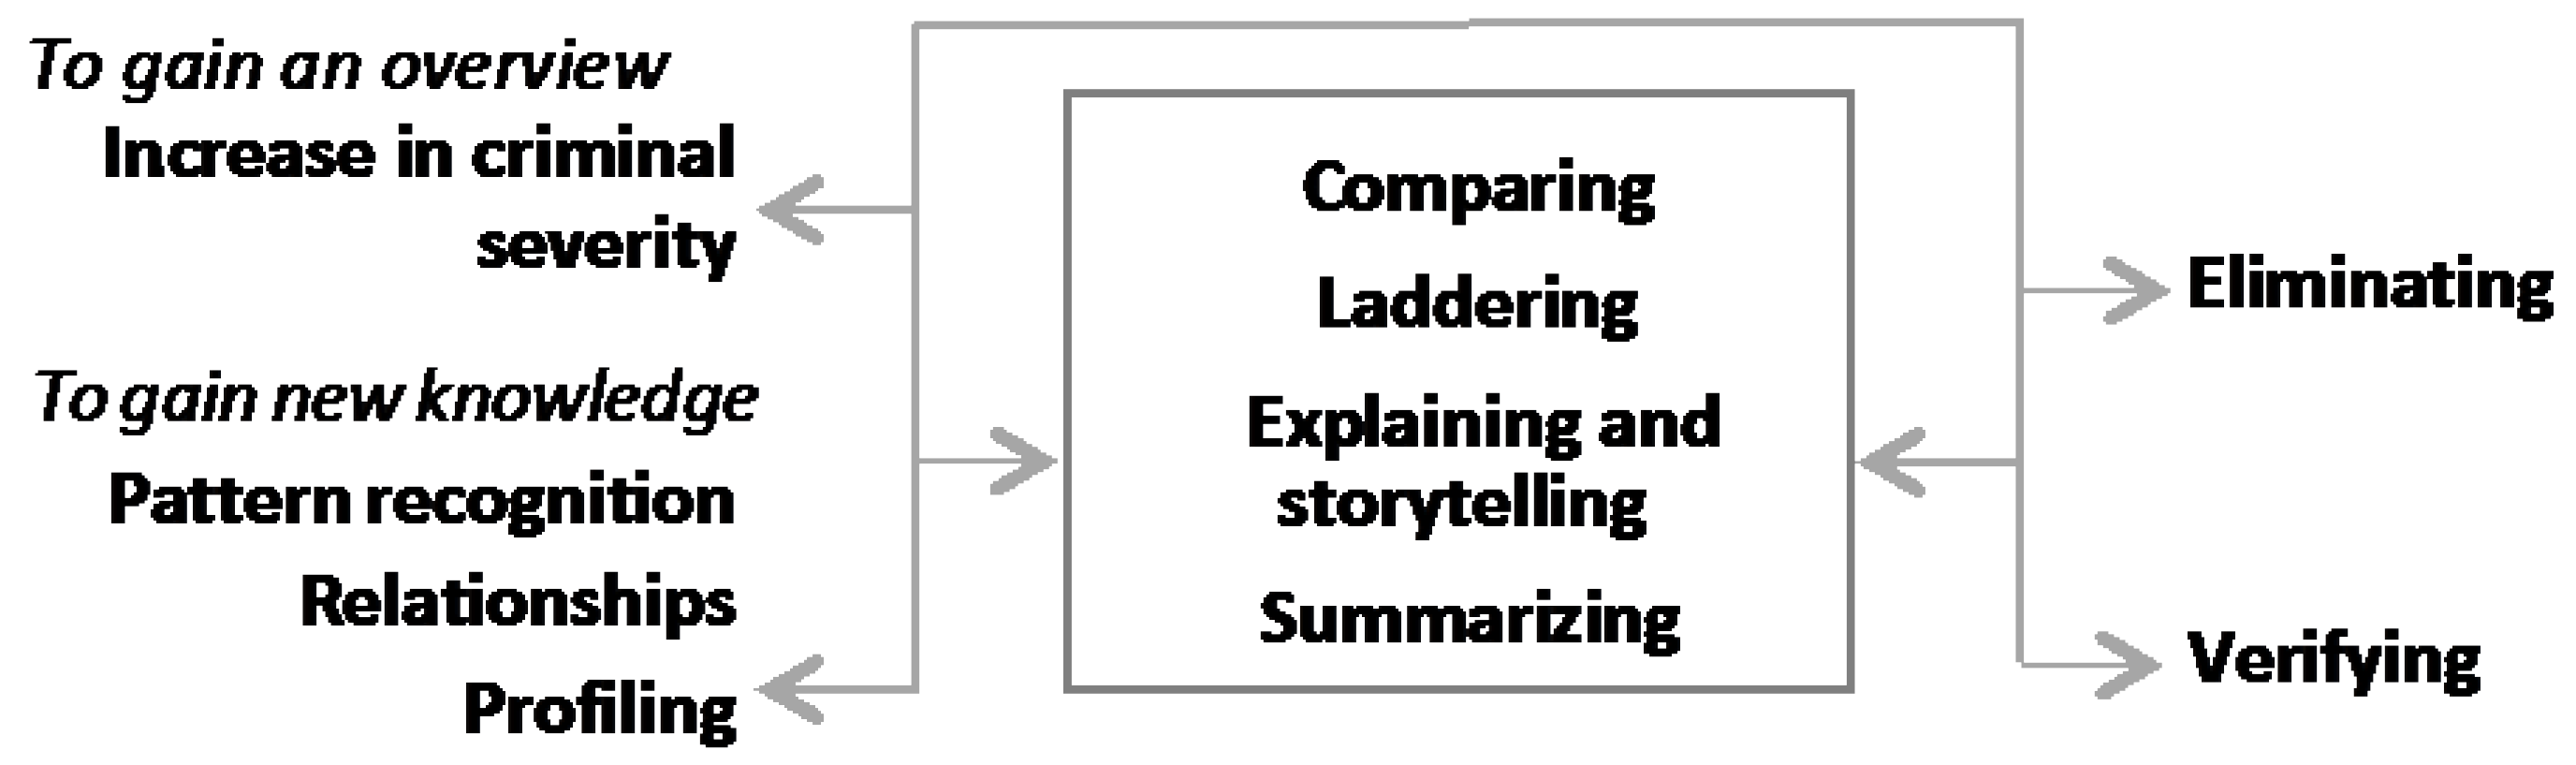
In retrospective these ten categories can be divided in four task-relevant ones to gain an overview and new knowledge:
The remaining six relate to generic user actions:
These categories represent sense-making strategies the users adopted while working with the system. They were used in a chaotic and cyclic manner (see
Figure 6). The analysis of their application frequencies with different views of the system leads to insights on how users make sense with the provided tool which on the one hand informs about possible improvements of this tool but on the other hand, can be used by any system designer because we think these results can be transferred to other domains as well.
Increase in Criminal Severity [
50]: In this study, the evolution of a person was of interest and an eventual increase in its criminal activity was explored in the course of the experimental tasks, hence, this is a very context specific strategy. More generally it could be described as “looking for a trend”. There were several cues in the visualization to support this, e.g., in the node-link diagram the thickness of the line where three lines represented three years. Participant 7:
“The graph shows me from what I understood, the thicker the line, the more criminal activity”. Pattern Recognition [
50]: The recognition of similar attributes in the data describes the process of pattern recognition. It could be argued a too general description of a strategy that occurs very frequently, but we used it in a task specific way, when participants reasoned about connections in the data, e.g., via similarities in events or persons that are of interest, in comparison to “relationships”, described below.
Relationships [
50]: The type of connection and temporal relation between persons was of special interest in this social network study because it depicts a special type of social network—a temporal evolution network showing connections over three years. Additionally, indirect neighbors were specially encoded in the matrix visualization, which usually only represents direct relationships.
Profiling [
50]: The profiling strategy is about the characterization of events or persons involved in an event based on features and relations. The exploration over time in this study, e.g., revealed that actors in the network are prone towards committing a specific type of crime.
Comparing [
50]: This strategy describes straightforward comparison of entities, e.g., persons or their attributes and can be observed within one view or across different ones, which then interacts with the “Verification” strategy, described below.
Laddering [
50]: Laddering as a sense-making strategy means the handling from one piece of information to the next one, i.e., getting new ideas on the basis of careful inquiry and switching to new pathways of the exploration.
Explaining and Storytelling [
50]: Explaining the behavior of a person, thus, reasoning about the motivation and course of events was observed independently of the task. Storytelling is an elaborated explanation, when additional assumptions and speculations were made (and got verbalized in the thinking aloud) to make sense of the information at hand.
Summarizing [
50]: This is a straightforward strategy to sum up or aggregate information to gain an overview of the situation. In our study, this was observed, e.g., for events, actors as well as time intervals, to generate insights, or go a step back and follow another inquiry.
Eliminating [
50]: The Elimination strategy includes how participants filtered the information they found during the enquiry, hence, excluded elements from the search space. This strategy was observed in combination with other inquiry-strategies such as Comparing or Laddering, when they were looking for specific information. We detected Elimination through a thorough protocol analysis of what was verbalized during the experiment. One task was to find gangs who became more active over time, hence, a working strategy was to look at co-offenders and assess their activity. The following snippet is an example for what we categorized as an Elimination-strategy and shows how context-sensitive the analysis was. Participant 4: “
These are the ones at the top left corner… As you can see it is not constantly increasing, 2013 to 2014 there is a rise from 2014 to 2015 there is a drop. We are looking for something, which has an increase”.
Verifying [
50]: The Verification strategy describes the working process of an analyst who has to make sure that the conclusion is a valid one and, therefore, looks up the information again in another view. Every fact drawn from the data needs to hold in court and there is no place for assumptions or jumping to conclusions. In the described study we offered two views on network evolution data and we observed participants in using both views to re-check a hypothesis they came up with. During an explorative task they had to assess the overall trend of the network, i.e., how the criminal development evolved over a period of time. They were asked to assess if crimes increased, decreased or if the situation was stable. Before giving an answer and going on to the next task, the following participant switched the view for Verification. Participant 5: “
I am going to the matrix as it can show the crime times in the visualization. The matrix confirms my discovery”.
6. Discussion
In this paper, we try to bridge the gap between existing theoretical approaches and empirical research concerning sense-making strategies of users of information visualizations. We especially focus on the step-by-step analysis of interactions. Our research was influenced by sense-making and insight approaches, but there are relations to the other theoretical frameworks described above. In the following, we would like to outline possible research questions based on the literature study that is described above. We will also present some first results based on our own research. This overview points to issues that should be investigated in the future and limitations of existing research. This list is not exhaustive, and there are probably additional open issues that are also relevant for information visualization.
6.1. Heuristics
• “Less is (sometimes) more” (Gigerenzer [
4], Klein [
23])
Gigerenzer [
4] points out that people often make decisions based on limited information. The recognition heuristic supports such decisions. He argues that these decisions are often better than the ones based on very comprehensive information. Such decisions are fast, clear and often more rewarding for decision makers. In information visualization, users often have the possibility to filter data to enable them to concentrate on relevant parts of the visualization. It is an open question whether users of information visualizations prefer more or less information and under what conditions less information might be advantageous. In addition, filtering is not the only possibility to ensure that users are not overwhelmed with information.
Results from our own research: In the log file study (study 1) we investigated filtering activities. The results are not clear because the amount of filtering activity depends very much on how well it is supported by the visualization and on the task. End-users in study 2 (Seidler et al. [
51]) mentioned that they need filtering as interaction possibility to be able to concentrate on the relevant data. More research on when filtering or other methods of reducing information are appropriate is necessary.
• Users are looking for a “good enough” solution instead of the optimal solution.
This is mainly a result from the research on heuristics. Users in realistic context always have time constraints and are not able to search for the optimal solution. Sometimes, an optimal solution is extremely difficult to find, especially in ill-structured domains as in medicine or intelligence analysis —the domains we investigated.
Results from our own research: In the thinking aloud study, we used realistic data and tasks that were developed together with domain experts. In this study, some of the tasks had no ground truth, and we could only rely on plausibility to assess the quality of the results. Plausibility is an indicator of a “good enough” solution. An informal analysis of the results of the work of the participants indicates that the users found very diverse solutions for the given tasks. Most of these solutions are plausible.
• Application of well-known heuristics
There are well-known heuristics like hill-climbing or means-end analysis (Reisberg [
9]). We do not know of any research trying to determine whether such heuristics are applied in processes of interaction with visualizations.
6.2. Strategies
• There are domain-dependent and domain-independent strategies.
Results from our own research: We found strategies on a medium level of activities based on the log file study. We could especially identify one strategy that can be observed in interactions with all the visualizations we analyzed. Different user groups adopt this strategy with different visualizations and different tasks. It encompasses activities that also occur in the everyday lives of the users (look for concrete values, explore the data). This strategy can even be observed when it is not very well supported by the tool. This is an indication that general cognitive strategies that are adopted in different situations and with different tools exist. In contrast to that, many of the strategies identified in the research on arithmetic are domain-dependent on mathematical knowledge. It is an open question how these two types of strategies interact and support each other.
• Graph comprehension approach
Within the graph comprehension approach studies on sense-making strategies have been conducted [
16]. The main focus of such studies is to identify whether users are able to “connect the dots” go beyond the data. This is also interesting for research on sense-making strategies. The distinction between superficial strategies and strategies that enable users to make inferences and predictions is also relevant for the design of information visualization. There is a considerable amount of research in graph comprehension addressing this issue. Nevertheless, it is not the only possible strategy, and other strategies have to be identified by the development of categories using a bottom-up approach.
Results from our own research: In study 2 [
33] we also investigated this issue and found that visualizations can be designed in a way to support drawing inferences. In this study, a large proportion of utterances in thinking aloud protocols concerned reasoning and making inferences. Nevertheless, it is not clear which features of a visualization support such reasoning behavior and whether all users benefit from this kind of design.
6.3. Sense-making
• Interacting with information visualizations is an exploratory process.
This is especially supported by sense-making theory. The data/frame model of Klein [
25] implies that cognition always consists of a process of assessing and reframing one’s knowledge structures. It is typical for such a process that users go back and forth from one representation to another.
Results from our own research: We found this in the thinking aloud study (study 2) where users moved between the node-link diagram and the matrix representation to verify their insights. Sometimes, this supported their previous insights, and sometimes they realized that their interpretation of the data was not correct, that is, they had to reframe their knowledge structures.
• Model of complex cognitive activities (Sedig et al. [
37])
Sedig et al. argue that complex cognitive activities can be described on different levels of abstraction (activities, tasks, individual interactions and events). These actions range from a high-level abstraction to low level abstractions. Activities, for example, reflect general goals of the users, whereas events are micro-level actions like keystrokes. These are different levels at which reasoning activities can be observed. Nevertheless, activities on different levels should form a coherent whole.
Results from our own research: We investigated activities on different levels. On the one hand, we investigated observable activities on the screen via log files. These activities are usually categorized as low to medium level activities (study 1). On the other hand, we also investigated higher-level activities reflecting reasoning processes going on in the users’ heads (study 2). The method to study these activities was thinking aloud. These two approaches yield different kinds of results. Results from log file studies are more objective, but often difficult to interpret. Results from thinking aloud studies yield very rich data that explains why users adopt some strategies, but that is also limited because of the limited insights people have into their own reasoning processes. Both approaches describe different aspects of the interactions and reasoning of users. Log files show manifest activities, whereas thinking aloud provides some insight into the reasoning process that go on in peoples’ head. It is an open question how these two levels are interrelated with each other and whether there are systematic relationships between activities that can be observed via log files and results from thinking aloud studies.
6.4. Everyday Reasoning
• Users apply strategies and heuristics that are flexible and adapted to the task and the situation at hand.
This is, on the one hand, a result from the research on cognitive strategies and also on everyday thinking and reasoning.
Results from our own research: We found this especially in our research using the thinking aloud method (study 2). Participants used the strategies described above flexibly and depending on the task they had to solve.
• Everyday reasoning is relevant and context-specific.
In contrast to some of the research on reasoning strategies in cognitive psychology, everyday reasoning depends on background knowledge. The influence of background knowledge is sometimes difficult to investigate, therefore researchers tend to avoid this as an influencing factor. Research addressing this influence is sometimes messy, but more ecologically valid on the other hand. For the investigation of sense-making strategies of users of information visualizations, the influence of background knowledge is highly relevant. To the best of our knowledge, there is no systematic research in this area, although evaluations in information visualization are often carried out with domain experts.
6.5. Limitations and Future Work
The list of open issues indicates that there are still many open questions related the investigation of sense-making processes with visualizations. There is still no comprehensive model of how information visualizations support human reasoning processes. Research, especially in cognitive psychology, indicates some influencing factors, but it is not clear how these factors could be supported by an appropriate design. There are some tentative results from our research. We found, for example, that verification is an important cognitive strategy that is especially supported by multiple views. Designers in information visualization know from experience that multiple views might support this, but we could find some empirical evidence to substantiate this claim.
There is a difference between the type of results from log file analysis and from thinking aloud protocols. The log file analysis describes activities that are medium level and to a certain extent related to characteristics of the tool. In contrast to that, the strategies that emerge from the thinking aloud protocols seem to be more general. Those strategies rather describe what happens in people’s minds. It is an open question how the activities on these two levels relate to each other and whether there is a systematic correspondence between the two levels.
The categories for the strategies we identified in our research were developed in a bottom-up approach and represent a first tentative framework to describe people’s activities when interacting with information visualizations. It is an open question whether these sense-making strategies will also hold in other domains than in intelligence analysis. Future research has to clarify this issue.


