Article

Simulation and Statistical Validation Method for Evaluating Daylighting Performance in Hot Climates

1
Sustainable Design in Construction Engineering Program, Faculty of Engineering, The British University in Egypt, El Sherouk City 11837, Egypt
2
Architectural Engineering Department, Faculty of Engineering, The British University in Egypt, El Sherouk City 11837, Egypt
*
Author to whom correspondence should be addressed.
Urban Sci. 2025, 9(8), 303; https://doi.org/10.3390/urbansci9080303
Submission received: 4 July 2025 / Revised: 29 July 2025 / Accepted: 30 July 2025 / Published: 4 August 2025
(This article belongs to the Topic Application of Smart Technologies in Buildings)

Abstract

This study investigates the influence of façade-design parameters on daylighting performance in hot arid climates, with a particular focus on Egypt. A total of nine façade configurations of a residential building were modeled and simulated using Autodesk Revit and Insight 360, varying three critical variables: glazing type (clear, blue, and dark), Window-to-Wall Ratio (WWR) of 15%, 50%, 75%, and indoor wall finish (light, moderate, dark) colors. These were compared to the Leadership in Energy and Environmental Design (LEED) daylighting quality thresholds. The results revealed that clear glazing paired with high WWR (75%) achieved the highest Spatial Daylight Autonomy (sDA), reaching up to 92% in living spaces. However, this also led to elevated Annual Sunlight Exposure (ASE), with peak values of 53%, exceeding the LEED discomfort threshold of 10%. Blue and dark glazing types successfully reduced ASE to as low as 0–13%, yet often resulted in underlit spaces, especially in private rooms such as bedrooms and bathrooms, with sDA values falling below 20%. A 50% WWR emerged as the optimal balance, providing consistent daylight distribution while maintaining ASE within acceptable limits (≤33%). Similarly, moderate color wall finishes delivered the most balanced lighting performance, enhancing sDA by up to 30% while controlling reflective glare. Statistical analysis using Pearson correlation revealed a strong positive relationship between sDA and ASE (r = 0.84) in highly glazed, clear glass scenarios. Sensitivity analysis further indicated that low WWR configurations of 15% were highly influenced by glazing and finishing types, leading to variability in daylight metrics reaching ±40%. The study concludes that moderate glazing (blue), medium WWR (50%), and moderate color indoor finishes provide the most robust daylighting performance across diverse room types. These findings support an evidence-based approach to façade design, promoting visual comfort, daylight quality, and sustainable building practices.

1. Introduction

Daylight is a vital component of design that significantly influences visual quality, energy performance, and human well-being [1,2]. Previous research has consistently demonstrated that daylit environments contribute to improved cognitive performance, reduced stress, and achieve higher indoor environment satisfaction [3]. However, excessive daylighting can introduce discomfort due to glare and extreme luminance contrasts, which may counteract its intended health and comfort benefits [4,5]. Attaining visual comfort through daylighting is a complex and multifaceted challenge. It depends on numerous dynamic parameters—such as building orientation, façade geometry, glazing properties, indoor reflectance, and climatic conditions—that interact in non-linear ways [6]. This complexity necessitates a comprehensive, iterative design process supported by rigorous daylight analysis to balance illumination levels, mitigate glare, and harmonize spatial aesthetics with functional requirements [7]. This is where daylight analysis becomes essential in transforming intuitive design into data-informed decision-making. Through computational simulation and performance-based metrics such as Spatial Daylight Autonomy (sDA) and Annual Sunlight Exposure (ASE), designers can evaluate the quantity and quality of daylight distribution within a space over time [8].

2. Reviewing Daylighting-Design and -Measurement Metrics

2.1. Daylight Metrics

There are several metrics proposed to assess daylighting such as Candella (Cd), Useful Daylight Illuminance (UDI), Spatial Daylight Autonomy (sDA), and Daylight Factor (DF), while others have been proposed to measure glare such as Daylight Glare Probability (DGP) [9]. Nevertheless, it is noted that the sDA and ASE were prioritized because they simulate daylight hourly over an entire year using real climate data. This makes them more accurate and meaningful, especially in sunny or variable climates where daylight performance fluctuates dramatically [9]. An sDA is defined by the IES Committee as the percentage of the area that has a minimum daylight illuminance level of 300 lux for at least 50% of occupied hours during the year. In order to receive LEED points, a project must attain sDA300/50% for at least 40% of the occupied floor area to qualify for 1 LEED point, and 55% to qualify for 2 LEED points (accepted range of IES [10]), or 75% to qualify for 3 LEED points (preferred range of IES [10]) [11].
Visual comfort is defined as the absence of discomfort such as glare, insufficient visual contrast or the presence of visible direct sunlight. It was proposed by the IES Committee [10] as the percent of floor area that receives at least 1000 lx for at least 250 occupied hours per year. Also, LEED v4.1 stipulates an ASE1000/250 upper limit of no more than 10% of the occupied area [12].
These provide sufficiency metrics (e.g., sDA) to assess whether daylight levels meet occupant needs for visual tasks and satisfaction. They also provide discomfort metrics (e.g., ASE) to evaluate glare and over-illumination risks that may impair visual quality. By focusing on sDA and ASE, this study ensures alignment with recognized sustainability benchmarks while addressing both daylight adequacy and occupant comfort [13].

2.2. Design Considerations for Daylighting and Visual Comfort

2.2.1. Glazing Type and Properties

The proper selection of the glazing system is of major importance for improving a building’s thermal and daylighting performance [14]. There are properties for glazing that should be taken into consideration to enhance the performance of daylighting and visual and thermal comfort. This includes Solar Heat Gain Coefficient (SHGC), thermal transmittance (U-value), and visible light transmission (VLT) [15,16,17]. We note that high VLT and low SHGC should be achieved [15]. In this regard, an experimental study for an office building tested the performance of three different types of glazing: double clear, double clear low-E, and double low-E with a selective coating [18]. The result showed that the latter achieved the least energy consumption, which indicated that glazing type has a great impact on energy consumption and shade control. Another study examined five distinctive types of glazing systems: double 8 mm blue-tinted panels with a 16 mm argon-filled hollow space, ultra-clear, clear, mild grey, silver grey, and silver, in an office building located in New Cairo [19]. The results showed that the blue-tinted panel showed the highest Useful Daylight Illuminance (UDI) values; however, it resulted in poor light uniformity ratio (LUR) and thermal overall performance. Both the clear and ultra-clear glazing systems achieved high daylighting and thermal performance. Also, the light grey glazing system showed a balanced performance, whilst the silver grey and silver glazing systems resulted in poor daylighting and thermal performance.

2.2.2. Window-to-Wall Ratio

The Window-to-Wall Ratio (WWR) plays a critical role in balancing daylight provision and visual comfort in buildings [20,21]. A well-optimized WWR ensures sufficient natural light penetration, enhancing spatial illumination, while minimizing risks of glare [22]. This depends on many factors including the building function, as well as climatic and contextual considerations [21,23]. Studies indicate that increasing WWR generally improves daylight autonomy but only up to an optimal threshold (~30–40% for most climates), beyond which excessive solar gain and glare may compromise comfort [20]. For instance, a previous study pinpointed that hot climates require careful WWR adjustments to meet sDA300,50% without exacerbating ASE1000,25% [4]. Conversely, insufficient WWR can lead to underlit spaces, increasing reliance on artificial lighting [24]. Advanced parametric tools now enable dynamic WWR optimization by integrating climate-specific data, occupant preferences and façade geometry, thereby harmonizing daylight sufficiency with visual comfort [25]. This underscores WWR’s dual function as both a design lever for daylighting and energy efficiency, and a determinant of occupant well-being [5].

2.2.3. Indoor Wall Finishes

By complementing façade design, indoor finishes act as passive daylighting tools, ensuring occupant satisfaction and alignment with sustainability standards like LEED and WELL [12,26]. The key to this is to investigate the contribution of proper indoor material selection to achieve IEQ [27]. Indoor wall finishes play a critical role in enhancing daylighting performance and visual comfort by influencing light distribution, reflectance, and glare control [28]. The reflectance properties of these surfaces determine how daylight is absorbed or redistributed across a room. Light colored or high-reflectance finishes (e.g., white paint, matte plasters) amplify daylight penetration, reducing the need for artificial lighting while improving spatial brightness uniformity. Conversely, darker finishes absorb light, creating contrast and potential visual discomfort if not balanced properly. Additionally, textured or diffusive materials (e.g., light wood, brushed plaster) can soften harsh sunlight, minimizing glare and improving visual comfort [28]. Strategic selection of wall finishes—guided by reflectance values (e.g., 70–80% for optimal daylight diffusion)—can thus optimize sDA and mitigate ASE risks [4].

2.3. Research Gaps and Scientific Contribution

Many earlier studies [25,29,30] prioritized energy efficiency and thermal comfort, often overlooking occupant-centered metrics such as sDA and ASE that align with LEED daylighting criteria. For instance, a previous study [25] explored optimal double-skin south-facing façades tailored for Egypt’s hot climate with reference to LEED targets, but their study did not address the combined impact of façade form, material reflectivity, and indoor color finishes on daylight quality. Similarly, another study utilized parametric tools such as Rhino–Grasshopper to optimize apartment window dimensions through genetic algorithms, yet their focus remained algorithmic, with minimal engagement in LEED or occupant comfort frameworks study [17]. Also, previous studies have introduced a design-evaluation framework for classrooms with an emphasis on thermal performance, but without a detailed investigation into façade color or daylight-centric metrics [13,31]. On a more daylight-specific front, a previous study acknowledged the potential of façade design to enhance daylight delivery but did not quantify this in terms of LEED-compliant sDA and ASE thresholds [32]. Another scholar proposed an adaptive responsive façade system modeled parametrically to maximize sDA while ensuring ASE remained under 10%, directly addressing both visual comfort and daylight sustainability goals [33]. Table 1 summarizes the studies mentioned above:
This summary shows that prior research [18,36,40] has contributed significantly to the development of façade-optimization strategies. Nevertheless, the holistic integration of façade geometry, material reflectivity, and surface color in relation to daylight performance and user satisfaction are underexplored. Furthermore, while previous studies have evaluated daylight-optimization strategies using Rhino–Grasshopper, Radiance, or DIVA tools, few have focused on BIM-native solutions such as Revit-Insight. These conduct the daylight analysis directly within the BIM platform, utilizing the embedded model data for simulation without the need for external export, which minimizes the chances of data loss [39].
Thus, this study aims to develop and validate an optimized façade-design methodology to improve daylight performance in small-scale residential buildings, leveraging parametric modeling and simulation tools. This is through analyzing the dynamic relationship between façade configurations and indoor daylight distribution using BIM-based simulation. The findings are statistically validated using Pearson correlation and sensitivity analysis. This contributes to evidence-based design strategies for enhancing daylight autonomy while adhering to established benchmarks, such as the Leadership in Energy and Environmental Design (LEED) version 4.1, Indoor Environmental Quality (IEQ) category [11], and the Illuminating Engineering Society (IES) [10] daylight performance standards.

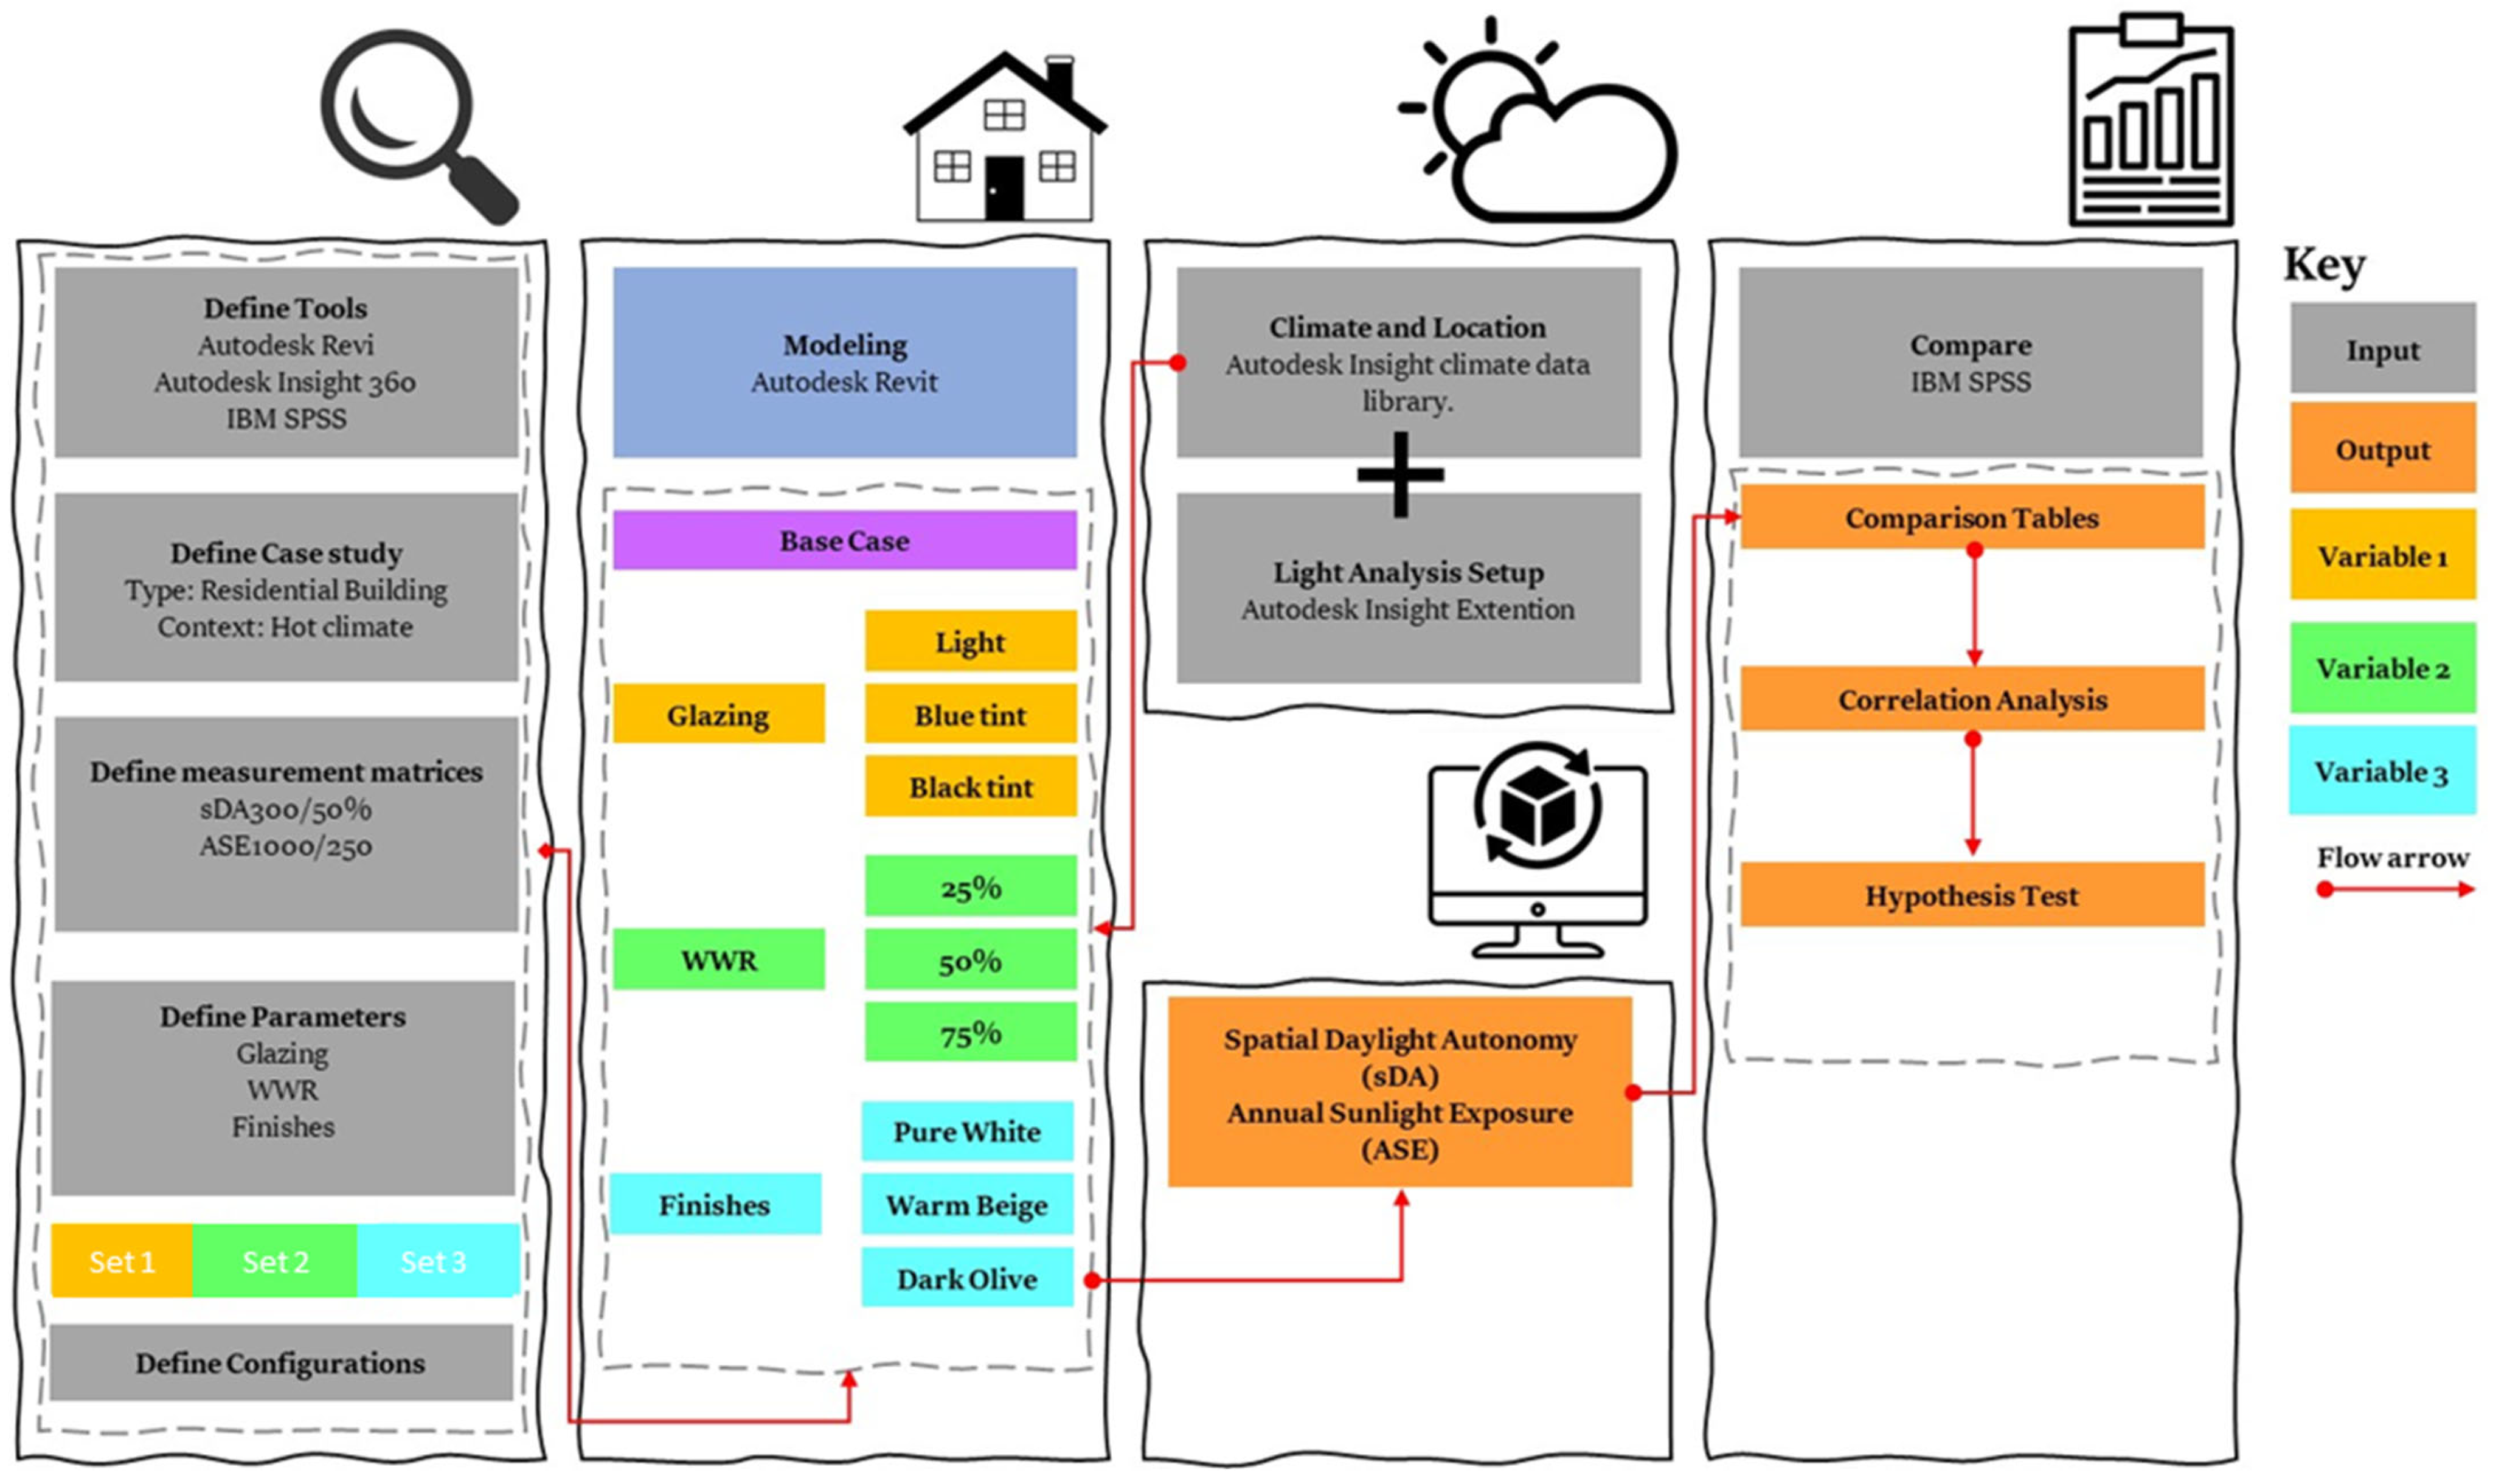
3. Materials and Methods

The research methodology comprises the steps demonstrated in Figure 1.

3.1. Determing Independent and Dependent Variables

The independent variables influencing daylight performance were selected based on previous studies as follows: Glazing type (3 levels) [18], WWR (3 levels) [21], and indoor wall finishes (3 levels) [28]. This yielded 27 potential combinations, among which nine representative scenarios were selected to represent variable interactions of architectural design scenarios in hot climates. The approach enabled the assessment of not only the individual influence of each design variable but also the interactions among them. This selection reflected their direct influence on daylight penetration, visual comfort, and energy efficiency [2,22,41].
The choice of glazing types was informed by thermal comfort considerations, and reflects commercially available and cost-effective choices within the Egyptian construction market [5,18], as follows:
  • Clear glazing represents high transparency, high VLT, but higher SHGC, which may increase cooling loads. This type is often used in designs prioritizing maximum daylight access [18].
  • Blue glazing represents a mid-range solution that balances daylight entry with moderate solar control. Blue tints are commonly used in contemporary architecture due to their aesthetic appeal and improved glare control [18,31].
  • Dark glazing represents high-performance solar control glass. It has low VLT, minimizing glare and heat gains, but often at the cost of natural illumination [18].
WWR was based on benchmarks in energy codes and façade-design practices [21], as follows:
  • 15% WWR represents a conservative, energy-conscious envelope with minimal glazing. It is typical in traditional or thermally controlled buildings.
  • 50% WWR represents a balanced fenestration that allows adequate daylight while maintaining acceptable energy and glare performance.
  • 75% WWR represents a highly glazed façade, common in modern and luxury housing. It maximizes views and daylight but introduces higher risks of glare and overheating.
Indoor wall finishes were selected based on common paint reflectance values found in residential buildings [28], as follows:
  • Light colored (white) finishes have high reflectance (>80%), maximizing internal daylight bounce and illumination. They are often used in minimalist or daylight-optimized designs.
  • Moderate colored (beige or gray) finishes reflect medium light levels (~50–60%), representing the most typical real-world residential wall color. They provide a balance of brightness and visual comfort.
  • Dark colored finishes (deep gray or earthy tones) have low reflectance (~20–30%), representing trend-driven aesthetics, or spaces where a subdued ambiance is desired. These finishes reduce glare but also limit daylight diffusion.
The dependent variables were selected based on LEED and IES Committee to be:
  • sDA% of floor area receiving ≥ 300 lux for ≥50% of occupied hours annually.
  • ASE% of floor area receiving > 1000 lux for ≥250 h annually.
They both provide a comprehensive, time-integrated assessment of daylight availability and visual comfort. Together, they offer a holistic view—ensuring not just daylight access, but daylight quality [42].

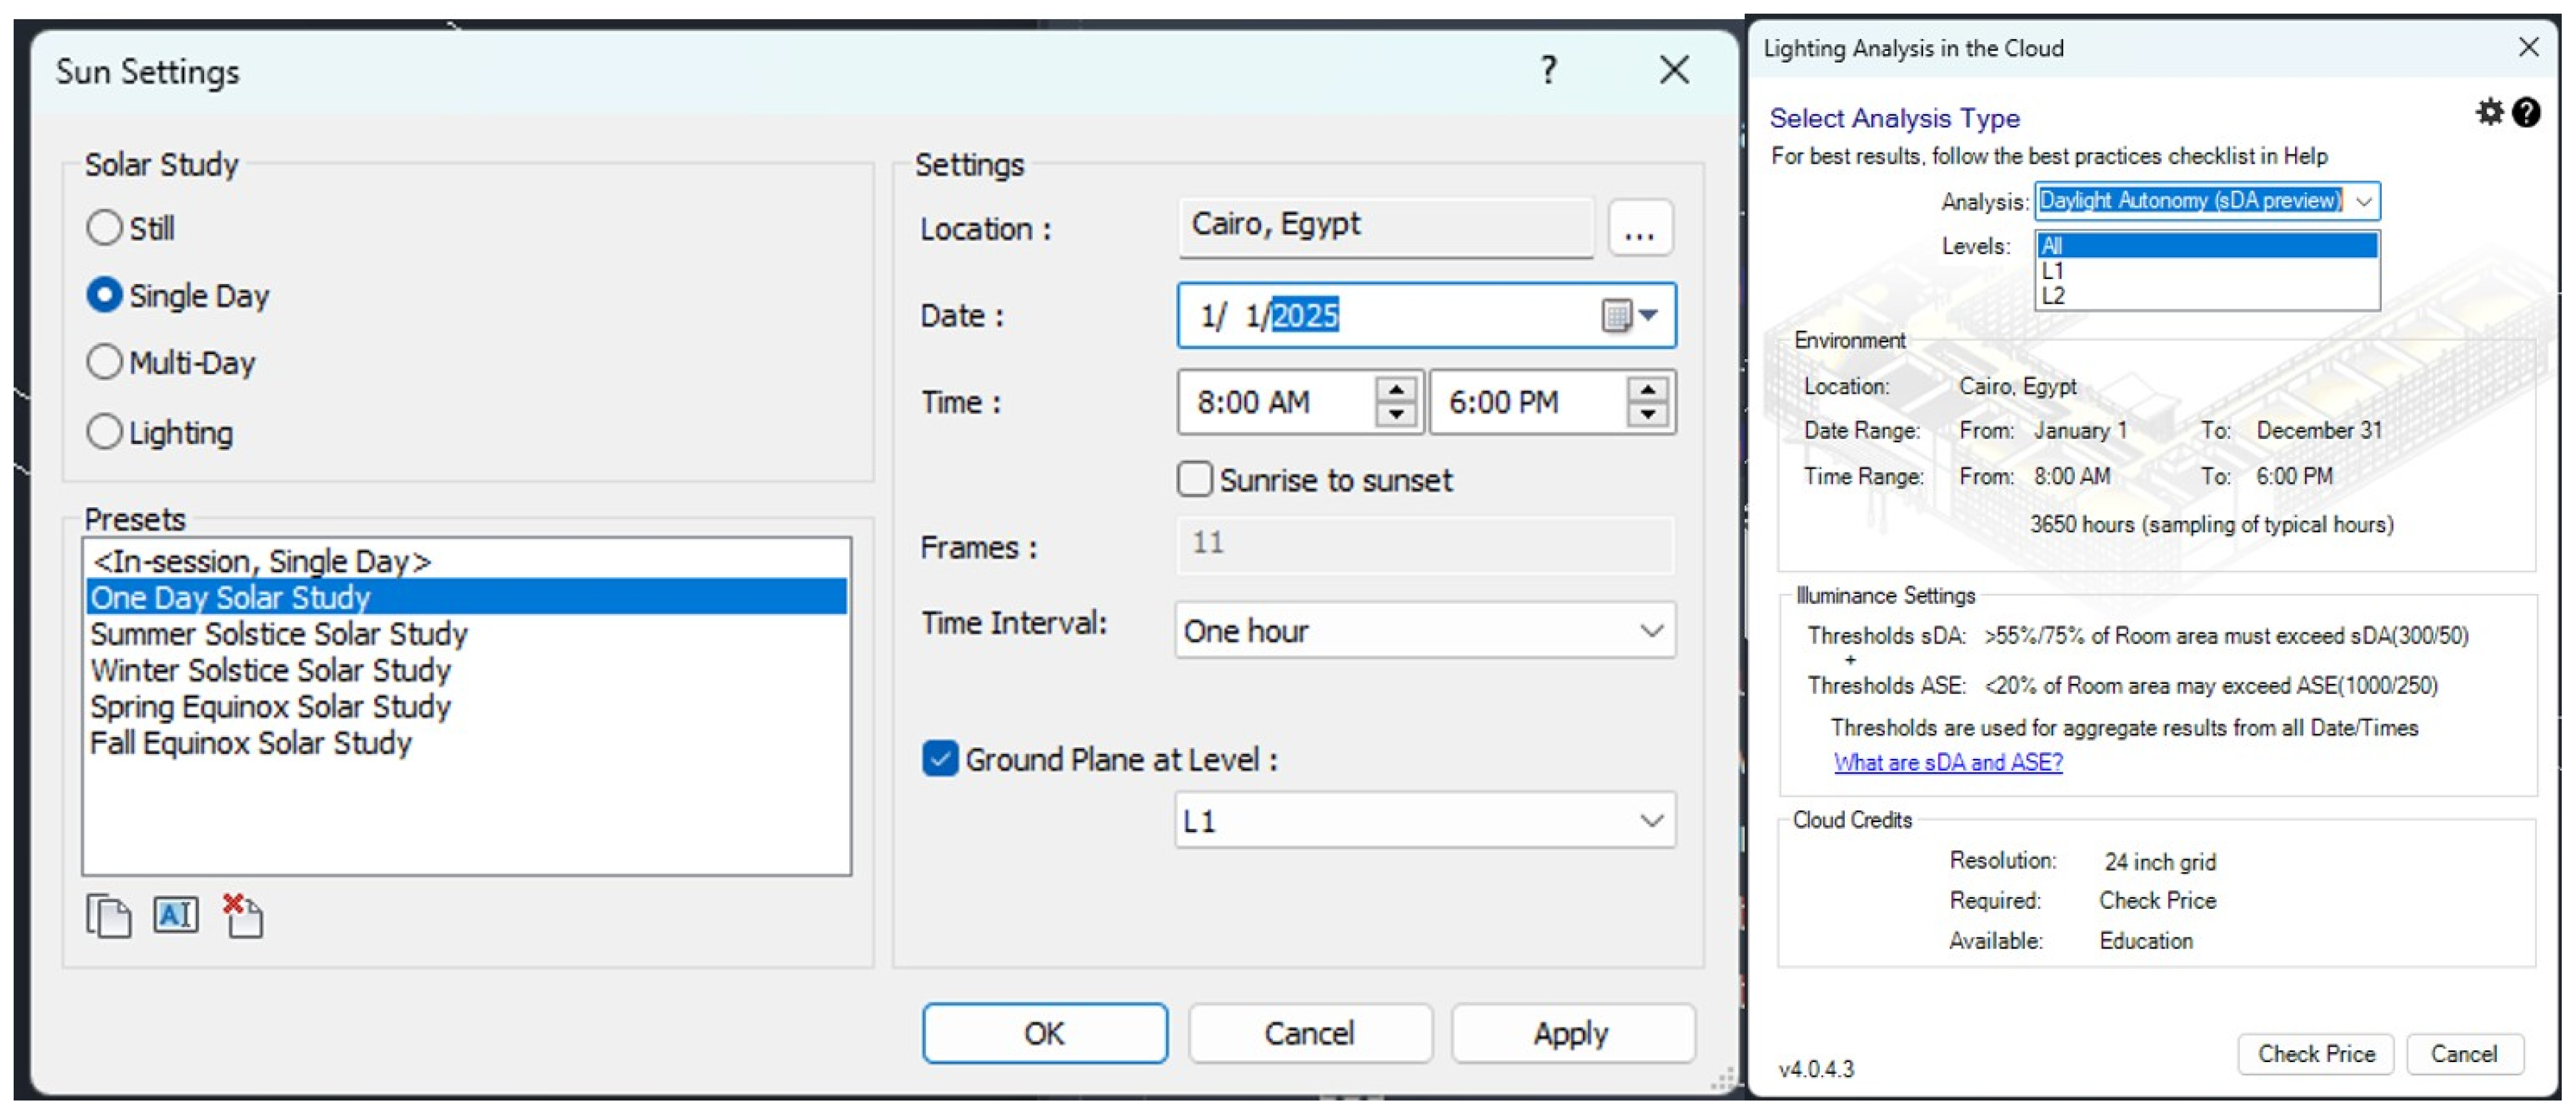
3.2. BIM Modeling and Parameter Control

The case study is a typical two-story single-family residential unit in Egypt. The building is 3 m in height, situated in a low-rise, semi-urban environment. It is oriented towards the east, with the façade wall oriented initially toward the north direction. This exposes key living areas to direct solar radiation, while secondary spaces are distributed along the north and south sides.
The building was modeled in Autodesk Revit 2026. The main test room located on the ground floor is the reception area of 5.2 m × 9.1 m. Other test rooms on the second floor are the living area of 7.1 m × 5.2 m, and the bedroom of 3.4 m × 3.4 m.
The main façade includes a curtain wall placed centrally in both floors, with varying dimensions to meet the WWR targets for each scenario, and no shading devices were assumed for any opening. The model geometry (including walls, floors, ceilings, and glazing elements) was constructed using parametric families to allow for consistent adjustment across design iterations. Three different glazing materials were defined in the Revit material browser as follows:
  • Clear glass: VLT ≈ (0.60), SHGC (0.40);
  • Medium tint glass: VLT (0.40), SHGC (0.30);
  • Dark tint Ggass: VLT (0.20), SHGC (0.20).
The WWR was determined by resizing the window family while keeping sill height constant at 0.7 m in addition to editing curtain wall dimensions versus glazing ratios. The ratios were calculated by dividing the glazing area by the total wall area.
Three different matte wall colored materials were defined in the Revit material browser as follows:
  • Light colored finishes (white, off-white);
  • Moderate finishes (beige, pastel tones);
  • Dark colored finishes (grey, brown, olive, charcoal).
All simulations were conducted using the Cairo, Egypt EPW weather file, accessed via Autodesk Insight’s climate data library as shown in Figure 2. The simulations utilized Typical Meteorological Year data from the EnergyPlus/EPW database for the studied location.
The Lighting Analysis tool within Revit was enabled through Insight’s cloud-based simulation interface. Simulation settings included:
  • Sky condition: climate-based annual simulation for sDA and ASE.
  • Grid resolution was set as 0.5 m × 0.5 m with sensor height at 0.8 m from floor level. The choice of the 0.5 sensor-grid resolution balances computational efficiency and accuracy in daylight simulations. The height selection matches average work plane elevation and aligns with EN 12464-1/CIE recommendations for task lighting.
  • Simulation dates: one-day solar study, repeated on 21 March, 21 September, 21 June, and 21 December, from 8:00 AM to 6:00 PM, with a one-hour time interval frame.

3.3. Statistical Validation in SPSS

Descriptive statistics (mean, standard deviation, minimum, maximum, and range) were calculated for each daylight metric to characterize the overall behavior of the dataset.
Inferential statistical methods were applied to pinpoint trends in daylight distribution and glare potential under different configurations across multiple room types. Pearson’s correlation coefficient (r) was employed to assess the strength and direction of the linear relationship between sDA and ASE across different design parameters. This parametric test was chosen due to the continuous and approximately normally distributed nature of the variables. The analysis was conducted using Statistical Package for the Social Sciences (SPSS V31) software, with significance thresholds set at p < 0.05. Strong positive correlations indicated that increases in daylight access often accompanied rises in solar overexposure, while weaker or inverse correlations highlighted configurations that achieved better daylight control. In parallel, a sensitivity analysis was conducted to quantify how responsive ASE values were to changes in sDA under each design conditions. This involved calculating the gradient (ΔASE/ΔsDA) for each design configuration to determine the rate of glare increase per unit of daylight gain. High sensitivity values were interpreted as indicative of glare-prone design setups, while lower values suggested more controlled daylight environments. The combined use of Pearson correlation and sensitivity testing allowed for both statistical validation and practical interpretation of façade-performance trade-offs.

4. Results

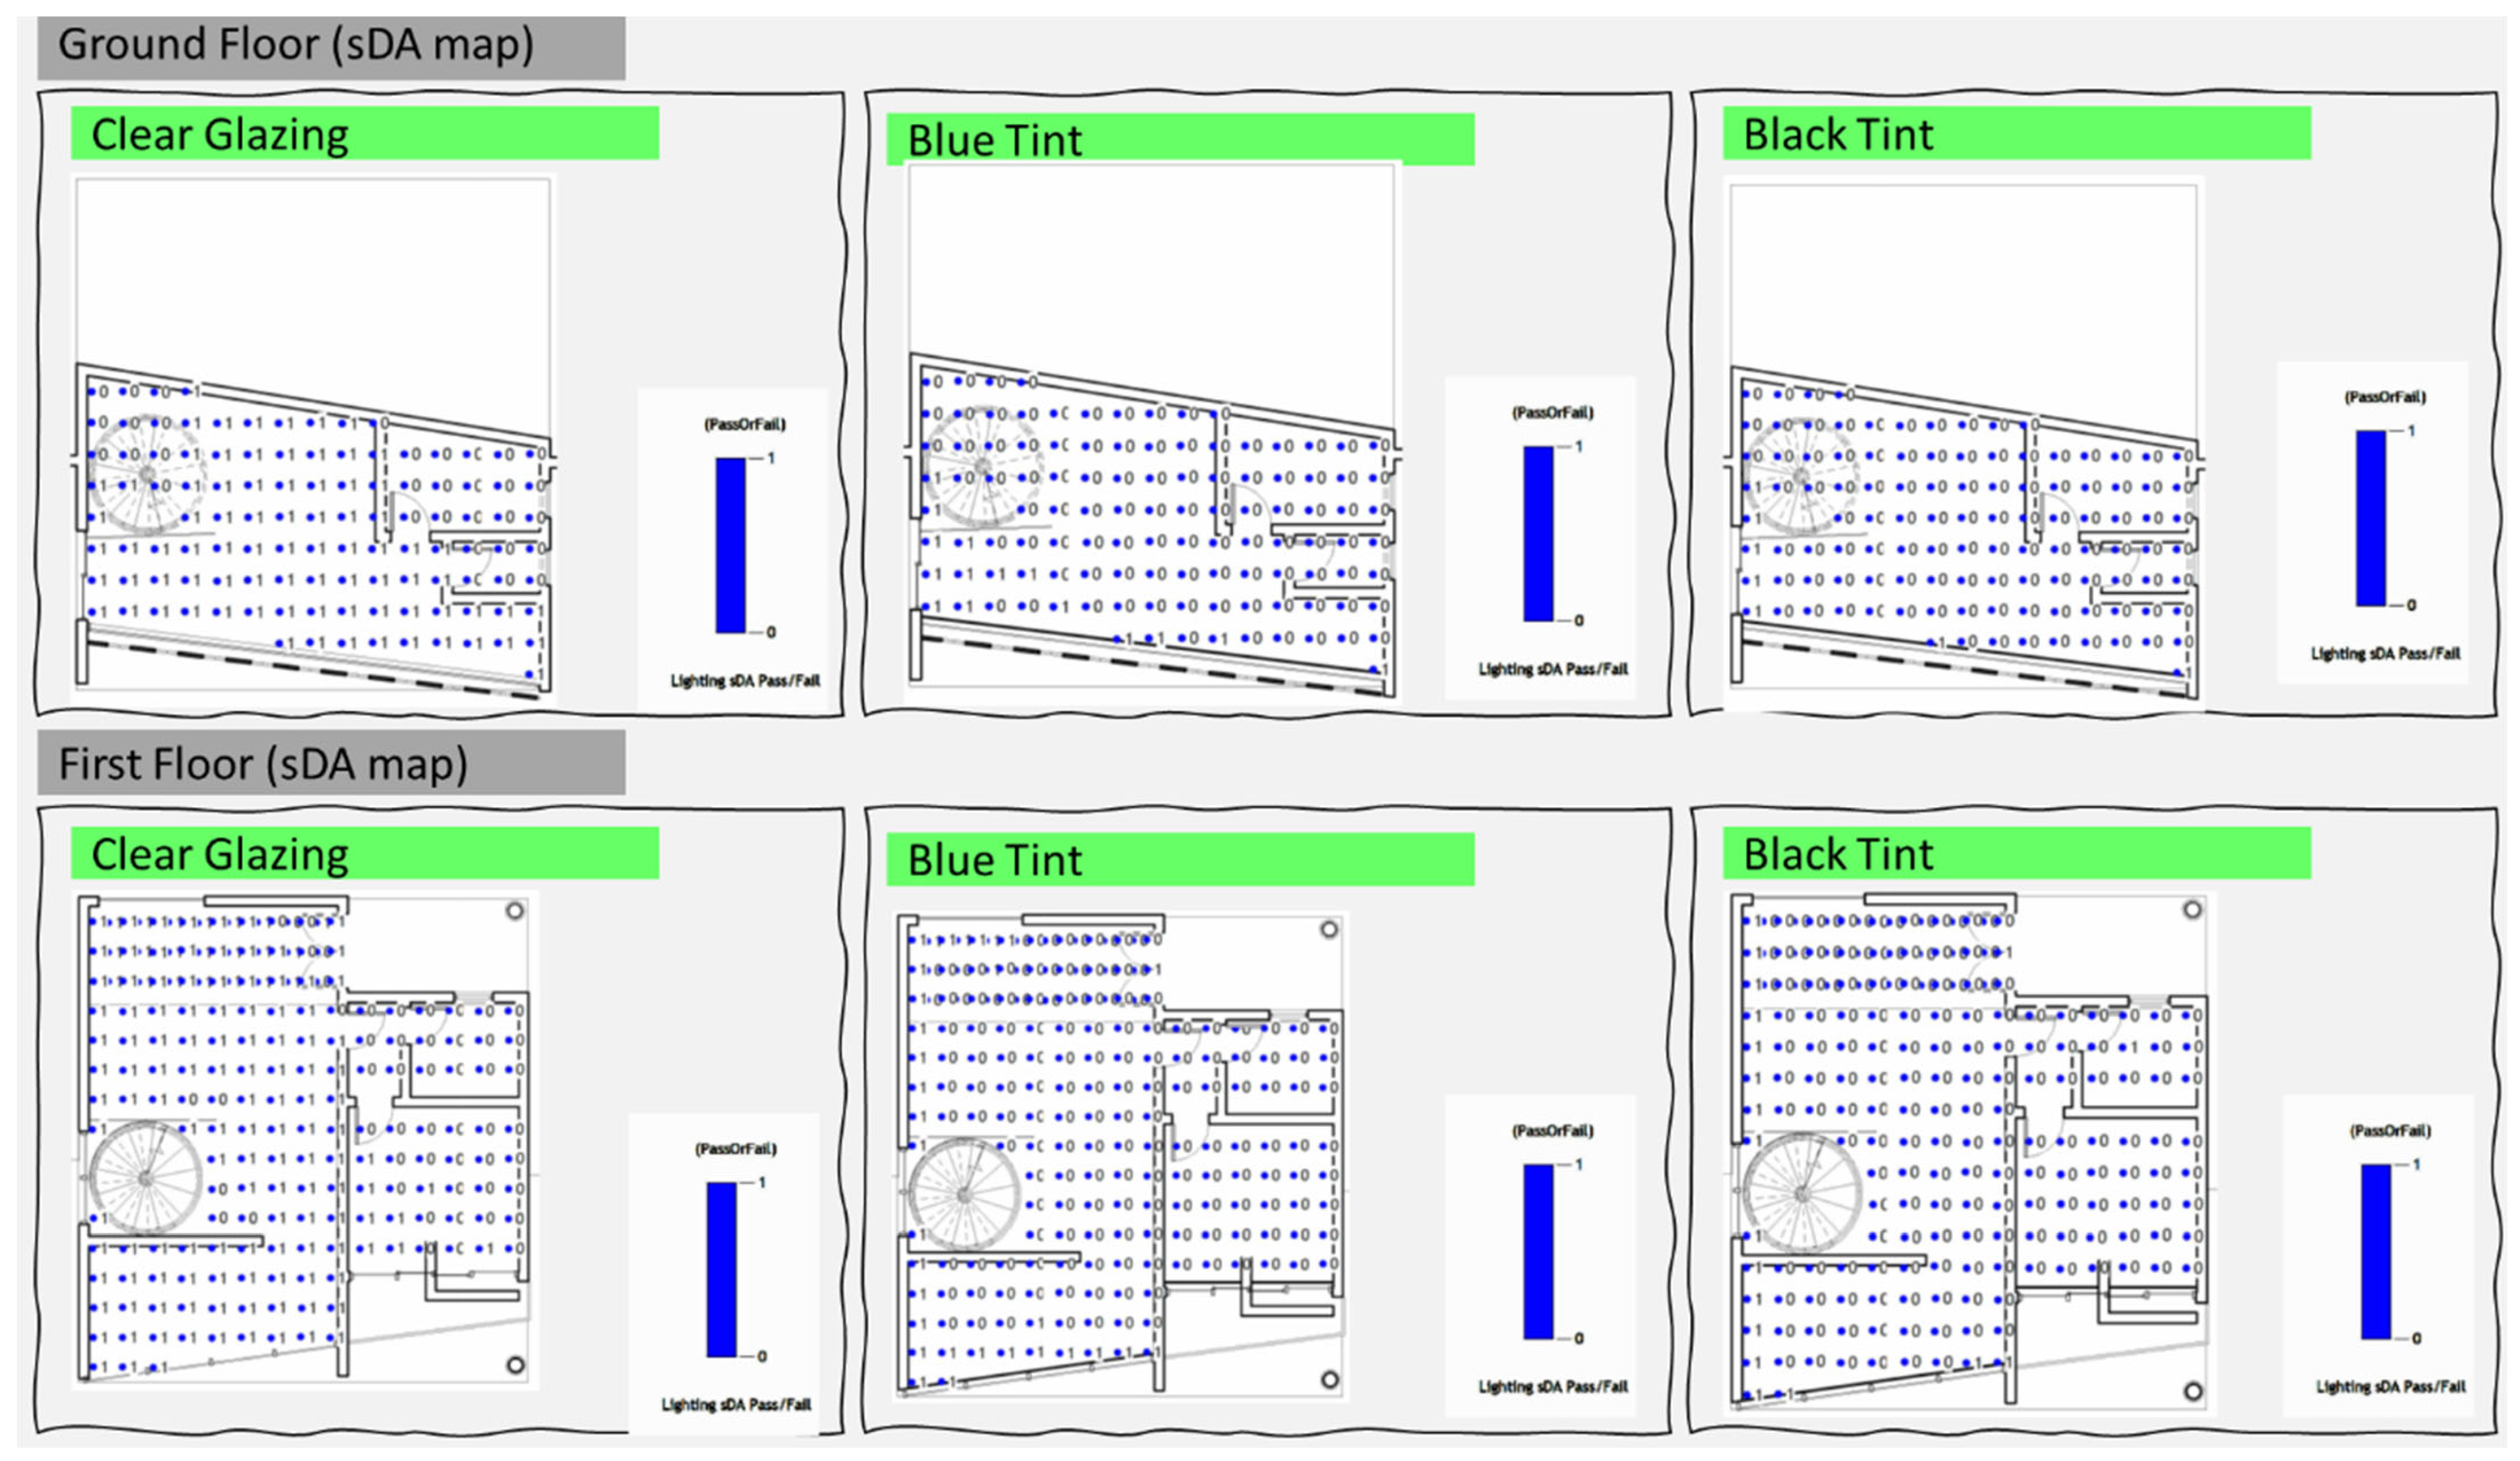
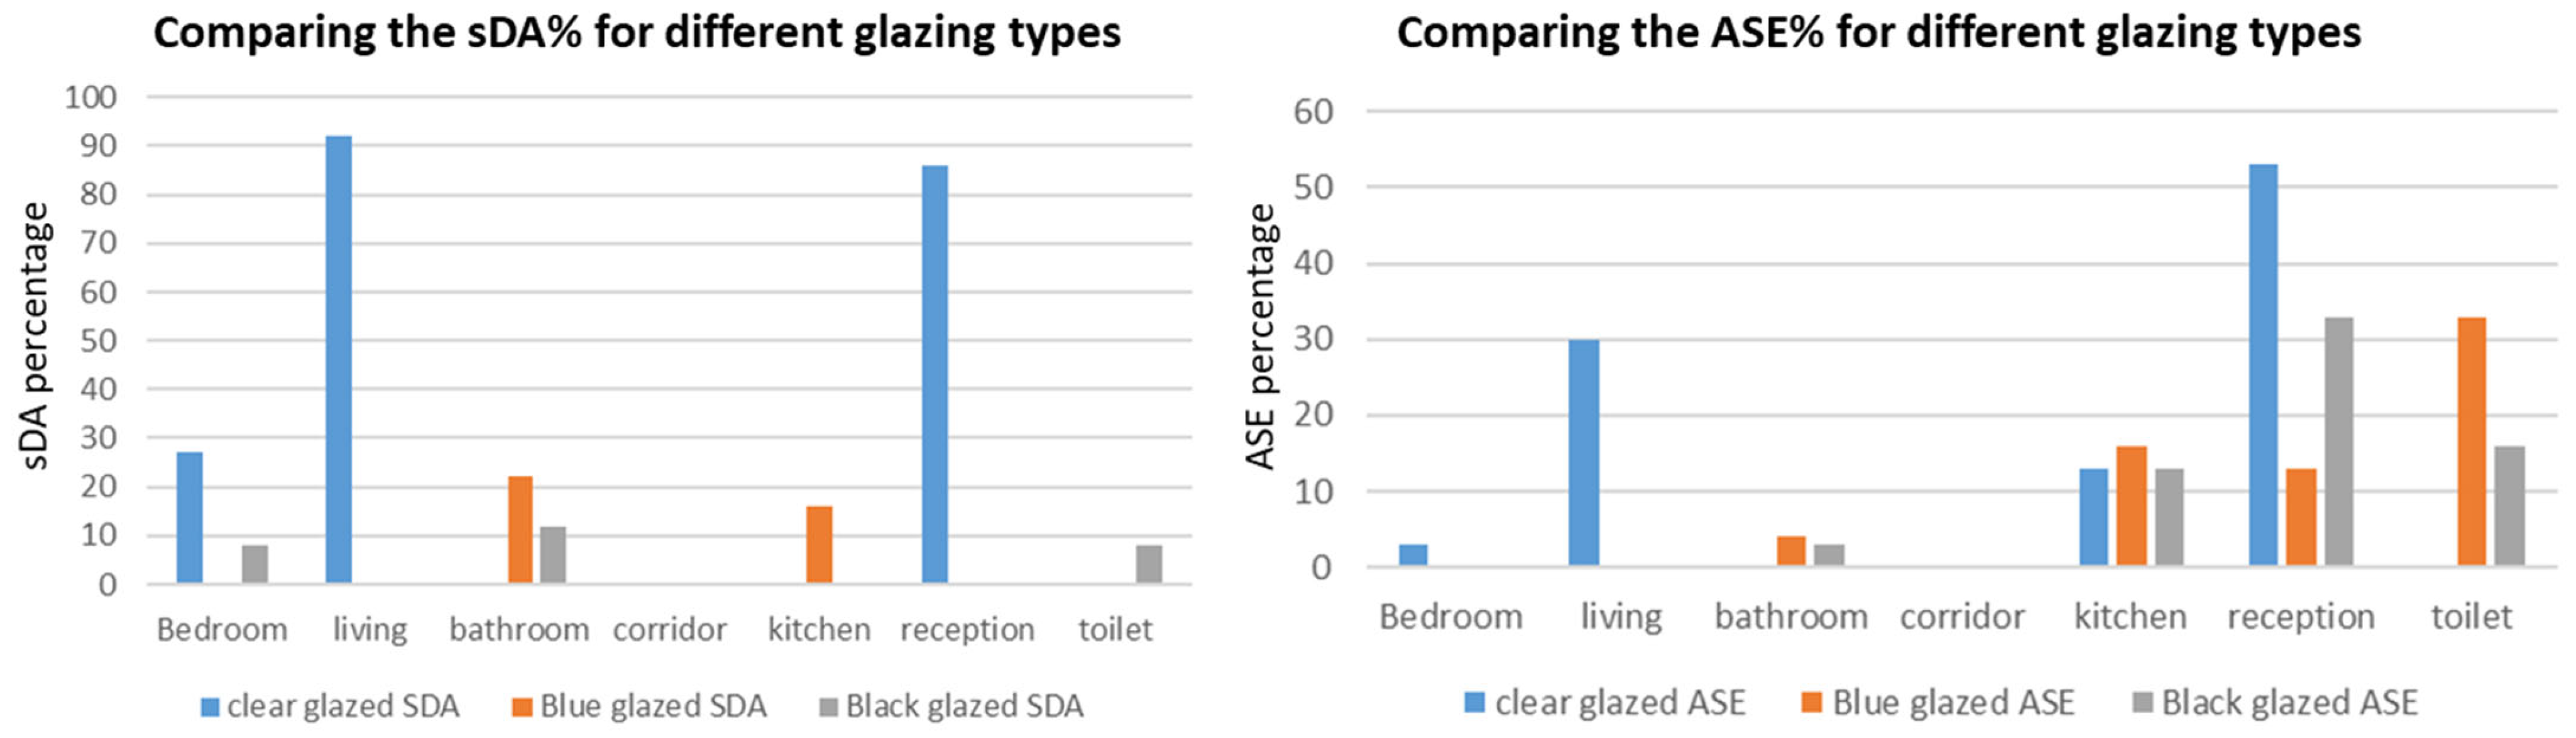
4.1. Analyzing the Effect of Varying Glazing Types

Different glazing types significantly influenced the distribution of daylight. The test models are shown in Figure 3, and their daylight performance for each space is described in Table 2. Comparing the sDA and ASE for different glazing configurations is shown in Figure 4, indicating the following:
  • Clear glazing maximized daylight penetration, achieving sDA values as high as 92% in the living space. However, it also contributed to high ASE values, suggesting increased potential for glare and thermal discomfort.
  • Blue and black glazing demonstrated reduced daylight autonomy, with sDA values not exceeding 22% and 12%, respectively. These configurations were effective in minimizing ASE but often resulted in underlit spaces, indicating limited suitability for primary living areas.

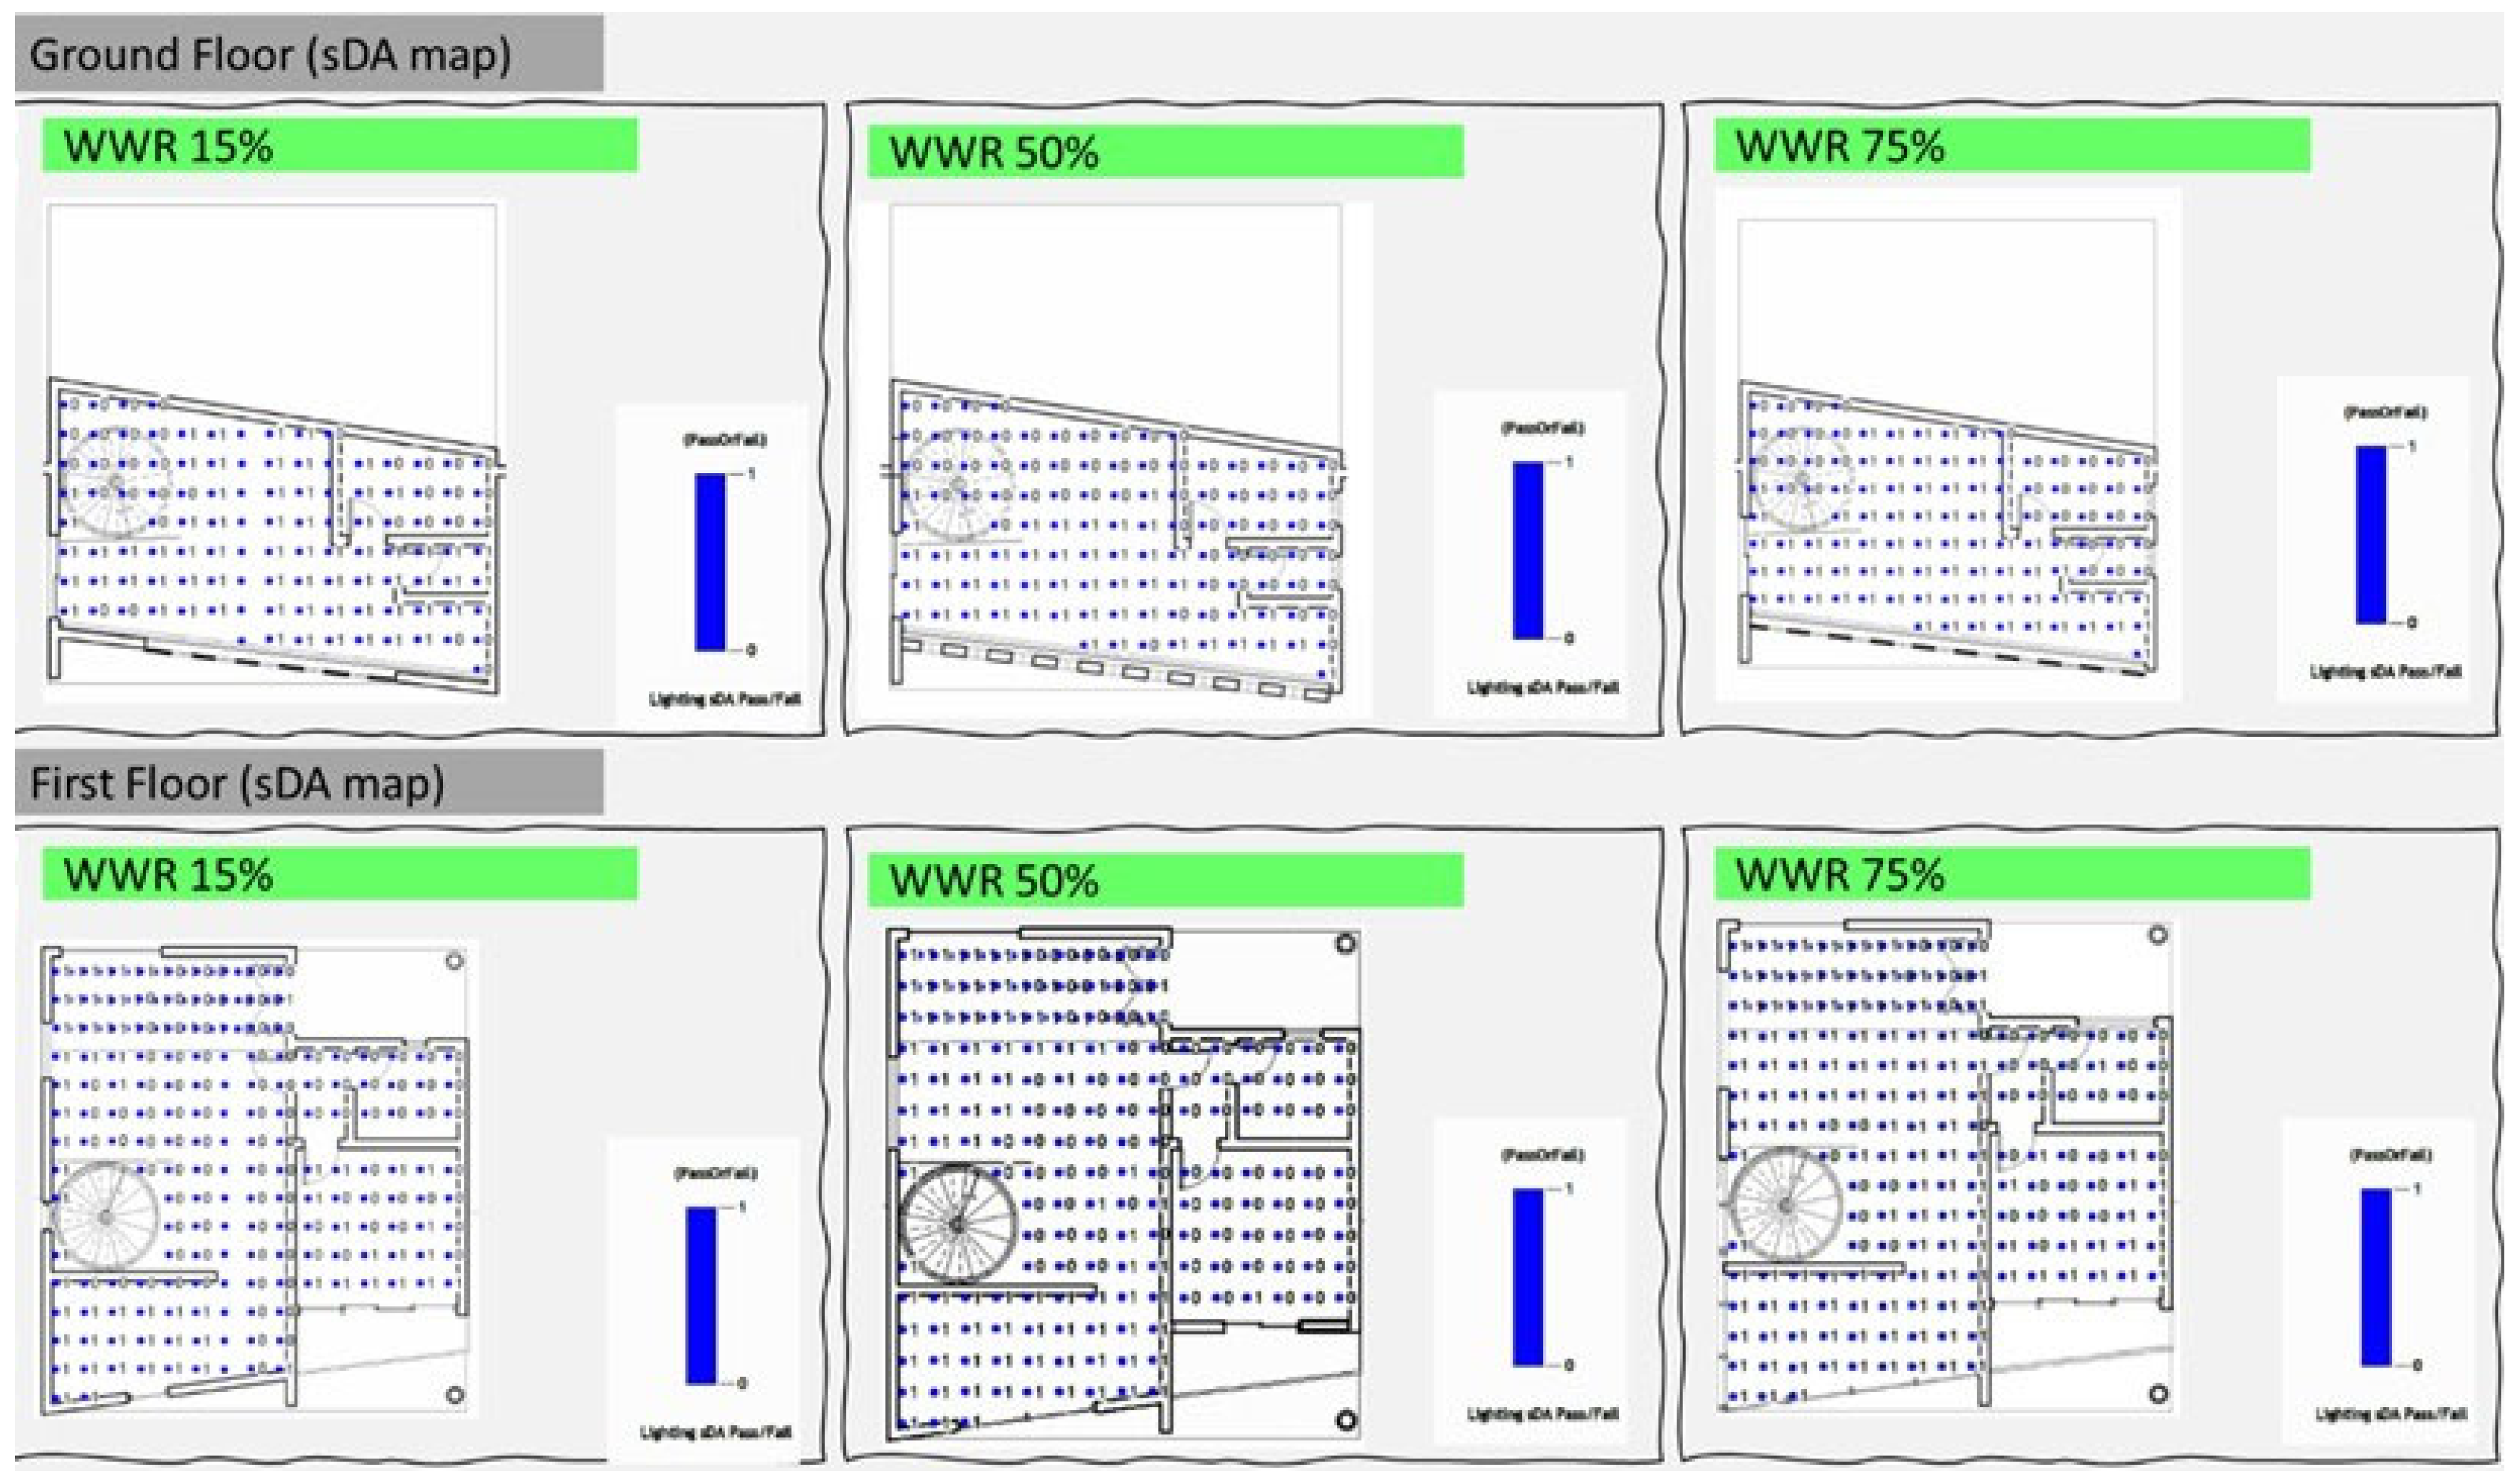
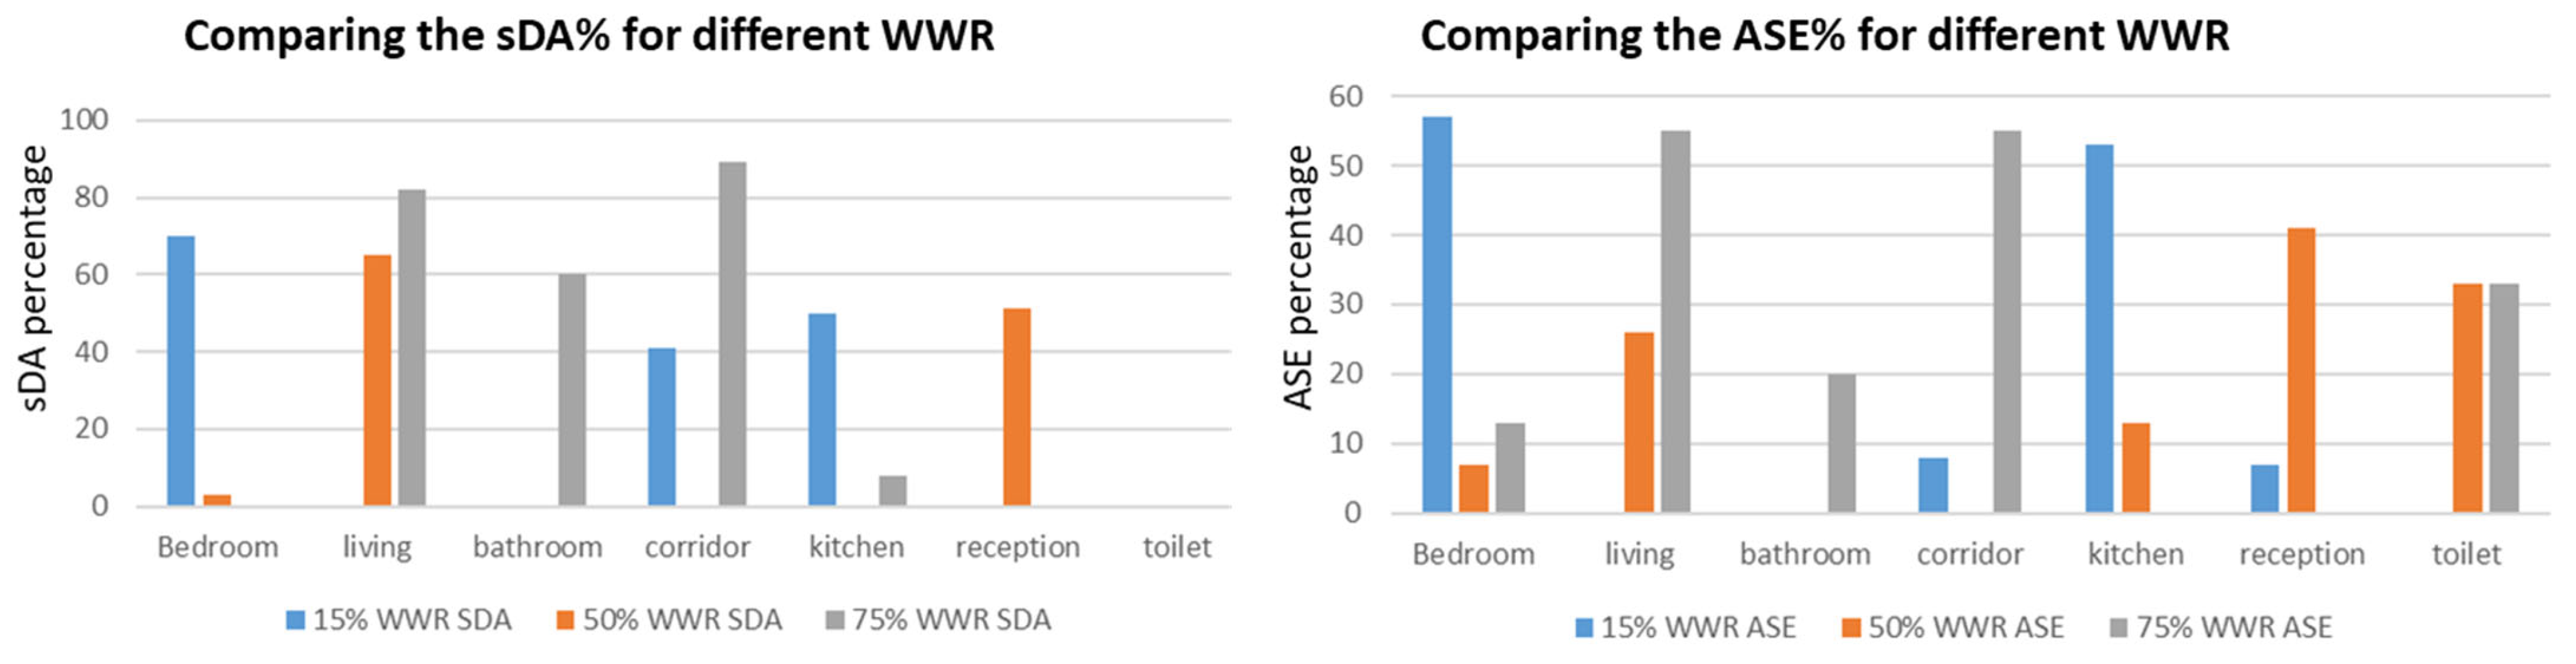
4.2. Analyzing the Effect of Varying WWR

Varying WWRs revealed clear trends in daylight availability. The test models are shown in Figure 5, and their daylight performance for each space is described in Table 3. Comparing the sDA and ASE for different WWR configurations is shown in Figure 6, indicating the following:
  • A WWR of 15% was insufficient for achieving acceptable daylight autonomy in most spaces, despite sometimes leading to high ASE in small rooms such as bedrooms.
  • A WWR of 50% provided an effective balance between sDA and ASE, particularly in the living and reception areas.
  • A WWR of 75% resulted in significantly high sDA across most spaces (up to 89% in corridors and 82% in living rooms), though often at the cost of excessive ASE (up to 55%). This highlights the necessity for additional shading or light-redirection strategies.

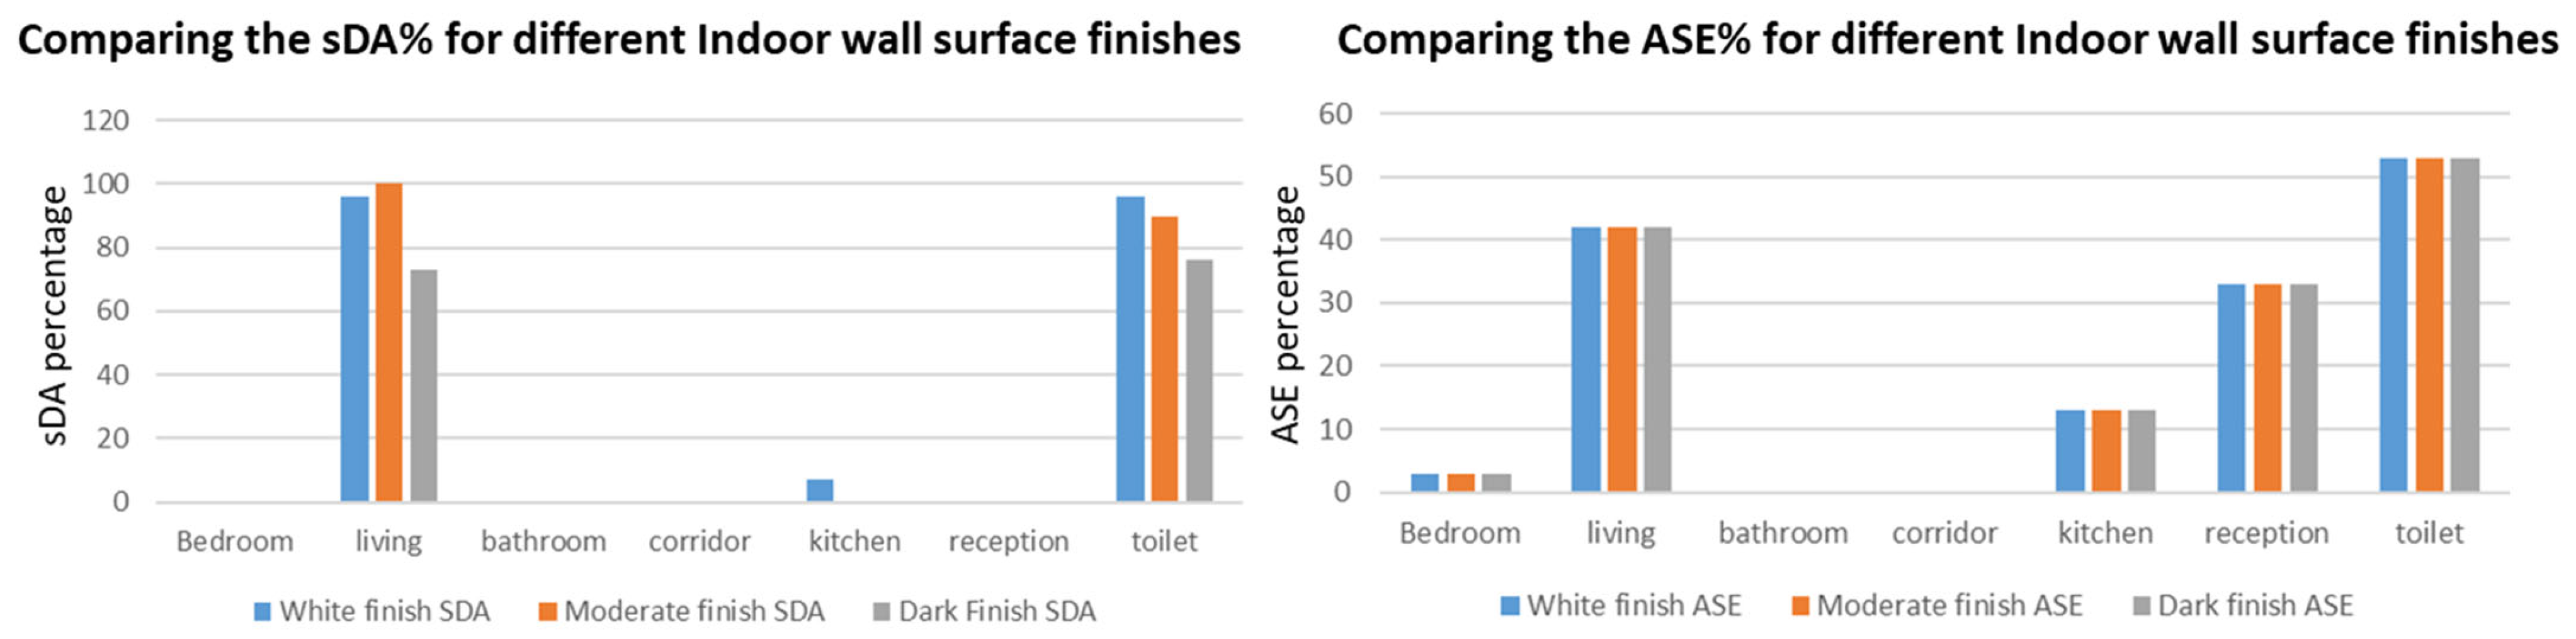
4.3. Analyzing the Effect of Varying Indoor Wall Finish

Indoor surface finishes influenced daylight reflectance and distribution. The test models are shown in Figure 7, and their daylight performance for each space is described in Table 4. Comparing the sDA and ASE for different indoor wall finish configurations is shown in Figure 8, indicating the following:
  • Light colored finishes (white) consistently produced high sDA levels, especially in smaller or enclosed spaces such as toilets and kitchens. However, this came at the cost of elevated ASE levels.
  • Moderate colored finishes (warm beige) provided a balanced daylight environment, achieving high sDA values (up to 100%) with relatively moderate ASE levels.
  • Dark colored finishes (olive green) were most effective in mitigating ASE while maintaining reasonable daylight autonomy, particularly in spaces with large window openings.
The result shows that clear glazing and high WWR maximize daylighting but at the expense of increased glare, requiring shading or light-diffusing strategies. Moderate WWR and surface finishes offer the most balanced performance in terms of daylight spread and visual comfort. Dark finishes and low-transmittance glazing are effective for glare control, though they may require additional daylight support. Designers should align these parameters with room function, orientation, and daylight priorities.

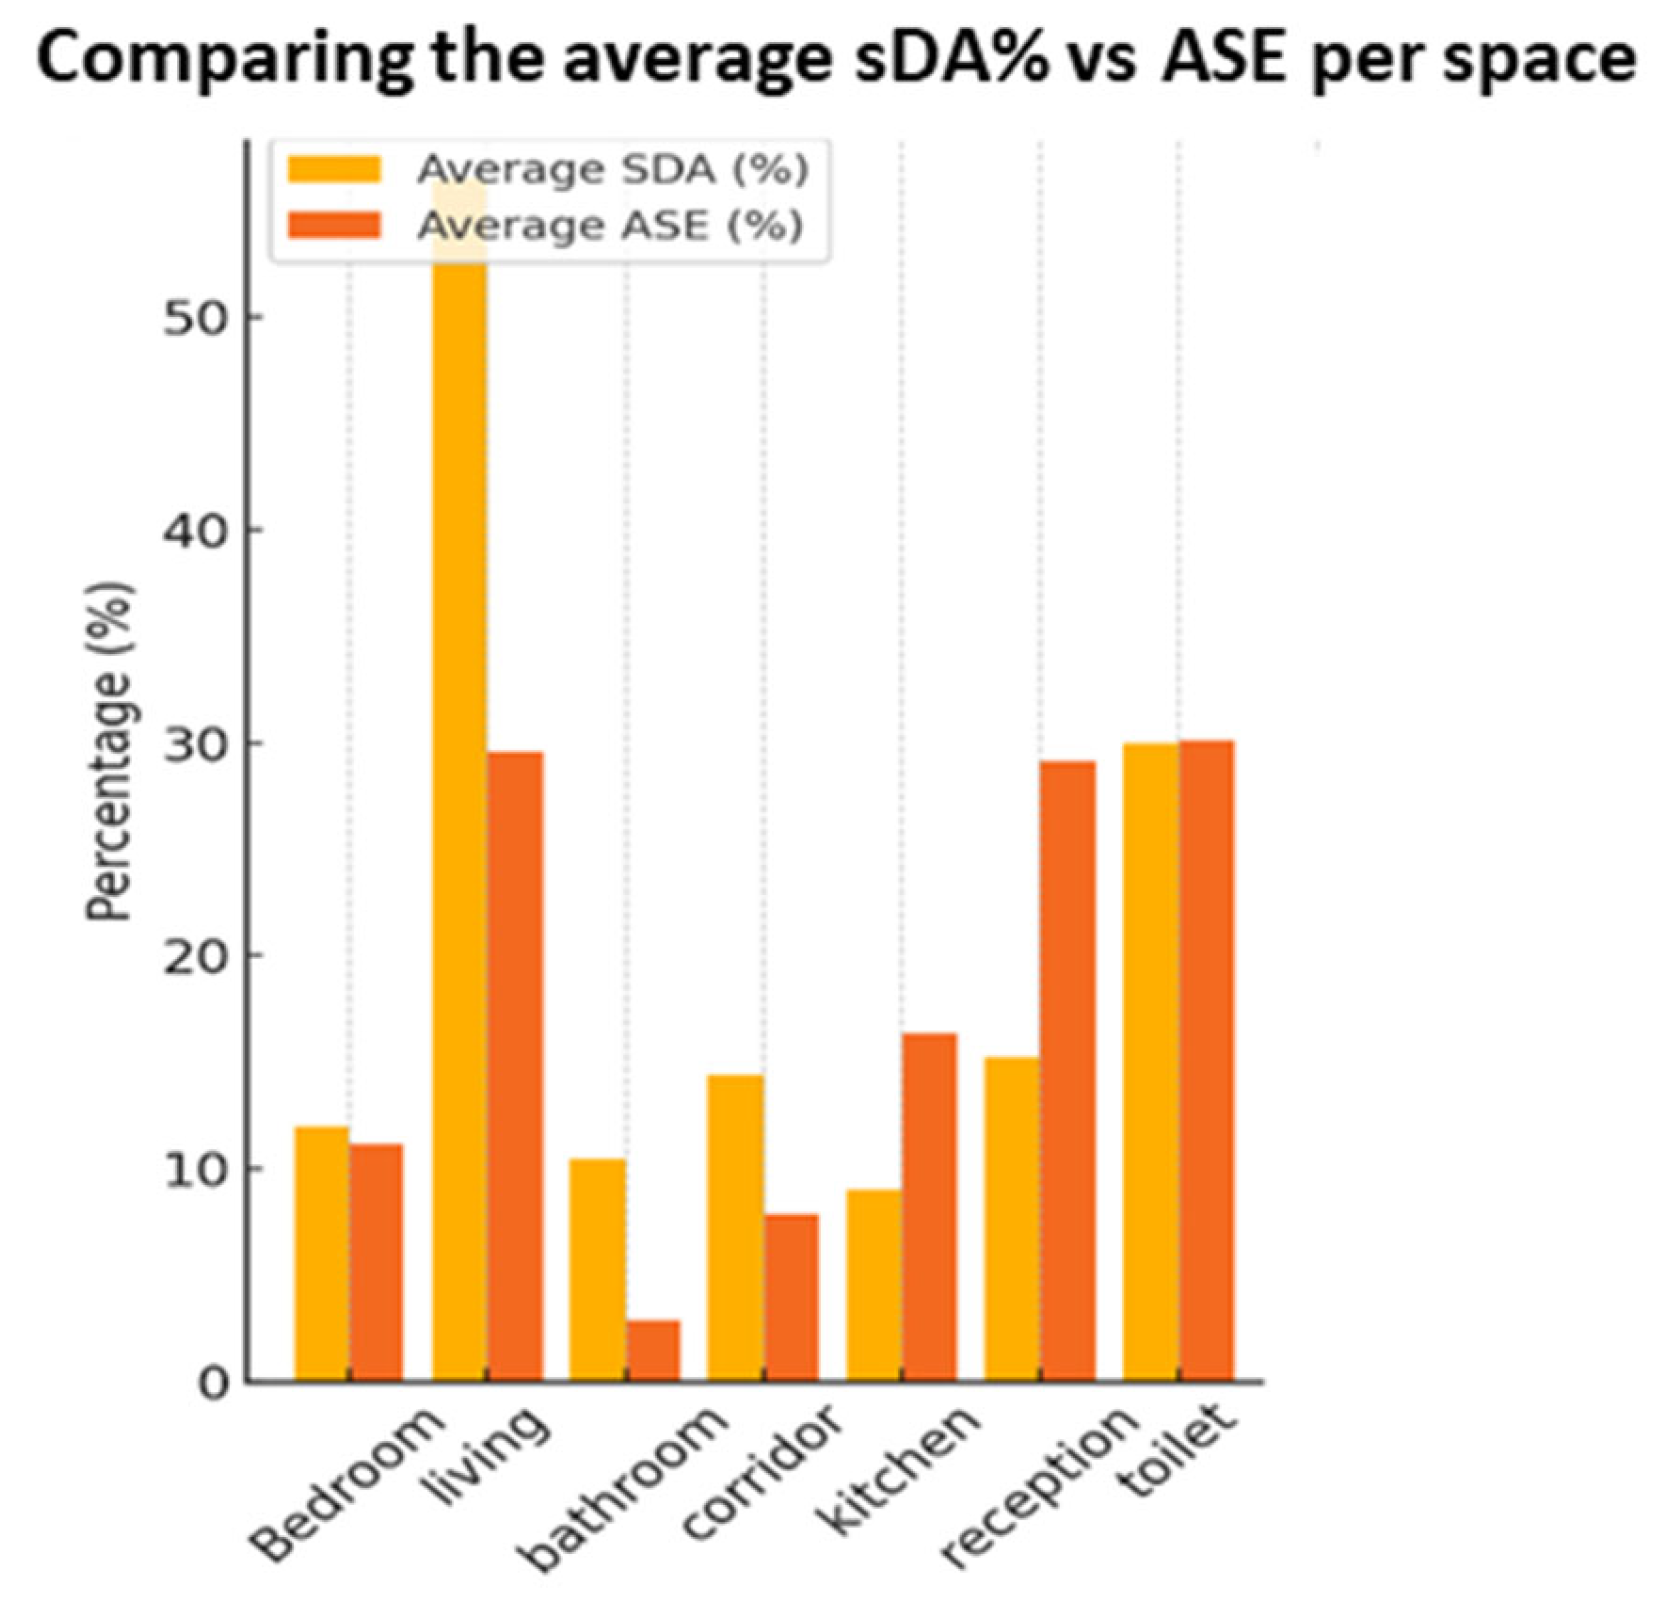
4.4. Analysis of Average sDA Versus ASE per Space

It is important to align façade strategies with room-occupancy patterns. For example, bedrooms typically require lower ASE, while kitchens and living rooms benefit from high sDA levels during daytime activity. The corridor and bathroom spaces may prioritize glare control over maximum illumination. Figure 9 presents a comparative overview of the average sDA and ASE across seven room types. Table 5 summarizes the maximum and minimum sDA and ASE values observed across room types for each configuration. This shows that the living and reception areas exhibit the highest daylight performance, with average sDA exceeding 70%, and ASE values approaching or exceeding 40%. This indicates strong daylight penetration, likely due to larger glazing areas and favorable orientation, but it also highlights an increased risk of glare or overheating. The results also show that these façade configurations could not achieve both optimization targets together; sDA is more than 75%, and ASE is less than 10%. In contrast, rooms such as bathrooms, toilets, and corridors display very low sDA and ASE levels frequently under 20%. These values indicate their limited access to daylight, potentially necessitating artificial lighting to improve visual comfort. Bedrooms demonstrate moderately high sDA (around 40–60%) with relatively controlled ASE, pointing to a well-balanced design that provides sufficient daylight without excessive daylight exposure. Kitchens show similar patterns but with slightly higher ASE, likely influenced by functional window placements for ventilation and task lighting.
This analysis indicates that while open-plan spaces benefit from high daylight autonomy, applying careful glare-mitigation strategies is essential. Meanwhile, more enclosed or service spaces may require design enhancements to meet daylighting standards.

5. Discussion

The comparative daylighting performance of the tested configurations reveals the nuanced trade-offs inherent in façade and indoor finish design decisions. Glazing type emerged as one of the most influential parameters. Clear glazing significantly enhanced sDA, particularly in large open spaces like living and reception areas. However, the resulting high ASE values highlight a critical drawback. This duality suggests that while clear glazing is effective for maximizing daylight, it must be paired with effective light-control strategies such as shading devices, louver systems, or spectrally selective coatings to maintain visual comfort and thermal balance. In contrast, blue and black glazing offered excellent glare mitigation, evidenced by low ASE percentages. Yet, the suppression of light transmission negatively impacted daylight autonomy, making these options less suitable for functional living spaces that depend heavily on natural lighting. Instead, their use may be more appropriate in bathrooms, storage areas, or service spaces where daylight is beneficial but not essential for prolonged visual tasks. These findings comply with previous studies [2,43].
WWR presented another important determinant of daylighting success. Low WWR values (15%) often led to underlit indoor spaces despite occasional high ASE in small rooms. This mismatch indicates that even minimal glazing, when poorly oriented, can lead to visual discomfort without delivering sufficient illumination. The unexpectedly high ASE values under low WWR configurations, such as 15%, are likely due to the orientation and positioning of windows which intensify glare in enclosed east-facing spaces. Even small windows can introduce significant overexposure when directly aligned with sun paths. A mid-range WWR of 50% proved optimal in balancing daylight availability with glare control. This configuration supported high sDA values in key living areas while keeping ASE within acceptable limits, especially when paired with moderate colored indoor finishes. Conversely, a high WWR of 75% dramatically increased daylight access but also escalated ASE, requiring secondary strategies such as recessed windows, horizontal light shelves, or dynamic shading to manage overexposure. These results match with past studies [41].
Indoor wall finishes acted as passive modifiers of daylight distribution. White finishes reflected a higher proportion of daylight, amplifying brightness within spaces but often pushing ASE values beyond comfort thresholds. In contrast, dark finishes significantly reduced light reflection, helping mitigate glare and overexposure but at the cost of daylight sufficiency in some spaces. Moderate finishes proved to be the most effective in harmonizing daylight autonomy and visual comfort, particularly when combined with mid-range WWRs and blue-tinted glazing. These finishes may be especially suitable for multifunctional or transitional zones within residential buildings.
Overall, the discussion confirms that daylighting cannot be optimized through a single parameter in isolation. Instead, an integrated design approach is required. It should account for glazing transmission, façade openness, surface reflectivity, room function, and orientation. The results affirm the utility of parametric daylight simulations in testing these variables during the early design process, following previous research recommendations [25]. These offer designers a powerful means to validate and iterate design options that fulfill both performance and occupant comfort criteria. The method can be integrated with other environmental assessment tools and methods for a broader analysis [44].

5.1. Pearson Test Correlation

This section presents the Pearson correlation analysis between sDA and ASE for various daylight-related design configurations, including glazing types, WWRs, and indoor surface finishes. Pearson’s correlation coefficient (r) indicates the strength and direction of a linear relationship between sDA and ASE, while the p-value represents the statistical significance of the correlation. The results are highlighted in Table 6.
This indicates interesting results for the effect of glazing type, WWR, and indoor wall finish. Primarily, it shows that clear glazing optimizes daylight (sDA) but worsens glare (ASE). Blue glazing decouples the ASE–sDA relationship, potentially offering a middle ground. Black glazing shows a slight trade-off, marginally reducing ASE as sDA improves. Regarding the effect of WWR, small windows (15% WWR) tightly reduce both the sDA and ASE. Larger windows (75% WWR) increase both metrics, requiring additional glare control. Applying 50% WWR offers the weakest correlation, suggesting it may provide the best opportunity to optimize daylight without excessive glare. Lastly, it is noted that all finishes show strong positive correlations, meaning reflectivity plays a smaller role in decoupling sDA and ASE compared to glazing or WWR. Even dark finishes do not significantly reduce the ASE–sDA link, suggesting that glazing and WWR are stronger levers for optimization.
The design implication for this analysis indicates that to achieve the ideal balance of high sDA coupled with low ASE, clear glazing should be avoided, using blue glazing or 50% WWR, while avoiding material finishes with high reflectivity. For maximum daylight (prioritizing sDA), it is recommended to use clear glazing and high WWR, but high ASE is expected. For glare control (prioritizing low ASE), it is recommended to use black glazing and low WWR which reduces ASE but sacrifices sDA.

5.2. Sensitivity Test Correlation

Table 7 presents the sensitivity analysis results that evaluate how ASE responds to incremental changes in sDA across different daylight-design strategies. Sensitivity is expressed as the mean change in ASE per unit change in sDA (ΔASE/ΔsDA), providing insight into how volatile or stable each configuration is in relation to daylight and glare. A positive value indicates that increasing sDA tends to increase ASE, and vice versa. The standard deviation reflects variability in sensitivity; e.g., high standard deviation means the effect is inconsistent across scenarios.
The analysis reveals that WWR 15% exhibited the highest sensitivity (1.155) and variability (std. dev = 1.758), indicating that small window openings can cause sharp and inconsistent increases in glare. WWR 75% also displayed relatively high sensitivity, while WWR 50% proved to be the most stable configuration. Clear glazing showed moderate and consistent behavior (0.304), whereas black glazing produced negative and volatile responses, reflecting minimal light penetration, possibly due to the effect of other factors. Among finishes, moderate and dark colored indoor surfaces maintained stable daylight–glare relationships, while white finishes, despite their low average sensitivity, demonstrated extremely high variability across spaces.

6. Limitations

Egypt’s hot arid climate is characterized by intense solar radiation, high temperatures, and minimal cloud cover, leading to unique daylighting challenges. The high solar exposure in Egypt indicates that glare risk is a dominant concern, whereas in overcast climates, maximizing daylight availability might take precedence. Thus, the study findings may only hold for similar climates and contextual conditions.
The study’s focus on low-rise, semi-urban residential buildings limits its applicability to high-rise structures, where vertical urban canyon effects and overshadowing significantly alter daylight distribution. It is also difficult to apply on dense urban areas, where neighboring buildings may block sunlight, reducing the impact of WWR and glazing choices compared to isolated structures. Furthermore, non-residential buildings may have different occupancy patterns, fenestration needs, and glare tolerance. Hence, it is recommended to test the sensitivity of the research findings in other climates, contextual conditions, and for other building types.
Furthermore, Autodesk Revit 2026 and Insight 360 offer powerful tools for built-in building modeling and daylight simulation through a user-friendly interface. This reduces risks of data loss when transformed to another analytical tool. This is useful to explore design decisions especially with such a simple building model—saving time and effort. Nevertheless, for more complex building geometries, specialized software programs are recommended.
Finally, it is important to note that the reliability and generalizability of this study’s findings are inherently constrained by the limited number of parameters selected and simulations conducted. The selection of WWR, glazing type, and wall finish was based on their direct influence on sDA and ASE, yet they should not be looked at in isolation from other factoring parameters, e.g., window placement, orientation, and shading systems. Also, thermal comfort, though excluded from this study, indirectly affects daylighting strategies and requires further investigation. Thus, it is recommended to validate the findings of this research with further simulations including other parameters to explore non-linear relationships and interaction effects between variables.

7. Conclusions and Future Recommendations

This research has demonstrated that the daylight performance of the case study residential building located in a hot arid climate, Egypt, is highly influenced by variations in glazing type, WWR, and indoor wall surface finish. By leveraging a parametric Revit-based model and conducting simulation through Insight 360, the study provided quantitative assessments of sDA and ASE in alignment with LEED v4.1 standards. This demonstrates the value of combining BIM-integrated modeling, annual daylight simulations, and statistical validation to evaluate façade performance. The results showed that clear glazing and high WWR increase daylight but risk glare. A 50% WWR and moderate wall finishes offered the most balanced daylight and visual comfort. Surface finishes add another layer of nuance—white and moderate colors amplify light distribution, while darker tones offer calm but potentially underlit conditions. The findings support the use of BIM tools in early-stage design decisions exploring synergies and trade-off scenarios.
The statistical results reinforce these observations. The Pearson’s correlation analysis revealed a strong, statistically significant relationship between sDA and ASE, particularly for configurations with clear glazing and light indoor finishes. These relationships signal that as daylight autonomy increases, so does the potential for excessive sunlight, unless counteracted by appropriate design interventions. The sensitivity analysis added further depth by quantifying the rate at which ASE responds to changes in sDA, highlighting that high WWR configurations exhibit steeper glare increases per unit of daylight gain, while moderate WWRs maintain more stable performance envelopes.
While the research provides valuable insights into daylight performance, considerations attributed with climatic specificity and generalizability as well as building typology and urban density must be acknowledged. Also, the findings must be considered acknowledging limitations associated with the selected parameters and the software used. In this regard, future research could test more combinations of parameters, and investigate non-linear relationships. Future studies could also expand simulations to include dynamic shading, modern materials, and occupant behavior.

Author Contributions

N.S.: conceptualization, methodology, software simulation, visualization, writing; A.Y.: methodology, software simulation; W.S.E.I.: writing, review, supervision. All authors have read and agreed to the published version of the manuscript.

Funding

This research received no external funding.

Data Availability Statement

All data can be made available upon request from the authors.

Conflicts of Interest

The authors declare no conflicts of interest.

Abbreviations

The following abbreviations are used in this manuscript:
ASEAnnual Sunlight Exposure
BIMBuilding Information Modeling
CdCandella
DFDaylight Factor
DGPDaylight Glare Probability
IEQIndoor Environmental Quality
IESIlluminating Engineering Society
LEEDLeadership in Energy and Environmental Design
LURLight Uniformity Ratio
MRTMean Radiant Temperature
sDASpatial Daylight Autonomy
SHGCSolar Heat Gain Coefficient
UDIUseful Daylight Illuminance
VLTVisible Light Transmittance
WWRWindow-to-Wall Ratio

References

  1. Nabil, A.; Mardaljevic, J. Useful Daylight Illuminance: A New Paradigm for Assessing Daylight in Buildings. Light. Res. Technol. 2005, 37, 41–59. [Google Scholar] [CrossRef]
  2. Tzempelikos, A. Advances on Daylighting and Visual Comfort Research. Build. Environ. 2017, 113, 1–4. [Google Scholar] [CrossRef]
  3. Mahić, A.; Galicinao, K.; Van Den Wymelenberg, K. A Pilot Daylighting Field Study: Testing the Usefulness of Laboratory-Derived Luminance-Based Metrics for Building Design and Control. Build. Environ. 2017, 113, 78–91. [Google Scholar] [CrossRef]
  4. Elakkad, N.; Ismaeel, W.S.E. Coupling Performance-Prescriptive Based Daylighting Principles for Office Buildings: Case Study from Egypt. Ain Shams Eng. J. 2021, 12, 3263–3273. [Google Scholar] [CrossRef]
  5. Eissa, O.A.A.; Elakkad, N.A.; Ismaeel, W.S. Investigating Daylighting Quality in Educational Spaces Following Building Renovation. IOP Conf. Ser. Earth Environ. Sci. 2024, 1396, 012021. [Google Scholar] [CrossRef]
  6. Mavromatidis, L.E.; Marsault, X.; Lequay, H. Daylight Factor Estimation at an Early Design Stage to Reduce Buildings’ Energy Consumption Due to Artificial Lighting: A Numerical Approach Based on Doehlert and Box-Behnken Designs. Energy 2014, 65, 488–502. [Google Scholar] [CrossRef]
  7. Nasrollahi, N.; Shokri, E. Daylight Illuminance in Urban Environments for Visual Comfort and Energy Performance. Renew. Sustain. Energy Rev. 2016, 66, 861–874. [Google Scholar] [CrossRef]
  8. Schwartz, Y.; Raslan, R. Variations in Results of Building Energy Simulation Tools, and Their Impact on BREEAM and LEED Ratings: A Case Study. Energy Build. 2013, 62, 350–359. [Google Scholar] [CrossRef]
  9. Kruisselbrink, T.; Dangol, R.; Rosemann, A. Photometric Measurements of Lighting Quality: An Overview. Build. Environ. 2018, 138, 42–52. [Google Scholar] [CrossRef]
  10. Illuminating Engineering Society of North America. IESNA Lighting Handbook; Illuminating Engineering Society of North America: New York, NY, USA, 2000. [Google Scholar]
  11. USGBC. LEED-NC Version 4; USGBC: Grand Rapids, MI, USA, 2019. [Google Scholar]
  12. USGBC LEED v4 for Building Design and Construction—Current Version|U.S. Green Building Council. Available online: http://www.usgbc.org/resources/leed-v4-building-design-and-construction-current-version (accessed on 1 June 2025).
  13. Korsavi, S.S.; Zomorodian, Z.S.; Tahsildoost, M. Visual Comfort Assessment of Daylit and Sunlit Areas: A Longitudinal Field Survey in Classrooms in Kashan, Iran. Energy Build. 2016, 128, 305–318. [Google Scholar] [CrossRef]
  14. Elkhayat, Y.O.; Ibrahim, M.G.; Ali, A.A.M. An Integrated Assessment of the High-Performance Glazing Systems in the Office Buildings. In Proceedings of the 2019 Advances in Science and Engineering Technology International Conferences (ASET), Dubai, United Arab Emirates, 26 March–10 April 2019; pp. 1–6. [Google Scholar] [CrossRef]
  15. Chan, Y.C.; Tzempelikos, A.; Konstantzos, I. A Systematic Method for Selecting Roller Shade Properties for Glare Protection. Energy Build. 2015, 92, 81–94. [Google Scholar] [CrossRef]
  16. Meek, C.; Van Den Wymelenberg, K. Daylighting and Integrated Lighting Design; Smith, R., Ed.; Routledge: New York, NY, USA, 2015. [Google Scholar]
  17. Luo, Y.; Zhang, L.; Wu, J.; Wang, X.; Liu, Z.; Wu, Z. Modeling of Solar Transmission through Multilayer Glazing Facade Using Shading Blinds with Arbitrary Geometrical and Surface Optical Properties. Energy 2017, 128, 163–182. [Google Scholar] [CrossRef]
  18. Shen, H.; Tzempelikos, A. Sensitivity Analysis on Daylighting and Energy Performance of Perimeter Offices with Automated Shading. Build. Environ. 2013, 59, 303–314. [Google Scholar] [CrossRef]
  19. Mayhoub, M.; Labib, R. A-Towards A Solution for the Inevitable Use of Glazed Facades in the Arid Regions via a Parametric Design Approach. Int. Comm. Illum. Symp. 2015, 1–11. [Google Scholar] [CrossRef]
  20. Singh, R.; Lazarus, I.J.; Kishore, V.V.N. Uncertainty and Sensitivity Analyses of Energy and Visual Performances of Office Building with External Venetian Blind Shading in Hot-Dry Climate. Appl. Energy 2016, 184, 155–170. [Google Scholar] [CrossRef]
  21. Mahdavinejad, M.; Matoor, S.; Feyzmand, N.; Doroodgar, A. Horizontal Distribution of Illuminance with Reference to Window Wall Ratio (WWR) in Office Buildings in Hot and Dry Climate, Case of Iran, Tehran. Appl. Mech. Mater. 2011, 110–116, 72–76. [Google Scholar] [CrossRef]
  22. Acosta, I.; Campano, M.Á.; Molina, J.F. Window Design in Architecture: Analysis of Energy Savings for Lighting and Visual Comfort in Residential Spaces. Appl. Energy 2016, 168, 493–506. [Google Scholar] [CrossRef]
  23. Chien, S.C.; Tseng, K.J. Assessment of Climate-Based Daylight Performance in Tropical Office Buildings: A Case Study. Int. J. Low-Carbon Technol. 2014, 9, 100–108. [Google Scholar] [CrossRef]
  24. Costanzo, V.; Donn, M. Thermal and Visual Comfort Assessment of Natural Ventilated Office Buildings in Europe and North America. Energy Build. 2017, 140, 210–223. [Google Scholar] [CrossRef]
  25. ElBatran, R.M.; Ismaeel, W.S.E. Applying a Parametric Design Approach for Optimizing Daylighting and Visual Comfort in Office Buildings. Ain Shams Eng. J. 2021, 12, 3275–3284. [Google Scholar] [CrossRef]
  26. International WELL Building Institute. WELL Rating System; International WELL Building Institute: New York, NY, USA, 2014. [Google Scholar]
  27. Walaa, S.E. Ismaeel The Dynamics of Sustainable Material Selection for Green-Certified Projects. Buildings 2023, 13, 2077. [Google Scholar] [CrossRef]
  28. Konstantzos, I.; Sadeghi, S.A.; Kim, M.; Xiong, J.; Tzempelikos, A. The Effect of Lighting Environment on Task Performance in Buildings—A Review. Energy Build. 2020, 226, 110394. [Google Scholar] [CrossRef]
  29. Hopfe, C.J.; Augenbroe, G.L.M.; Hensen, J.L.M. Multi-Criteria Decision Making under Uncertainty in Building Performance Assessment. Build. Environ. 2013, 69, 81–90. [Google Scholar] [CrossRef]
  30. Chang, S.; Castro-Lacouture, D.; Yamagata, Y. Decision Support for Retrofitting Building Envelopes Using Multi-Objective Optimization under Uncertainties. J. Build. Eng. 2020, 32, 101413. [Google Scholar] [CrossRef]
  31. Meresi, A. Evaluating Daylight Performance of Light Shelves Combined with External Blinds in South-Facing Classrooms in Athens, Greece. Energy Build. 2016, 116, 190–205. [Google Scholar] [CrossRef]
  32. Vera, S.; Uribe, D.; Bustamante, W. Optimization of a Fi Xed Exterior Complex Fenestration System Considering Visual Comfort and Energy Performance Criteria n Molina D. Build. Environ. 2017, 113, 163–174. [Google Scholar] [CrossRef]
  33. Pinotti, R.; Avesani, S.; Belleri, A.; De Michele, G.; Ingenhoven, P. Optimised Parametric Model of a Modular Multifunctional Climate Adaptive Façade for Shopping Centres Retrofitting. J. Facade Des. Eng. 2017, 5, 23–36. [Google Scholar] [CrossRef]
  34. Elghandour, A.; Saleh, A.; Aboeineen, O.; Elmokadem, A. Using Parametric Design to Optimize Building’S Façade Skin to Improve Indoor Daylighting Performance. In Proceedings of the BSO Conference 2016: Third Conference of IBPSA-England, Newcastle, UK, 12–14 September 2016; pp. 353–361. Available online: https://publications.ibpsa.org/conference/paper/?id=bso2016_1172 (accessed on 1 June 2025).
  35. Wagdy, A.; Fathy, F. A Parametric Approach for Achieving Optimum Daylighting Performance through Solar Screens in Desert Climates. J. Build. Eng. 2015, 3, 155–170. [Google Scholar] [CrossRef]
  36. Park, C.S.; Augenbroe, G. Local vs. Integrated Control Strategies for Double-Skin Systems. Autom. Constr. 2013, 30, 50–56. [Google Scholar] [CrossRef]
  37. Kota, S.; Haberl, J.S.; Clayton, M.J.; Yan, W. Building Information Modeling (BIM)-Based Daylighting Simulation and Analysis. Energy Build. 2014, 81, 391–403. [Google Scholar] [CrossRef]
  38. Boudhaim, M.; Pflug, T.; Bueno, B.; Siroux, M.; Kuhn, T. A BIM-Compatible Framework to Assess the Thermal and Optical Performance of Envelope Systems. In Proceedings of the 30th International Conference on Efficiency, Cost, Optimization, Simulation and Environmental Impact of Energy Systems, ECOS 2017, San Diego, CA, USA, 2–6 July 2017. [Google Scholar]
  39. Miri, M.; Ashtari, E. Implementing a Digital Solution for Architectural Daylight Analysis in BIM Based Projects by Developing a New Plugin. IOP Conf. Ser. Earth Environ. Sci. 2022, 1099, 012013. [Google Scholar] [CrossRef]
  40. Kim, J. Adaptive Façade Design for the Daylighting Performance in an Office Building: The Investigation of an Opening Design Strategy with Cellular Automata. Int. J. Low-Carbon Technol. 2013, 10, 313–320. [Google Scholar] [CrossRef]
  41. Su, X.; Zhang, X. Environmental Performance Optimization of Window–Wall Ratio for Different Window Type in Hot Summer and Cold Winter Zone in China Based on Life Cycle Assessment. Energy Build. 2010, 42, 198–202. [Google Scholar] [CrossRef]
  42. Reinhart, C.F.; Wienold, J. The Daylighting Dashboard—A Simulation-Based Design Analysis for Daylit Spaces. Build. Environ. 2011, 46, 386–396. [Google Scholar] [CrossRef]
  43. Hee, W.J.; Alghoul, M.A.; Bakhtyar, B.; Elayeb, O.; Shameri, M.A.; Alrubaih, M.S.; Sopian, K. The Role of Window Glazing on Daylighting and Energy Saving in Buildings. Renew. Sustain. Energy Rev. 2015, 42, 323–343. [Google Scholar] [CrossRef]
  44. Ismaeel, W.S.E.; Elsayed, M.A. The Interplay of Environmental Assessment Methods; Characterising the Institutional Background in Egypt. J. Environ. Assess. Policy Manag. 2018, 20, 1850003. [Google Scholar] [CrossRef]
Figure 1. Research method flow diagram.
Urbansci 09 00303 g001
Figure 2. Revit Autodesk sun setting and light analysis setup dialogue.
Urbansci 09 00303 g002
Figure 3. Modeling the effect of glazing on daylight performance.
Urbansci 09 00303 g003
Figure 4. Comparing the sDA and ASE for different glazing configurations.
Urbansci 09 00303 g004
Figure 5. Modeling the effect of WWR on daylight performance.
Urbansci 09 00303 g005
Figure 6. Comparing the sDA and ASE for different WWR configurations.
Urbansci 09 00303 g006
Figure 7. Modeling the effect of indoor surface color on daylight performance.
Urbansci 09 00303 g007
Figure 8. Comparing the sDA and ASE for different indoor wall finish configurations.
Urbansci 09 00303 g008
Figure 9. Comparing the sDA versus ASE per space.
Urbansci 09 00303 g009
Table 1. Summary of findings from previous studies.
AuthorFocus AreaTools UsedMetrics Considered
[25]Double-skin façade for LEED in hot climateEnergy modeling (unspecified)LEED compliance (energy and ventilation)
[34]Parametric window optimization with genetic algorithmsRhino–GrasshopperWindow size; no LEED or daylight metrics
[14]Framework for classroom thermal comfort and sustainabilityDesign-evaluation framework (unspecified)Thermal comfort; no daylight or LEED metrics
[35,36]Role of façade in daylight enhancementQualitative architectural analysisGeneral daylight principles
[36]Responsive façade system for daylight optimizationParametric modelingsDA, ASE
[37]BIM-based daylighting simulation and analysisIntegrate the BIM tool with the daylighting-simulation toolsRevit, Radiance, and DAYSIM
[38]BIM-compatible framework Optimizing the envelope systemAssess the thermal and optical performance
[39]Digital solution Daylight Analysis New BIM-based plugin
Table 2. The performance results for each glazing configuration for each space.
GlazingClearBlueBlack
sDA%ASE%sDA%ASE%sDA%ASE%
bedroom2730080
living92300000
bathroom00224123
corridor000000
kitchen0131616013
reception8653013033
toilet00033816
Table 3. The performance results for each WWR configuration for each space.
WWRWWR 15%WWR 50%WWR 75%
sDA%ASE%sDA%ASE%sDA%ASE%
bedroom705737013
living0065268255
bathroom00006020
corridor418008955
kitchen505301380
reception07514100
toilet00033033
Table 4. The performance results for each indoor wall finish configuration for each space.
Finish ColorWhite Colored FinishModerate Colored FinishDark Colored
Finish
sDA%ASE%sDA%ASE%sDA%ASE%
bedroom030303
living9642100427342
bathroom000000
corridor000000
kitchen713013013
reception033033033
toilet965390537653
Table 5. The maximum and minimum sDA and ASE values observed across room types for each configuration.
ParameterCategoryMax sDA (%)Max ASE (%)Descriptive Analysis
GlazingClear92 (Living space)53 (Reception space)High daylight, high glare; needs shading
GlazingBlue22 (Bathroom)33 (Toilet)Low daylight, low glare; good for private zones
GlazingBlack12 (Bathroom)33 (Reception space)Minimal daylight, low glare; glare suppression
WWR15%70 (Bedroom)57 (Bedroom)Small windows: limited daylight but still glare prone
WWR50%65 (Living space)41 (Reception space)Balanced daylight and glare; optimal for comfort
WWR75%89 (Living space)55 (Living space)Max daylight but high glare; needs control
Wall FinishWhite color96 (Toilet/Living space)53 (Toilet)Brightest spaces, but glare prone
Wall FinishModerate color100 (Living)53 (Toilet)High daylight, moderate glare
Wall FinishDark color73 (Living space)42 (Living space)Good daylight, lower glare; comfortable
Table 6. The correlation results for each configuration type.
ConfigurationPearson rInterpretation p-ValueInterpretation
Clear Glazing0.877Very strong positive correlation. As sDA increases, ASE also increases sharply. This means clear glass maximizes daylight availability (good for sDA) but also significantly raises glare risk (bad for ASE).0.0095Highly significant: Clear glazing reliably increases both sDA and ASE together.
Blue Glazing−0.021Near-zero correlation. No meaningful linear relationship. Blue glazing disrupts the typical ASE–sDA link, likely due to selective light transmission.0.9652No significance: Blue glazing’s trade-off between ASE and sDA is not statistically reliable.
Black Glazing−0.250Weak negative correlation. Higher sDA slightly reduces ASE (or vice versa). Black glazing may suppress glare (ASE) but at the cost of daylight (sDA), or vice versa.0.5883No significance: Black glazing’s trade-off between ASE and sDA is not statistically reliable.
WWR 15%0.889Very strong positive correlation. Small windows tightly link sDA and ASE (low daylight coupled with low glare).0.0074Highly significant: The tight coupling of sDA and ASE in small windows is a real effect.
WWR 50%0.634Moderate positive correlation. Mid-sized windows allow more flexibility in balancing sDA and ASE.0.1265Not significant: The moderate correlation might be meaningful in practice, but it is not statistically proven here.
WWR 75%0.796Strong positive correlation. Large windows increase both sDA and ASE.0.0322Significant: Large windows strongly and reliably increase both sDA and ASE.
White Finish0.842High reflectivity strongly links sDA and ASE (bright surfaces amplify daylight but also glare).0.0174Significant: High reflectivity consistently links higher sDA with higher ASE.
Moderate color Finish0.829Slightly weaker than white, but still a strong positive relationship.0.0210Significant: Similar to white finishes, but slightly weaker.
Dark Finish0.843Dark finishes may absorb direct light but reflect indirect glare.0.0172Significant: Despite absorbing light, dark finishes still show a strong ASE–sDA relationship
Table 7. The mean and standard deviation of ASE sensitivity to sDA across all configuration types.
ConfigurationMean Sensitivity (ΔASE/ΔsDA)Std. DeviationInterpretation
Clear Glazing0.3040.231Moderate trade-off
Low variability (consistent effect)
Blue Glazing0.2590.342Mild trade-off
Higher variability (maybe context-dependent)
Black Glazing−0.2710.837Inverse relationship
High variability (unpredictable; may depend on other factors)
WWR 15%1.1551.758Extreme trade-off
Highly variable (likely depends on building geometry/climate)
WWR 50%0.2350.203Mild, stable trade-off
Most balanced option
WWR 75%0.6650.586Strong trade-off
Moderate variability
White Finish0.0091.415Near-zero sensitivity, but extremely high variability. Unpredictable effect.
Moderate Light Finish0.1720.183Mild, stable trade-off
Dark Finish0.2290.249Slightly strong relation, but still stable trade-off
Disclaimer/Publisher’s Note: The statements, opinions and data contained in all publications are solely those of the individual author(s) and contributor(s) and not of MDPI and/or the editor(s). MDPI and/or the editor(s) disclaim responsibility for any injury to people or property resulting from any ideas, methods, instructions or products referred to in the content.

