Article

Interplay Between Vegetation and Urban Climate in Morocco—Impact on Human Thermal Comfort

by
Noura Ed-dahmany
1,*,
Lahouari Bounoua
2,
Mohamed Amine Lachkham
1,
Mohammed Yacoubi Khebiza
1,
Hicham Bahi
3 and
Mohammed Messouli
1
1
Laboratory of Water Sciences, Microbial Biotechnologies and Natural Resources Sustainability (AQUABIOTECH), Faculty of Sciences Semlalia, Cadi Ayyad University, Marrakesh 40000, Morocco
2
Biospheric Sciences Laboratory, National Aeronautics and Space Administration, Goddard Space Flight Center, Greenbelt, MD 20771, USA
3
African Research Center on Air Quality and Climate, Mohammed VI Polytechnic University, Ben Guerir 43150, Morocco
*
Author to whom correspondence should be addressed.
Urban Sci. 2025, 9(8), 289; https://doi.org/10.3390/urbansci9080289
Submission received: 26 May 2025 / Revised: 17 July 2025 / Accepted: 23 July 2025 / Published: 25 July 2025

Abstract

This study examines diurnal surface temperature dynamics across major Moroccan cities during the growing season and explores the interaction between urban and vegetated surfaces. We also introduce the Urban Thermal Impact Ratio (UTIR), a novel metric designed to quantify urban thermal comfort as a function of the surface urban heat island (SUHI) intensity. The analysis is based on outputs from a land surface model (LSM) for the year 2010, integrating high-resolution Landsat and MODIS data to characterize land cover and biophysical parameters across twelve land cover types. Our findings reveal moderate urban–vegetation temperature differences in coastal cities like Tangier (1.8 °C) and Rabat (1.0 °C), where winter vegetation remains active. In inland areas, urban morphology plays a more dominant role: Fes, with a 20% impervious surface area (ISA), exhibits a smaller SUHI than Meknes (5% ISA), due to higher urban heating in the latter. The Atlantic desert city of Dakhla shows a distinct pattern, with a nighttime SUHI of 2.1 °C and a daytime urban cooling of −0.7 °C, driven by irrigated parks and lawns enhancing evapotranspiration and shading. At the regional scale, summer UTIR values remain below one in Tangier-Tetouan-Al Hoceima, Rabat-Sale-Kenitra, and Casablanca-Settat, suggesting that urban conditions generally stay within thermal comfort thresholds. In contrast, higher UTIR values in Marrakech-Safi, Beni Mellal-Khénifra, and Guelmim-Oued Noun indicate elevated heat discomfort. At the city scale, the UTIR in Tangier, Rabat, and Casablanca demonstrates a clear diurnal pattern: it emerges around 11:00 a.m., peaks at 1:00 p.m., and fades by 3:00 p.m. This study highlights the critical role of vegetation in regulating urban surface temperatures and modulating urban–rural thermal contrasts. The UTIR provides a practical, scalable indicator of urban heat stress, particularly valuable in data-scarce settings. These findings carry significant implications for climate-resilient urban planning, optimized energy use, and the design of public health early warning systems in the context of climate change.

1. Introduction

Land–atmosphere interactions play a crucial role in regulating climate processes by shaping energy fluxes, surface temperatures, and evapotranspiration. In urban areas, these exchanges are significantly altered by impervious surfaces, reduced vegetation, and complex structures, giving rise to the urban heat island (UHI) effect, a phenomenon characterized by higher urban temperatures compared to rural surroundings, with serious implications for energy demand, public health, and urban sustainability [1,2,3].
In recent decades, urban growth and global warming have heightened the urgency of understanding and mitigating UHI effects. Beyond local land cover changes, UHI intensity is also shaped by broader climatic gradients and feedbacks, making accurate modeling essential for evaluating thermal comfort, predicting energy needs, and guiding climate-resilient urban design [4,5].
Morocco exemplifies this challenge, with its cities like Casablanca, Rabat, Marrakech, and Fes undergoing rapid expansion, often with limited climate-sensitive planning. Compounded by advancing desertification and warming trends, Moroccan urban centers face a growing exposure to heat-related risks.
Despite this vulnerability, studies on UHI dynamics and urban heat stress in Morocco remain limited. Available research has explored surface temperature patterns [6,7,8,9] and mitigation strategies [10,11] but often lacks high-resolution data, seasonal analyses, and comfort-oriented metrics. Moreover, few studies integrate vegetation–atmosphere interactions or offer dynamic modeling of urban processes. This study addresses these gaps by applying the Simple Biosphere 2 model (SiB2) [12,13] with urban-specific parameterizations, high-resolution land cover data, and hourly meteorological forcing across twelve cities to assess UHI intensity and heat stress.
Vegetation and evapotranspiration are key regulators of urban microclimates, offering natural cooling that can mitigate UHI effects. Integrating these biophysical processes into urban planning supports nature-based solutions such as green spaces and urban forestry, which are increasingly recognized in climate adaptation and public health policies. This study’s modeling approach provides insights to guide such interventions in Moroccan cities.
Building on these foundations, this study provides a detailed understanding of how land use influences urban thermal patterns by integrating vegetation cover, urban morphology, and atmospheric drivers through the SiB2 model.
The relevance of this research is underscored by Morocco’s increasing frequency of heatwaves [14], which pose severe health risks, particularly for vulnerable groups such as the elderly, children, and low-income communities living in densely built, under-resourced neighborhoods. Heat stress not only contributes to increased illness, mortality, and healthcare costs, but also worsens social inequalities, as underserved areas often lack access to cooling or green spaces. Rising urban temperatures further degrade the quality of life and raise energy demands for cooling [15], placing additional economic burdens on already vulnerable populations.
Accurate, city-scale assessments of the UHI and heat stress are critical for informed urban planning. Land surface models such as SiB2 provide actionable insights for developing equitable, climate-resilient cities by promoting nature-based solutions, optimizing urban design, and reducing heat-related health risks.
This study contributes to the growing body of urban climate research in arid and semi-arid regions and offers a scientifically grounded approach to support climate-resilient urban planning in Morocco. By identifying the drivers of UHI and their impacts on thermal comfort, this work provides a foundation for targeted interventions that reduce heat stress and improve public health outcomes.

2. Model, Data and Methodology

2.1. Model Description

This study employs output from the Simple Biosphere Model (SiB2), originally developed by Sellers et al. [12] and later enhanced by Bounoua et al. [16], to represent urban ecosystems. A comprehensive description of the model is provided by Bounoua et al. [17]; a brief summary is given here for context.
SiB2 simulates the exchange of energy, water, momentum, and carbon between the land surface and the atmosphere across 12 distinct land cover classes. The model structure includes a single canopy layer, one ground layer, and three soil moisture layers of varying depths. A key component is the canopy photosynthesis–conductance module, which couples CO2 uptake with water vapor release through stomatal regulation [18]. Soil hydraulic and thermal processes are also represented to simulate the hydrological cycle. Surface reflectance in the visible and near-infrared bands is estimated using a two-stream radiative transfer model that incorporates changes due to snow cover. The model’s nine prognostic-state variables include canopy temperature, ground and deep soil temperatures, water content in each soil layer, and canopy stomatal conductance.
SiB2 is driven by meteorological inputs such as shortwave and longwave radiation, precipitation (both convective and large-scale), specific humidity, surface air temperature, surface pressure, and wind speed at a reference height above the canopy. Model outputs include detailed surface energy and water fluxes, such as latent heat components (interception loss from the canopy and ground, soil evaporation, and canopy transpiration), sensible heat (from soil and canopy), net radiation (both reflected and emitted), and net photosynthetic carbon flux. It also tracks state variables like canopy, ground, and canopy air space temperatures, as well as soil moisture in three layers and carbon uptake, to provide a comprehensive view of surface energy, water, and carbon budgets.
For urban areas typically characterized by a mix of vegetation and impervious surfaces, SiB2 assigns the morphological, physiological, and optical properties of bare soil. Urban pixels are defined using the Normalized Difference Vegetation Index (NDVI) values derived from Landsat data and exhibit enhanced surface roughness. The top layer is considered impermeable, with a maximum water holding capacity of 2 mm; any excess is routed as surface runoff.
Urban surfaces include a heat absorption component based on a thin concrete slab, modulated by the heat capacity of water or snow when present. SiB2 operates in an offline (stand-alone) mode using hourly meteorological inputs such as the MERRA-2 reanalysis dataset [19]. For this study, 2010 MERRA-2 data were obtained from NASA’s Goddard Earth Sciences Data and Information Services Center [20], prescribed at a reference height above the canopy. The year 2010 was chosen for the comprehensive biophysical and hourly meteorological data availability. Beyond data availability, 2010 represents a climatologically exceptional year in Morocco. It was marked by a combination of extreme weather events, including an unusually warm spring and summer season, with significantly high surface temperatures recorded across multiple regions, as well as severe winter rainfall and flooding in cities such as Casablanca, Kenitra, and the Gharb plain [21]. These anomalies were linked to a strong negative phase of the North Atlantic Oscillation (NAO), which is known to influence temperature and precipitation patterns in North Africa [22]. The co-occurrence of thermal extremes and hydrological stress makes 2010 an interesting case for examining the interactions between vegetation dynamics, climate variability, and urban heat island intensity in a Mediterranean–semi-arid context such as Morocco. The climate data are spatially resampled using bilinear interpolation to a 0.1° × 0.1° Climate Modeling Grid (CMG), equivalent to approximately a 10 km × 10 km resolution.
Within each CMG, SiB2 is independently integrated in time for all twelve land cover types, using the same meteorological forcing but unique biophysical inputs such as the leaf area index, greenness fraction, absorbed fraction of photosynthetically active radiation (FPAR), and roughness length. Model outputs are generated separately for each land cover type and are also aggregated into a fractional-weighted CMG average based on land cover proportions. Each simulation includes a spin-up period followed by three years of model integration, during which identical atmospheric forcing is used across simulations. This experimental design isolates the influence of land cover change on near-surface climate, as no feedback to the atmosphere is allowed. SiB2 has been widely applied in both offline configurations [23,24] and in coupled models with general circulation models (GCMs) [18,25,26], and it is a well-calibrated and validated land surface model.
To evaluate the performance of the SiB2, we conducted a comparison between the modeled and observed daily average air temperature for the full simulation year at the Fontainebleau site in France. This location was selected due to its availability of high-quality observational data and its land cover characteristics, which include short vegetation and mixed canopy, broadly representative of some semi-natural environments in our study. The model reproduced the temporal variability of temperature with high fidelity, as indicated by a correlation coefficient of 0.98. Quantitatively, the Mean Bias Error (MBE) was 0.23 °C, the Root Mean Square Error (RMSE) was 1.76 °C, and the Mean Absolute Error (MAE) was 1.46 °C. While some discrepancies persist, likely due to the heterogeneity in vegetation structure and the associated complexity of surface–atmosphere interactions (e.g., variable evaporative cooling capacity), these results support the model’s ability to simulate surface temperature dynamics reasonably well.
SiB2 does not explicitly resolve urban canyon geometry or radiation trapping, limiting its use for detailed urban microclimate studies.

2.2. Land Cover and Biophysical Data

To characterize global urban land cover (LC) for the year 2010, we used 30 m spatial resolution impervious surface area (ISA) data from GISA [26]. This high-resolution ISA dataset was integrated with MODIS land cover data at 500 m resolution (MCD12Q1), and both were aggregated to the 10 km × 10 km Climate Modeling Grid (CMG).
The aggregation process treated the Landsat-derived ISA as the “ground truth” and followed three main steps: (1) Landsat ISA data were co-registered to the CMG and aggregated as fractions from 30 m to 10 km resolution; (2) MODIS land cover classes were aggregated from 500 m resolution, generating class fractions at the CMG scale; and (3) the ISA fractions were imposed as “ground truth” in the CMG, replacing MODIS-derived urban and built-up fractions. Any differences between the ISA and MODIS built-up fractions were proportionally redistributed among the remaining non-impervious land cover types, weighted according to their fractional presence within each CMG.
Each CMG could contain up to 12 land cover classes, with fractional coverage derived from the fused Landsat and MODIS datasets. For each class within a CMG, biophysical parameters were generated using the 16-day composite, 500 m resolution MODIS Normalized Difference Vegetation Index (NDVI) [17,27]. These land cover data, along with the vegetation’s physiological, optical, and morphological attributes, were used to define surface and lateral boundary conditions for the land surface model.

2.3. Methodology

This study examines land surface–atmosphere interactions, with a particular focus on how urbanization influences surface temperature structures and dynamics across different urban typologies and climatic zones. We also assess the surface urban heat island (SUHI) effect in multiple cities and relate its intensity to thermal comfort conditions across Morocco. Our analysis is conducted at two spatial and temporal scales: (1) the city scale, where model outputs are analyzed at an hourly timestep to capture diurnal variations in temperature in selected urban centers; (2) the regional scale, where seasonal mean outputs (three-month averages) are evaluated to identify broader spatial patterns and trends across the study domain. Cities were selected a priori based on geographic location, level of urbanization, city size, and representative climate characteristics. For these cities, hourly model outputs were extracted for detailed urban-scale assessments. In contrast, regional-scale analysis focused on seasonal averages across broader domains represented by the administrative regions of Morocco (Figure 1). In both cases, analyses were conducted during the growing season, defined by the period of peak unstressed photosynthesis.
This modeling framework was intentionally designed to isolate the land surface response to a prescribed climate forcing. By using offline simulations with fixed atmospheric inputs, the study excludes land–atmosphere feedbacks, allowing a clear attribution of surface temperature changes to land cover characteristics, including urbanization.

3. Results and Discussion

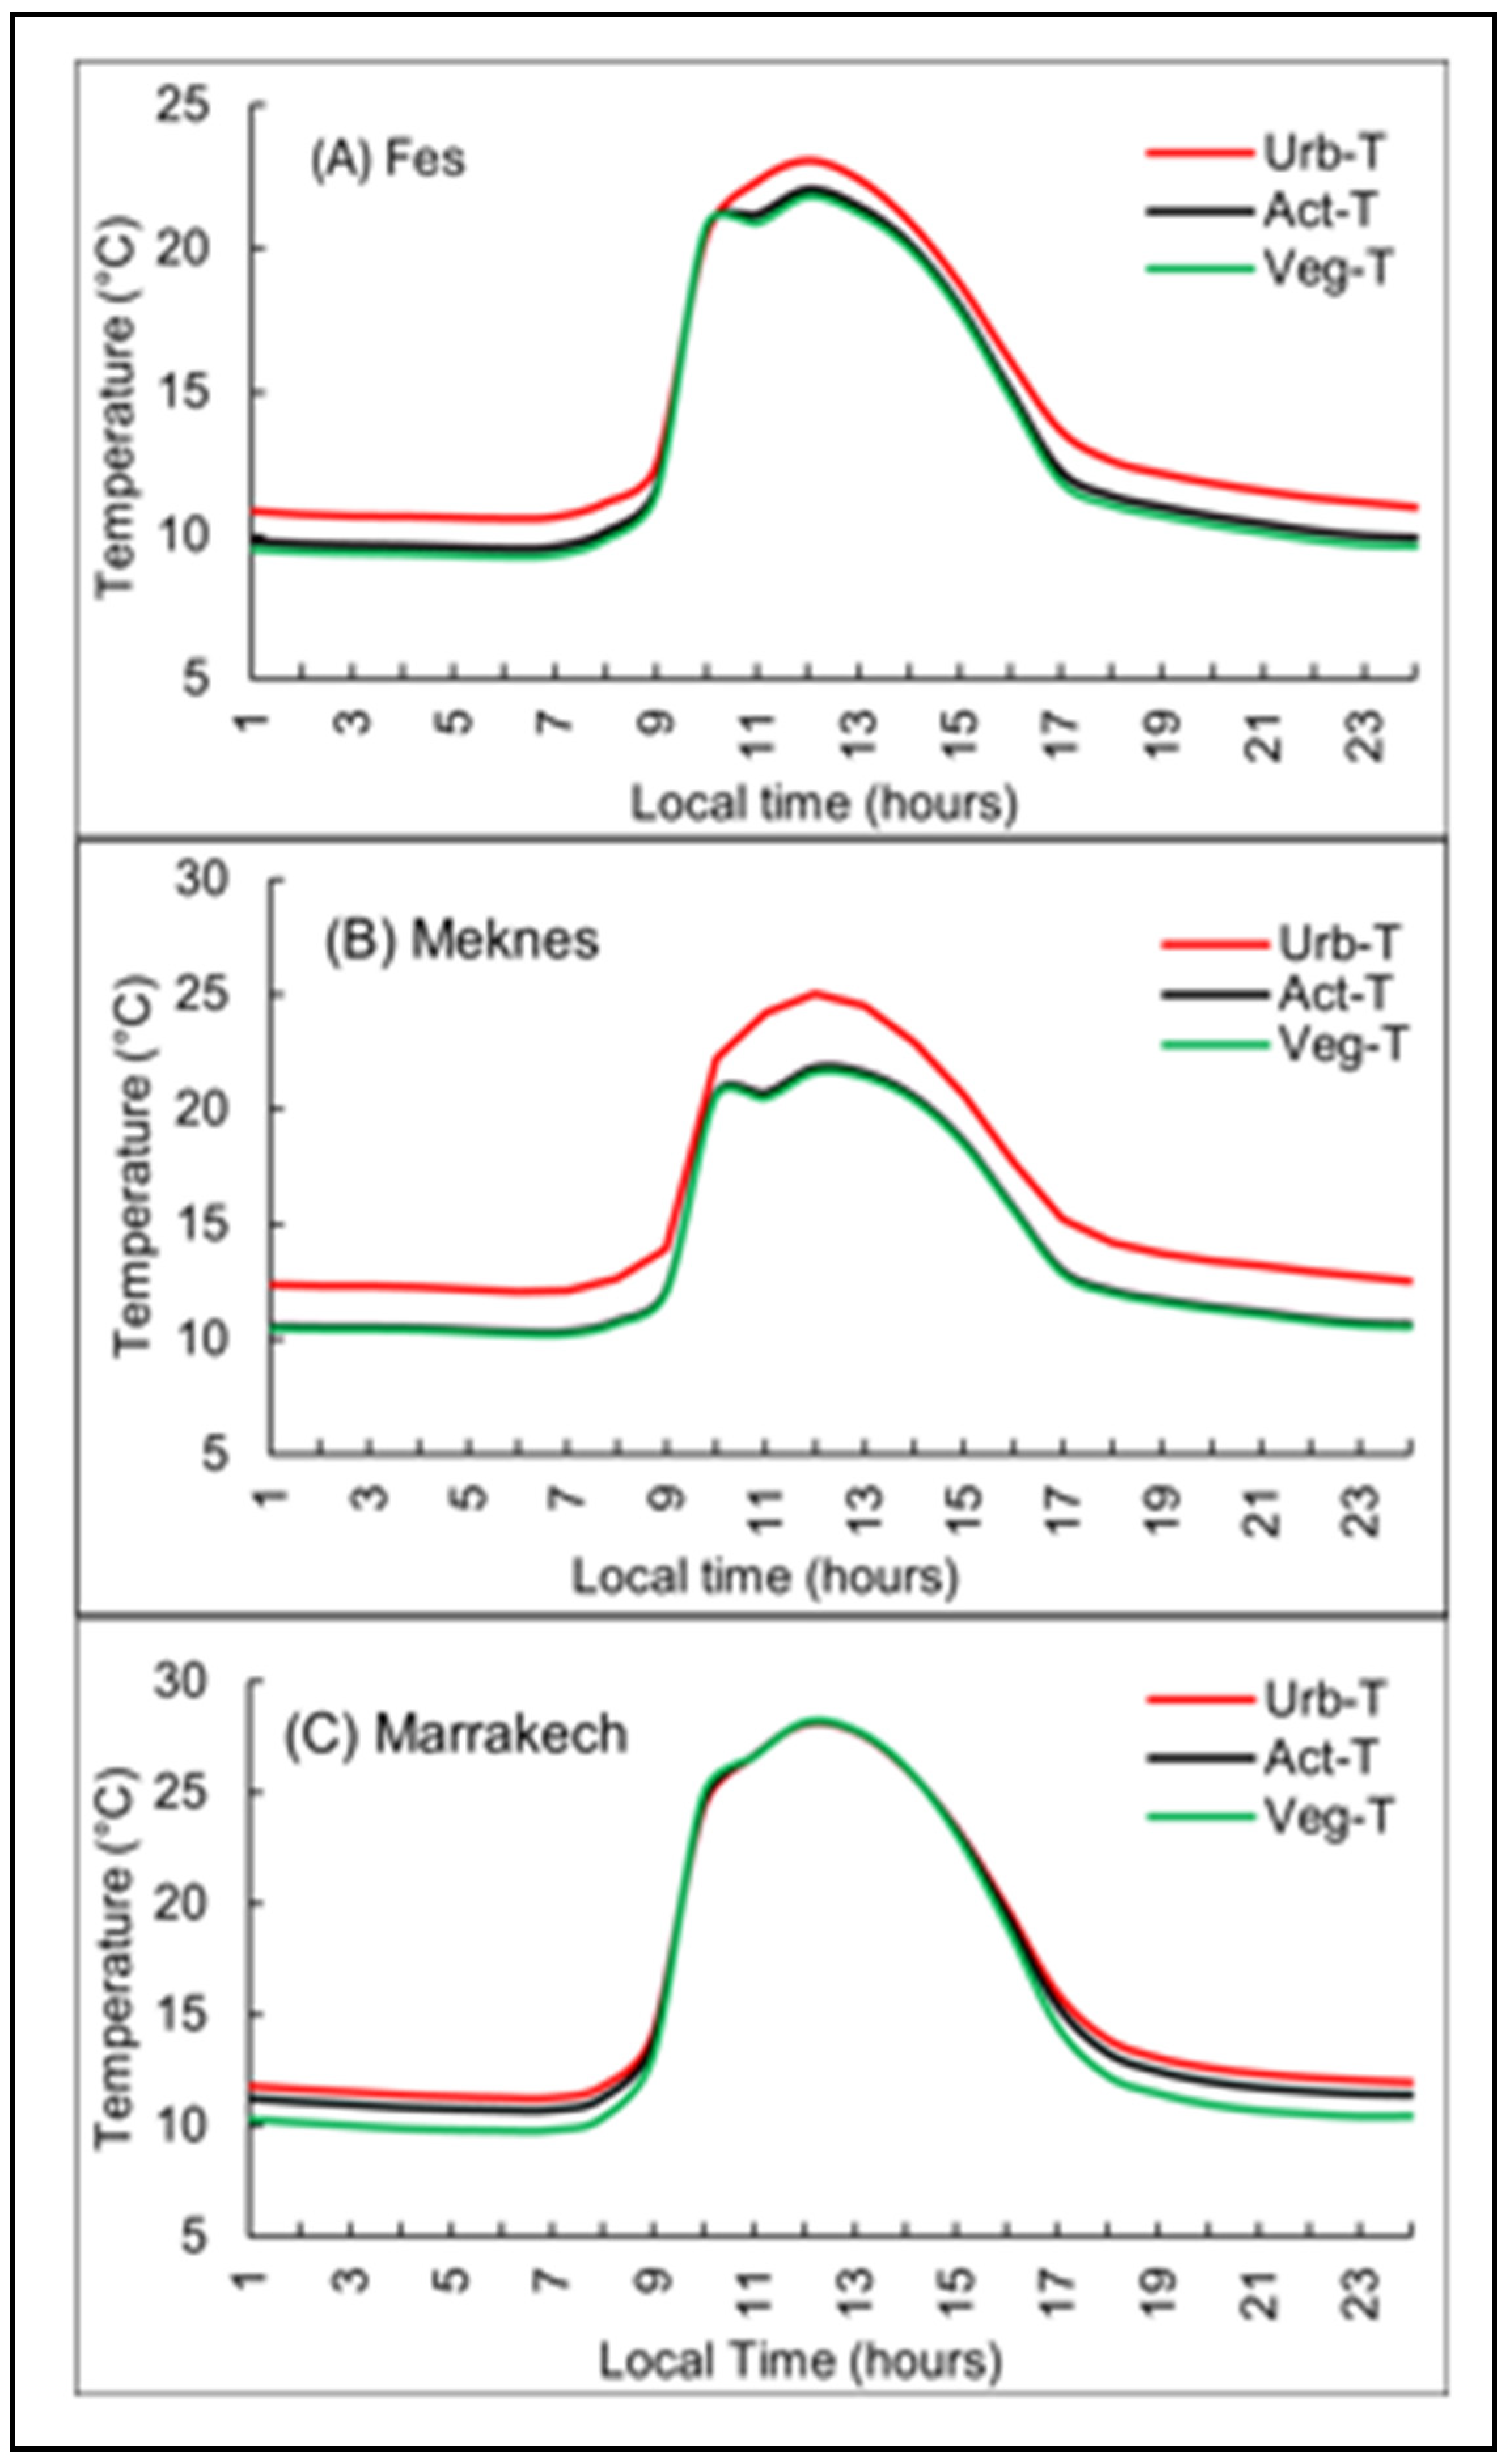
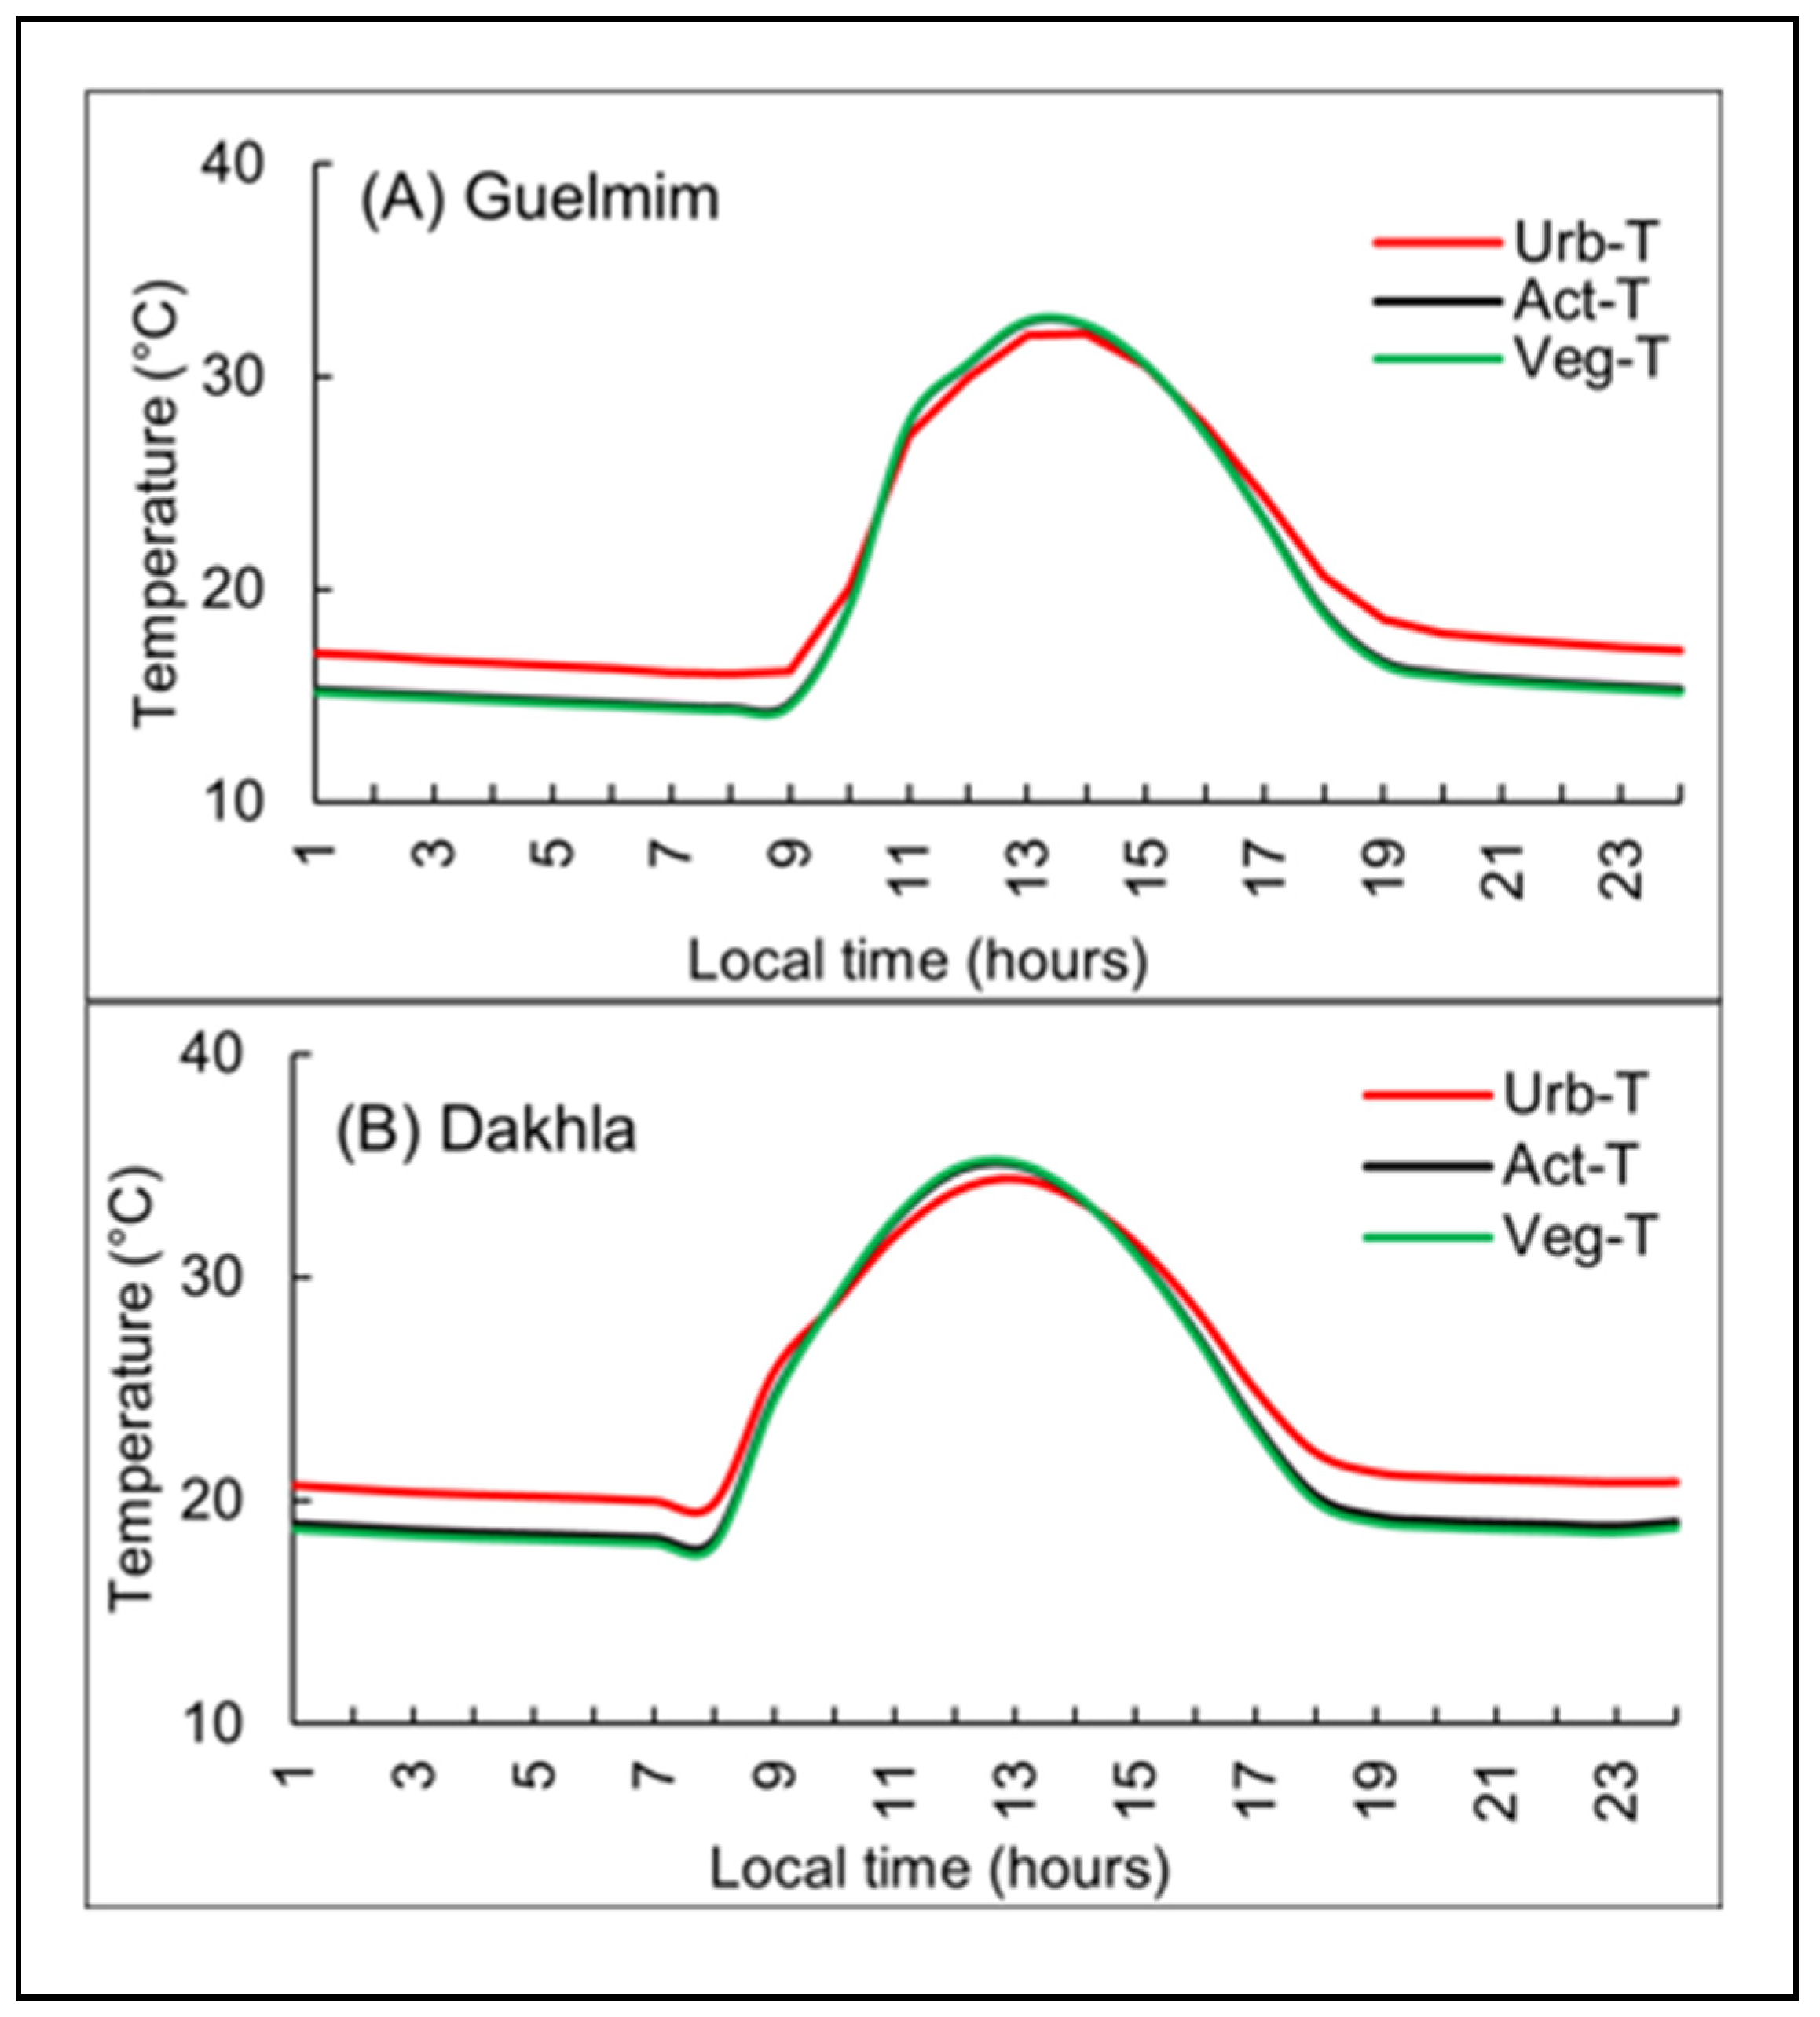
3.1. Diurnal Response

The hourly time series of physiological and climate variables were extracted for selected urban centers over a full simulation year. From these data, seasonal composite diurnal cycles were constructed to evaluate city-level surface climate conditions. The study region spans a broad latitudinal and ecological gradient, from the Atlantic coast to interior continental zones, encompassing diverse climates, vegetation types, and growing seasons that vary by geographic location. In coastal cities such as Tangier, Rabat, Agadir, and Dakhla, the dominant growing season occurs during December–January–February (DJF), coinciding with the cooler and wetter months of the year. Similarly, interior urban centers like Fes, Meknes, and Marrakech also exhibit peak vegetation activity in DJF. However, during March–April–May (MAM), these inland regions often begin to experience water stress due to declining precipitation, which limits both the photosynthetic capacity and transpiration (Figure 2).
In contrast, Mediterranean-facing cities such as Tetouan, Al Hoceima, and Oujda show a shift in peak vegetation activity during MAM, reflecting seasonal moisture availability and phenological dynamics. The arid city of Guelmim, located in the Sahara Desert, also displays a winter growing season. To examine how vegetation modulates local surface climate, we analyzed hourly surface temperature patterns within and around each urban center during their respective growing seasons. These analyses aim to clarify the thermal buffering effects of vegetation and its interaction with urban impervious surfaces. In the SiB2 land surface model, CO2 uptake via photosynthesis is closely linked to transpiration through stomatal conductance, which dynamically responds to root-zone soil moisture and atmospheric conditions [28]. Photosynthetic activity is governed by two key parameters: the fraction of photosynthetically active radiation (FPAR), derived from NDVI for each land cover type, and stomatal conductance, which is sensitive to local hydroclimatic conditions. This modeling framework enables the realistic simulation of vegetation–climate interactions, particularly the conversion of soil moisture into latent heat flux via photosynthesis, a central mechanism for evaporative cooling.
Seasonal composite diurnal temperatures for each city were generated hourly using 92 realizations, corresponding to the number of days in the growing season. To distinguish thermal responses by land cover, three surface temperature profiles were calculated: (1) a total weighted average across all land cover types, referred to as actual temperature, (2) an urban-only profile, and (3) a vegetation-only weighted average excluding impervious surfaces. Cities within similar ecoregions exhibited comparable diurnal surface temperature patterns, though with notable differences in peak amplitude and timing.
For example, northern coastal cities such as Tangier and Rabat (Figure 3A,B) reached maximum temperatures around midday (12:00 local time), with Rabat peaking at 24.6 °C compared to 21.6 °C in Tangier. The higher simulated temperatures in Rabat result from its lower latitude, shorter vegetation cover, and drier soils, all factors that reduce evapotranspiration and enhance sensible heat flux. In contrast, Tangier’s taller vegetation promotes shading and transpiration, while its coastal location fosters stronger nocturnal cooling. As a result, both urban and vegetated surfaces are consistently warmer in Rabat than in Tangier, with temperature differences of approximately 2.3 °C in the urban core and 3.3 °C in vegetated areas.
The average surface urban heat island (SUHI) intensity, defined as the surface (skin) temperature difference between the urban and surrounding vegetated areas, was 1.0 °C around noon and 1.3 °C overnight in Rabat. In Tangier, the SUHI reached 1.8 °C between noon and 2 p.m. and 1.3 °C at night, indicating a more pronounced diurnal contrast between urban surfaces and adjacent vegetation. Notably, during periods of low solar incidence (e.g., 9–10 a.m.), both urban and vegetated surfaces in Tangier and Rabat warmed at similar rates. However, during peak solar input (10 a.m. to 2 p.m.), urban surfaces continued to warm while vegetation temperatures plateaued in Tangier, producing a daytime SUHI of approximately 1.8 °C. This underscores the strong thermoregulatory role of vegetation in buffering surface heat.
Between 3 and 5 p.m., vegetated surfaces in Tangier were approximately 1.4 °C cooler than their urban counterparts. After sunset, the presence of tall vegetation facilitated continued cooling, reaching a nighttime thermal equilibrium around 14 °C. In contrast, Rabat’s shorter vegetation, more sensitive to high midday temperatures, experienced limited transpiration during peak solar hours. This caused the temperature of vegetated surfaces to converge with urban temperatures, with a reduced difference of ~1.0 °C during the 3–5 p.m. window. A review also examined this finding, indicating that multiple studies have demonstrated how different types of vegetation affect urban cooling in varying ways. This includes the influence of canopy height and transpiration rates on the reduction in surface temperatures [29]. Rabat’s landscape, bordered by the Bouregreg River and the Atlantic Ocean, also absorbs and slowly releases heat, contributing to elevated nighttime urban temperatures but producing a smaller SUHI amplitude compared to Tangier.
Agadir, located further south near 30° N, exhibits considerably warmer conditions during DJF, with a midday peak total surface temperature reaching 29.6 °C (Figure 3C). Although early morning heating trends mirror those observed in Rabat and Tangier, Agadir’s afternoon profile shows a sharp narrowing of the urban–vegetation temperature gap. Between 3 and 5 p.m., the SUHI amplitude declines significantly to just 0.6 °C, suggesting a pronounced vegetation stress and reduced cooling capacity. Compared to Tangier’s daytime SUHI of 1.8 °C, Agadir’s diminished contrast highlights a breakdown in vegetation’s thermoregulatory function under semi-arid conditions (Table 1). Three additional cities, Oujda, Tetouan, and Al Hoceima, spanning diverse ecological zones, are illustrated in Figure 4. Oujda, situated inland at ~450 m elevation, has a relatively high impervious surface area (ISA) of 26.15%. Tetouan lies on the coastal foothills of the Rif Mountains, while Al Hoceima is positioned directly on the Mediterranean coast at sea level. All three cities reach peak unstressed photosynthetic activity during the spring months (MAM). In each case, urban surfaces register higher temperatures than the surrounding vegetation, with midday urban temperatures peaking at 33.2 °C in Oujda, 31.8 °C in Tetouan, and 30.9 °C in Al Hoceima. These differences reflect their geographic contexts and suggest that proximity to the sea exerts a stronger cooling influence than elevation. A study conducted for 11 sites along the Caspian Sea examined the seasonal and daily effects of the sea on surface urban heat island intensity. The results revealed that coastal locations experienced significantly lower daytime urban heat island intensities compared to inland sites, highlighting the strong cooling influence of the proximity to the sea. Furthermore, the study showed that this moderating effect varied with the season and time of day, being most pronounced during warmer periods and daylight hours [30].
The surrounding landscapes also vary. Oujda and Al Hoceima are bordered primarily by short grasslands, shrublands, and bare soils, with sandy patches around Al Hoceima. In contrast, Tetouan is encircled by more diverse vegetation, including evergreen needleleaf forests, savanna formations, and cropland mosaics. This ecological richness, combined with geographic positioning, results in a moderate SUHI intensity in Tetouan, averaging 2.2 °C from 11 a.m. to 2 p.m., compared to 1.1 °C in Oujda and only 0.6 °C in Al Hoceima (Table 1).
Fes and Meknes, two interior cities in northern-central Morocco, display distinct microclimatic patterns despite their close proximity (see Figure 1). Fes sits at approximately 400 m above sea level, while Meknes lies slightly higher at 500 m. This elevation contributes to a marginally cooler midday average temperature in Meknes (21.8 °C) relative to Fes (22.1 °C), aligning with the standard decreasing temperature lapse rate of ~0.65 °C per 100 m. Both cities experience a Mediterranean climate with semi-arid traits. Meknes, located in the fertile Saïs Plain, supports extensive agriculture, including cereals, olives, orchards, and vineyards, and is recognized as a key agricultural hub. Fes, by contrast, is surrounded by more rugged terrain and supports traditional, water-sensitive farming on fragmented plots.
Urban structure and land cover further differentiate the two cities. Fes is a larger urban center with an ISA of 20%, nearly four times that of Meknes (5%). While peak midday vegetation-only temperatures are similar, being 21.8 °C in Fes and 21.6 °C in Meknes, urban temperatures diverge more: 23.1 °C in Fes versus 25.0 °C in Meknes (Figure 5A,B). This pattern holds across early morning and late afternoon periods, with greater urban–vegetation contrasts in Meknes, likely due to its dominance of irrigated agriculture.
Benefiting from the Green Morocco Plan [31], Meknes has experienced major improvements in irrigation and crop productivity, reinforcing the contrast between cooler vegetated zones and warmer urban areas. As a result, its SUHI intensity from 11 a.m. to 2 p.m. is more than three times greater than that of Fes. This is attributed to higher urban temperatures in Meknes’s more exposed and sprawling urban layout, in contrast to the compact medina of Fes. The latter’s dense architecture, narrow streets, and thick walls contribute to daytime shading and nighttime heat release, an effect commonly referred to as the “urban canyon”.
Further south, the semi-arid city of Marrakech (31.6° N) exhibits significantly higher midday urban temperatures, reaching 28.2 °C (Figure 5C). With scant rainfall even during its DJF growing season, vegetation around Marrakech remains stressed by limited soil moisture and high temperatures. Notably, the surrounding rural vegetation often registers warmer temperatures than the urban core, a reversal of the typical SUHI pattern. This phenomenon is largely due to urban ventilation and the prevalence of irrigated gardens and green spaces within the city, particularly in tourist zones. As a result, Marrakech displays a distinct Urban Heat Sink (UHS) effect, where the city is cooler than surrounding vegetation (Table 1). A similar Urban Heat Sink effect was reported by El Ghazouani et al. [32], who found that irrigated vegetation in the core of Marrakech significantly reduced surface temperatures, with amplitudes reaching up to 12 °C compared to the surrounding arid areas.
Because Marrakech spans less than 20 km, the model captures it using just a few pixels. Zonally averaged temperature profiles were therefore derived from a 50 km radius around the city center during DJF. Figure 6 shows the meridional temperature distribution: urban temperatures are ~1.3 °C higher than the surrounding vegetation at the center. Average temperatures during the growing season are ~14.3 °C in the center, compared to 14.6 °C north and 14.0 °C south of the city (about 10 km from the core). Beyond this range, urban and vegetation temperatures converge, indicating minimal impervious surface influence. As a possible scenario, if Marrakech were fully impervious, center temperatures would rise by 1.3 °C and peripheral temperatures by ~1.2 °C. However, in the current configuration, urban impervious surfaces contribute less than 0.1 °C to the temperature at the city center (see dashed line, Figure 6).
The southern cities of Guelmim and Dakhla, both with DJF growing seasons, share several features due to their desert adjacency and coastal settings. Guelmim, located near the Anti-Atlas Mountains, has a rocky, arid landscape with sparse vegetation, mainly in oases and irrigated plots. It has a low ISA (~8%), and its desert vegetation is 0.7 °C warmer than the urban core, which benefits from supplemental watering and maintained green areas (Figure 7A). Dakhla, on a narrow Atlantic peninsula, experiences a unique hybrid climate influenced by both oceanic and Saharan conditions. Its urban area covers just 3.5% of the grid, while cropland occupies 24%, and the rest is largely water. A well-defined nighttime SUHI of 2.1 °C is observed between urban and vegetated surfaces (Figure 7B). Yet, during peak daytime insolation, the urban core is actually cooler by −0.7 °C, a UHS effect, due to the irrigated parks and lawns that enhance evaporative cooling and shading [33].
Under thermal or hydrological stress, plants close their stomata, limiting photosynthesis and transpiration, which in turn raises canopy temperatures. This relationship is evident in Figure 8, which shows that ~80% of the variance in the urban–vegetation temperature differential is explained by daytime accumulated vegetation transpiration (R2 = 0.8), though other factors also contribute. These findings underscore the essential role of terrestrial vegetation in regulating urban surface temperatures. Both the quantity and type of vegetation influence thermal dynamics, emphasizing the ecological composition’s importance in shaping local urban climates. This finding is in line with previous research, indicating that evaporative cooling was the dominant mechanism under high solar radiation and sufficient moisture conditions [34].

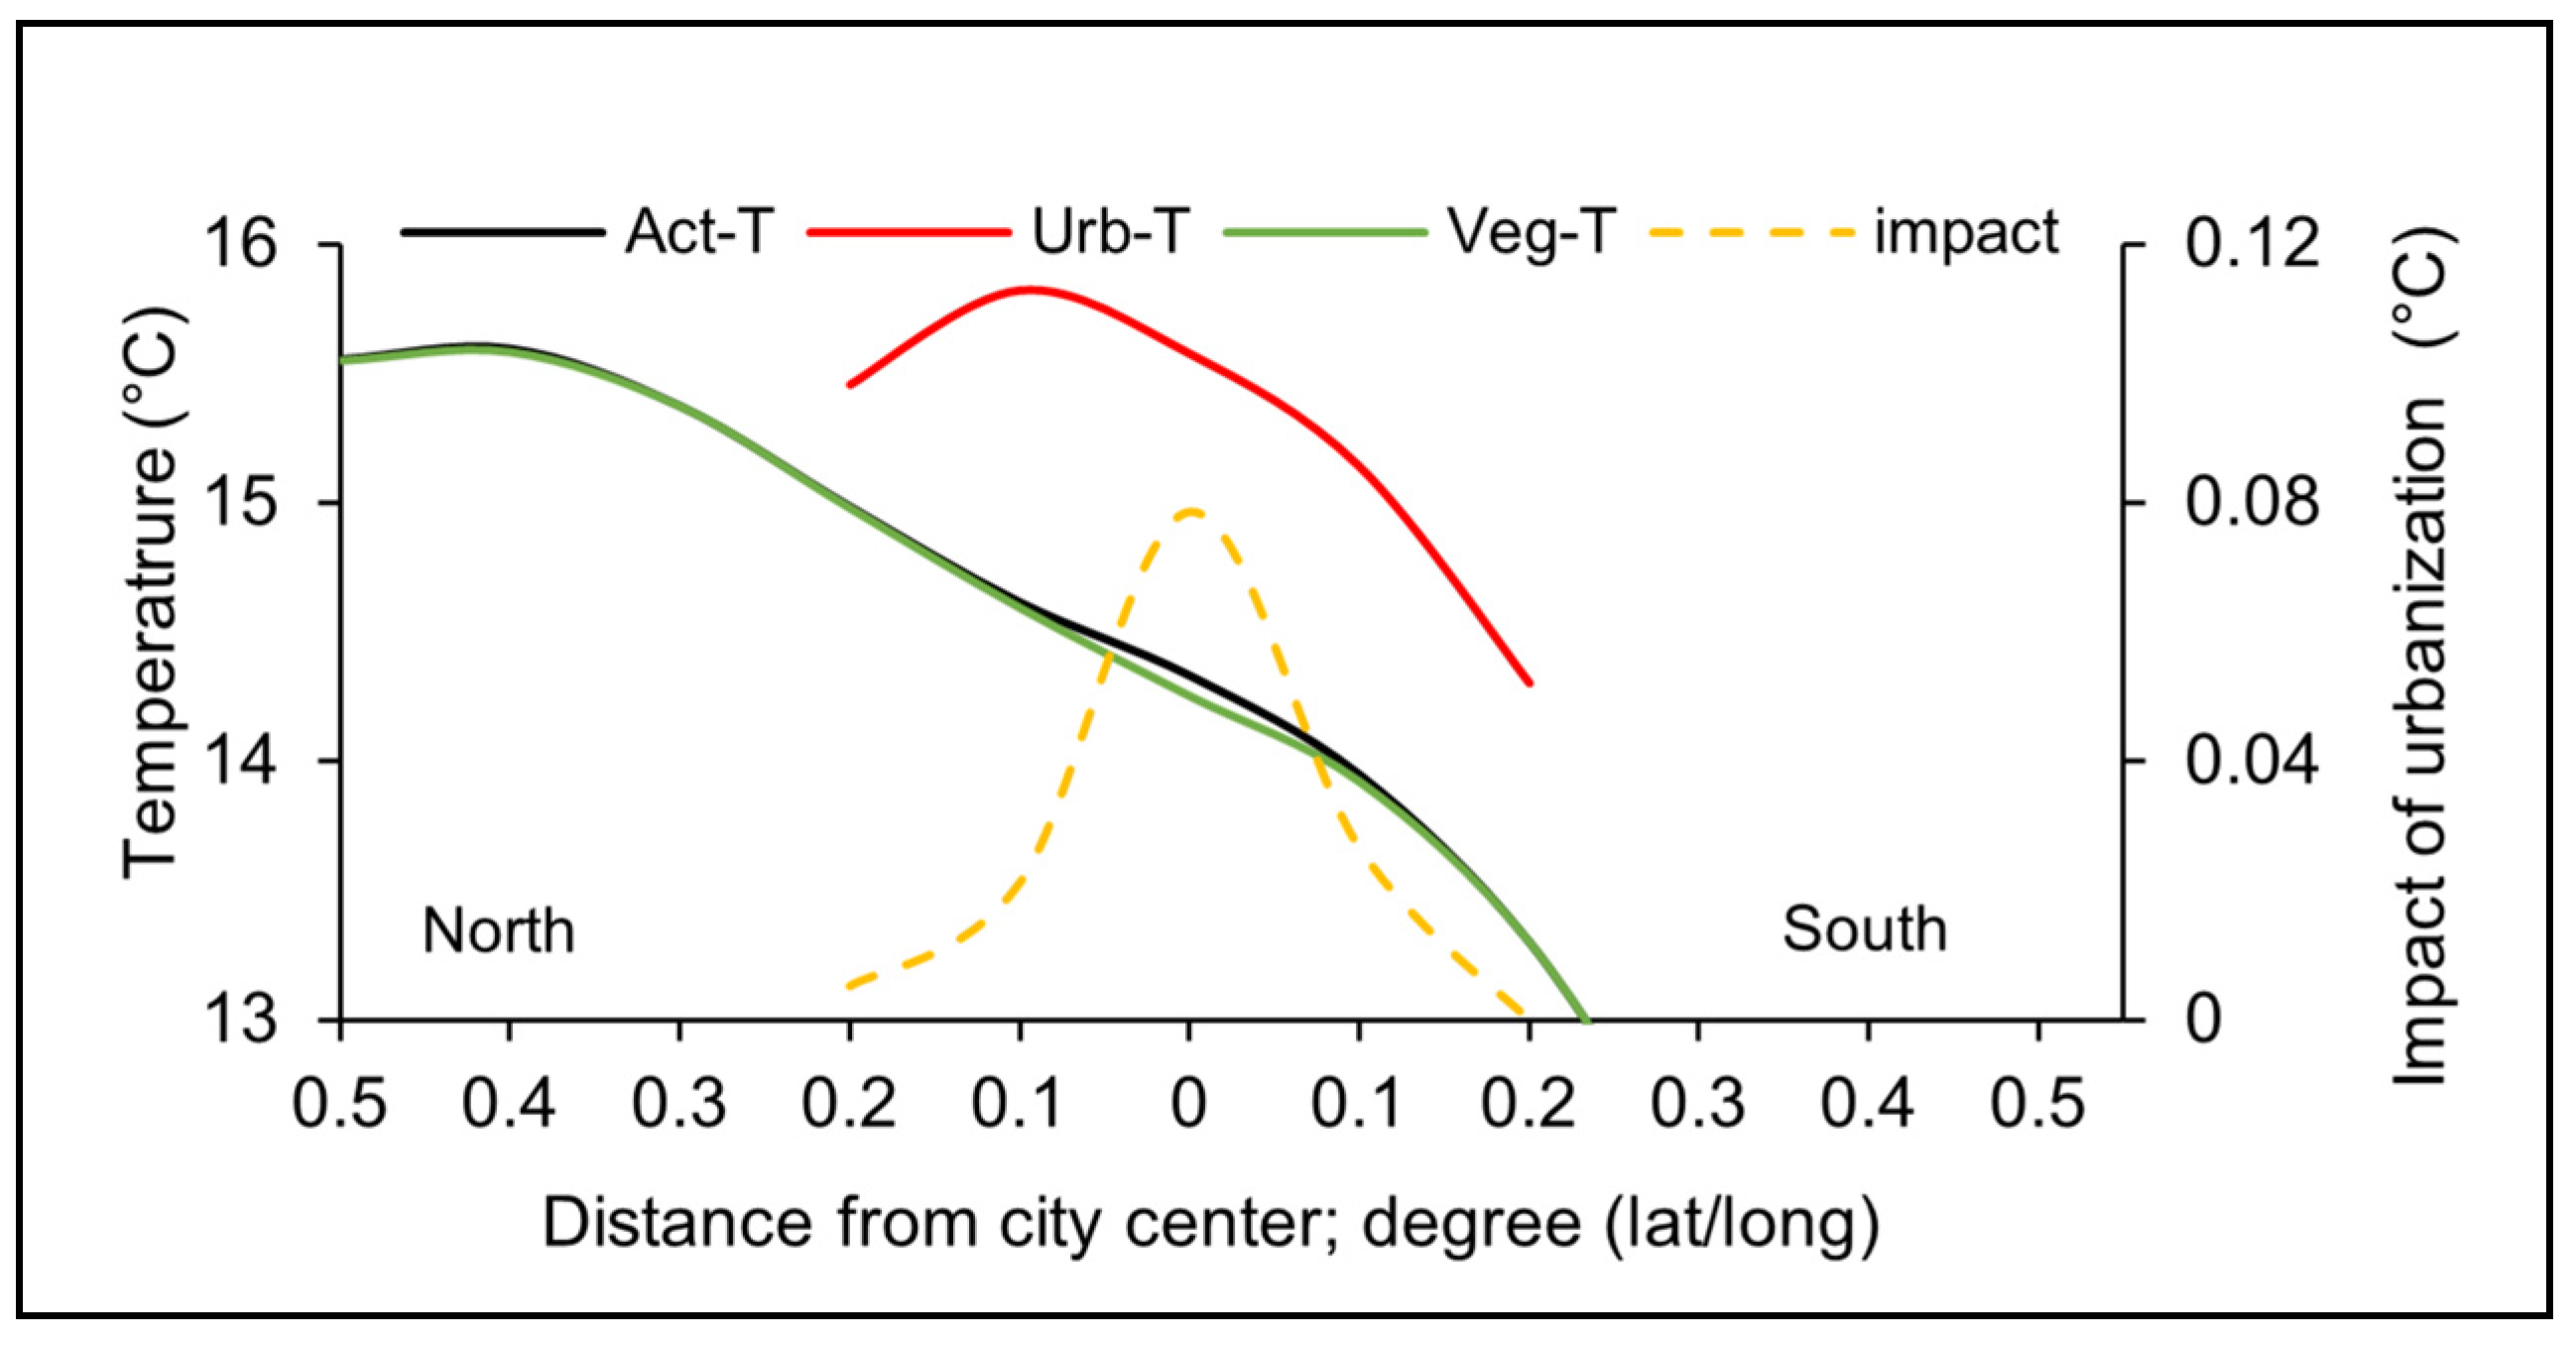
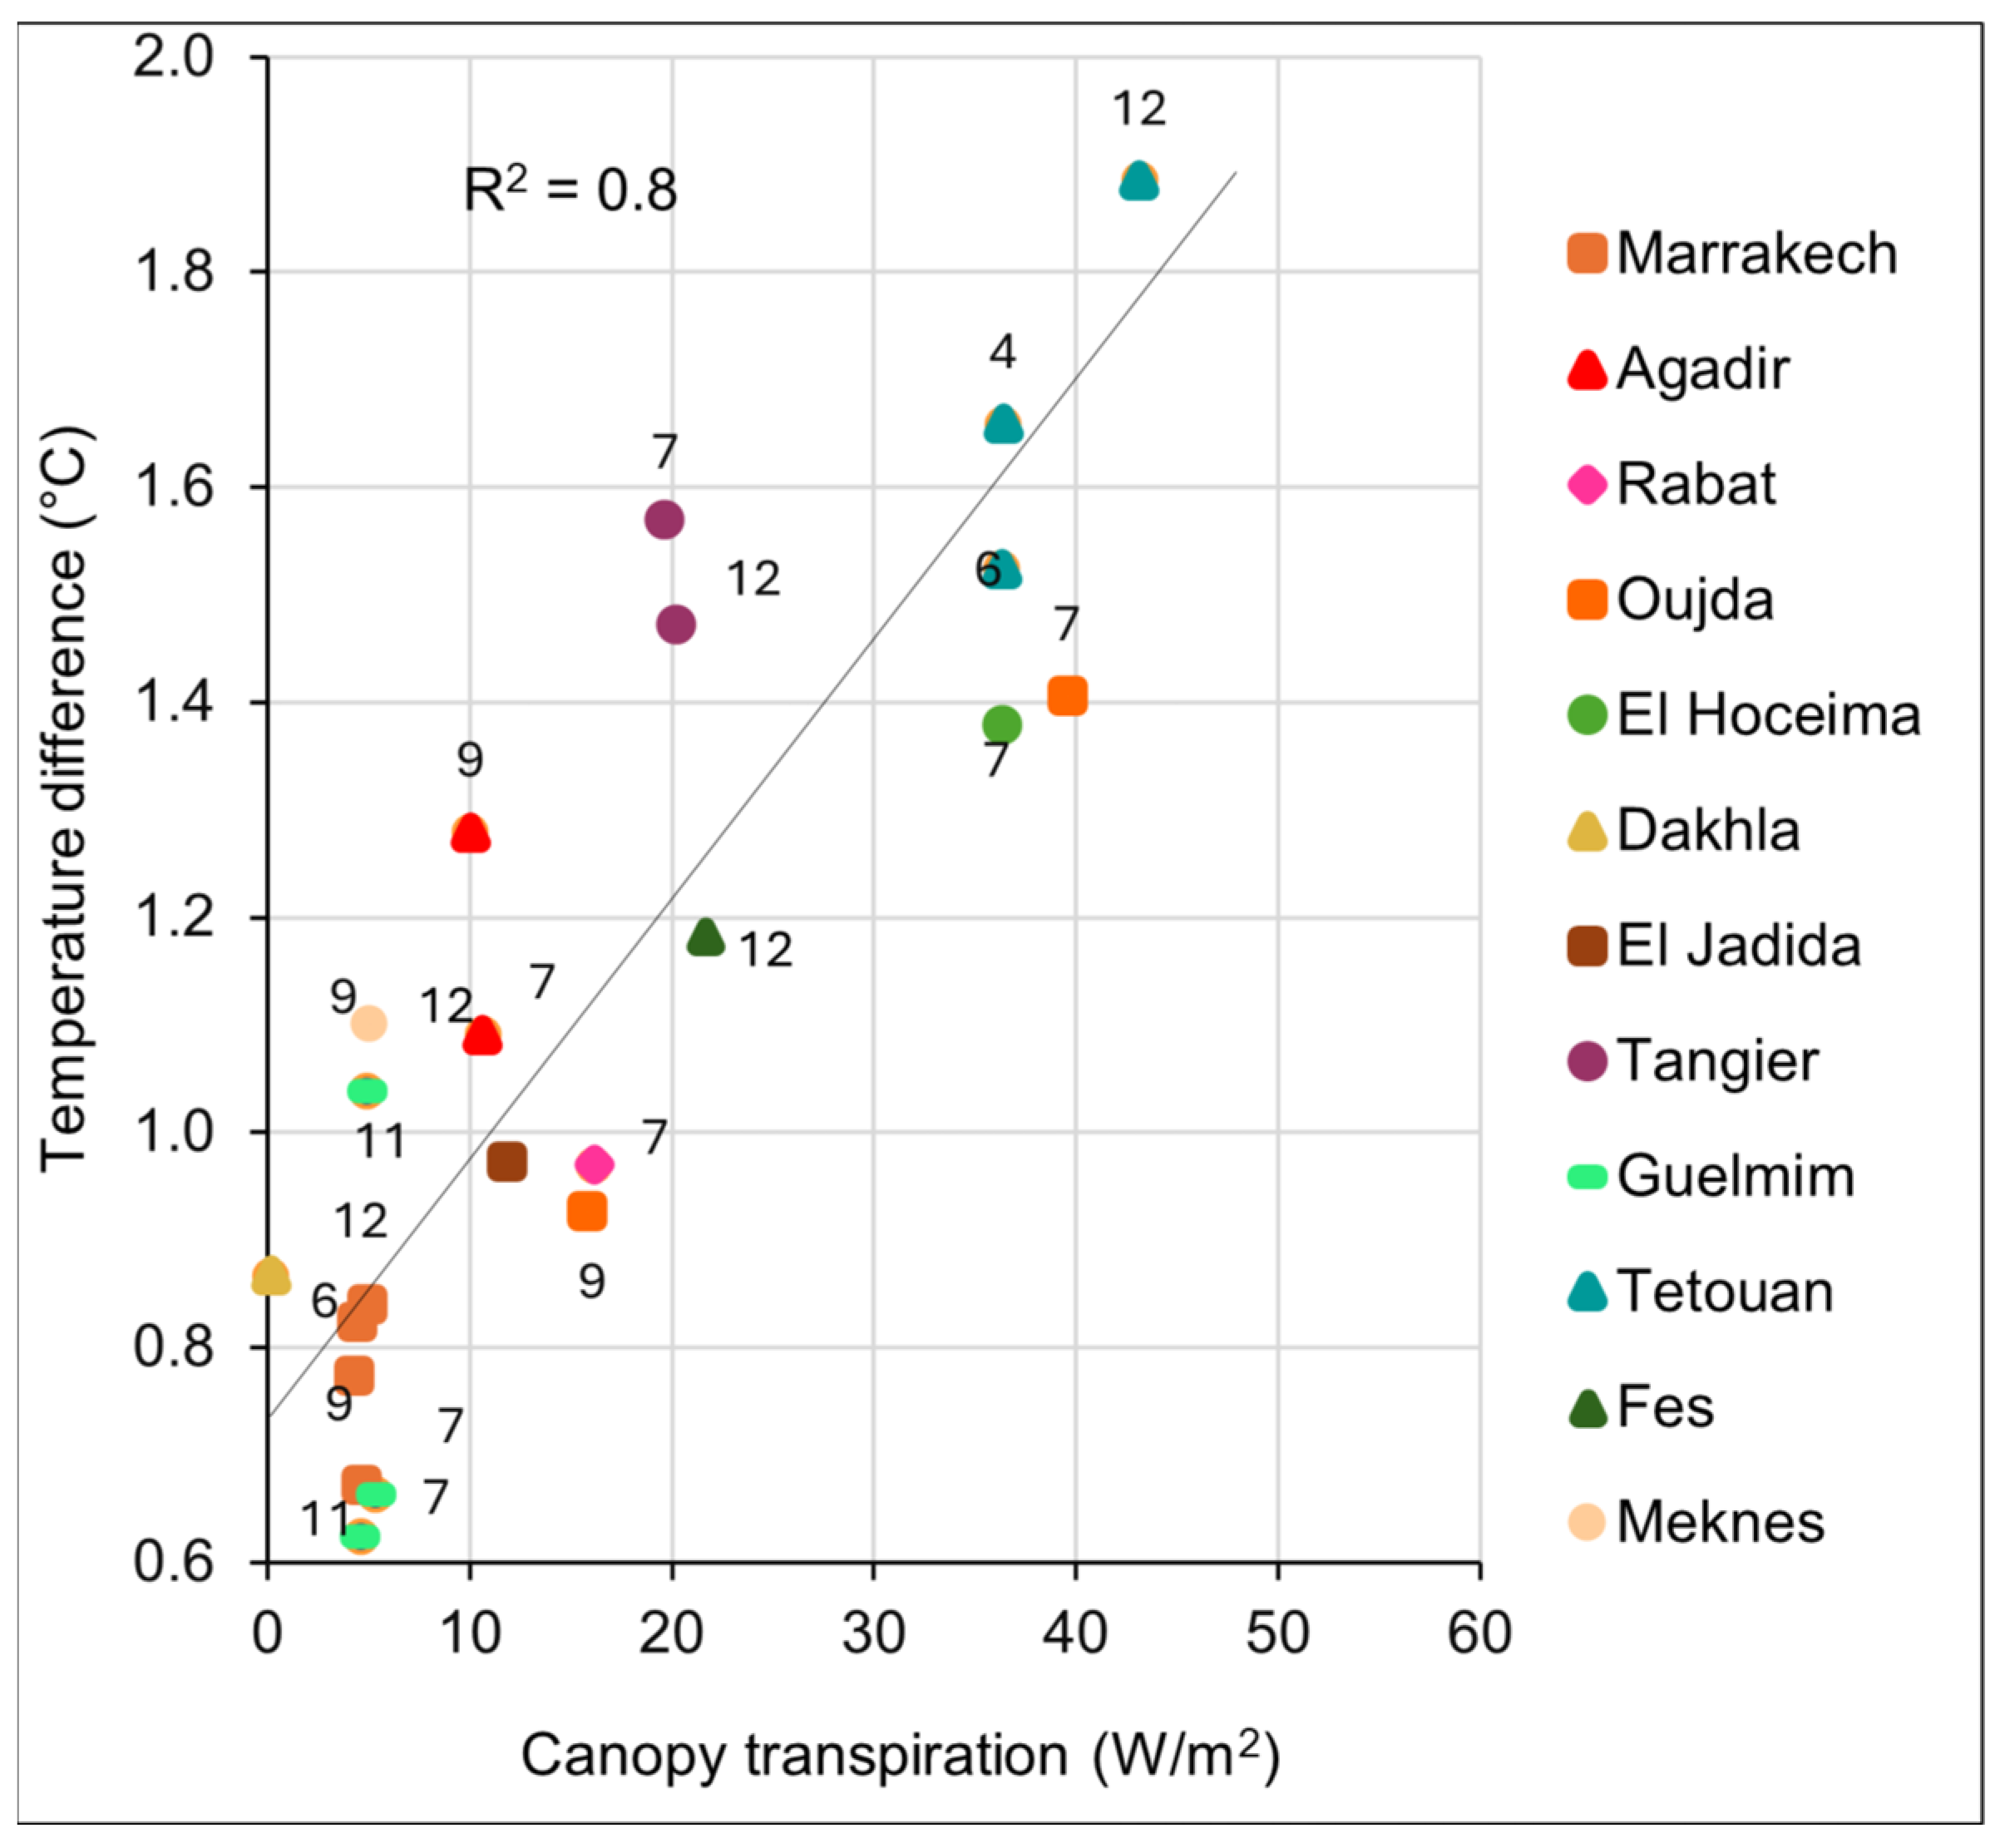
3.2. Seasonal Response and Urban Thermal Impact

It is important to note that the SUHI quantifies surface skin temperature differences and does not directly represent human thermal comfort, which depends on multiple physiological and meteorological factors such as air temperature, humidity, wind speed, and radiation. Therefore, while the SUHI and UTIR provide valuable insight into urban thermal environments, they should be interpreted cautiously and, ideally, alongside physiological indices for comprehensive assessments.
Our results highlight a critical insight, and the SUHI amplitude alone is insufficient as a proxy for thermal discomfort or public health risk. For instance, in Tangier, a vegetation temperature of 20.8 °C and urban temperature of 22.8 °C yield a SUHI amplitude of 2.0 °C. Although this relative difference appears significant, the absolute urban temperature remains thermally benign and within the human comfort zone. In contrast, in Agadir, the vegetation temperature reaches 29.4 °C, and urban surfaces rise to 30.2 °C, resulting in a smaller SUHI amplitude of 0.8 °C; yet, the absolute temperatures exceed comfort thresholds and may impose heat stress on both human populations and urban vegetation. This contrast exposes a conceptual flaw in interpreting the SUHI as an impact-oriented metric. As a relative measure, the SUHI amplitude conveys little about actual thermal stress unless contextualized against absolute comfort thresholds. To address this limitation, we propose a new dimensionless index: the Urban Thermal Impact Ratio (UTIR), which contextualizes urban temperatures relative to both rural baselines and comfort thresholds:
U r b a n   T h e r m a l   I m p a c t   R a t i o   ( U T I R )   =   T u T c T u T r
where T u is the urban temperature, T r is the rural or vegetated temperature, and T c is the thermal comfort threshold (e.g., based on Wet-Bulb Global Temperature (WBGT) or empirical values) with T u T c > T r . This ratio quantifies the excess heat burden experienced in urban centers in terms of the SUHI amplitude and is a useful metric to quantify the intensity and discomfort of urban heat relative to a defined thermal comfort threshold. It normalizes discomfort across cities with different climates and allows comparison between cities or seasons independent of their absolute temperatures.
At its minimum value, when the urban temperature   T u equals the thermal comfort threshold T c , the UTIR becomes zero, indicating the absence of thermal stress. When 0 < UTIR < 1, the urban temperature exceeds the comfort threshold but by less than the full surface urban heat island (SUHI) intensity, suggesting a comfortable level. When UTIR = 1, the comfort threshold   T c equals the rural reference temperature   T r , and the entire SUHI intensity corresponds exactly to the discomfort threshold, implying a mild discomfort. When UTIR > 1, the urban temperature surpasses the comfort threshold by more than the SUHI amplitude, indicating severe thermal stress beyond what is accounted for by the SUHI effect alone.
Integrating this contextualized metric offers a more accurate and impact-relevant framework for assessing urban heat stress, particularly across diverse climates and in regions where low UHI amplitudes may obscure significant thermal stress. This enhances the effectiveness of climate adaptation strategies and urban planning. We used the MERRA-2 summer mean maximum temperatures for 2010 for the 12 regions of Morocco and estimated the seasonal Urban Thermal Impact Ratio (Table 2).
The comfort temperature, Tc, reflects climatic and adaptive differences. For this study, we used region-specific summer comfort thresholds ranging from 26 °C to 30 °C.
In the regions of Tangier-Tetouan-Al Hoceima (TTA), Rabat-Sale-Kenitra (RS), and Casablanca-Settat (CS), the UTIR remains less than one, indicating that the departure of urban temperatures from thermal comfort thresholds is lower than the SUHI amplitude. In practical terms, while urban warming is present, it does not exceed discomfort thresholds, suggesting a partially mitigated urban heat impact. Based on these mean summer maximum temperatures, TTA emerges as the region with the most favorable thermal conditions. Mild thermal discomfort is recorded in the northern inland regions, particularly the Oriental and Fes-Meknes. Elevated discomfort levels are observed in Marrakech-Safi and Beni Mellal-Khenifra, while severe thermal discomfort is prevalent in the arid southern regions of Guelmim-Oued Noun, Laayoune-Sakia El Hamra, and Dakhla-Oued Ed-Dahab. Despite their severe discomfort, the latter two regions have relatively low UTIR values compared to the inland Guelmim-Oued Noun, attributed to their coastal and peninsular locations, respectively.
To assess the practical reliability of the Urban Thermal Impact Ratio (UTIR) as an indicator of urban thermal discomfort, we conducted a comparative evaluation using the Wet-Bulb Globe Temperature (WBGT), a widely adopted physiological index for heat stress assessment. The WBGT integrates meteorological variables such as air temperature, humidity, wind speed, and solar radiation to quantify heat risk, particularly in occupational and environmental health contexts. While UTIR is a dimensionless index derived solely from surface temperature data and a defined thermal comfort threshold, its simplicity allows for a scalable and data-efficient application across regions with limited meteorological observations.
To explore whether UTIR aligns with physiologically based comfort assessments, we calculated WBGT values for 12 administrative regions of Morocco for the summer of 2010, using climatological relative humidity values and an empirical relationship between dry-bulb and wet-bulb temperatures. The resulting WBGT values were classified using standard thresholds, reflecting comfort levels ranging from “Comfortable” to “Severe Discomfort” (see Appendix A for threshold comparison). We then compared these WBGTs and derived comfort levels with those obtained from the UTIR for the same regions.
Except for the region of Marrakech-Safi, where the two indices differ slightly at the transition zone between “Discomfort” and “Severe Discomfort,” the comparison revealed a strong agreement between the two indices. Regions where the UTIR indicated low thermal stress (e.g., Tangier-Tetouan-Al Hoceima, Rabat-Sale-Kenitra, and Casablanca-Settat) were similarly classified as comfortable by the WBGT (Table 3). Conversely, desert and arid regions such as Guelmim-Oued Noun, Laayoune-Sakia El Hamra, and Dakhla-Oued Ed-Dahab showed high UTIR values consistent with “Severe Discomfort” in the WBGT-based classification. While WBGT and UTIR are not identical in scope, WBGT being physiological and UTIR thermophysical, their convergence across diverse climate settings provides a grounded empirical check of the UTIR’s validity. This analysis supports UTIR as a pragmatic, scalable alternative for evaluating urban heat stress, particularly where detailed atmospheric observations are unavailable.
We evaluated the UTIR at the local scale and across the mean diurnal summer (JJA) cycle by examining urban and vegetated surface temperatures in three Moroccan cities: Tangier, Rabat, and Casablanca, representing diverse climatic and administrative settings. The UTIR exhibited consistent sensitivity to diurnal temperature fluctuations, with thermal stress emerging at comfortable levels around 11:00 a.m. and gradually dissipating by 3:00 p.m. in all three cities (Figure 9). The peak of thermal discomfort occurred between 12:00 p.m. and 3:00 p.m., reaching a maximum at 1:00 p.m., approximately twice the magnitude of the local surface urban heat island (SUHI) amplitude, indicating a mild but notable heat stress. These findings highlight the UTIR’s reliability as a diagnostic indicator of intra-urban thermal dynamics. Its responsiveness to both the timing and intensity of heat stress makes it a valuable tool for assessing daytime urban thermal discomfort. While direct health data were unavailable, the UTIR showed consistent spatial and seasonal patterns when compared with WBGT-based risk classes, supporting its potential as a proxy for heat stress and holding promise as a practical and scalable predictor of urban heat stress, particularly in data-scarce environments, thus supporting climate-resilient urban planning and early warning systems. Unlike other indices, which require multiple meteorological or physiological inputs, the UTIR provides a scalable, data-efficient alternative based solely on surface temperatures and comfort thresholds, making it particularly useful in data-sparse regions.

3.3. Socio-Economic Dimensions of Urban Thermal Discomfort

While the UTIR effectively captures the physical intensity and timing of urban thermal stress, it is important to recognize that thermal discomfort is not experienced uniformly across all urban populations. Socio-economic factors such as income level, housing quality, access to green spaces or cooling infrastructure, and occupational exposure significantly influence vulnerability to heat stress. For instance, even in regions like Tangier-Tetouan-Al Hoceima or Rabat-Sale-Kenitra, where the UTIR remains below discomfort thresholds, populations living in informal settlements or working in outdoor environments may still face elevated heat-related risks due to a reduced adaptive capacity. Conversely, regions like Marrakech-Safi or Beni Mellal-Khenifra, where the UTIR indicates a high thermal burden, may require targeted interventions to protect vulnerable populations such as the elderly, children, or low-income groups with limited access to cooling resources. Previous studies have shown that urban heat disproportionately affects marginalized communities, especially in areas with poor urban planning and limited vegetation cover [35,36]. Integrating socio-economic vulnerability layers alongside the UTIR could thus enhance its utility for equitable heat risk management, guiding local authorities toward climate-resilient and socially inclusive adaptation strategies [37,38].

4. Concluding Remarks

This research provides new insights into the physical processes governing surface climate variation in Moroccan cities by leveraging the Simple Biosphere Model (SiB2) combined with high-resolution land cover and vegetation phenological data. The improved land characterization, particularly the detailed representation of the urban fabric and vegetation types, allowed the model to accurately simulate spatial and temporal variations in the energy fluxes and therefore temperature profiles across cities with differing morphologies and environmental settings.
A key finding of this research is the spatial divergence in UHI behavior, revealing that urban thermal structures and dynamics are highly context dependent. In cities located within vegetated or irrigated landscapes, such as Rabat and Casablanca, urban centers consistently exhibited elevated surface temperatures relative to their rural surroundings, resulting in pronounced urban heat islands. Conversely, in cities built in arid or sparsely vegetated regions such as Marrakesh, the urban fabric often including irrigated exotic trees and lawns, which retain moisture and moderate surface heat fluxes more effectively than the surrounding bare soils, leading to an Urban Heat Sink (UHS) effect where urban areas were cooler than their immediate rural environments.
The study also highlights the significant role of vegetation, not just in quantity but also in type, in modulating the surface energy balance and urban thermal conditions. Areas with high fractions of dense vegetation (e.g., tree canopies, irrigated croplands) displayed markedly lower surface temperatures, driven by increased latent heat fluxes and shading effects. In contrast, low-vegetation or impervious zones registered higher sensible heat fluxes and stronger UHI amplitudes, indicating that the thermal contrast between urban and vegetated surfaces is governed by the physiological state of vegetation. These findings underscore the need for integrating diverse vegetation types into urban planning, not merely expanding green cover but strategically deploying heat tolerant species with high evapotranspiration potential and shading efficiency.
A novel contribution of this work is the introduction of a climate-normalized metric of urban heat stress that isolates the surface UHI amplitude from the background climate signal. This metric enables the identification of cities or neighborhoods where urban design exacerbates or alleviates heat stress independently of the regional climate, offering a valuable tool for proactive risk assessment and climate adaptation planning. It shows that a small SUHI in a hot environment may be more detrimental than a large one in a cooler setting.
This research emphasizes the importance of coupling physical land surface models with detailed urban land cover information to understand and anticipate heat stress in rapidly urbanizing regions. The results point toward the urgent need for climate-sensitive urban policies in Morocco, especially considering the rising frequency and intensity of heatwaves. By linking modeled energy fluxes with land cover characteristics, this study supports targeted interventions, such as increasing urban vegetation, optimizing built forms, and reducing impervious surface extent, that can help mitigate urban heat exposure and improve thermal comfort in a warming climate. It also suggests that it is possible to have an arrangement of land cover elements that maintain a desired temperature.
Ultimately, the SiB2-based framework presented here offers a transferable approach to diagnosing UHI/UHS dynamics and evaluating nature-based solutions in arid and semi-arid cities. It can inform urban design and land-use strategies that align with climate resilience goals, thereby contributing to healthier and more livable urban environments.

Author Contributions

Conceptualization, N.E.-d., L.B. and M.A.L.; methodology, N.E.-d.; software, N.E.-d. and L.B.; validation, N.E.-d. and L.B.; formal analysis, N.E.-d.; investigation, N.E.-d. and L.B.; resources, N.E.-d. and L.B.; data curation, N.E.-d. and L.B.; writing—original draft preparation, N.E.-d.; writing—review and editing, N.E.-d., L.B., M.A.L. and H.B.; visualization, N.E.-d. and M.M.; supervision, N.E.-d., L.B. and M.Y.K.; project administration, N.E.-d., L.B. and M.Y.K.; funding acquisition, L.B. All authors have read and agreed to the published version of the manuscript.

Funding

This research was funded by NASA Land Cover Land Use Change grant number NNH21ZDA001N-LCLUC.

Data Availability Statement

Data may be available upon request from the corresponding author.

Conflicts of Interest

The authors declare no conflict of interest.

Abbreviations

The following abbreviations are used in this manuscript:
UHIUrban Heat Island
SiB2Simple Biosphere Model Version 2
LSMLand Surface Model
NDVINormalized Difference Vegetation Index
CMGClimate Modeling Grid
FPARFraction of Photosynthetically Active Radiation
LCLand Cover
ISAImpervious Surface Area
SUHISurface Urban Heat Island
DJFDecember-January-February
MAMMarch-April-May
JJAJune-July-August
UHSUrban Heat Sink
UTIRUrban Thermal Impact Ratio
TuUrban Temperature
TrRural Temperature
TcThermal Comfort Threshold
WBGTWet-Bulb Global Temperature
TTATangier-Tetouan-Al Hoceima
RSRabat-Sale-Kenitra
CSCasablanca-Settat
OSHAOccupational Safety and Health Administration
ACGIHAmerican Conference of Governmental Industrial Hygienists
WHOWorld Health Organization
ISOInternational Organization for Standardization

Appendix A

Table A1. Comparison of WBGT (°C) Versus Standard Thresholds.
WBGT Range (°C)Comfort LevelStandard Comfort LevelReferences
≤26ComfortableComfortable/Low RiskISO 7243 [39], OSHA
26–28Mild DiscomfortLow-Moderate Risk (Caution)OSHA, NIOSH, WHO
28–30DiscomfortHigh Risk/Heat StressISO 7243, WHO
>30Severe DiscomfortVery High Risk/Severe DiscomfortOSHA, WHO
Source. Based on ISO 7243 [39], OSHA [40], and WHO [41] guidelines.

References

  1. Oke, T.R. The Energetic Basis of the Urban Heat Island. Q. J. R. Meteorol. Soc. 1982, 108, 1–24. [Google Scholar] [CrossRef]
  2. Arnfield, A.J. Two Decades of Urban Climate Research: A Review of Turbulence, Exchanges of Energy and Water, and the Urban Heat Island. Int. J. Clim. 2003, 23, 1–26. [Google Scholar] [CrossRef]
  3. Zhao, L.; Oppenheimer, M.; Zhu, Q.; Baldwin, J.W.; Ebi, K.L.; Bou-Zeid, E.; Guan, K.; Liu, X. Interactions between Urban Heat Islands and Heat Waves. Environ. Res. Lett. 2018, 13, 034003. [Google Scholar] [CrossRef]
  4. Grimmond, C.S.B.; Blackett, M.; Best, M.J.; Barlow, J.; Baik, J.-J.; Belcher, S.E.; Bohnenstengel, S.I.; Calmet, I.; Chen, F.; Dandou, A.; et al. The International Urban Energy Balance Models Comparison Project: First Results from Phase 1. J. Appl. Meteorol. Climatol. 2010, 49, 1268–1292. [Google Scholar] [CrossRef]
  5. Masson, V.; Lemonsu, A.; Hidalgo, J.; Voogt, J. Urban Climates and Climate Change. Annu. Rev. Environ. Resour. 2020, 45, 411–444. [Google Scholar] [CrossRef]
  6. Bahi, H.; Rhinane, H.; Bensalmia, A.; Fehrenbach, U.; Scherer, D. Effects of Urbanization and Seasonal Cycle on the Surface Urban Heat Island Patterns in the Coastal Growing Cities: A Case Study of Casablanca, Morocco. Remote Sens. 2016, 8, 829. [Google Scholar] [CrossRef]
  7. Elkhrachy, I. Assessment and Management Flash Flood in Najran Wady Using GIS and Remote Sensing. J. Indian Soc. Remote Sens. 2018, 46, 297–308. [Google Scholar] [CrossRef]
  8. Belal, A.A.; Moghanm, F.S. Detecting Urban Growth Using Remote Sensing and GIS Techniques in Al Gharbiya Governorate, Egypt. Egypt. J. Remote Sens. Space Sci. 2011, 14, 73–79. [Google Scholar] [CrossRef]
  9. Gourfi, A.; Taïbi, A.N.; Salhi, S.; Hannani, M.E.; Boujrouf, S. The Surface Urban Heat Island and Key Mitigation Factors in Arid Climate Cities, Case of Marrakesh, Morocco. Remote Sens. 2022, 14, 3935. [Google Scholar] [CrossRef]
  10. Er-Retby, H.; Outzourhit, A.; Mghazli, M.O.; Nait-Taour, A.; Mastouri, H.; Mankibi, M.E. Numerical Modeling of Urban Heat Island Effects Phenomena: A Case Study of the Green City of Ben Guerir Morocco. AIP Conf. Proc. 2023, 3018, 020044. [Google Scholar]
  11. Chbani, M.E.A.; El Harrouni, K.; Lamzah, A. Urban Heat Islands Impacts on Architecture and Urban Planning: Rabat Case Study. Afr. Mediterr. J. Archit. Urban. 2024, 6, 53205. [Google Scholar] [CrossRef]
  12. Sellers, P.J.; Randall, D.A.; Collatz, G.J.; Berry, J.A.; Field, C.B.; Dazlich, D.A.; Zhang, C.; Collelo, G.D.; Bounoua, L. A Revised Land Surface Parameterization (SiB2) for Atmospheric GCMS. Part I: Model Formulation. J. Clim. 1996, 9, 676–705. [Google Scholar] [CrossRef]
  13. Loridan, T.; Grimmond, C.S.B. Multi—site Evaluation of an Urban Land—surface Model: Intra—urban Heterogeneity, Seasonality and Parameter Complexity Requirements. Quart. J. R. Meteorol. Soc. 2012, 138, 1094–1113. [Google Scholar] [CrossRef]
  14. IPCC. Climate Change 2021: The Physical Science Basis: Summary for Policymakers: Working Group I Contribution to the Sixth Assessment Report of the Intergovernmental Panel on Climate Change; IPCC: Geneva, Switzerland, 2021; ISBN 978-92-9169-158-6. [Google Scholar]
  15. Santamouris, M. Regulating the Damaged Thermostat of the Cities—Status, Impacts and Mitigation Challenges. Energy Build. 2015, 91, 43–56. [Google Scholar] [CrossRef]
  16. Bounoua, L.; Safia, A.; Masek, J.; Peters-Lidard, C.; Imhoff, M.L. Impact of Urban Growth on Surface Climate: A Case Study in Oran, Algeria. J. Appl. Meteorol. Climatol. 2009, 48, 217–231. [Google Scholar] [CrossRef]
  17. Bounoua, L.; Zhang, P.; Mostovoy, G.; Thome, K.; Masek, J.; Imhoff, M.; Shepherd, M.; Quattrochi, D.; Santanello, J.; Silva, J.; et al. Impact of Urbanization on US Surface Climate. Environ. Res. Lett. 2015, 10, 084010. [Google Scholar] [CrossRef]
  18. Collatz, G.J.; Ball, J.T.; Grivet, C.; Berry, J.A. Physiological and Environmental Regulation of Stomatal Conductance, Photosynthesis and Transpiration: A Model That Includes a Laminar Boundary Layer. Agric. For. Meteorol. 1991, 54, 107–136. [Google Scholar] [CrossRef]
  19. Gelaro, R.; McCarty, W.; Suárez, M.J.; Todling, R.; Molod, A.; Takacs, L.; Randles, C.A.; Darmenov, A.; Bosilovich, M.G.; Reichle, R.; et al. The Modern-Era Retrospective Analysis for Research and Applications, Version 2 (MERRA-2). J. Clim. 2017, 30, 5419–5454. [Google Scholar] [CrossRef] [PubMed]
  20. Global Modeling and Assimilation Office (GMAO); Pawson, S. MERRA-2 tavg1_2d_slv_Nx: 2d,1-Hourly, Time-Averaged, Single-Level, Assimilation, Single-Level Diagnostics Version 5.12.4; NASA Goddard Space Flight Center: Greenbelt, MD, USA, 2015.
  21. Hammoudy, W.; Ilmen, R.; Sinan, M. Impact of Climate Change on Extremes Events in Morocco. IOP Conf. Ser. Earth Environ. Sci. 2022, 1090, 012034. [Google Scholar] [CrossRef]
  22. Hurrell, J.W.; Deser, C. North Atlantic Climate Variability: The Role of the North Atlantic Oscillation. J. Mar. Syst. 2010, 79, 231–244. [Google Scholar] [CrossRef]
  23. Ciais, P.; Denning, A.S.; Tans, P.P.; Berry, J.A.; Randall, D.A.; Collatz, G.J.; Sellers, P.J.; White, J.W.C.; Trolier, M.; Meijer, H.A.J.; et al. A Three—dimensional Synthesis Study of δ18O in Atmospheric CO2: 1. Surface Fluxes. J. Geophys. Res. 1997, 102, 5857–5872. [Google Scholar] [CrossRef]
  24. Tian, W.; Li, X.; Cheng, G.-D.; Wang, X.-S.; Hu, B.X. Coupling a Groundwater Model with a Land Surface Model to Improve Water and Energy Cycle Simulation. Hydrol. Earth Syst. Sci. 2012, 16, 4707–4723. [Google Scholar] [CrossRef]
  25. Dirmeyer, P.A.; Zeng, F.J. Precipitation Infiltration in the Simplified SiB Land Surface Scheme. J. Meteorol. Soc. Jpn. 1999, 77, 291–303. [Google Scholar] [CrossRef]
  26. Huang, X.; Song, Y.; Yang, J.; Wang, W.; Ren, H.; Dong, M.; Feng, Y.; Yin, H.; Li, J. Toward Accurate Mapping of 30-m Time-Series Global Impervious Surface Area (GISA). Int. J. Appl. Earth Obs. Geoinf. 2022, 109, 102787. [Google Scholar] [CrossRef]
  27. Tan, L.; Cai, Y.; An, Z.; Yi, L.; Zhang, H.; Qin, S. Climate Patterns in North Central China during the Last 1800 Yr and Their Possible Driving Force. Clim. Past 2011, 7, 685–692. [Google Scholar] [CrossRef]
  28. Cowan, I.R. Stomatal Behaviour and Environment. In Advances in Botanical Research; Elsevier: Amsterdam, The Netherlands, 1978; Volume 4, pp. 117–228. ISBN 978-0-12-005904-1. [Google Scholar]
  29. Bowler, D.E.; Buyung-Ali, L.; Knight, T.M.; Pullin, A.S. Urban Greening to Cool Towns and Cities: A Systematic Review of the Empirical Evidence. Landsc. Urban Plan. 2010, 97, 147–155. [Google Scholar] [CrossRef]
  30. Firozjaei, M.K.; Sedighi, A.; Mijani, N.; Kazemi, Y.; Amiraslani, F. Seasonal and Daily Effects of the Sea on the Surface Urban Heat Island Intensity: A Case Study of Cities in the Caspian Sea Plain. Urban Clim. 2023, 51, 101603. [Google Scholar] [CrossRef]
  31. Ministère de l’Agriculture; de la Pêche Maritime; du Développement Rural et des Eaux et Forêts. Le Plan Maroc Vert: Bilan et Impacts 2008–2018; Ministère de l’Agriculture: Rabat, Morocco, 2018.
  32. El Ghazouani, L.; Bounoua, L.; Nigro, J.; Mansour, M.; Radoine, H.; Souidi, H. Combining Satellite Data and Spatial Analysis to Assess the UHI Amplitude and Structure within Urban Areas: The Case of Moroccan Cities. Urban Sci. 2021, 5, 67. [Google Scholar] [CrossRef]
  33. Nassar, A.K.; Blackburn, G.A.; Whyatt, J.D. Dynamics and Controls of Urban Heat Sink and Island Phenomena in a Desert City: Development of a Local Climate Zone Scheme Using Remotely-Sensed Inputs. Int. J. Appl. Earth Obs. Geoinf. 2016, 51, 76–90. [Google Scholar] [CrossRef]
  34. Tan, P.Y.; Wong, N.H.; Tan, C.L.; Jusuf, S.K.; Chang, M.F.; Chiam, Z.Q. A Method to Partition the Relative Effects of Evaporative Cooling and Shading on Air Temperature within Vegetation Canopy. J. Urban Ecol. 2018, 4, juy012. [Google Scholar] [CrossRef]
  35. Harlan, S.L.; Brazel, A.J.; Prashad, L.; Stefanov, W.L.; Larsen, L. Neighborhood Microclimates and Vulnerability to Heat Stress. Soc. Sci. Med. 2006, 63, 2847–2863. [Google Scholar] [CrossRef] [PubMed]
  36. Mitchell, D.; Heaviside, C.; Vardoulakis, S.; Huntingford, C.; Masato, G.; P Guillod, B.; Frumhoff, P.; Bowery, A.; Wallom, D.; Allen, M. Attributing Human Mortality during Extreme Heat Waves to Anthropogenic Climate Change. Environ. Res. Lett. 2016, 11, 074006. [Google Scholar] [CrossRef]
  37. Davis, R.E.; Knappenberger, P.C.; Michaels, P.J.; Novicoff, W.M. Changing Heat-Related Mortality in the United States. Environ. Health Perspect 2003, 111, 1712–1718. [Google Scholar] [CrossRef] [PubMed]
  38. Middel, A.; Häb, K.; Brazel, A.J.; Martin, C.A.; Guhathakurta, S. Impact of Urban Form and Design on Mid-Afternoon Microclimate in Phoenix Local Climate Zones. Landsc. Urban Plan. 2014, 122, 16–28. [Google Scholar] [CrossRef]
  39. ISO 7243:2017; Ergonomics of the Thermal Environment—Assessment of Heat Stress Using the WBGT Index. International Organization for Standardization: Geneva, Switzerland, 2017.
  40. Occupational Safety and Health Administration (OSHA). OSHA Technical Manual (OTM): Section III, Chapter 4; Occupational Safety and Health Administration: Washington, DC, USA, 2017.
  41. World Health Organization (WHO). Climate Change, Heat and Health; WHO: Geneva, Switzerland, 2024. [Google Scholar]
Figure 1. Study region showing the map of Morocco and the selected cities.
Urbansci 09 00289 g001
Figure 2. Assimilation rate (micromoles/m2/s) for natural grassland for the city of (A) Tangier, representative of Rabat, Agadir, and Dakhla; (B) Fes, representative of Meknes and Marrakech; (C) Oujda, representative of Al Hoceima and Tetouan; and (D) Guelmim.
Urbansci 09 00289 g002
Figure 3. Seasonal temperature diurnal cycle for urban (Urb-T), vegetation (Veg-T), and actual (Act-T) weighted average temperature for the winter (DJF) growing season for (A) Tangier, (B) Rabat, and (C) Agadir.
Urbansci 09 00289 g003
Figure 4. Same as Figure 3 except for (A) Tetouan, (B) Oujda, and (C) Al Hoceima.
Urbansci 09 00289 g004
Figure 5. Same as Figure 3 except for (A) Fes, (B) Meknes, and (C) Marrakech.
Urbansci 09 00289 g005
Figure 6. Zonally averaged temperature cross sections along a south–north transect. The center of the x-axis (0) represents the city center, with values to the left indicating the north and values to the right indicating the south. The dashed line represents the difference between the total and the vegetation-weighted temperatures and serves as an indication of the impact of urbanization on surface temperature.
Urbansci 09 00289 g006
Figure 7. Same as Figure 3 but for Guelmim (A) and Dakhla (B).
Urbansci 09 00289 g007
Figure 8. Correlation between the daytime average surface temperature difference (ΔT) between urban and vegetation classes in selected cities and canopy transpiration (Tr) during the growing season. The diagonal line represents the regression line. Numbers on the markers correspond to land cover classes: 4—Needleleaf Evergreen Trees; 6—Savanna; 7—Grassland; 9—Bare Land with Shrubs; 11—Barren; and 12—Cropland.
Urbansci 09 00289 g008
Figure 9. Urban Thermal Impact Ratio at local scale for three cities: Rabat, Tangier, and Casablanca across mean diurnal summer (June–July–August).
Urbansci 09 00289 g009
Table 1. Difference (°C) between urban and vegetation temperatures (urban minus vegetation) at different times of the day.
TangierRabatAgadirDakhlaOujdaAlhoceimaTetouanFesMeknesMarrakech
8–10 a.m.0.90.61.01.00.50.11.50.51.80.6
11 a.m.–2 p.m.1.810.7−0.71.10.62.213.20.0
3 p.m.–5 p.m.1.41.31.21.21.61.21.61.12.20.8
8 p.m.–7 a.m.1.31.31.82.11.81.81.81.121.6
Table 2. Estimate of the Urban Thermal Imapct Ratio (UTIR) and comfort level for the 12 regions of Morocco for the summer of 2010. Tu and Tr are the urban and rural summer (JJA) maximum temperature (°C), respectively, and Tc is the mean comfort temperature (°C).
RegionCharacteristicsTuTcTrUTIRComfort Level
Tangier-Tetouan-Al HoceimaCoastal/Mediterranean282726.20.56Comfortable
L’OrientalInland Semi-Arid362832.22.37Mild Discomfort
Fes-MeknesInland/Continental Influence362832.32.43Mild Discomfort
Rabat-Sale-KenitraCoastal/Atlantic Influence3027250.60Comfortable
Beni Mellal-KhenifraMountain/Inland362732.52.57Discomfort
Casablanca-SettatCoastal Urban Area2926260.67Comfortable
Marrakech-SafiInland Semi-Arid3828342.75Discomfort
Draa-TafilaletArid/Desert3830365.50Severe Discomfort
Souss-MassaCoastal/Arid Mix3228302.50Discomfort
Guelmim-Oued NounArid3530348.00Severe Discomfort
Laayoune-Sakia El HamraDesert/Coastal363033.53.60Severe Discomfort
Dakhla-Oued Ed-DahabDesert/Peninsula353032.53.20Severe Discomfort
Table 3. Comparison of UTIR and WBGT (°C) comfort levels.
RegionUTIRUTIR Comfort LevelWBGT (°C)WBGT Comfort Level
Tangier-Tetouan-Al Hoceima0.56Comfortable25Comfortable
L’Oriental2.37Mild Discomfort27.9Mild Discomfort
Fes-Meknes2.43Mild Discomfort27.8Mild Discomfort
Rabat-Sale-Kenitra0.6Comfortable25Comfortable
Beni Mellal-Khenifra2.57Discomfort28.3Discomfort
Casablanca-Settat0.67Comfortable25Comfortable
Marrakech-Safi2.75Discomfort31Severe Discomfort
Draa-Tafilalet5.5Severe Discomfort32.5Severe Discomfort
Souss-Massa2.5Discomfort28.5Discomfort
Guelmim-Oued Noun8Severe Discomfort32.5Severe Discomfort
Laayoune-Sakia El Hamra3.6Severe Discomfort31.5Severe Discomfort
Dakhla-Oued Ed-Dahab3.2Severe Discomfort31.5Severe Discomfort
Disclaimer/Publisher’s Note: The statements, opinions and data contained in all publications are solely those of the individual author(s) and contributor(s) and not of MDPI and/or the editor(s). MDPI and/or the editor(s) disclaim responsibility for any injury to people or property resulting from any ideas, methods, instructions or products referred to in the content.

