Review

Simulation of Urban Thermal Environment Based on Urban Weather Generator: Narrative Review

1
School of Geographic and Environmental Sciences, Tianjin Normal University, Tianjin 300387, China
2
College of Architecture and Civil Engineering, Beijing University of Technology, Beijing 100124, China
3
School of Non-Commissioned Officer, Space Engineering University, Beijing 102299, China
4
School of Information Mechanics and Sensing Engineering, Xidian University, Xi’an 710071, China
5
Department of Natural Sciences, College of Coastal Georgia, Brunswick, GA 31520, USA
6
Institute of Agricultural Resources and Area Planning, Chinese Academy of Agricultural Sciences, Beijing 100081, China
*
Author to whom correspondence should be addressed.
Urban Sci. 2025, 9(7), 275; https://doi.org/10.3390/urbansci9070275
Submission received: 21 May 2025 / Revised: 30 June 2025 / Accepted: 8 July 2025 / Published: 16 July 2025

Abstract

The thermal environment problem is one of the main focuses of current urban environment research. At present, there are various methods used in urban space thermal environment (USTE) research. As a simulation method to quantify the USTE, the urban weather generator (UWG) has undergone great development and achieved many progressive results. It is necessary to establish and review its current research status by synthesizing UWG multi-scale applications. This review adopts a literature review approach, leveraging the Web of Science Core Collection to obtain previous relevant publications from 2010 to 2025 using “urban weather generator” and “thermal environment” as keywords. The literature is categorized by research themes, including model development, parameter optimization, and application cases. Through innovative analyses of spatio-temporal-scale classification, parameter optimization, the integration of anthropogenic heat emissions, and the multi-domain simulation potential of the UWG, this review synthesizes the application outcomes of the UWG model in multi-scale research, addressing gaps in current urban climate studies. The paper aims to elaborate and analyze the model’s current research status considering the following six aspects. First, the basic parameters in UWG simulation are introduced, including the data and parameter determination settings used in such simulations. Secondly, we introduce the simulation model and its basic principles, the simulation process, and the main steps of this process. Third, we classify and define UWG simulations of spatial thermal environments at different time scales and spatial scales. Fourth, regarding how to improve the accuracy of the UWG model, the deterministic parameters and uncertainty parameters settings are analyzed, respectively. Then, the impacts of anthropogenic heat during the simulation process are also discussed. Fifth, the applications of the UWG model in some major fields and its possible future development directions are addressed. Finally, the existing problems are summarized, the future development trends are prospected, and research on possible expected mitigation measures for the USTE is described.

1. Introduction

Rapid urbanization has caused many urban ecological and environmental problems, bringing about serious impacts on urban climate change, air quality, and the health of urban residents [1]. Changes in the urban space thermal environment (USTE) are closely related to human social and economic activities [2,3,4,5]. Anthropogenic heat emissions from human production activities and changes in the natural properties of the underlying surface can directly or indirectly affect the USTE [6,7,8]. The USTE not only directly affects human quality of life and health, but also affects urban resource consumption, ecosystem process evolution, and future economic sustainable development. These problems are becoming increasingly prominent and have become one of the most significant features of climate change in modern cities around the world [9,10]. Analyzing the interaction mechanism between the urban underlying surface and the spatial thermal environment and studying the evolution process of the USTE and its mitigation measures are of great significance for the sustainable development of cities and improvements in the urban ecological environment [11].
Studying the USTE is helpful for alleviating the urban heat island problem and provides important parameter support for improving the urban microclimate [12]. According to the different layered structures of the urban atmosphere, the USTE mainly includes the urban atmospheric temperature field, urban surface temperature field, and relative humidity. At present, there are three main research methods for USTE [13], as follows: (1) meteorological station observation [14,15] and field measurement [16,17], (2) methods based on remote sensing (RS) observation [18,19,20,21,22,23,24]), and (3) methods based on numerical simulation [25,26,27,28].
Traditional weather station observations can only obtain point temperature data, which has a high accuracy but insufficient spatial representativeness. To obtain the surface temperature field, interpolation methods (such as the inverse distance weighted method and Kriging method) are often used, but their accuracy depends on the interpolation model and algorithm. Affected by the environmental conditions of the study area, the test period, and the climatic conditions during the test, the above method has certain limitations and is difficult to apply to large-scale USTE research [29,30,31]. Traditional interpolation methods assume spatial stationarity and are prone to estimation bias in areas with sudden changes in building density. It is worth noting that, in recent years, spatial regression methods such as geographically weighted regression (GWR) have been gradually applied to temperature field estimation. Compared with traditional interpolation methods, GWR captures spatial non-stationarity (such as the heterogeneous distribution of urban heat islands) by constructing local regression models, and performs better in complex terrain and urban functional area division. For example, Dong et al. used an ordinary linear regression model (OLS) and geographically weighted regression model (GWR) to fit the relationship between land cover change ratio and surface temperature. The results showed that the OLS regression model would overestimate or underestimate the warming or cooling capacity of different land cover types. The fitting results of the GWR model were better than those of the OLS model, and could more intuitively and accurately quantify the spatial non-stability of the relationship between land cover ratio and surface temperature [32].
In RS-based USTE observation research, thermal infrared remote sensing (TIR) can be directly used to retrieve the surface temperature. It has the advantages of a wide coverage and long-term series observation, and is widely used to obtain urban surface temperature. The algorithms for retrieving the urban surface temperature from TIR data mainly include the single-channel algorithm [33,34], split window algorithm [35], multi-channel algorithm [36], TISI index algorithm, and temperature/radiance separation algorithm. Due to the difficulty of emissivity measurement, atmospheric influence, radiation brightness error, and scale effect, the accuracy of surface temperature retrieved based on remote sensing data from different platforms has a certain degree of difference. Remote sensing cannot directly obtain the spatial temperature field of the atmosphere. Therefore, to obtain atmospheric temperature information, most studies focus on statistical methods, using the surface temperature field retrieved by remote sensing to indirectly estimate the temperature of the atmosphere. This method can only estimate the near-ground temperature and has a relatively low accuracy.
Numerical simulation methods can calculate the energy, mass, and momentum exchange of scenes of different complexities with accurately set different control experimental conditions. With the development of computing resources and computing power, the demand for the continuity of temperature fields at space and time scales and their simulation accuracy in urban ecological environment research has increased, so numerical simulation methods play an increasingly important role [37]. In a review of the development of mesoscale models and their application in urban heat island effect research, Ooka pointed out that the use and development of high-resolution mesoscale models have enabled many urban-scale weather problems to be discovered and recognized [38]. Currently, there are two main types of numerical models that can be embedded and applied with mesoscale models, including computational fluid dynamics (CFD) models and energy balance models (EBMs). CFD models are used to simulate urban climate change at different spatial scales, including the mesoscale, block scale, single building scale, and indoor wind and heat environment simulations. CFD models can describe the dynamic changes in parameters such as temperature and wind speed and can adapt to more complex scenarios and meet their particular accuracy requirements [39,40]. Representative models include CFD-Urban [41], FLame ACceleration Simulator (FLACS) [42], FLUENT-EPA [43], FEM3MP [44], and FEFL & Urban [45]. Most of these models use the Reynolds mean simulation method (except FEFLO-Urban, which uses the large eddy simulation method), and the grids mostly use finite volume elements or loose structures [46]. CFD simulation requires a high computational cost and its calculation speed is relatively slow [9,47,48].
According to morphological characteristics, an EBM is divided into a flat plate model, a single-layer urban canopy model, and a multi-layer urban canopy model. The algorithms mainly include the Local-Scale Urban Meteorological Parameterization Scheme (LUMPS) [49], the Surface Urban Energy and Water Balance Scheme (SUEWS) [50], the RAMS town energy balance model (RAMS-TEB) [51], the MM5/WRF Urban Canopy Model (MM5/WRF-UCM) [52], and the WRF Building Environment Parameterization Model (WRF-BEP) [53]. The complexity of different types of models is different, and each EBM model also has different treatment methods for vegetation and latent heat. Grimmond et al. conducted a comparative analysis of EBM models and found that no single canopy model can achieve the best simulation effect for all fluxes [54]. However, an EBM model can provide basic microclimate analysis, is easy to use, and has broad application prospects in the future.
Bueno first developed the UWG based on the EBM and TEB models and conducted research on the urban thermal environment and urban microclimate change based on the UWG, comprehensively considering the energy interaction between buildings and the urban climate [55,56,57]. Many scientists have also conducted UWG-based research on the urban microclimate, such as using the UWG to simulate and analyze urban heat islands, building energy consumption, and human thermal comfort [10,55,58,59,60,61,62,63,64]. The UWG model simulates the dry-bulb temperature and wind field at different locations in the urban area through different surface parameterization methods.
As a research method for quantifying the urban microclimate, quantitative studies of the USTE based on the UWG have been carried out in China and other countries on the scale of urban blocks, canyons, and the entire urban area. There are some differences between USTE research based on the UWG in China and abroad. These differences stem from the different stages of urban development and climate background. Research on the UWG in China mainly focuses on the spatial differentiation of the urban thermal environment and the optimization of planning strategies, emphasizing the application of model localization calibration and functional zoning, such as the study of urban heat island mitigation in high-density cities and the long-term evolution mechanism of urban heat islands in megacities [10,65], multi-model coupling research such as combining the LCZ framework with WRF-UCM to analyze the synergistic effect of moisture and heat, and the model parameter optimization of coupled GIS/remote sensing data [65]. In many other countries, research on the UWG focuses on model mechanism verification and parameter sensitivity analysis and conducts in-depth analyses of the causes of the USTE and related energy balance mechanisms. For example, when evaluating the UWG, it is found that the selection of rural meteorological stations had a significant impact on the simulation results, and the model performed better in highly urbanized areas, but was not sensitive enough in low-density areas [10]. Research at the technical level focuses on multi-scale model integration [66]. For example, Hirano (2024) combined thermal infrared remote sensing with thermal balance models to achieve a continuous time series simulation of surface temperature, solving the problem of the insufficient temporal resolution of traditional satellite data [67].
With the development of earth observation technology and computer numerical simulation technology, more accurate initial boundary conditions can be provided for the UWG urban microclimate numerical model, which also provides an important reference for the verification of simulation results. Integrating Geographical Information Systems (GISs) and remote sensing (RS) with the urban weather generator (UWG) addresses critical limitations in USTE modeling by enhancing spatial accuracy, enabling dynamic parameter calibration, and supporting multi-scale analysis. The UWG traditionally relies on simplified urban morphology parameters (e.g., building height-to-width ratio and vegetation fraction), which fail to capture intra-urban variability. GISs and RS provide high-resolution spatial data to resolve functional zoning (Xiao et al., 2010) [68]. This allows for targeted UWG calibration, improving precision. RS-derived local climate zone (LCZ) frameworks standardize urban morphology classification globally, enabling cross-city comparisons of UWG outputs (e.g., compact high-rises vs. low-density suburbs) (Mushore et al., 2019) [69]. The UWG’s sensitivity to input parameters (e.g., albedo and emissivity) necessitates localized calibration, where RS offers real-time validation data, including thermal infrared imagery, energy balance correction, and urban expansion tracking.
As a physically based microclimate simulation tool, the reliability of the UWG is highly dependent on field survey data and in situ data. Thus, the integration of in situ measurements with the UWG to validate simulation accuracy, refine model parameters, and enhance urban climate resilience has been performed by many scientists. Recent studies emphasize validating UWG outputs beyond air temperature, including the mean radiant temperature (MRT), relative humidity (RH), and surface energy fluxes. Xu et al. improved the UWG model by incorporating in situ data to validate MRT and RH simulations [61]. In cross-model cross-validation, cross-validation can be conducted with model results such as WRF and ENVI-met [61]. For example, in the Abu Dhabi case, UWG and ENVI-met temperature simulations were cross-validated [70]. In Toulouse, diurnal UHI intensity simulations were validated using mobile weather stations across urban–rural transects, reducing average bias errors (MBEs) to <1 °C in high-density zones (Bueno et al., 2014) [59]. Although in situ validation has significantly advanced the UWG’s reliability—particularly through multi-parameter calibration and long-term urban expansion tracking—critical gaps persist in data coverage, vegetation process representation, and standardization.
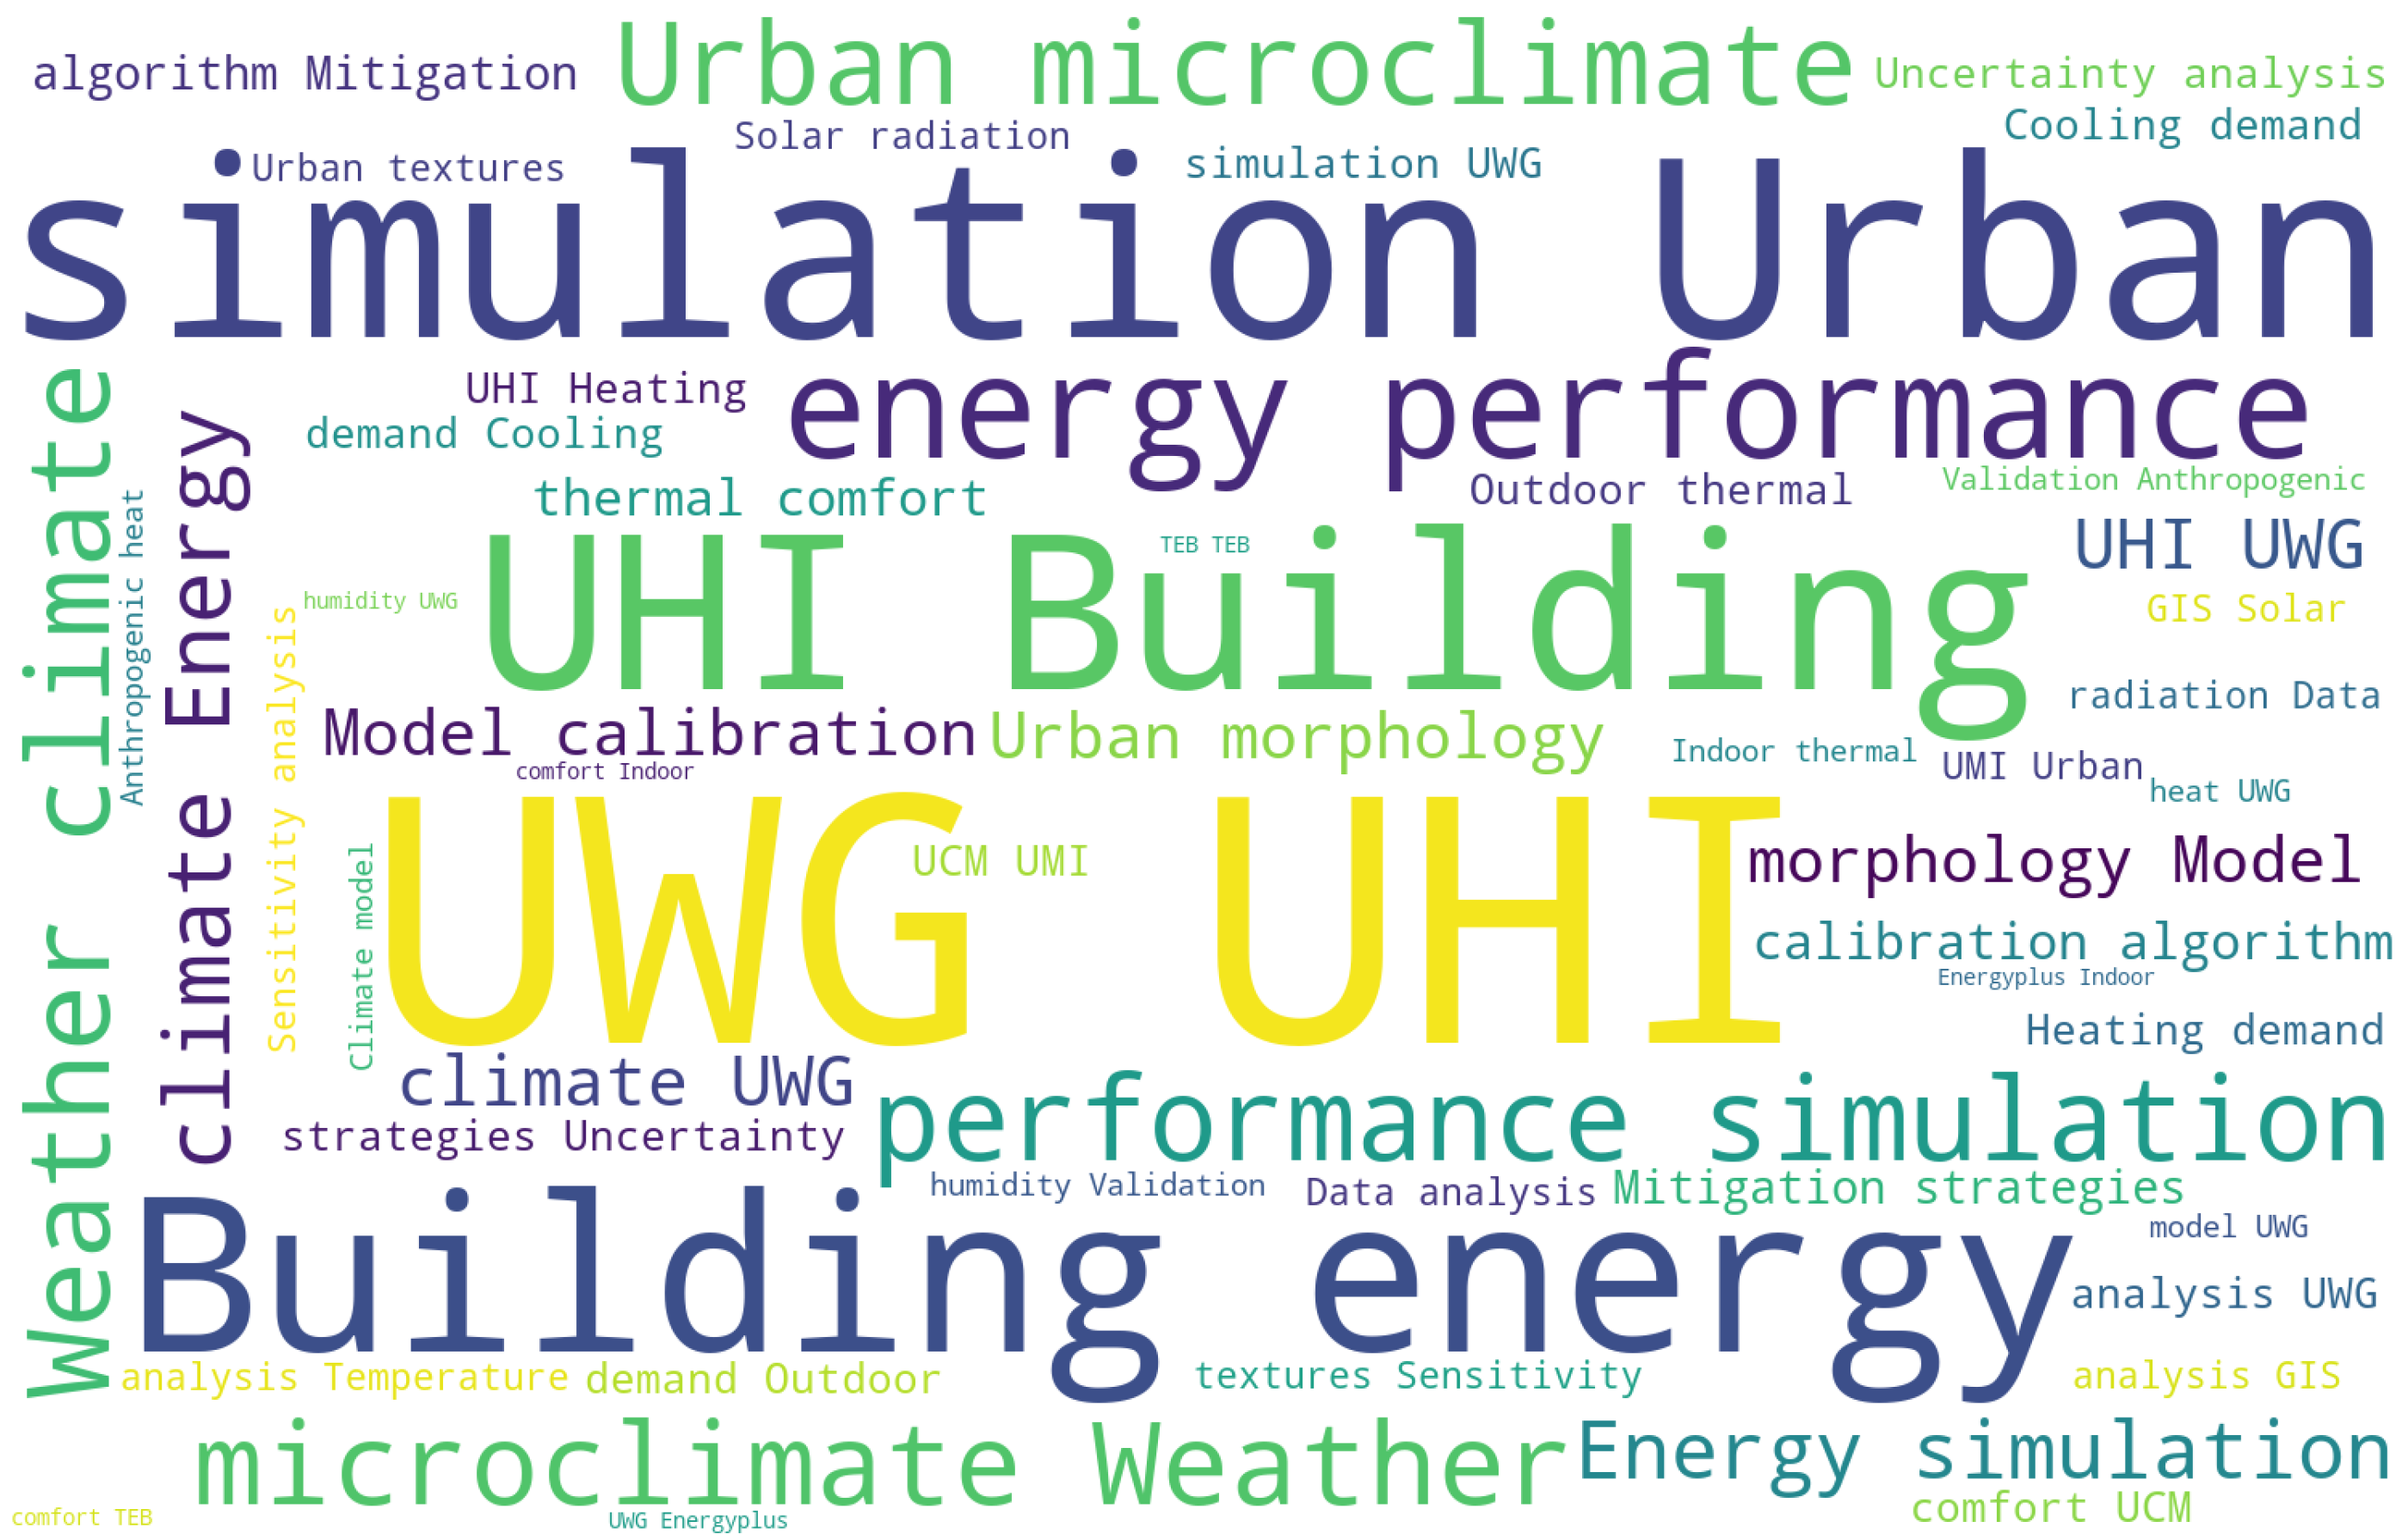
By statistically analyzing the keywords of the relevant previous literature using UWG technology, we made the word cloud diagram shown in Figure 1. From the figure, it can be seen that most previous research based on the UWG focuses on simulating the heat island effect in different urban climates through UWG technology or combining UWG simulation results with building energy consumption simulation to analyze the relevant application fields. The UWG model has been widely applied to simulate the wind, humidity, and heat environment of urban space, and many progressive results have been achieved. Thus, we review the relevant literature to summarize and analyze the development and related results of this period. Therefore, it is necessary to systematically summarize the application status, research history, and future development directions of the UWG model regarding the USTE. This paper summarizes the application fields of the UWG model, introduces the research status of the UWG model regarding the USTE at different time and space scales, and summarizes the development and optimization methods of the model. Finally, the future development directions of the UWG and the problems that may be solved are prospected. Summarizing the progress of USTE research based on the UWG has important practical significance for conducting quantitative evaluation research on the USTE, alleviating and improving the urban heat island effect, and promoting the healthy and sustainable development of cities in the future.
This paper consists of the following seven parts: The second part introduces the basic parameters used in UWG simulations, including the data, data types, and parameter acquisition methods used in these simulations. The third part introduces the basic principles of the UWG model, focusing on the working principles and energy exchange of the four modules of the UWG model. Fourth, the spatial scale and time scale of UWG simulation thermal environment research are summarized and classified. Fifth, an improvement method for the simulation accuracy of the UWG model is introduced considering the two aspects of deterministic parameters and uncertain parameters. As one of the important factors affecting the urban microclimate, the impact of artificial heat on UWG simulation of the USTE is analyzed. Sixth, research on the UWG in application fields related to the urban wind and heat environment is introduced, including urban building space temperature simulation, building energy consumption analysis, and human thermal comfort research. Finally, the existing problems and development trends of UWG simulation of the USTE are prospected and mitigation measures for the USTE are summarized.
The main highlights of this paper are as follows:
  • The urban weather generator (UWG) used to quantify the urban space thermal environment (USTE) has achieved many results, so we establish and review the current research status of the USTE to synthesize UWG multi-scale applications, which can address gaps in current urban climate studies.
  • To address the existing problems in USTE research based on the UWG, it is necessary to look forward to future research development directions and trends.
  • The UWG has been innovatively applied in interdisciplinary fields, and summarizing existing application achievements can enhance its application potential in other interdisciplinary fields such as architectural design and urban planning.

2. Principle of UWG Simulation

In urban microclimate simulation, urban canopy models (UCMs) analyze the material and energy changes in the canopy by parameterizing the urban canopy [71,72]. Numerical tools for urban climate simulation include the SLAB model [73], urban energy balance (TEB) model, single-layer urban canopy model (SLUCM), multi-layer urban canopy model (MLUCM) [74,75], building energy parameterization model (BEP) [76,77], and the Urban Canopy Parameterization (UCP) method developed by Li et al. (2003). The urban energy balance (TEB) model is widely used in the field of microclimate simulation [78,79]. It is a physics-based urban canopy model. Masson considered the temperature of urban roads, building walls, and roofs and proposed, for the first time, a relatively complex parameterization scheme to describe the town energy budget. This scheme assumes that the building is a closed structure, the temperature inside the building wall is fixed, and the heat exchange between the building wall and the atmosphere is carried out through heat conduction, which can directly express the characteristics of the urban canopy [80]. However, this calculation process ignores changes in energy, such as those caused by the air conditioning system and human activities inside the building, and ignores the impact of solar shortwave radiation inside and outside the window on heat changes. Therefore, this calculation scheme is likely to overestimate the cooling effect of the building on the atmosphere and underestimate the heating effect of the building on the atmosphere. To better simulate the impact of heat exchange inside and outside urban buildings on atmospheric movement, Kikegawa et al. (2003) developed the BEM (Building Energy Analysis Model) for calculating the energy exchange inside and outside buildings, confirming the important impact of this process on the urban microclimate [81,82,83,84].
UCMs have been gradually improved and coupled with mesoscale numerical models to simulate urban microclimates [85]. Meng et al. (2008) used the WRF mesoscale numerical forecast model coupled with a UCM (WRF-UCM) to simulate the urban heat island effect in Guangzhou and verified it [86]. Bueno et al. developed the UWG based on the building energy model (BEM) of TEB and applied it to the field of USTE simulation. The UWG model is applicable to weather stations in different locations and all weather conditions, and its output weather deformation files are compatible with many building performance simulation software, so it has a good robustness and versatility [87]. UWG simulation results can be compared with those of mesoscale atmospheric models such as WRF [88], and its computational efficiency is higher, but the simplification of the model and the assumption of idealized conditions make it unable to capture the microclimate effects located in a specific location [59], so it cannot simulate the impact of specific locations such as large water bodies or large parks on the urban microclimate. The humidity calculation in the latent heat exchange mechanism of the UWG does not accurately consider and distinguish the interaction between vegetation water, soil water, and adjacent water bodies and only assumes that the absolute humidity in urban areas is the same as that in rural areas, which is used to calculate the relative humidity in urban areas [89,90]. For wind, the UWG only calculates the canyon wind speed reduced by obstacles, without considering the wind direction.
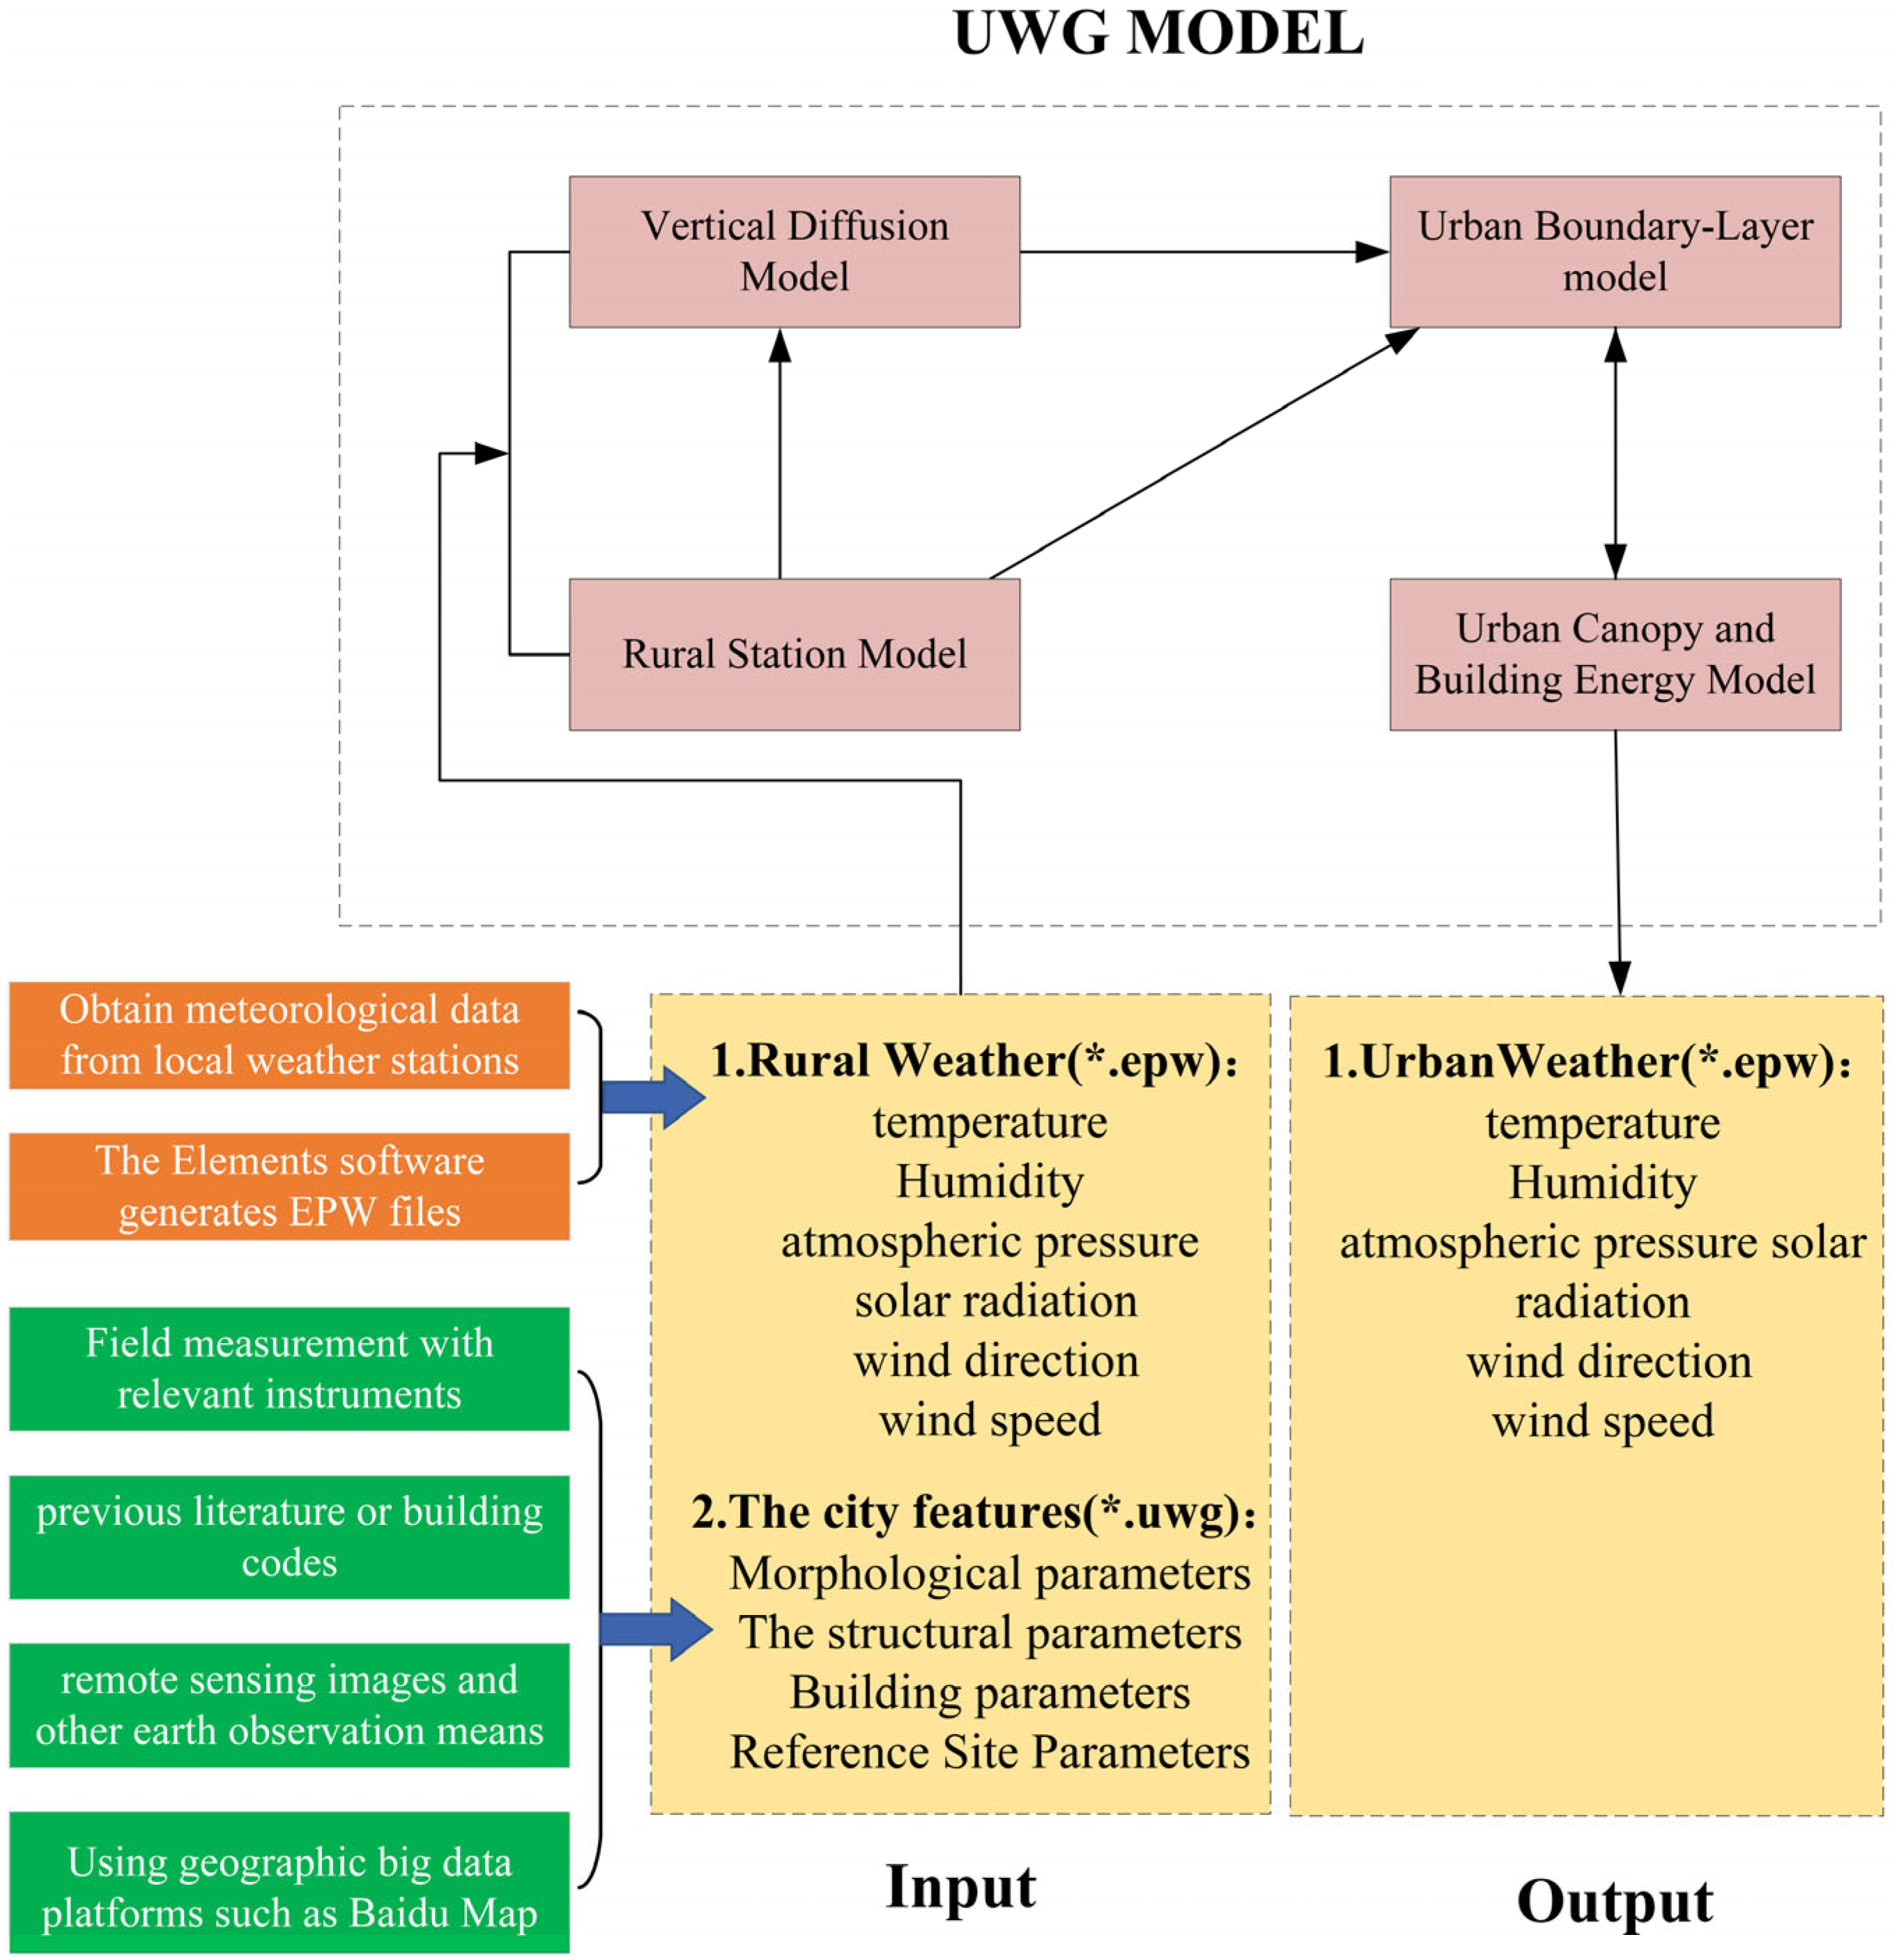
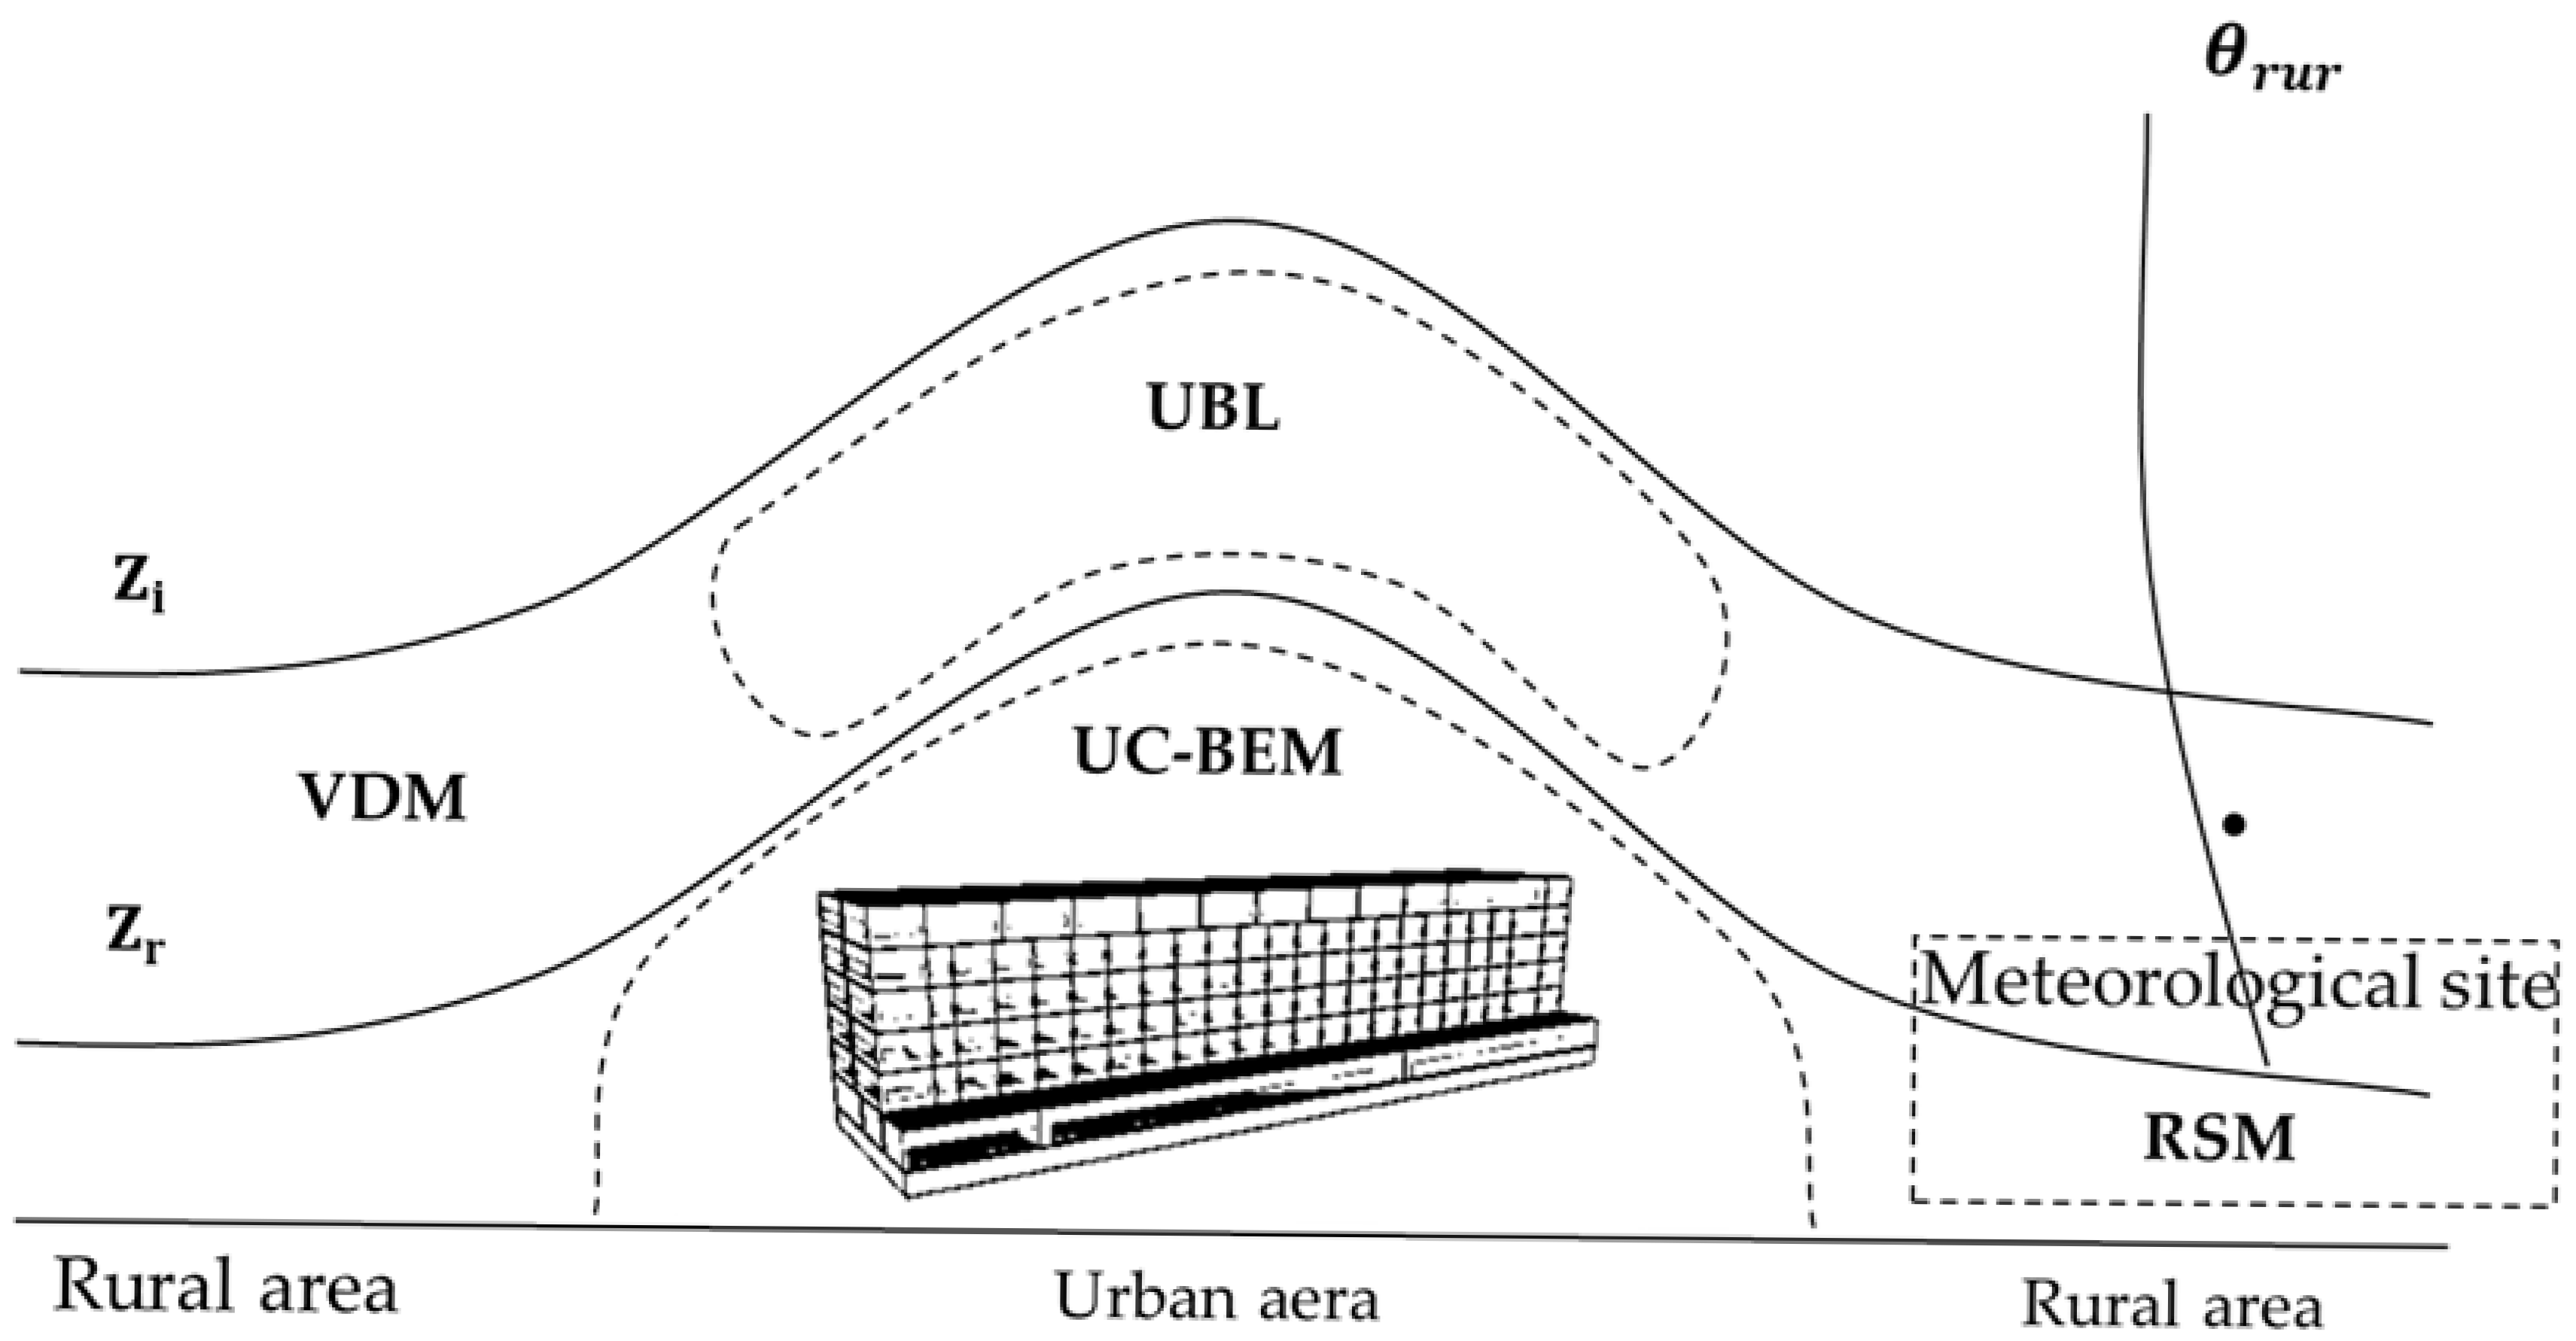
The UWG (urban weather generator) simulates the temperature and humidity of the urban canopy through the energy balance equation and urban morphology parameterization. The core idea of the model is to regard the city as a “single-layer canopy” based on rural meteorological station data (as a reference background climate), superimposed with the urban surface energy balance correction (such as absorbed short-wave radiation, anthropogenic heat emissions, and latent heat/sensible heat flux ratio changes) and urban geometric effects (including building shading and street canyon long-wave radiation interception) to calculate the temperature and humidity dynamics of the urban near-surface. The specific technical process is shown in 
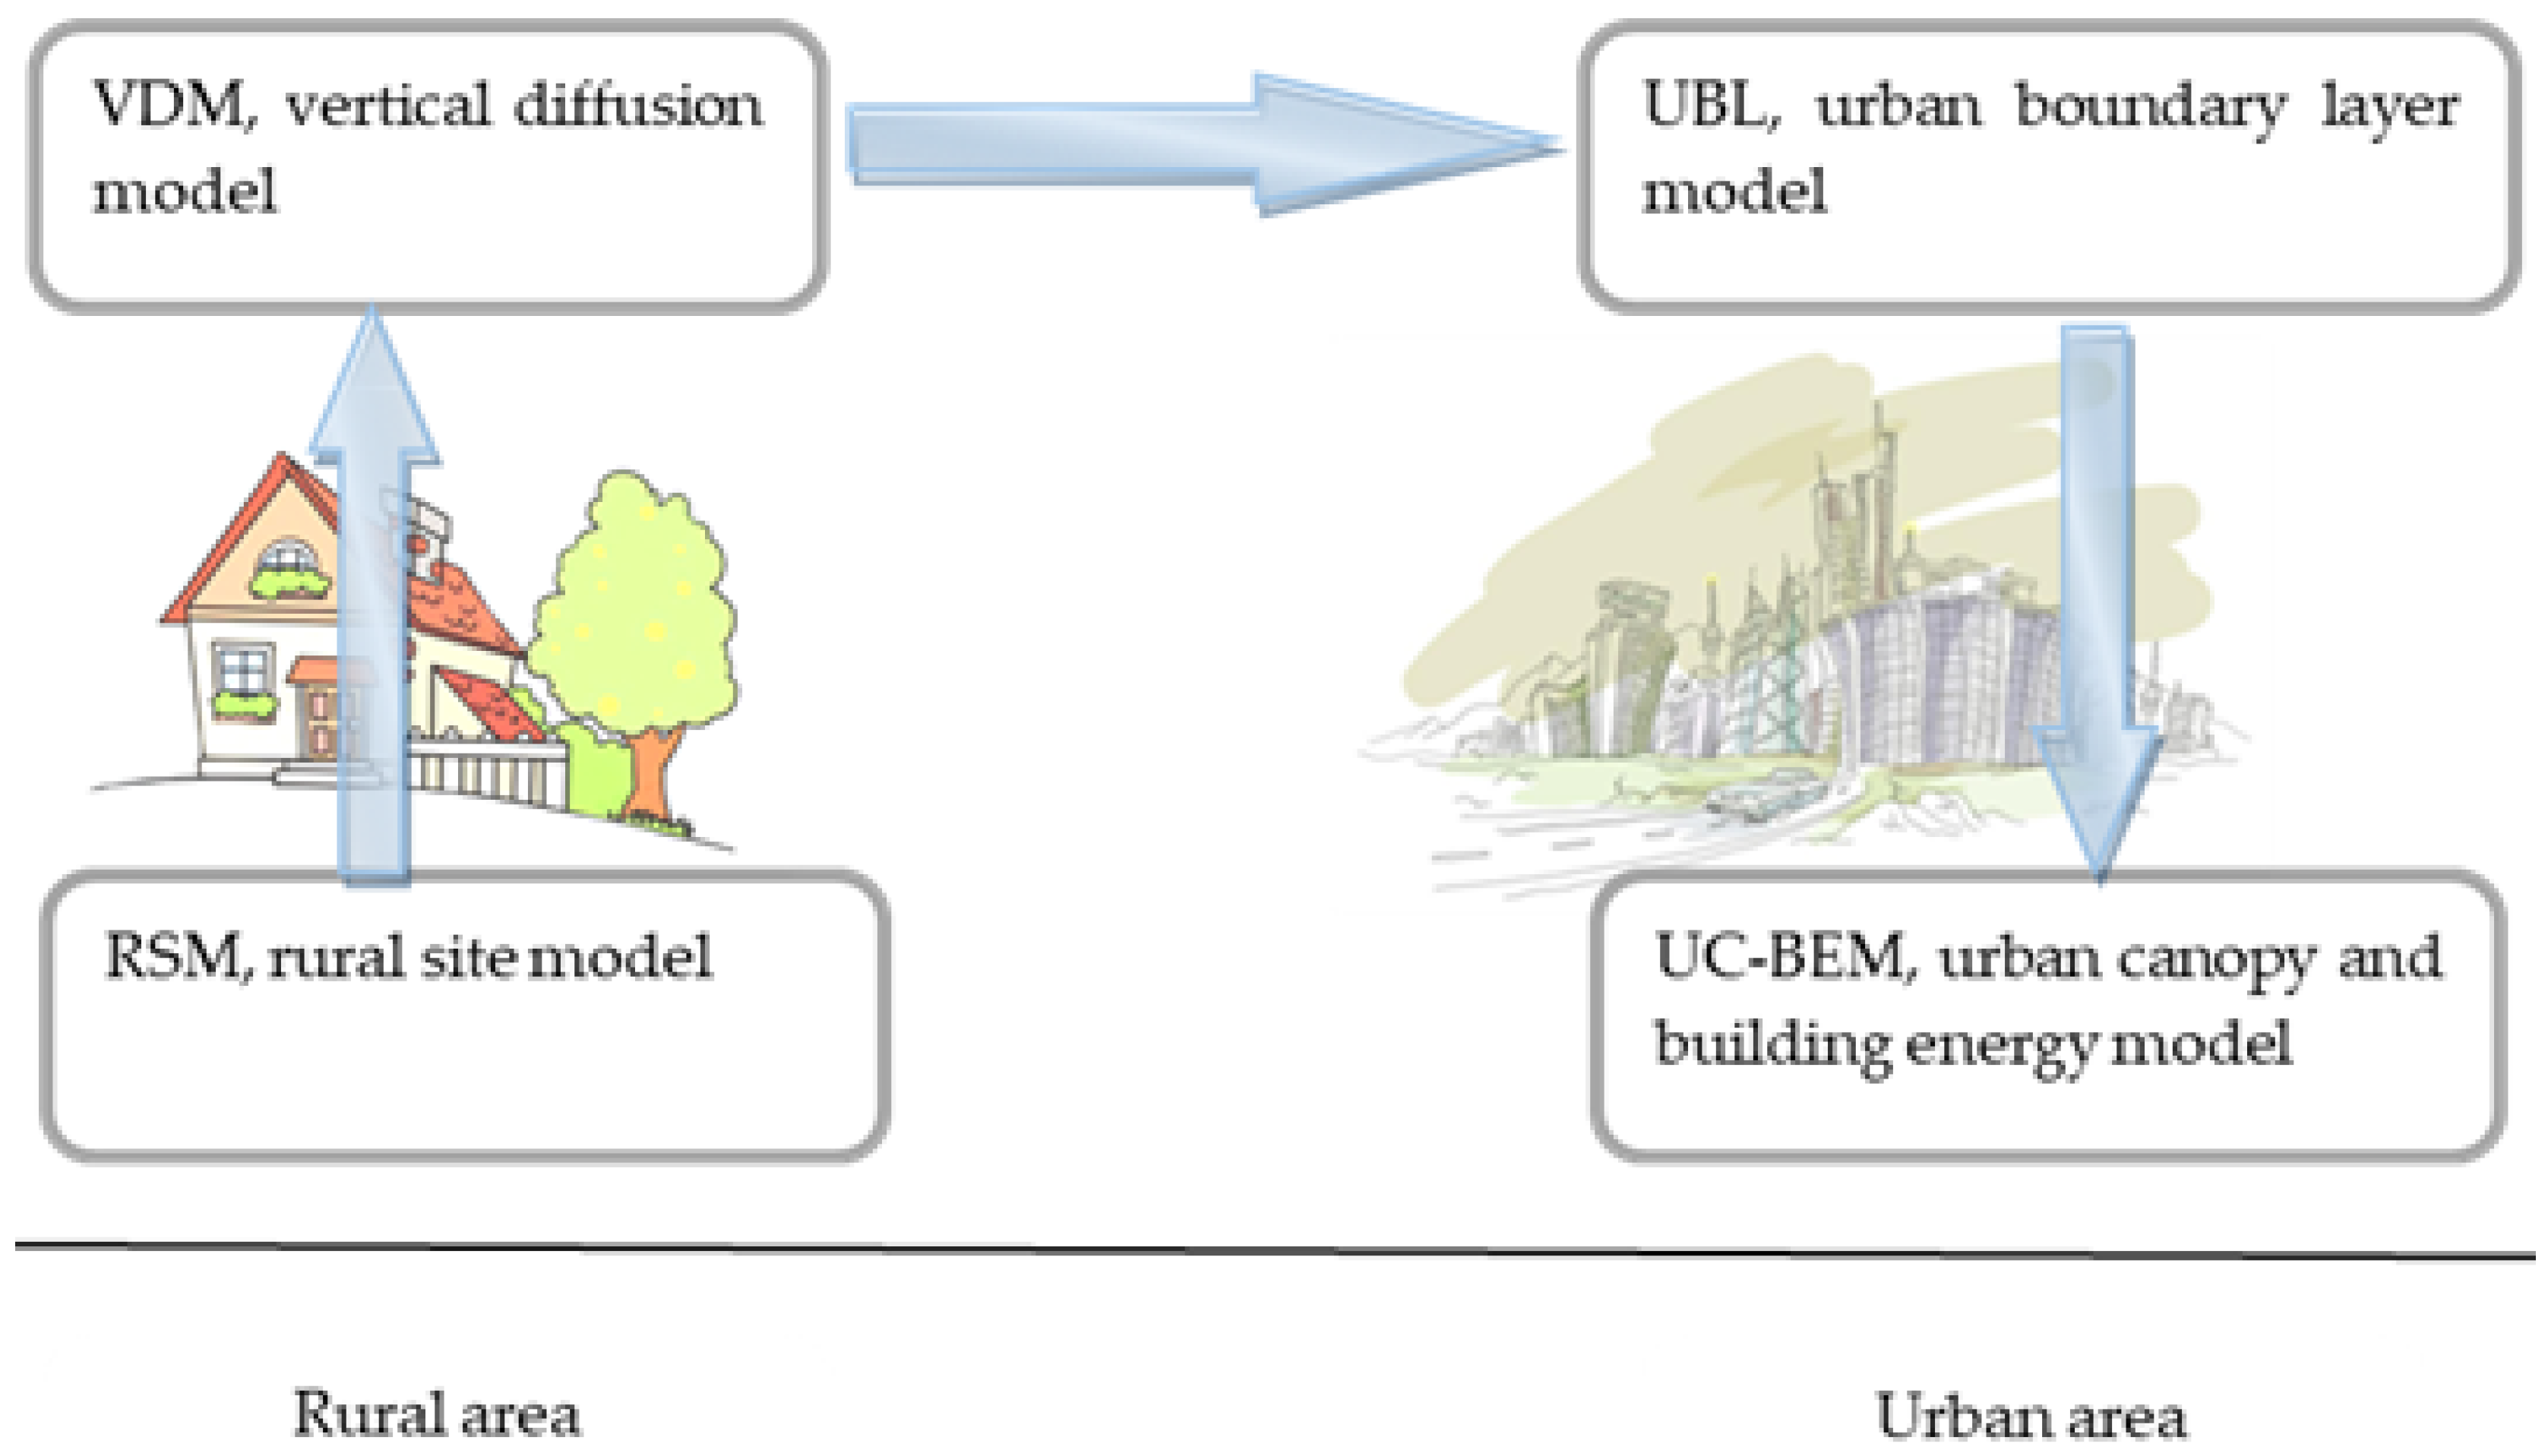
Figure 2. The UWG model consists of four coupling modules, including the rural station model (RSM), vertical diffusion model (VDM), urban boundary layer model (UBL), and urban canopy and building energy model (UC-BEM). Figure 2 shows the simulation process of the UWG model: the UWG model takes the meteorological data provided by the *.epw rural weather file as the initial input and changes the temperature, relative humidity, and wind speed according to the urban characteristics described in the *.uwg file to generate an *.epw simulation City Weather File.
Figure 3 shows the basic principles and application areas of the UWG model. The UWG model reads the rural meteorological data from the *.epw file and the urban building geometry and physical characteristics data from the *.xml (*.uwg) file and simulates and generates urban local weather data (by changing temperature, humidity, and wind speed). These data can be easily exported to EPW format for later building performance analysis. The *.epw file providing rural meteorological parameters is used as the starting input data for UWG simulation. Rural sites refer to sites within the urban and rural study area but outside the urban area and its affected surrounding areas, which are least affected by geographical features (such as buildings, valleys, large water bodies, etc.) [12] such as meteorological stations near airports in the suburbs of the city [
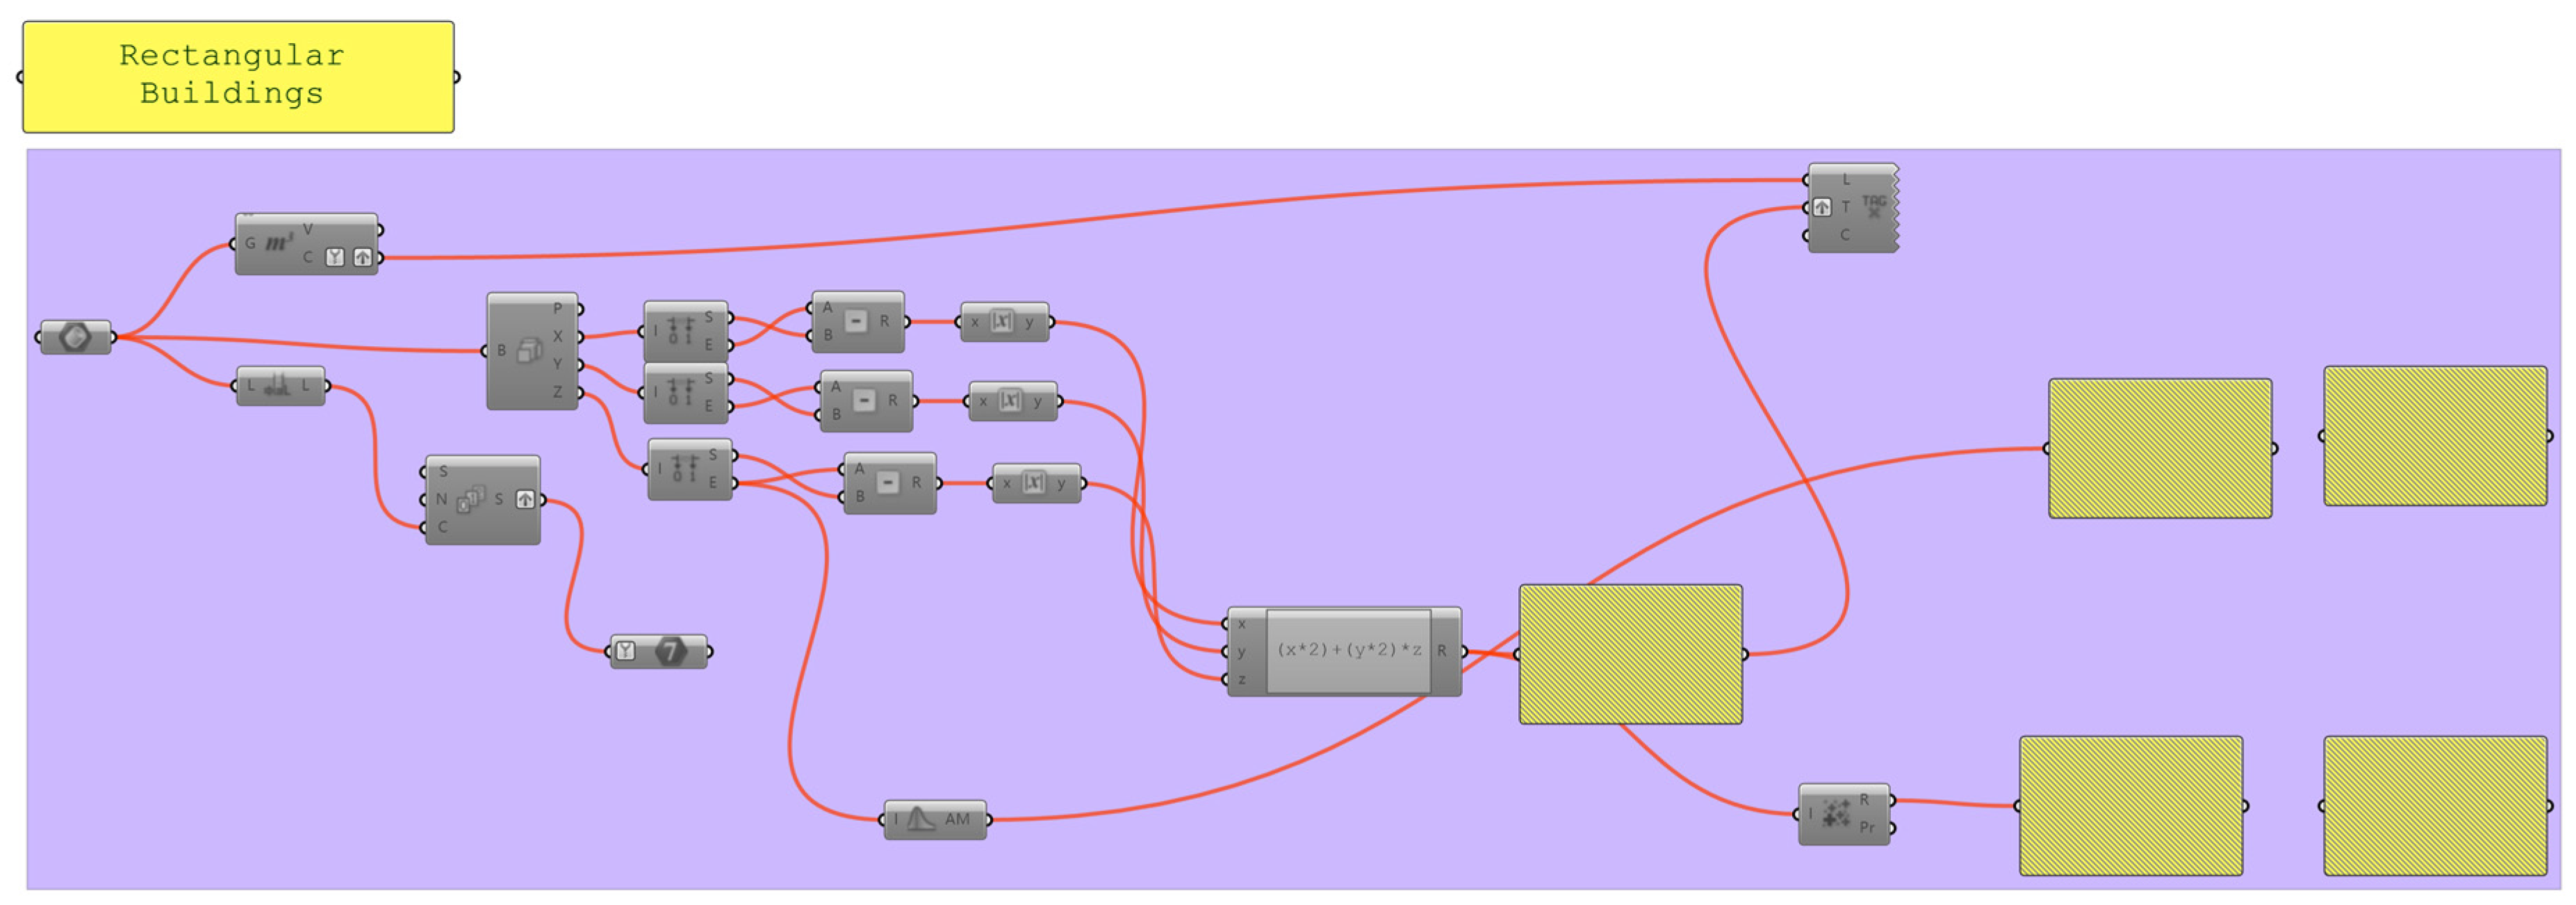
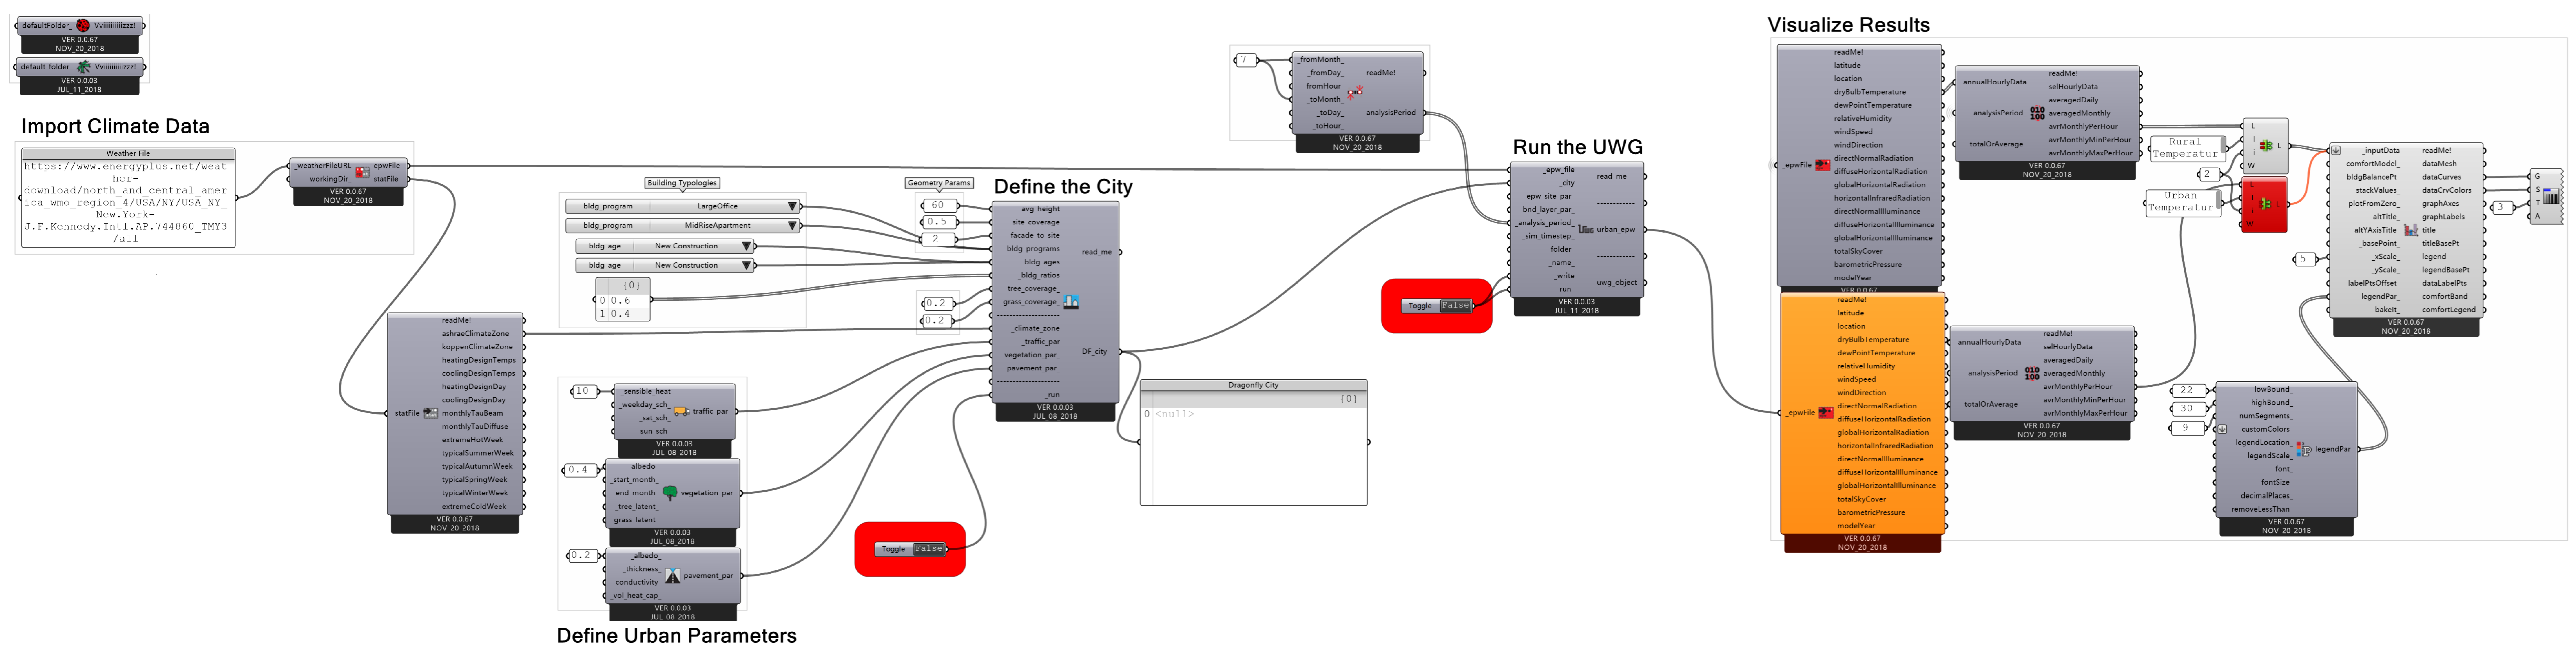
91], representing typical rural meteorology. The *.xml (*.uwg) urban geometry and physical characteristics file is mainly used as the parameter setting for UWG simulation, and defines specific urban and rural parameters and simulation settings internally. At present, the UWG mode can run simulations independently or be integrated with architectural design software such as Grasshopper plug-in. 
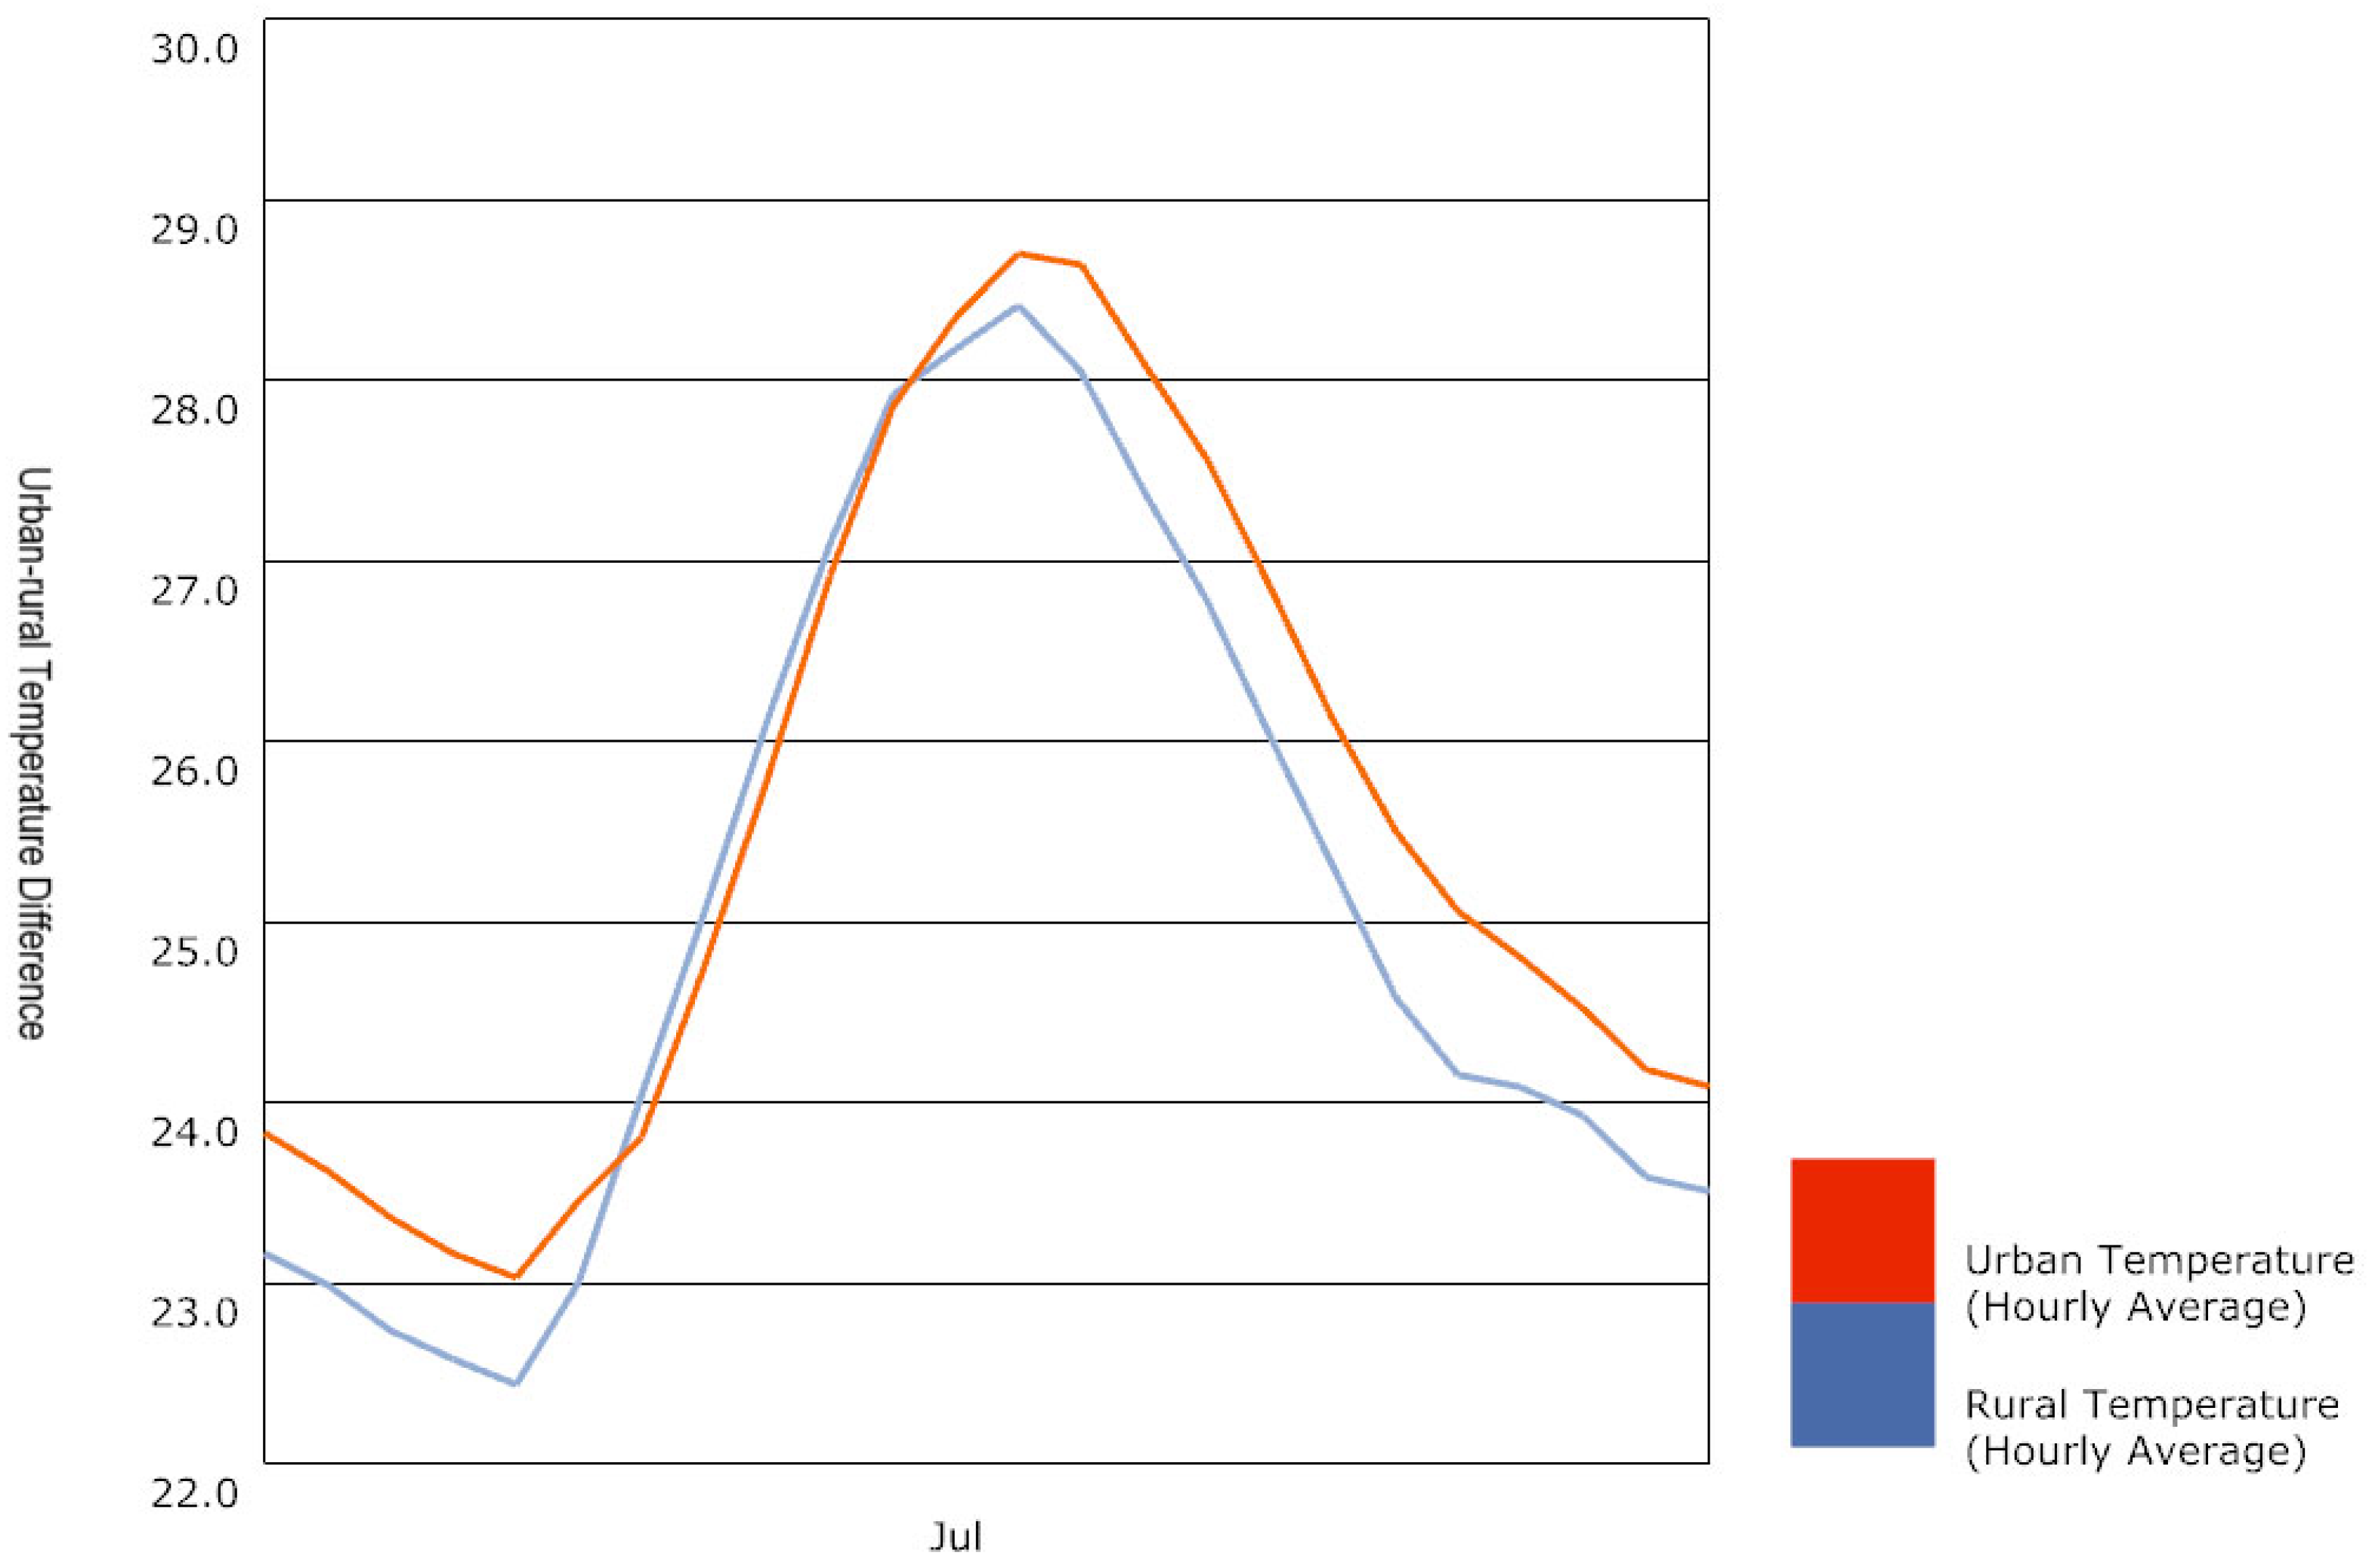
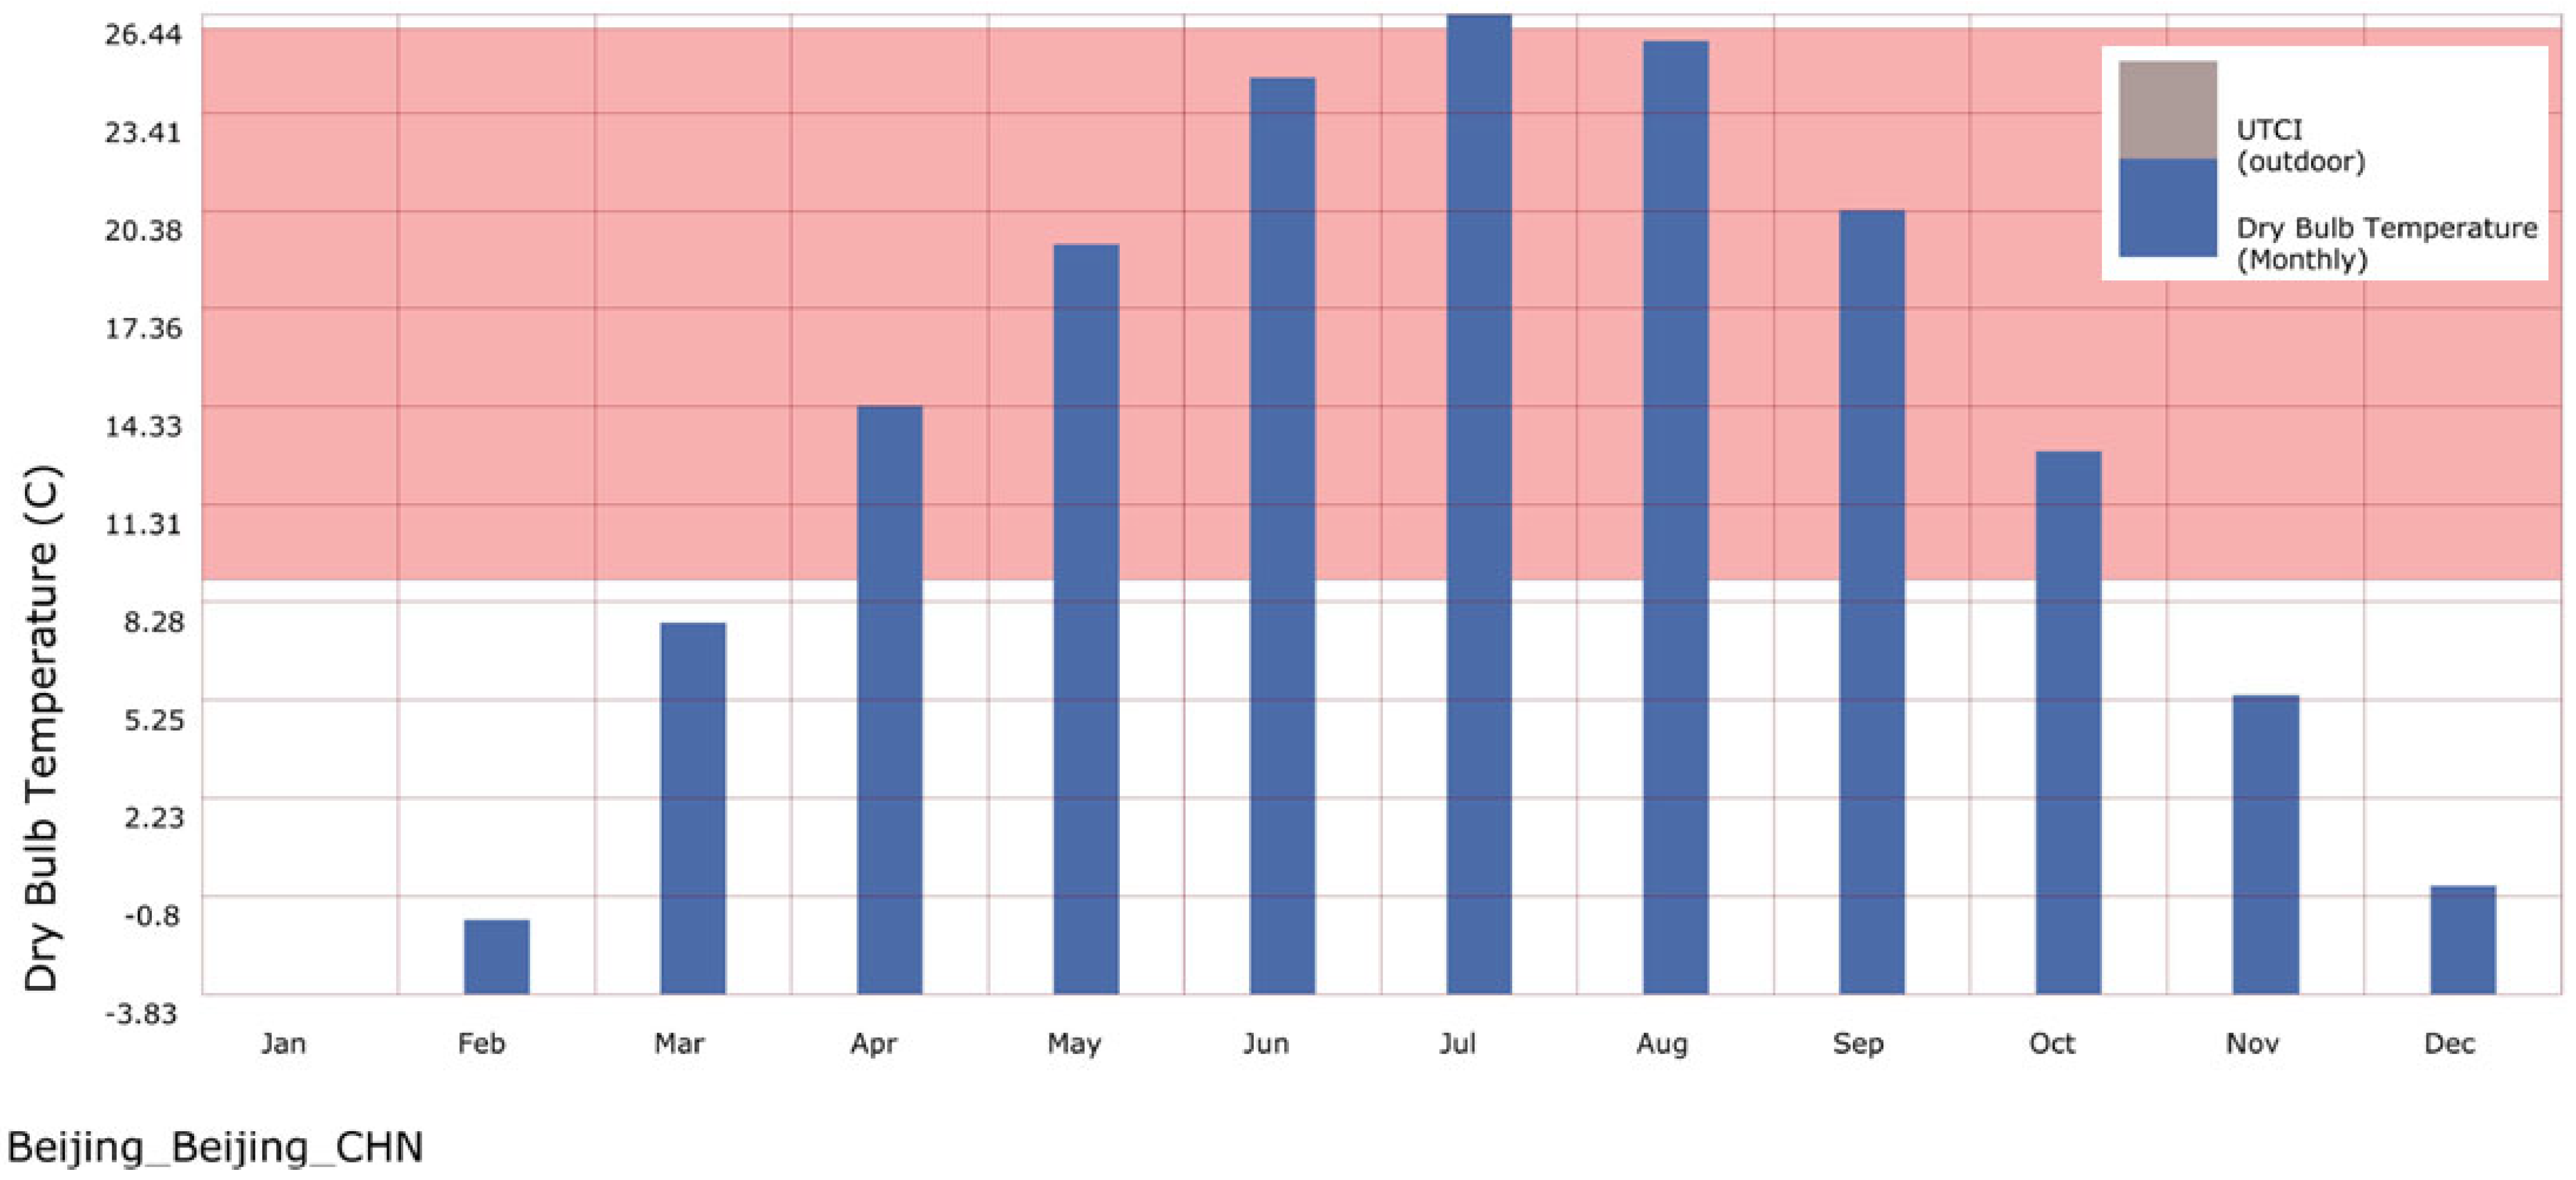
Figure 4 shows the urban–rural temperature difference of the UWG simulation of the heat island phenomenon in Grasshopper software.
The UWG model consists of four coupled modules, including the rural site model (RSM), vertical diffusion model (VDM), urban boundary layer model (UBL), and urban canopy and building energy model (UC-BEM). The four main modules and their functions are shown in Table 1. Figure 5 shows a schematic diagram of the four coupled modules of the UWG. Figure 6 shows the main energy exchange between the modules. Figure 7 shows the physical domain representation between the modules of the UWG in a city (daytime) [55,58].
Next, the theoretical basis and basic principles behind the four modules are introduced, respectively, as follows:
RSM: The RSM calculates the sensible heat flux of suburban sites based on the surface energy balance equation and provides it to the VDM and UBL model. The model divides the soil into discrete layers and solves a finite difference equation system (1) to represent the heat transfer process, as follows:
d 1 ( ρ c ) 1 T 1 t = C 1 , 2 T 2 T 1 + Q s u r f ,
For the first layer i, the following is derived:
d i ( ρ c ) i T i t = C i , i + 1 T i + 1 T i + C i , i 1 T i 1 T i ,
For any intermediate layer n, the following is derived:
d n 1 ( ρ c ) n 1 T n 1 t = C n 1 , n T d e e p T n 1 ,
where d is the depth, ρ c is the volumetric heat flux, T i is the average temperature of the i-th layer, C i , j is the average thermal conductivity between the i-th layer and the j-th layer, Q s u r f is the sum of the net surface radiation, sensible heat flux, and latent heat flux, and T d e e p is the annual average temperature of the site. The radiative heat flux is measured at the meteorological station, the sensible heat flux is calculated using the convective heat transfer coefficient, and the latent heat flux caused by vegetation (if present) is simply calculated as a part of the absorbed short-wave radiation, given the accuracy requirements of the UWG.
VDM: The vertical diffusion model calculates the temperature above the weather station based on the heat diffusion equation. The heat diffusion equation for the VDM is as follows:
θ ( z ) t = 1 ρ z z ( ρ ( z ) K d ( z ) θ ( z ) z ) ,
where θ represents the latent temperature in the air, z is the vertical spatial component, ρ is the air density, and K d is the diffusion coefficient. The difficulty in implementing this diffusion equation in the VDM lies in the estimation of the diffusion coefficient K d , mainly due to the difficulty in predicting a stable boundary layer.
This coefficient is currently calculated using the turbulent kinetic energy function, as follows:
K d = C k L k E 1 / 2 ,
where E represents the turbulent kinetic energy of the flow, C k is the model parameter, which is 0.4, and L k represents the length.
UBL: The urban boundary layer model calculates the air temperature above the urban canopy based on the energy balance of a selected control volume within the urban boundary layer defined by the mixing height Z r and the boundary layer height Z i (Figure 4). The energy balance is expressed as follows:
V c v ρ c v d θ u r b d t = H u r b + u r e f ρ c p ( θ r e f θ u r b ) d A f ,
where V c v is the control volume, ρ is the air density, c v is the specific heat ratio of air at a fixed volume, c p is the specific heat ratio of air at a fixed pressure, θ u r b represents the average latent temperature in the control volume, H u r b is the sensible heat flux on the surface of the control volume, θ r e f represents the reference latent temperature outside the control volume, u r e f represents the reference air velocity, and A f represents the cross-sectional area of heat exchange between the control volume and the surrounding environment.
UC-BEM: The urban canopy and building energy model is based on the TEB model and integrates the building energy model (BEM) to simulate the urban canopy. UC-BEM assumes that the air in the urban canopy is well mixed and calculates the air temperature and humidity in the urban canyon by using a heat balance method, taking into account the heat capacity of the air. The energy balance of the urban canyon is as follows:
V c a n ρ c v d T u r b d t = A w h w T w T u r b + A r h r T r T u r b + A r h r d , s k r T s k r T u r b   + A w i n U w i n T i n T u r b + V i n f / v e n t ρ c p T i n T u r b   + u e x ρ c p T u b l T u r b + H w a s t e + H t r a f f i c ,
where T u r b , T i n , T u b l , and T s k r are the urban canyon air temperature, indoor air temperature, urban boundary layer air temperature above the urban canyon, and effective temperature, respectively. V c a n is the air volume of the urban canyon. U w i n is the U value of the window. V i n f / v e n t is the ventilation rate. H w a s t e is the sensible heat part of the waste heat flux released into the urban canyon by the air conditioning system. H t r a f f i c is the anthropogenic heat generated by traffic, etc. u e x is the convective exchange rate between the air inside the canopy and above the canopy.

3. The Setting of Basic Parameters in UWG Model

The UWG is a microclimate model developed by the Massachusetts Institute of Technology (MIT). It mainly includes the following three basic parameters: an *.epw rural meteorological file, *.uwg urban characteristic file, and *.epw urban meteorological file. The *.epw rural meteorological file is the starting input of UWG simulation and is stored in epw file format. The *.uwg urban characteristic file defines specific urban and rural parameters and simulation parameters. The *.epw urban meteorological file is the final output file format of UWG simulation and is stored in epw file format.

3.1. Description of Rural Meteorological Files

Rural sites refer to the sites that are least affected by geographical features (such as valleys and large water bodies) within the study area [12]. Airports are usually located in open areas in the suburbs, with little interference from human and geographical factors, so rural meteorological files usually select meteorological stations located near suburban airports [91]. *.epw rural weather files define the meteorological factors of rural sites, including temperature, humidity, atmospheric pressure, solar radiation, wind speed, wind direction, etc. The main methods for obtaining rural meteorological files are as follows:
(1)
Obtaining weather data from around the world from the Energyplus official website.
(2)
Obtaining data through the Autodesk Green Building Studio platform (Revit platform).
(3)
Obtaining epw files for various regions through EpwMap under Ladybug.
(4)
Obtaining weather data from local weather stations and then generating epw files through Elements tool.
The header of the .epw file contains information about the statistical date and data source of this meteorological file. The meteorological data from all over the world downloaded from the Energyplus official website, Revit platform, and EPW map belongs to the typical meteorological year data. Typical meteorological year (TMY) is the outdoor meteorological data for building energy-saving design, renovation, and evaluation, representing the long-term climate conditions in the area where the building is located [92]. Elements is an open-source cross-platform software that is mainly used to create and edit custom weather files used in building energy simulation and can visualize weather data in multiple file formats. (Software address: https://bigladdersoftware.com/projects/elements/. accessed on 25 June 2025) For specific regional and time thermal environment simulation analysis, the meteorological data generated by Elements software is timely and representative.

3.2. Description of Urban Morphology Parameters

The *.uwg urban feature file defines the urban form, structure, buildings, reference sites, and simulation parameters. As shown in Table 2, the relevant parameters that have a greater impact on the thermal environment simulation results are as follows:
(1)
Average building height: h b l d = i = 1 n h i n , where n refers to the number of buildings in the block-scale site and h i refers to the building height of the i-th building (unit: m)
(2)
Building coverage (building density): ρ b l d = i = 1 n F T i A u r b , where n refers to the number of buildings on the block-scale site, F T i refers to the floor area of the i-th building, and A u r b refers to the site area of the block-scale site (values range from 0 to 1)
(3)
Façade-to-site ratio: V H = i = 1 n F A i A u r b , where n refers to the number of buildings on the block-scale site, F A i refers to the facade area of the i-th building, where its value is the product of the perimeter of the building’s footprint and the building height, and A u r b refers to the site area on the block scale
(4)
Material emissivity and albedo, vegetation properties, anthropogenic heat generated by traffic, heating and cooling temperature setpoints, boundary layer parameters, etc. [93,94,95].
Combined with the development of current earth observation technology and computer numerical simulation technology, there are currently four main methods for obtaining urban characteristic data, all of which are combined with geographic data processing platform software (such as ArcGIS Pro) for data comprehensive processing. (1) Use relevant instruments for on-site measurement, such as using vehicle-mounted mobile devices to record traffic artificial heat. (2) Obtain data based on previous research or building specifications. (3) Obtain data based on earth observation methods such as remote sensing images. (4) Obtain data using geographic big data platforms such as Google Maps and Baidu Maps.

3.3. Output of Urban Meteorological Files

The output of the UWG model is an *.epw urban meteorological file generated by rural meteorological data deformation, which mainly includes temperature, humidity, atmospheric pressure, solar radiation, wind speed, and wind direction. The Ladybug series plug-ins can import .epw files to generate wind rose diagrams, wet temperature curve diagrams, wet humidity diagrams, Universal Thermal Climate Index (UTCI), etc., to qualitatively analyze the wind and heat environment in urban areas. Among them, the UTCI is defined as the temperature that causes people to have the same physiological response as in the actual environment under a standard reference environment [96,97,98]. Importing the *.epw urban meteorological file into Ladybug, the dry-bulb temperature and UTCI during a certain period of time in the study area are shown in Figure 8. The wind rose diagram is a professional statistical chart in meteorological science which is used to count the frequency of wind direction and wind speed in a certain area over a period of time. Figure 9 shows the hourly wind speed rose diagram of Beijing throughout the year. In addition, epw files are compatible with many building energy analysis software, such as Energy Plus and TRNSYS, so building performance analysis can be performed.

4. USTE Simulation Based on UWG at Different Spatial–Temporal Scales

According to the previous literature, the USTE has a high complexity in temporal and spatial distribution and has multi-scale characteristics on the temporal and spatial scales [36]. In Table 3, for UWG simulation of the local urban microclimate, the analysis of multi-scale USTE patterns and mechanism changes can better understand the different performance characteristics of the thermal environment, which will help urban planners and architects to carry out targeted governance of thermal environment problems from different angles [99]. According to the statistics of the number of research publications at different scales in recent years, in terms of spatial scope, wind–heat environment simulation based on the UWG is mainly concentrated on the community scale and the urban scale. In terms of the time scale, wind–heat environment simulation based on the UWG is mainly concentrated on the simulation of daytime changes, daily changes, and monthly changes. Next, the specific research contents of the UWG at multiple scales are introduced, respectively.
Although UWG simulation obtains the microclimate environment of a certain point in the local urban canopy area, urban wind and heat environment simulation based on the UWG at different spatial scales has wide applications in urban climate prediction, urban planning, and studying the urban ecological environment. In terms of the classification of the spatial scale, this paper divides it into four categories, including the single building scale, community scale, mesoscale, and macroscale, with the city as a whole as the research object. An urban area with a similar surface cover type, land use type, and building density type in a building complex or block within the study area measuring no more than 1 km2 is defined as the community scale [100]. The urban scale with an area ranging from 1 square kilometer to 100 km2 is defined as the mesoscale. Wind and heat environment research on the entire city or urban agglomeration area is defined as the macroscale, and its spatial range is usually from tens to hundreds of kilometers or even larger. At the scale of single buildings and blocks, current research mainly focuses on microclimate changes such as heat exchange on the building surface, the shadow effect, and wind speed distribution. Through high-resolution building geometry data and meteorological data, the UWG model can accurately simulate the thermal radiation, wind speed changes, and local enhancement of the heat island effect on the building surface. At the urban scale, research focuses on urban-climate- and ecological-environment-related research such as the urban heat island effect, wind speed distribution, and pollution diffusion. The UWG model can simulate the thermal environment and wind field distribution of an entire city by reasonably simplifying the building geometry and material properties, providing support for urban planning and climate adaptation strategies. Based on the characteristics of the urban wind and heat environment, some scholars study the regional climate change of urban agglomerations and their mutual influence and perform analysis of the transmission path of atmospheric pollutants across urban areas. By simplifying the urban geometry, the UWG model is used to simulate the superposition effect of the heat island effect between urban agglomerations and the interaction of wind fields between different cities.
Table 3. Typical research cases at different spatial temporal scales.
ScaleDefinitionProjectTypical Literature
Spatial scaleBuildingBuildingsFocus on the microclimate of a single building or several adjacent buildings, especially how the building design affects indoor and outdoor thermal comfort[64,94,95]
ParkExploring the role of green infrastructure (e.g., park) in mitigating the urban heat island effect[101,102];
Community scaleRange from 0.1 km × 0.1 km to 1 km × 1 kmThe relationship between thermal environment and building energy consumption[103,104,105]
Relationship between building density and thermal environment[106]
Urban scaleCoverage area larger than 1 km × 1 kmImpact of vegetation on urban heat island effect[16]
The influence of underlying surface type on heat island effect[107]
The influence of building form on urban heat island effect[65,100]
Temporal scaleHourly scaleSimulation of changes at consecutive moments in a dayUWG simulation of heat island and accuracy verification[100,108]
Daily scaleSimulate changes over consecutive days or 1–2 weeks within a monthDiurnal variation of USTE and calibration of UWG model[65,89]
Monthly scaleSimulation of changes in consecutive months or different seasons within a yearSimulation of seasonal variation of UHI caused by changes in urban morphological parameters and its impact on annual energy demand of buildings[109,110,111,112]
Regarding the scale of single buildings and communities, the UWG model uses high-resolution grids to capture the detailed characteristics of the building microclimate, allowing for detailed parameter settings such as the thermal physical properties of building materials, thereby accurately simulating the heat exchange process. By combining CFD methods to optimize the wind field simulation capability of the UWG model at the microscale and using laser radar (LiDAR) and drone technology to obtain high-precision building geometry data, the accuracy of the model input physical parameters and the model simulation can be improved [61]. At the mesoscale, the UWG model simulates the thermal environment and wind field distribution of an entire city by reasonably simplifying the building geometry and material properties. It can be combined with regional meteorological models (e.g., WRF) to generate dynamic boundary conditions, improve the accuracy of the simulation, and use multi-source data (such as remote sensing data and GIS data) to correct the model parameters and enhance the ability to handle spatial heterogeneity [52,103]. At the macroscale, the UWG model is coupled with regional climate models (WRF or CMAQ) considering the influence of regional climate background factors, simulating the superposition effect of the heat island effect between urban agglomerations and the interaction of wind fields between different cities [113].

4.1. USTE Simulation at Different Spatial Scales

4.1.1. Single Building or Street Scale

UWG simulation studies on single buildings mainly focus on the analysis of climate characteristics between single buildings or several adjacent buildings and how these factors affect the energy consumption and indoor comfort of buildings [60]. The application of the UWG model at this scale can help researchers and designers to better understand the impact of the built environment on the microclimate, optimize building design to improve energy efficiency and living comfort, study the impact of different building shapes, heights, and layouts on wind speed, temperature, and radiation, and evaluate the ventilation performance of building complexes and identify possible wind shadows and vortex areas. The rapid growth of the urban area will lead to changes in urban environmental elements, especially local microclimates. Kamal and Athar et al. (2021) studied the effectiveness of open weather data processed by the UWG (i.e., World Weather Online and Open Weather Map datasets) and locally established meteorological stations [114]. Based on their simulation results, a detailed analysis of the loads of representative residential buildings in the Marina area of Lusail City near Doha, Qatar, and their relationship with building form was conducted. The results showed that an increasing building density or height would lead to a significant increase in cooling energy consumption, while optimizing street layout and increasing greening could reduce energy consumption. However, under certain conditions, the increase in the cooling consumption of some high-density residential buildings would far exceed the energy savings from increasing greening. For example, the increase in the cooling consumption of a typical high-density residential building in the area exceeded 11,000 kWh, while increasing greening could only save about 250 kWh. In the field of construction, the Nearly Zero Energy Building (NZEB) program is becoming increasingly important in addressing climate change and reducing energy consumption. Traditional building energy models (BEMs) usually treat buildings as isolated individuals and ignore the impact of the urban environment. Therefore, Boccalatte et al. (2020) conducted a quantitative study on the impact of urban morphology and microclimate on building energy consumption based on the combination of a building energy model (BEM) and the UWG, and analyzed the temperature changes under different urban configurations (reference area and enhanced area) [115]. The results showed that the urban air temperature increased by 0.8 °C in winter and 2.0 °C in summer.
Although great progress has been made in research on UWG wind–heat environment simulation at the above scale, there are still some problems that need to be further considered and solved. First of all, there is the uncertainty of the parameter range and limitations in accuracy. The simulated urban morphological parameters (such as building height, density, etc.) in the study may not cover all possible combinations, resulting in certain limitations in the applicability of the results. In fact, urban morphology may be more complex and existing models may not fully reflect the reality. The second problem is the universality of the model, as the specific cases studied may only apply to the climatic conditions or urban types in a specific region. For other climate zones or cities at different stages of development, simulation models and results application may require further verification and adjustment. The third is insufficient uncertainty analysis, and existing research has not fully discussed the uncertainty or error sources of the model. For example, the effect of the parameter setting of the model on the simulation results and its sensitivity when the UWG and EnergyPlus are coupled has been quantitatively analyzed. Fourth, there is a lack of sufficient measured data for verification. If the field weather station data or building energy consumption monitoring data can be combined, the reliability and practicality of the research results will be further improved.

4.1.2. Community Scale

Regarding USTE research at a community scale, relevant scholars often use UWG simulation to obtain the wind and heat environment at a specific block scale considering the heat island effect, which is used as the initial condition for building performance analysis in the area. This can not only conduct a more accurate building performance analysis, but also evaluate the comprehensive impact of building thermal performance and energy consumption performance caused by changes in building morphological parameters. To explore the relationship between the thermal environment and building energy consumption at the community scale, Gianpiero Evola et al. took the energy simulation of an existing office building on the campus of the University of Catania in southern Italy as an example, used UWG simulation to obtain the microclimate around the campus, and used two sets of data, the weather file of Catania Airport and the deformed weather file of UWG simulation considering the influence of buildings, vegetation, and heat sources in urban areas, to simulate the building energy. The results showed that using the deformed UWG weather data for building performance simulation could more accurately calculate the building cooling and heating loads [103]. Claudia Calice et al. took the campus of Sapienza University of Rome as an example. The UWG simulated the community-scale thermal environment around the campus area. The energy consumption of two public buildings on the campus was calculated using standard weather files from the suburbs and modified weather files from the UWG. The results showed that when the UWG-modified weather file was used to calculate the energy consumption, the cooling demand increased by 10%, while the heating demand decreased by 5% [104]. To explore the relationship between the complex system of urban morphology at the community level in Shanghai and building energy use, Steven Jige Quan et al. defined nine communities with different density forms based on the building density indicator FAR (i.e., floor area ratio), used UWG simulation to generate microclimate weather files for each community, and then used these weather files and all other required information in UMI as weather conditions to simulate the total building energy use of each block throughout the year. The results showed that the relationship between building density and energy consumption intensity was different for community building complexes of different functional types. A higher building density in commercial areas led to a lower energy use intensity, and the greater the density of residential areas, the greater the energy use intensity [106].

4.1.3. Urban (Or Macro) Scale

For the simulation of the urban-scale spatial thermal environment, the UWG can be used to obtain the temporal and spatial distribution characteristics of local urban heat island intensity and conduct sensitivity analysis on the parameters affecting the urban heat island effect. For example, Kim et al. used the UWG to simulate the heat island effect of the hottest week of a typical meteorological year (TMY3), changed the urban morphological parameters to estimate the impact of urban heat islands under different climatic conditions, tested the sensitivity of heat island effect mitigation strategies such as roof vegetation, tree, and grass coverage at the urban scale, and proposed targeted urban heat island mitigation strategies [16]. Changes in urban underlying surface types have a significant impact on the urban heat island effect. Farzad Hashemi et al. (2020) took the center of Philadelphia, Pennsylvania, as an example, combined the local climate zone (LCZ) classification system with the urban weather generator (UWG) model, used typical meteorological year (mTMY) data simulated and corrected by the UWG and the typical meteorological year (TMY) data of the local climate zone, respectively, and integrated them into the Urban Building Energy Model (UBEM) to study the spatio-temporal differences in cooling and heating energy demand for each building type, obtaining the impact of the urban heat island effect on the energy consumption of different building types in different climate zones at the urban scale [107]. To estimate the climate performance of different urban structures, Agnese Salvati et al. considered five key variables, including urban morphology, vegetation cover, building anthropogenic heat, traffic anthropogenic heat, and albedo, and then used the UWG model to parameterize the intensity of the urban heat island and verify it with the temperature measured by the local urban meteorological station. The results showed that changes in urban morphology, especially changes in the horizontal and vertical density of buildings, had an important impact on urban temperature [100]. Ma et al. considered local climate, shadows between buildings, and reflection effects in the simulation of energy dynamics at the urban scale and proposed a local-climate-distributed adjacent block model (LW-DAB), which simulated the entire urban model as a distributed system connected by local climate and inter-building effects [108]. The temperature was modified using the UWG simulation results, the radiation was modified according to the solar azimuth and altitude angles, and the DAB module was used to estimate building energy consumption. This method enables researchers and decision makers to conduct large-scale urban energy dynamics research [108].
At the microscale (single building and community scale), the main problems faced by the UWG model are insufficient geometric data accuracy, the complex coupling of wind and thermal fields, and the high consumption of computing resources. The building data in the existing urban database is usually rough and struggles to meet the needs of refined simulation, while high-resolution simulation requires a lot of computing resources, especially when dealing with large-scale building complexes, so computing efficiency becomes a bottleneck. At the mesoscale, the main problems faced by the UWG model are spatial scale conversion problems, inaccurate boundary condition settings, and insufficient processing of spatial heterogeneity. In the process of conversion from the microscale to mesoscale, how to reasonably simplify building geometry and material properties while maintaining simulation accuracy is a key challenge, and the existing data may struggle to reflect the actual urban climate characteristics, resulting in deviations in simulation results. At the macroscale, the main problems faced by the UWG model are the over-simplification of urban morphology, neglect of regional climate impacts, and insufficient data resolution. The simplification of urban morphology in macroscale simulation may lead to large deviations between the simulation results and the actual situation, and the resolution of existing data may not meet the needs of the situation, resulting in deviations in model input.
Urban wind–heat environment simulation research based on the UWG has important application value at different spatial scales, but it also faces significant spatial-scale problems. Microscale simulation needs to solve problems such as geometric data accuracy, wind field and thermal field coupling complexity, and computing resource consumption. Mesoscale simulation requires the optimization of spatial-scale conversion algorithms, dynamic boundary conditions, and spatial heterogeneity processing capabilities. Macroscale simulation needs to overcome challenges such as the oversimplification of urban morphology, neglect of regional climate impacts, and insufficient data resolution.

4.2. USTE Simulation at Different Temporal Scales

At present, there is no special discussion and division of the time scale of urban wind and heat environment simulation research based on the UWG. This paper only classifies it from the hourly scale, daily scale, and monthly scale, but there is no actual definite definition of time scale. Therefore, from the application perspective, it can also be further divided into short-term time scale research (where the time span is mainly based on hours or days as the basic unit), and the main work is focused on fine simulation and dynamic parameter adjustment. In terms of fine simulation, at the time scale of hours and days, the simulation model based on the UWG can provide high-resolution urban meteorological data, including temperature, humidity, and wind speed. This fine simulation is of great significance for understanding the urban heat island effect and microclimate change. For example, researchers can simulate the changes in the USTE during specific periods (such as the high-temperature period from 12:00 to 16:00 in the afternoon) to provide a scientific basis for urban planning. By dynamically adjusting parameters such as solar radiation absorption, reflection, and heat conduction on the building surface, the UWG simulation model can more accurately reflect the heat exchange process on the urban surface. This method is particularly effective in predicting the impact of extreme weather events (such as heat waves) on the urban environment. Simulation research application can also be divided into the medium-resolution time scale (where the time span is based on weeks or months), which mainly focuses on seasonal change simulation and energy consumption prediction. In terms of seasonal change simulation, the UWG model can capture seasonal changes in the urban environment, such as the cold island effect in winter and the heat island effect in summer. This is beneficial for evaluating the long-term impacts of urban greening, building material selection, and other measures on the urban climate. Through the USTE in different seasons obtained by UWG simulation, coupled with the energy consumption model and analysis, researchers can predict the energy consumption pattern of buildings, thereby providing relevant data support for energy-saving building design and urban energy management. For example, the simulation results can show changes in the air conditioning load in different months, helping to design more efficient energy systems. There is also UWG simulation research conducted on the long-term time scale (where the time span is based on years or decades), which mainly focuses on climate change adaptation research and the impact of land use changes. In terms of climate change adaptation research, the UWG model is used to evaluate the adaptability of cities in the context of climate change on the long-term time scale. By simulating the changes in the USTE over the next few decades, researchers can identify weak links in urban planning and propose corresponding improvement measures. For example, the model can predict the degree of intensification of the urban heat island effect with global warming, thereby guiding the optimization of urban greening and building design. Regarding research on the impact of UWG simulation of land use change, the quantitative impacts of urban expansion and land use change on the urban wind and heat environment are mainly considered. By analyzing urban climate change under different land use scenarios, researchers can provide reference strategies and suggestions for sustainable urban development. For example, the UWG simulation results can visualize the impact of new high-rise buildings on the microclimate of the surrounding area, helping planners to avoid adverse thermal environment changes.

4.2.1. Hourly Simulation

Daily-scale or hourly-scale simulation mainly studies the prediction accuracy of the UWG model. For example, Agnese Salvati et al. used two Mediterranean cities as examples to verify the prediction results of the UWG model through relevant meteorological sensors in the urban area. The results showed that the UWG can capture the changing trends of urban heat islands well. The prediction accuracy in the afternoon and evening was higher than that in the morning. The reason for this may be that the UWG does not calculate the vertical distribution of air in the urban canyon air and underestimates the radiation capture effect in the urban canyon [100]. Michael Street et al. compared the ability of Bueno’s UWG model and Crawley’s Morphing scheme to generate daily temperature changes in urban microclimates at specific locations [116]. In terms of hourly UWG simulation application research, it mainly focuses on capturing rapid changes in urban microclimates, such as short-term fluctuations in temperature, wind speed, and turbulence. Based on high-resolution meteorological data and detailed building geometry, instantaneous changes in the temperature and wind speed in urban canyons can be studied. Special attention is paid to the immediate impact of local heat sources (such as building surfaces and roads) on the USTE. For example, researchers can simulate the changes in the USTE during specific periods (such as the afternoon high-temperature period) to provide a scientific basis for urban planning. Martina et al. conducted a thermal environment simulation study of the metropolitan area of São Paulo at four different times of day (8 a.m., 12 p.m., 4 p.m., and 8 p.m.) based on the UWG and analyzed the UHI effect in typical areas [117]. Based on the simulated mean radiant temperature, air temperature, and relative humidity, the Dragonfly and Ladybug plug-ins are integrated to further analyze thermal comfort. In hourly simulations, the position and radiation intensity of the sun are constantly changing, so the simulation needs to accurately calculate the impact of solar radiation and shadow effects on the urban temperature. The thermal properties of building materials cause them to absorb and release different heat at different times of the day, which needs to be considered in detail in hourly simulations. Hourly UWG wind-heat simulations require high-temporal-resolution meteorological data, such as hourly solar radiation, air temperature, wind speed, etc. Due to the small temporal gradient, the simulation process is more complicated, resulting in a higher computational cost. The simulation results provided by the UWG at the hourly scale provide important support for urban building design, short-term weather forecasting, urban emergency response, and real-time environmental monitoring.

4.2.2. Daily Simulation

Daily-scale simulation focuses on the changes in the urban wind and heat environment occurring within a day, especially the impact of the temperature difference between day and night on the urban heat island effect (UHI). Related research results show that there is a significant difference in temperature between day and night, and the temperature changes in urban canyons are closely related to solar radiation and building heat storage. These studies provide strong support for urban energy management and short-term climate adaptation measures, such as the reasonable arrangement of the operation time of cooling and heating systems. In terms of methods, daily-scale research mainly studies the calibration of the UWG model. For example, Shen et al. calibrated the UWG model for the week from 13 June to 20 June 2019, using the 12 uncertain input parameters of the UWG. Meteorological data from rural and urban meteorological stations during 22–29 June and 20–27 January were used to verify the accuracy of the calibrated model. The results showed that the calibrated model was more reliable [65]. Mao divided the 30 uncertain parameters of the UWG into four groups and used a hyper-heuristic evolutionary algorithm (EA) to validate the calibrated UWG model considering four periods in 2017, namely, 15–21 January, 8–14 February, 15–21 July, and 8–14 August [89].

4.2.3. Monthly Simulation

Monthly-scale UWG simulation application research mainly focuses on two points. The first is simulating the impacts of different seasons on the urban wind and heat environment. Urban geometry (such as building height and street width) has a significant impact on the seasonal wind and heat environment. Changes in solar radiation, temperature, and wind speed in different seasons lead to significant differences in the urban microclimate. These studies provide a scientific basis for urban planning, such as the reasonable arrangement of vegetation and the design of building layouts to optimize the urban microclimate. The second point is studying the impact of long-term meteorological conditions on the urban wind and heat environment. Based on historical meteorological data, the changes in interannual temperature, wind speed, and turbulence can be studied. Interannual meteorological conditions have a significant impact on the urban wind and heat environment, especially the temperature and wind speed distribution in urban canyons. These studies provide important support for long-term urban planning and climate adaptation design, such as evaluating the adaptability of cities under future climate change scenarios.
In addition, the *.epw file output by UWG deformation can easily analyze the interannual variation characteristics of UHIs. A. Salvati et al. proposed a chain strategy to calculate the meteorological boundary conditions for annual building energy consumption simulation, in which the UWG was used to calculate the annual air temperature and analyze the impacts of heat islands in different climate zones on building energy demand throughout the year. The results showed that the annual energy demand of urban buildings depended on the regional climate. The annual energy demand in cold climates was more related to the shadows between urban buildings, and the annual energy demand in temperate climates was more related to the intensity of heat islands [109]. Agnese Salvati et al. changed eight parameters affecting the intensity of UHIs and used the UWG model for parameter sensitivity analysis. The results showed that changes in urban morphological parameters could lead to a change rate of up to 120% in the annual average UHI intensity [110,111]. Li et al. studied the relationship between changes in seasonal heat island intensity and building energy use by integrating the urban weather generator (UWG) model and Urban Building Energy Model (UEBM), mainly considering building energy consumption, heating and cooling demand, and electricity consumption patterns [118].
Simulations on a larger time scale, such as 30-year climate cycle simulations, are the basis for evaluating the long-term evolution of urban heat islands (UHIs) and climate adaptation strategies. “The 30-year cycle is the golden standard for urban climate science”, which spans the life cycle of infrastructure, natural climate oscillation cycles, and typical periods of urban expansion. The 30-year climate cycle covers multiple ENSO (El Nino–Southern Oscillation) cycles and solar activity cycles. The design life of infrastructure such as urban green spaces, building complexes, and drainage systems is generally about 30 years. All of these determine the underlying demand for UWG simulations based on longer time scales to respond to urban climate risks. In addition, short-term simulations cannot capture slow-changing processes such as vegetation maturity and surface aging, which require simulations over a longer time span. Therefore, it is of great significance and practical application value to verify the long-term effectiveness of urban climate adaptation strategies. However, 30-year UWG simulation faces problems such as a large time span, high parameter uncertainty, and multi-scale coupling.
Research on urban wind–heat environment simulation based on the UWG has made significant progress at different time scales, which can provide an important scientific basis for urban planning, energy management, etc. However, the uncertainty of model parameters, multi-scale coupling problems, and limitations in practical applications are still the main challenges facing current research. Future research needs to find a balance between data accuracy and model complexity and strengthen interdisciplinary cooperation to promote the application of the UWG model in practical urban management. The results of UWG simulation are highly dependent on the accuracy and availability of meteorological data. The UWG model relies on a large amount of input data, such as the geometry of buildings, thermal properties of materials, etc. The accuracy of these data directly affects the accuracy of the simulation results. At present, the building data and meteorological data of many cities are incomplete or inconsistent, which increases the uncertainty of the simulation results. High-resolution meteorological data are particularly important for hourly- and daily-scale simulations, but in practical applications, there are certain difficulties in obtaining and controlling the quality of these data. For example, hourly-scale meteorological data require high temporal and spatial resolutions, which are expensive to obtain and susceptible to measurement errors.
Existing studies mainly focus on the simulation of the urban wind and heat environment under conventional meteorological conditions, lacking detailed analyses of extreme meteorological events (such as extreme heat, heavy rain, and strong winds). Extreme meteorological events have a significant impact on the urban wind and heat environment, but it is difficult to consider these events in simulations, requiring more complex models and higher computing resources. Comprehensive simulations at multiple time scales require the processing of large amounts of meteorological data and complex model parameters, which incurs a high computational cost. Especially in simulations at the interannual scale, the data processing and computing tasks of long time series have high demands for computing resources, limiting large-scale applications. In addition, simulation results at multiple time scales need to be comprehensively analyzed and interpreted, which increases the complexity of the research. Urban geometry (such as building height, street width, and vegetation distribution) has an important impact on the urban wind and heat environment. However, existing studies have certain limitations in dealing with complex urban geometry, especially in the integration of three-dimensional geometric modeling and high-resolution Geographic Information System (GIS) data. The complexity of urban geometry places higher demands on the accuracy and reliability of simulation results. The parameterization method of the UWG tool has certain limitations in applicability at different time scales. For example, hourly-scale simulations require more sophisticated parameterization methods to capture instantaneous changes, while interannual-scale simulations need to consider the impact of long-term meteorological conditions. Existing parameterization methods have certain deficiencies in dealing with the complexity of different time scales and need to be further optimized and improved. Existing UWG studies are mainly based on historical meteorological data and lack detailed analyses of future climate change scenarios. With the intensification of global climate change, the challenges facing the urban wind and heat environment will become more complex. To simulate the impact of future climate change on the urban wind and heat environment, it is necessary to combine global climate models and regional climate models to further improve the accuracy and reliability of simulations.

5. Optimization of UWG Model

Since Bruno Bueno developed the first version of the UWG in 2014 [59], the accuracy of generating the urban microclimate environment has been verified and improved many times. Summarizing and analyzing improvement methods for UWG model accuracy in a timely manner are conducive to improving the simulation accuracy of the model and conducting more accurate research on the urban space wind and heat environment. The simulation results produced by the UWG model are mainly composed of *.epw files and *.uwg files. The *.epw file is the starting input of the UWG simulation. Since the RSM has a very strict definition of heat transfer phenomena at the reference location, a rural meteorological station with a correct location should be selected (the definition of rural stations is shown in Section 2). The *.uwg file records the urban parameters of the UWG simulation. The *.uwg simulation parameters are divided into the following two categories: (1) deterministic input parameters, which mainly describe the characteristics of urban texture, such as average building height, site building density, façade–horizontal ratio, vegetation coverage, etc., and (2) uncertain parameters, which are mainly estimated from historical documents and data or obtained through indirect calculation and have a certain range of values, such as boundary layer height, VDM reference height, and circulation coefficient. This section introduces methods to improve model accuracy considering the following two aspects: the accurate acquisition and input of deterministic parameters in *.uwg files and the calibration input of uncertainty parameters.

5.1. Optimization of UWG Model Based on Deterministic Parameters

Many studies have conducted sensitivity analysis on the key input parameters that affect the accuracy of UWG simulation [119]. The main input parameters that affect the accuracy of UWG simulation are average building height, site building density, facade-to-horizontal ratio, anthropogenic heat, vegetation, (roof) material albedo, etc. [57,58,101]. These parameters transform the complex and heterogeneous urban structure into a homogeneous description defined by the Town Energy Balance (TEB) scheme. The key input parameters that affect UWG simulation results are introduced as follows:
(1)
Average building height: h b l d = i = 1 n h i n , where n is the number of buildings in the block-scale site and h i is the building height of the i-th building (unit, m)
(2)
Site building coverage (site building density): ρ b l d = i = 1 n F T i A u r b , where n is the number of buildings on the block-scale site, F T i is the floor area of the i-th building, and A u r b is the site area of the block-scale site (values range from 0 to1)
(3)
Elevation-to-horizontal ratio: V H = i = 1 n F A i A u r b , where n is the number of buildings on the block-scale site, F A i is the elevation area of the i-th building, which is the product of the perimeter of the building’s footprint and the building’s height, and A u r b is the site area on the block-scale
(4)
Material emissivity and albedo, vegetation properties, anthropogenic heat generated by traffic, cooling and heating temperature set points, and boundary layer parameters [93,94,95,120,121]
The precise input of the above deterministic parameters has a great impact on the simulation results of the UWG. For urban morphology parameters, J. Litardo et al. used ArcGIS maps, Google Street View (orthophotos provided by the Durham City Council), and field visits to the area when images were not available to accurately obtain these parameters [25]. Regarding the parameterization of vegetation cover, Michael Street et al. calculated the area of the closed vegetation curve divided by the urban area through high-resolution remote sensing images to obtain the average vegetation density value [116]. The calculation of high-resolution vegetation cover improved the accuracy of the UWG simulation results. For anthropogenic heat input parameters, Agnese Salvati et al. simulated the heat release values of daily vehicles to improve the accuracy of UWG predictions [110,112]. J. Litardo et al. determined the albedo parameters of materials by identifying roof, wall, and road materials and assigning typical albedo values to them [25]. Noelia Alchapar et al. measured the albedo values of urban building maintenance materials using albedo measurement instruments [94,95].

5.2. Optimization of UWG Model Based on Uncertainty Parameters

Considering uncertainty parameters, most of them are derived from previous research and relevant knowledge. For example, the reference height of the VDM and the nighttime urban boundary layer height are obtained through mesoscale atmospheric simulation, and the UCM-UBL exchange coefficient and the proportion of waste heat entering the canyon are derived based on relevant knowledge. Due to the dynamics of urban systems (such as dynamic building energy consumption related to residents) and diversity (such as the influence of different weather elements), it is difficult to provide accurate values of these parameters for all urban sites [119,122] (see the Table 4). To capture the microclimate effects of specific locations and reduce the uncertainty of UWG simulation, calibrating the uncertainty input parameters that affect UWG simulation results is another way to improve the model’s accuracy.
Table 4. Research on UWG model optimization method.
Optimization MethodsParameter TypesOptimized ParametersMain References
*.epw files*.epw files: The weather station located near the airport represents the weather in the countryside.Rural site location[116]
*.uwg filesDeterministic parametersComputable input parameters related to the characteristics of the urban fabric.Urban building form parameters[25]
Vegetation coverage[116]
Artificial heat[110,111]
Material albedo[25,94,95]
Uncertainty parametersParameters with a certain range of values due to the dynamics and diversity of urban systems are mostly estimated from the literature and data.About 30 uncertain parameters of the UWG optimized by an evolutionary algorithm[89,119]
About 12 uncertain parameters of the UWG optimized by a dual-objective differential evolution algorithm[65]
Uncertain parameters related to buildings in the UWG optimized based on a genetic algorithm[123]
Simulation models play an important role in the design, analysis, and optimization of building environment and energy systems. Due to the complexity of the actual environment and interaction parameters, it is difficult for simulation models to accurately simulate the occurrence process of the real system. Therefore, the calibration and uncertainty analysis of the urban microclimate UWG model are particularly important. In Table 4, based on the 30 input parameters of the UWG model, including meteorological factors, urban characteristics, vegetation variables, and building geometric physical parameters, Mao et al. conducted a global sensitivity analysis with outdoor air temperature as the optimization target. Through Monte Carlo filtering and optimization-assisted calibration, an online hyper-heuristic evolutionary algorithm (EA) was proposed and developed to accelerate the calibration process [89,119]. The results showed that the UWG was a very robust simulator to approximate urban thermal behavior in different seasons. The calibrated model could simulate the urban outdoor air temperature faster and more accurately. Shen et al. used a dual-objective differential evolution algorithm (DE) to calibrate the model for the 12 uncertain input parameters of the UWG. The objective optimization function was the sum of the weighted variance coefficients (CVs) of temperature and relative humidity. The calibrated model was more reliable [65]. Santos L. G. R. et al. used a genetic algorithm to automatically calibrate the UWG model and accurately simulate the wind–heat environment and building energy consumption of a building complex in Abu Dhabi city [123].

5.3. Optimization for UWG Model Considering Anthropogenic Heat Emissions

5.3.1. Concept and Characteristics of Anthropogenic Heat

Anthropogenic heat refers to the sensible and latent heat fluxes released into the atmosphere by human activities, mainly including building anthropogenic heat, traffic anthropogenic heat, metabolic anthropogenic heat, and industrial emission anthropogenic heat [124]. Anthropogenic heat emissions affect the local climate and environment of cities by changing the surface energy balance. Specifically, anthropogenic heat increases turbulent exchange in urban areas and increases turbulent kinetic energy, thereby raising the height of the urban atmospheric boundary layer and enhancing heat island circulation, which is particularly obvious at night, making the temperature in the city center significantly higher than that in the suburbs [125], which is an important reason for the formation of the urban heat island effect [110,111,126]. However, due to the diversity, complexity, and dynamic variability of anthropogenic heat sources, anthropogenic heat data are difficult to obtain and have temporal and spatial differences. Therefore, this impact is often ignored in the current urban surface radiation and energy balance simulation studies. In fact, anthropogenic heat is an important consideration in the study of urban surface radiation balance and has a profound impact on the urban surface heat balance, sensible heat, latent heat flux, and net radiation change. Therefore, it is particularly important to accurately obtain anthropogenic heat data and incorporate it into the study of the urban spatial thermal environment [31].

5.3.2. Calculation Method of Anthropogenic Heat

At present, the calculation methods for anthropogenic heat include the energy consumption inventory method (also known as the social survey method), building energy consumption model method, and surface energy balance method [127], among which the energy consumption inventory method is the most commonly used method in current USTE research [128]. The energy consumption inventory method includes the top-down energy inventory method and the bottom-up energy inventory method. The top-down energy inventory method uses certain spatial allocation principles to allocate the anthropogenic heat emissions of a city or region to a smaller scale, and the temporal and spatial resolution of the calculation results is relatively low. The bottom-up energy inventory method takes building complexes, residential areas, etc., as research objects to calculate the anthropogenic heat emissions of different heat sources. The temporal and spatial resolution of these results is relatively high, but sufficient statistical data is required, which will increase the difficulty of obtaining data accordingly. The surface energy balance method estimates the flux of each component through experimental fixed-point measurements or remote sensing images and then infers the anthropogenic heat. The former is difficult to apply to a large-scale study area due to limitations such as instruments and terrain, while the latter makes up for this defect, but is also limited by algorithms and data resolution. The building energy consumption model method can accurately calculate the heat dissipation and time evolution coefficient of a single building, but the accuracy of the results is restricted by the scale and dimension of the input data, and traffic heat dissipation is not considered, which will produce large errors.
Although the energy consumption inventory method can quantify the urban anthropogenic heat value well, the relevant literature shows that the anthropogenic heat flux value [W/m2] is related to the degree of human activity, building height and density, and underlying surface materials and has complex spatio-temporal distribution characteristics [31,127,129]. At present, anthropogenic heat calculation usually gives an anthropogenic heat emission value for the study area as a whole or subdivides the study area by administrative boundaries and estimates the anthropogenic heat emission of each administrative area. The dynamic estimation of anthropogenic heat emission over time is relatively rare. However, the quantitative estimation of anthropogenic heat is a necessary step in USTE research. The grid distribution study of anthropogenic heat emissions based on GISs is conducive to revealing the impact of human activities on the surface energy balance, improving the accuracy of USTE simulation, and improving the thermal environment of human settlements. It has practical reference value for the rational layout of cities and coordinated regional development [130]. Therefore, it is necessary to consider the relatively accurate spatio-temporal distribution of anthropogenic heat in climate models.

5.3.3. Optimization of the UWG Model Considering Anthropogenic Heat Emissions

One of the advantages of the UWG over other microclimate simulation algorithms is that it considers the impact of anthropogenic heat on the urban microclimate [131]. Building anthropogenic heat contributes the most to the anthropogenic heat value. The UWG integrates the building energy model (BEM) into the TEB model, defines various building types internally, and reasonably quantifies the building anthropogenic heat value [57]. Therefore, in UWG simulation, it is only necessary to select the urban building type and the land area ratio. Industrial heat emissions account for a small proportion of anthropogenic heat emissions. Combined with the current situation of large-scale industrial transfer in urban areas, anthropogenic heat emissions caused by industrial point sources can be ignored in the spatial distribution of the model. In UWG simulation, only the anthropogenic heat generated by traffic and human metabolism needs to be input, and the sum of the two is calculated as non-building sensible heat input.
Michael Street et al. found through the parameter grid algorithm of GenOpt that although the input value of anthropogenic heat has a smaller impact on simulation results than solar radiation [116], the anthropogenic heat value in specific seasons and regions needs to be considered when applying the UWG. Traffic anthropogenic heat emissions have a significant impact on the simulation accuracy of the UWG. In previous studies, the use of fixed traffic anthropogenic heat values has led to large UWG simulation errors, especially in traffic-dense areas, which underestimates the UHI intensity. If the model can incorporate the dynamic characteristics of traffic heat, it can more accurately reflect the UHI intensity. Litardo et al. divided traffic density into three levels, low, medium, and high, and quantified anthropogenic heat emissions. After considering the actual traffic density, the root mean square error (RMSE) of the urban air temperature simulated by the UWG and the measured data was ≤1.7 °C and the mean absolute percentage error (MAPE) was ≤6%. By introducing anthropogenic heat quantification under different traffic densities, the deviation between the simulated temperature and the measured value was significantly smaller than the traditional method using fixed traffic values, which significantly improved the simulation accuracy of the UWG for tropical city UHI. Agnese Salvati et al. used daily vehicle heat release values as inputs for UWG simulation. The results showed that traffic anthropogenic heat significantly simulated the summer UHI intensity. When the average traffic anthropogenic heat value increased from 8 W/m2 to 30 W/m2, the summer UHI intensity increased by more than 1 °C, thereby improving the accuracy of the UWG prediction of UHI [103,104]. Therefore, changing the fixed anthropogenic heat value to a time function (such as the weekday/holiday mode), combining the UFZ (urban functional zone) to allocate differentiated anthropogenic heat intensity [130], and using dynamically parameterized anthropogenic heat values for UWG simulation can further improve simulation accuracy.

6. Applications Related to UWG Simulations

6.1. USTE Simulation

Existing UWG-related research has not focused on collecting the complex modeling information and various input parameters of the UWG [65]. In Table 5, we can find that GIS technologies such as remote sensing can be coupled with the UWG to provide important data sources for the parameter optimization of UWG models and the input of precise initial conditions [132]. Litardo et al. obtained urban morphological parameters through remote sensing images, Google Street View, and ArcGIS maps for simulation parameter inputs to the UWG model, conducted a sensitivity analysis of the main driving factors affecting the urban heat island effect in Durham, and proposed a general mitigation strategy to reduce the intensity of the urban heat island effect [25]. SALVATI et al. obtained GIS data from the open-source software gvSIG 1.0 and used AutoCAD 2025 to build a detailed digital model of the building footprint to calculate the three key input parameters of average building height, site building density, and facade-to-horizontal ratio. The tree coverage rate was calculated based on aerial remote sensing images from Google Earth, and urban weather files were generated through UWG simulation. The prediction results were compared with the measured results, indicating that the prediction results of the UWG had a certain reliability, and some suggestions regarding the applicability of the UWG were put forward [91]. Li et al. collected some GIS data, including the year of construction, number of floors and building location, building type information, and building HAVC information, from the New York City Open Data Platform and the New York State Government Website for UWG input parameters and used the UWG to generate local weather data based on existing hourly weather data to simulate the building energy use in Manhattan [118]. Shen et al. proposed the use of map capture technology and unsupervised clustering to classify building types, obtained building, road, and vegetation parameters through the data processing of Baidu Maps and the ArcGIS Pro 13.0, and combined these with a differential evolution calibration algorithm to simulate the local urban microclimate in the Caiwuwei area of Shenzhen City [65]. Gianpiero Evola et al. used the UWG model to calculate the thermal environment of the University of Catania campus, using satellite images and field observation data to estimate the average building height, facade-to-horizontal ratio, horizontal building density, and vegetation coverage [103]. It is worth pointing out that with the development of high-resolution remote sensing technology and GIS technology, high-resolution satellite data will provide an important data source for the simulation of the UWG USTE.
Table 5. Coupling of relevant earth observation technologies and UWG model.
Type of TechnologyTarget of CouplingMain References
GISTo build a 3D building model[91]
To obtain building information data[65,118]
RSTo obtain building form parameters[25,103]
To obtain vegetation coverage parameters[91,103]
Sensing TechnologyTo obtain artificial heat parameters[25,110,111]
To obtain verified temperature and humidity parameters[116]

6.2. Architectural Design

Dragonfly is a plug-in for the Rhino and Grasshopper parametric performance analysis toolset that focuses on outdoor thermal environment analysis. It can model and analyze the impact of large-scale climate phenomena (such as urban heat islands and future climate change) and local climate factors (such as terrain changes). The UWG is integrated into the Dragonfly plug-in of Grasshopper. Dragonfly uses the UWG for climate modeling and simulates and estimates urban-scale thermal effects and climate change, enabling designers to efficiently simulate and analyze climate and heat island effects in the Rhino interface. Dragonfly is also connected to public climate databases and satellite image datasets such as Ladybug, Honeybee, and Butterfly for climate prediction and building performance analysis. The UWG can be run to simulate the thermal environment in the Grasshopper parametric modeling software. First, input parameters such as site building coverage, façade-to-site ratio, and average building height can be automatically extracted through the Grasshopper custom morphological extractor (as shown in Figure 10). Then, a custom UWG simulation battery pack (as shown in Figure 11) is used to visualize the urban climate, which distorts the rural/airport weather data. With the use and development of the UWG model, MIT developed a new plug-in in recent years, UMI, which based on the UWG and combined with some urban design tools. UMI can analyze the accessibility of urban buildings and building radiation heat gain. The Grasshopper parametric modeling software integrates the analysis process of UMI with the optimization process of architectural design and can provide timely feedback on the performance results of optimized buildings.
Based on the performance optimization design method on the Rhino + Grasshopper platform, Ladybug, Honeybee, and Dragonfly are combined to simulate meteorological environmental parameters such as wind, light, and heat. With the help of optimization algorithms, automatic optimization based on given goals is realized, which solves the problem of a large amount of repetitive work in conventional performance simulation software, which is to analyze first, then modify, then simulate, and then modify, making building performance analysis faster and more accurate and also making architectural design dynamic and adaptable. Wang et al. explored the relationship between thermal comfort and public space layout through performance optimization simulation experiments. Grasshopper was used to establish an urban space model, and then Ladybug and other software were used to analyze the thermal environment of a city. The environmental performance and design were organically integrated with genetic algorithms. Then, by comparing the differences in the thermal environment under different forms, solutions were found to improve the USTE, optimize the public space layout, and create a comfortable public space environment [130]. Liu et al. integrated the three modules of urban morphology generation, microclimate performance simulation, and automatic optimization with the help of the Grasshopper parametric platform, took the human outdoor comfort index (UTCI) as the optimization target, used a genetic algorithm for automatic optimization, analyzed the optimization mechanism based on the experimental results, and proposed the cold-region urban morphology layout strategy [133]. Aiko Nakano et al. proposed the UMI workflow and demonstrated it through a case study of the development of the East Campus of MIT in Cambridge, Massachusetts, USA, simulating the climate change prediction of adding 130,000 square meters of laboratory space and residences under existing urban conditions. Taking outdoor thermal comfort and building energy-saving development as the optimization targets in the urban design process, each planning stage of the campus was designed in detail [101]. The use of UMI not only enables urban designers to calculate energy consumption under the urban heat island effect more accurately, but also allows for parametric modeling based on microclimate conditions to optimize the design of relevant parameter values such as building density, vegetation coverage, and roof albedo [101,134].

6.3. Microclimate Simulation

The UWG builds an urban microclimate model from the bottom up. It has a small amount of calculation and a fast operation speed when simulating the USTE [57,58,59,89,116,135]. It is very flexible in describing the characteristics of urban and rural areas and the physical processes occurring therein [116]. The UWG changes the .epw file of the countryside through a series of attributes to reflect the average thermal environment conditions in the urban canyon, and is widely used in the modeling and analysis of the urban heat island effect [93,110,111,119,136,137].
Bruno Bueno proposed the idea of building an urban weather generator in his master’s thesis at MIT [55]. After developing the first version of the UWG in 2014 [59], he conducted research on the simulation and verification of microclimates in different cities and climate environments, such as Toulouse in France [58,138], Athens in Greece [57,58], Basel in Switzerland [138], and Singapore [59,89], indicating that the UWG model has an excellent performance in simulating urban wind and heat environments. At present, the UWG model is mainly used to simulate the urban heat island effect in the field of USTE research. For example, for different local climate zones in cities, the UWG can be used to simulate the impact of changes in urban underlying surface parameters (such as building height, density, aspect ratio, etc.) on the intensity of urban heat islands and then propose corresponding heat island mitigation measures. Liu Jing et al. proposed that the intensity of heat islands is related to building height, building density, land development intensity, human activities, material albedo, vegetation, and water coverage [139]. Based on the energy balance of towns, the UWG can quickly estimate the impact of changes in the above urban morphology, geometry, and surface material parameters on the urban canopy temperature. Therefore, urban planners can formulate zoning regulations, such as the building height and density of each zone, land use, road traffic intensity, and building roof materials, and other intervention measures to improve the USTE.
Urban morphology affects building energy demand and local climate. A large number of scholars use the UWG to conduct sensitivity analyses of the urban parameters affecting heat island intensity in different climate zones, quantitatively analyze the typical characteristics of urban development, and alleviate and improve the USTE. For the Mediterranean climate, Agnese Salvati set five urban morphologies according to different morphological parameters for modeling and parameterized analysis. The variable input parameters included average building height, building density, and façade–horizontal ratio. The UWG was used to simulate the heat island coefficients of different urban morphologies. The results confirmed the correlation between urban morphology and heat island intensity [136]. Agnese Salvati et al. studied the importance levels of eight urban parameters, obtained five urban types according to different values set for the eight parameters, and used the UWG model to conduct a sensitivity analysis on the impacts of the different urban parameters on heat island intensity. The results showed that among the urban parameters affecting the urban heat island effect, the most important factor was the urban building form, followed by the anthropogenic heat generated by the building air conditioning system and traffic. At the same time, it has been pointed out that small-scale changes in tree cover and reflectivity have little effect on mitigating the heat island effect in the Mediterranean region [110,111]. For tropical rainforest climates, Massimo Palme used the UWG to test the impact of factors including building density and height, vegetation coverage, electricity use, and traffic on the intensity of summer UHIs in Pacific Latin American coastal cities. The results showed that the contribution of electricity use (mainly HVAC systems) to urban heat islands was second only to changes in building form and anthropogenic heat from traffic [93]. For the temperate marine climate, LEMERCIER Cyril et al. changed 10 input parameters (including average building height, urban building density, urban area aspect ratio, road albedo, grass and shrub coverage, tree coverage, roof reflectivity, roof grass and shrub coverage, glass ratio, and roof albedo), used the UWG to simulate the heat island effect on climate, and used the Minitab2025 (for generating sample scenarios) and Morris (for sensitivity analysis) methods to find the important factors affecting the heat island effect. Finally, it was found that building height and building density had the greatest impact on the intensity of heat islands [137]. For the highly heterogeneous tropical desert climate, Jiachen Mao took Abu Dhabi as the specific urban microclimate research object, set the urban parameters of the UWG, and used Monte Carlo technology to conduct regression-based global sensitivity analysis based on 30 input parameters to determine the important factors affecting the urban microclimate simulation. The results showed that the UWG could capture the urban heat island pattern and approximate the thermal behavior of Abu Dhabi’s urban microclimate in different seasons well [119].
The main parameters for USTE assessment include air temperature, relative humidity, wind direction, and wind speed [140]. To compare the ability of the UWG model and other models in generating urban microclimates at specific locations, relevant scholars have compared and verified the mainstream urban microclimate models from the perspective of the prediction accuracy of parameters such as temperature, humidity, and wind speed. For example, Michael Street et al. compared the ability of Bueno’s UWG model and Crawley’s temperature change (Morphing) scheme to generate urban microclimates at specific locations [116]. Milena Vuckovic et al. compared and analyzed the ability of three methods, namely, the Weather Forecast Model (WRF), the Urban Meteorological Generator (UWG), and the Morphing Model (Morphing), to generate urban meteorological data at specific locations, focusing on the prediction of air temperature, absolute humidity, and wind speed parameters. The results showed that the meteorological data predicted by the UWG model were closer to the actual monitoring data than those produced by the other two models. However, the UWG model can only predict air temperature and relative humidity. The prediction of this simplified weather file may limit the simulation of building thermal performance and the evaluation results of its environmental impact [135]. Table 6 summarizes the key differences in modeling techniques, inputs, and outputs of the following four models: WRF, UWG, Morphing, and CFD [57,58,141,142,143,144,145].

6.4. Building Energy Consumption

In the development of urban construction, architectural climatology studies the creation and improvement of the indoor environment, rarely considering the impact of the heat island effect on building energy consumption [109,118,146,147,148,149,150]. Most studies focus on urban climate change and rarely pay attention to the impact of urban textures such as building layout on climate [151]. The study of the relationship between indoor buildings and outdoor climates belongs to the scope of interdisciplinary research. When analyzing and evaluating the thermal environment of buildings and their energy consumption, hourly meteorological data on the area where the building is located is required. Due to the large differences in meteorological data in different years, it is not possible to simply use data from a certain year to simulate energy consumption [110,111,152]. At the architectural design level, typical meteorological year (TMY) data is generally used to evaluate the energy consumption of buildings, but TMY data usually comes from suburban meteorological stations, ignoring the impact of the surrounding environment of the building [153,154,155]. Building energy consumption is closely related to the local microclimate environment where the building is located. The heat island effect affects the energy performance of the building through changes in heat load and cooling load [107]. Usually, standardized weather files cannot fully represent the heat transfer phenomena in local areas, the morphology of specific locations, and anthropogenic heat emissions. Coupled with the complex and nonlinear interactions of surrounding urban structures and meteorological parameters [135], the use of weather data from rural or suburban meteorological stations for energy simulations has caused errors in the assessment of energy use, especially in hot climates [99]. At present, there are still few studies that consider the impact of UHIs in the early stages of building design, because there is a lack of direct and convenient methods for introducing these impacts into the estimation process of building energy consumption [156]. The lack of specific local climate data is one of the main limitations in accurately estimating the energy performance of buildings in urban environments. The urban microclimate has an increasing impact on urban buildings, energy, and sustainable development [157]. The quantitative prediction and evaluation of the impact of the urban microclimate on building energy consumption can provide an important scientific basis for urban planning and architectural design [154,155].
The UWG model involves a small amount of calculation and has a high efficiency. In the field of building performance analysis, by establishing an urban microclimate analysis model from the bottom up, the modified .epw weather file generated can be compatible with the BEM (building energy consumption simulation) [107]. As one of the initial input conditions of the building energy consumption analysis software, UWG simulation results can provide architects with a scientific basis for accurate building energy consumption evaluation through basic research on outdoor meteorological parameters in the early stage of building design [158], so as to conduct more accurate building energy consumption analysis. Relevant scholars often use UWG simulation to obtain urban microclimate results considering the heat island effect, and then couple these with building energy consumption simulation for analysis and research. To consider the urban heat island effect in building performance simulation, M. Palme et al. used four typical South American cities as urban scenes and used principal component analysis (PCA) to obtain reference urban organization categories for urban weather simulation. Based on the urban microclimate generated by the UWG at a specific block scale, the output results of the UWG were coupled with the building energy consumption simulation software TRNSYS for analysis and calculation. The results showed that more accurate building performance simulation could be performed after considering the heat island effect, and its building energy demand increased by 15–200% [146,147]. To comprehensively consider the effects of urban heat islands, shadows between buildings, infrared radiation exchange, and urban canyon wind speed should be evaluated in building energy consumption simulation, A. Salvati et al. proposed a chain strategy to use dynamic thermal simulation tools to calculate the urban boundary conditions required for simulation, in which the UWG was used to calculate the air temperature. The results showed that the annual energy demand of urban buildings depended on the regional climate. In cold climates, the annual energy demand was more related to shadows between urban buildings, and in temperate climates, the annual energy demand was more related to the intensity of heat islands [109]. Vincenzo Costanzo et al. compared and analyzed the impacts of different weather data sets and UWG deformed data sets on the dynamic energy simulation results for residential buildings in the city center of Catania, a city with a humid and hot climate in southern Italy [150]. Wenliang Li et al. used the urban weather generator (UWG) to generate local weather data based on existing hourly weather data and local physical parameters, used the UBEM to simulate Manhattan’s building energy use, and used the calibrated UBEM and local weather data to simulate the building energy consumption in Manhattan. The results showed that the area with the largest building energy consumption was the central Manhattan area, which is composed of a large number of commercial buildings [118].
The heat island effect caused by changes in urban density will lead to increased energy demand. In fact, as urban density increases, although a large number of people and buildings produce higher temperatures, the increase in urban density directly affects the sky visibility factor between buildings, resulting in reduced solar radiation and a lower canyon temperature. The analysis of the impact of changes in building density on building thermal performance and energy consumption performance is still one of the challenges in the field of building energy simulation. Agnese Salvati used uwg and EnergyPlus to study the combined effects of an increased heat island effect and reduced solar radiation. Uwg was used to generate weather files under specific urban structures, and EnergyPlus was used for later energy consumption analysis. The results showed that there was a strong correlation between building density and energy consumption demand. Within a certain range (a site coverage rate exceeding 0.5), urban structures with a higher building density were relatively more energy-efficient [110,111]. For hot-climate regions, Izabella Lima et al. deeply analyzed the impact of solar radiation on building energy performance based on the surface reflectivity and window-to-wall ratio of urban building materials and the changes in shading patterns provided by different urban geometric shapes. The impact of urban textures on building energy performance was studied by using the UWG to generate urban weather files that took into account climate change caused by the urban environment and using the EnergyPlus 2025to perform cooling demand energy simulation. The results showed that the impact of shading was more significant and the cooling load would be reduced in densely built buildings [152].

6.5. Human Thermal Comfort

Thermal comfort refers to a state of consciousness in which most people are physiologically and psychologically satisfied with the objective thermal environment (ASHRAE Standard 55) [103,159,160,161]. The comfort level of the indoor environment directly affects people’s mood and work efficiency. The indoor environment is an important part of the human living environment, including the thermal environment, air environment, sound environment, and light environment. The indoor thermal environment refers to people’s subjective feeling of indoor climate conditions, which has a more important and direct impact on the comfort of residents [162]. To accurately evaluate and calculate indoor thermal comfort, Gianpiero Evola et al. took an office building on the campus of the University of Catania in southern Italy as their research object and compared the impact of EnergyPlus meteorological data located at the airport and UWG deformed urban meteorological data on the building’s cooling and heating loads and indoor thermal comfort. The results showed that the calculation results of the UWG model increased the indoor temperature, and the influence of the heat island effect on indoor thermal comfort could be carefully considered [103].
The outdoor thermal environment directly affects the thermal comfort of the human body [137,163]. While outdoor thermal comfort research has seen substantial progress over the past two decades, its integration with microclimate models like the UWG remains in a nascent stage [164]. The main thermal comfort indicators used are physiological equivalent temperature (PET), the Universal Thermal Climate Index (UTCI), and Wet-Bulb Globe Temperature (WBGT). These indicators comprehensively consider climate factors, human activity status, and clothing thermal resistance, and are suitable for the evaluation of outdoor thermal comfort [165,166,167]. However, there is a lack of tools and methods in the field of building simulation to evaluate outdoor thermal comfort with a high temporal and spatial resolution accuracy. The key is how to comprehensively consider complex factors such as wind, sun, surface temperature, and urban heat island when simulating outdoor thermal comfort. As a microclimate quantification tool, the UWG can quickly obtain the microclimate environment of a certain urban area based on rural meteorological data, so as to be used in the field of urban outdoor thermal comfort research. For example, LEMERCIER Cyril simulated the effects of increasing solar albedo and increasing vegetation transpiration on urban temperature and humidity through the UWG, and explored the relationship between temperature and humidity changes and human thermal comfort [137]. Christopher Mackey et al. used the uwg plug-in of the Grasshopper software to modify the airport’s TMY weather data to obtain the city temperature, obtained the city wind speed based on CFD simulation, used the SolarCal model to calculate the sky heat exchange, and finally input the above-calculated air temperature, radiation temperature, humidity, and wind speed to obtain the outdoor UTCI. It was found that the key variables affecting outdoor thermal comfort were sky heat exchange, wind pattern, and heat island/ground temperature. This simulation was a relatively comprehensive study of the implementation method of microclimate-generated outdoor thermal comfort (UTCI), but because the data was transferred from one simulation engine to another, it means that the interaction between different climate factors could not be fully represented [163].

7. Existing Problems and Outlook

This paper reviews the current status of USTE research based on the UWG, mainly considering the following aspects: First, research on the UWG in application fields such as USTE simulation, building energy consumption analysis, and thermal comfort research is addressed. Second, UWG simulation of the USTE is described at the spatial and temporal scales, which is divided into the community scale and city scale in space and the daytime scale, daily scale, and monthly scale in time. Third, the relationship between anthropogenic heat emissions and UWG thermal environment simulation is discussed, that is, when applying the UWG, the anthropogenic heat value in specific seasons and regions should be considered. Fourth, the UWG simulation method is studied, and how to improve its simulation accuracy is discussed from the two perspectives of deterministic parameters and uncertain parameters. Finally, UWG coupling research is introduced consdering the coupling of earth observation technology and the coupling of the Grasshopper platform.
The review indicates that the UWG demonstrates the following two major advantages in USTE research: (1) efficient USTE calculations through coupling BEM-TEB modules to achieve building–climate interaction simulation [55,56,57] and (2) support for multi-temporal–spatial scale analysis (from hourly to monthly and from single buildings to urban agglomerations [16,100]). However, there are also several limitations, as follows: (1) Data quality and availability restrict the UWG’s simulation accuracy (e.g., fixed anthropogenic heat input values hardly reflect actual spatio-temporal dynamics [110]) and high computational demands at fine scales make model calculation costs challenging. (2) Insufficient verification data is the main bottleneck for UWG application. Currently, 62% of UWG studies have not been field-verified (literature statistics from 2010–2025) and especially lack comparative data under extreme climate conditions, limiting their practical applicability. (3) Insufficient model transferability, where simplifications of different humidity and wind direction parameters lead to increased simulation errors in subtropical cities [89]. (4) Inadequate empirical validation due to the lack of on-site verification with actual meteorological data, as well as the absence of adaptability tests for extreme climate events (such as heat waves) [135]. In the future, these bottlenecks need to be addressed through multi-source data assimilation and model coupling (e.g., WRF-UWG). Difficulties in accurately obtaining input parameters and the low simulation accuracy are the main problems, so we believe that future UWG research on simulating the USTE will focus on the following aspects:
(1) Studies incorporating sensitivity analyses of the key input parameters that affect the accuracy of UWG simulation have been conducted, but some parameters are only roughly input by looking up tables or specifications. Data quality and availability constraints limit the simulation accuracy of the UWG, such as difficulty in obtaining urban building parameter data, difficulty in calibrating meteorological parameter data, and the inability of fixed artificial heat input to represent the actual thermal environment. Microscale simulation has very high requirements for building geometric data (such as height, shape, and orientation), but the building data in the existing urban database is usually rough and struggles to meet the needs of refined simulation. The interaction between the wind field and the thermal field is very complex, such as the wind speed distribution and heat exchange process in the street canyon. A fixed anthropogenic heat constant cannot effectively reflect the temporal and spatial variations in anthropogenic heat emissions in a small area, which limits the simulation accuracy of the UWG. The existing UWG model may have the problem of oversimplification when dealing with these complex coupling problems. Accurately determining important input parameters will still be a research topic in the future. Improving simulation accuracy requires considering the accurate acquisition of deterministic parameters and the calibration of uncertain parameters to obtain higher-resolution key urban simulation inputs. Future research can consider using laser radar (LiDAR) and drone technology to obtain high-precision building geometric data to improve the accuracy of model input, such as the MIT East Campus planning case [101]. For wind field model optimization, CFD (computational fluid dynamics) methods can be combined to optimize the wind field simulation capability of the UWG model at the microscale. At the same time, the UWG can be combined with the resident behavior model to more strictly consider the impact of human activities on the thermal environment. Simulation accuracy can be further improved by quantifying the anthropogenic heating value as a function of the time period (such as the weekday/holiday pattern), introducing daily traffic heat emission data instead of the given constant value as an input, and using dynamically parameterized anthropogenic heating values for UWG simulation.
(2) The UWG model can make better predictions of urban temperature with lower computational requirements, reflecting the overall trend of urban temperature changes. However, urban morphology parameters and settings may not be universal across cities or climate zones, reducing the model’s transferability. UWG parameter settings have significant regional dependence. The prediction accuracy of this model will be improved in relatively homogeneous urban areas with a high building density and low vegetation coverage under low wind conditions [91,136]. How to better conduct simulation in an environment with high wind speeds and large differences in urban building types will become the direction of future research. A database of recommended parameter values for different local climate zones can be established to improve the universality of the model.
(3) The UWG does not consider the combined effects of solar radiation, temperature, and wind flow on the thermal environment. The impact of water bodies on the thermal environment is important, and these variables have not yet been included in relevant studies. Future research directions include how to improve the UWG’s universality of prediction under different underlying urban areas, optimize the latent heat exchange mechanism between the four modules, and consider the impacts of different types of underlying surfaces and wind speeds on the thermal environment near the simulation area [146,147].
(4) The UWG has high requirements for fine-scale calculations, and micro/mesoscale simulations have high computational costs due to geometric complexity. To improve computational efficiency, GPUs can be used to accelerate key computing modules (such as the VDM), develop multi-scale nested algorithms, and adopt “macro–micro” hierarchical modeling, such as using local climate zones (LCZs) to simplify parameters (assign building density by zone). However, the impact of UHIs in different climate zones combined with local climate zone (LCZ) assessment cannot fully express the pattern and intensity of the heat island effect, and it is difficult to capture the anthropogenic heat caused by human activities that are highly related to urban functional zones. In the future, the urban functional zone (UFZ) classification system can be coupled, where UFZs usually have similar spectral characteristics, socioeconomic functions, are composed of specific functions, and, therefore, have a similar energy consumption and outdoor thermal environment [32]. Evaluating the impact of UHIs on the energy consumption of various building types located in different climate zones can deepen the understanding of the USTE at a finer scale. At the same time, the UWG can be used for comprehensive analysis, such as a comprehensive analysis of solar radiation and the heat island effect expressed by the urban texture, indoor and outdoor thermal comfort analysis considering the heat island effect, and fine carbon emission calculation considering the heat island effect. In this way, energy performance analysis at the urban scale can be transformed into a design operation tool at the building scale, promoting the work of architects and urban planners in the field of urban renewal and energy efficiency. Quantitative research on the prediction and evaluation of building energy consumption under the trend of climate warming can also provide research support for low-energy optimization technologies for the sustainable development of buildings [158].
(5) The relationship between buildings and the urban climate is an extremely complex system. The UWG only simplifies the energy exchange relationship between the two. The current UWG assumes that urban weather interacts with rural weather through VDM-UBL, and the air in the UBL is simplified as a mixture in the control volume. In addition, the energy exchange between the UBL and UCL is also simplified to an adiabatic exchange combined with the exchange rate (or exchange coefficient). This simplified parameterization is indeed useful in the early design stage, but it is not enough for advanced analysis to deeply understand the system. In the future, parallel models can be added to the UWG architecture for different purposes. For example, VCWG modified the original VDM-UBLM-UCM scheme and coupled the two VDMs to simulate the interaction between rural and urban weather [168]. This treatment method describes more complex physical meanings and allows for more spatio-temporal estimates in urban canyons.
(6) In USTE simulation at the microscale, the resolution of meshing of the geometric model needs to be refined to the tiny areas. Through high-resolution data (such as building height, roof shape, and wall material) and meteorological data (such as solar radiation, wind direction, and wind speed), the UWG model can accurately simulate the thermal radiation of the building surface, wind speed changes, and local enhancement of the heat island effect. A major limitation of the UWG is the acquisition of relevant parameters when running simulations. Uncertainty parameters are often difficult to obtain or unknown to many potential users outside the field of urban climatology [134]. In terms of UWG model calibration, one direction for future research is to develop physics-based automatic calibration methods or Bayesian calibration methods to further improve UWG simulation results [89].
(7) UWG simulations focus more on conventional meteorology and lack analysis of extreme events such as heat waves and rainstorms. The UWG parameterizes urban energy exchange based on daily average meteorological conditions, but heat waves/rainstorms are accompanied by nonlinear processes (such as cloud radiation feedback and jet stream precipitation enhancement) and traditional models cannot capture mutations. Parameters such as building heat capacity and vegetation transpiration change dynamically under extreme conditions (such as saturated concrete heat storage during heat waves, which intensifies nighttime temperature rise), while the UWG defaults to them as constants. The difference between urban and rural meteorology is amplified during extreme events (such as the collapse of urban cooling efficiency during heat waves), and rural sites no longer represent the “background climate”. In the simulation of extreme weather events, a dynamic adjustment scheme for extreme parameters of typical events such as heat waves/rainstorms can be established and a module for the instantaneous impact of rainfall on surface heat flux can be added. The WRF mesoscale model and hydrological model (SWMM) can be coupled to simulate extreme scenarios, such as the WRF-UWG scheme [88]. Research on dynamic parameter optimization methods based on machine learning can be developed to improve the simulation capabilities of the UWG under complex terrain and extreme weather.

Author Contributions

Conceptualization, H.-Y.H. and L.H.; methodology, H.-Y.H.; software, X.-W.G.; validation, H.-Y.H., X.-W.G. and W.F.; formal analysis, H.-Y.H.; investigation, X.-W.G., H.-Y.H., L.H. and Q.X.; resources, X.-W.G.; data curation, X.-W.G.; writing—original draft preparation, H.-Y.H.; writing—review and editing, H.-Y.H., X.-W.G. and L.H.; visualization, X.-W.G.; supervision, H.-Y.H., Y.L., P.L. and M.-C.T.; project administration, H.-Y.H. and Y.L.; funding acquisition, L.H. All authors have read and agreed to the published version of the manuscript.

Funding

This research was funded by Tianjin Science and Technology Plan Project (22JCQNJC01420), National Key R&D Program of China (2021YFE0117300), The Major Project of High Resolution Earth Observation System (30-Y60B01-9003-22/23), the National Natural Science Foundation of China (41971306).

Conflicts of Interest

The authors declare no conflicts of interest.

Abbreviations

The following abbreviations are used in this manuscript:
USTEUrban Space Thermal Environment
UWGUrban Weather Generator
BEMEnergy Balance Model
UCMUrban Canopy Model
VDMVertical Diffusion Model
UBLUrban Boundary Layer
RSMRural Site Model

References

  1. Oke, T.R. The Heat Island of the Urban Boundary Layer: Characteristics, Causes and Effects. In Wind Climate in Cities; Cermak, J.E., Davenport, A.G., Plate, E.J., Viegas, D.X., Eds.; Springer: Dordrecht, The Netherlands, 1995; pp. 81–107. [Google Scholar]
  2. Nazarian, N.; Krayenhoff, E.; Bechtel, B.; Hondula, D.; Paolini, R.; Vanos, J.; Cheung, C.T.; Chow, W.; de Dear, R.; Jay, O.; et al. Integrated Assessment of Urban Overheating Impacts on Human Life. Earth’s Future 2022, 10, e2022EF002682. [Google Scholar] [CrossRef]
  3. Ren, J.; Yang, J.; Yu, W.; Cong, N.; Xiao, X.; Xia, J.; Li, X. Investigating the attribution of USTE changes under background climate and anthropogenic exploitation scenarios. Sustain. Cities Soc. 2024, 107, 105466. [Google Scholar] [CrossRef]
  4. Zhao, C.; Zhu, H.; Zhang, S.; Jin, Z.; Zhang, Y.; Wang, Y.; Shi, Y.; Jiang, J.; Chen, X.; Liu, M. Long–term trends in surface thermal environment and its potential drivers along the urban development gradients in rapidly urbanizing regions of China. Sustain. Cities Soc. 2024, 105, 105324. [Google Scholar] [CrossRef]
  5. Friesenecker, M.; Schneider, A.; Bügelmayer-Blaschek, M.; Getzner, M.; Hahn, C.; Schneider, M.; Seebauer, S.; Zawadzki, W.; Zuvela-Aloise, M.; Thaler, T. Socially equitable climate risk management of urban heat. npj Urban Sustain. 2025, 5, 8. [Google Scholar] [CrossRef]
  6. Voogt, J.; Oke, T. Thermal Remote Sensing of Urban Climates. Remote Sens. Environ. 2003, 86, 370–384. [Google Scholar] [CrossRef]
  7. Chen, T.; Ren, Z.; Fu, Y.; Liu, C. Correlation analysis of landscape patterns and USTE in Kunming based on a panel data model. Sci. Rep. 2024, 14, 27375. [Google Scholar] [CrossRef]
  8. Bai, Y.; Wang, W.; Liu, M.; Xiong, X.; Li, S. Impact of urban greenspace on the USTE: A case study of Shenzhen, China. Sustain. Cities Soc. 2024, 112, 105591. [Google Scholar] [CrossRef]
  9. Huo, H.-Y.; Tao, J.; Zhang, W.; Guo, L.; Leng, P.; Li, Z.-L. Urban 3D spatial thermal environment simulation and comparative analysis of Chinese ancient/modern typical garden based on CFD. Int. J. Remote Sens. 2023, 45, 7578–7604. [Google Scholar] [CrossRef]
  10. Huo, H.-Y.; Geng, X.; Zhang, W.; Guo, L.; Leng, P.; Li, Z.-L. Simulation of urban functional zone air temperature based on urban weather generator (UWG): A case study of Beijing, China. Int. J. Remote Sens. 2023, 45, 7095–7118. [Google Scholar] [CrossRef]
  11. Huo, H.-Y.; Chen, F. Study of effects of different vegetation model parameter settings on quantitative CFD simulation of urban spatial air temperature and wind-field. Int. J. Remote Sens. 2023, 45, 7234–7247. [Google Scholar] [CrossRef]
  12. Oke, T. Towards Better Scientific Communication in Urban Climate. Theor. Appl. Climatol. 2006, 84, 179–190. [Google Scholar] [CrossRef]
  13. Bherwani, H.; Singh, A.; Kumar, R. Assessment methods of urban microclimate and its parameters: A critical review to take the research from lab to land. Urban Clim. 2020, 34, 100690. [Google Scholar] [CrossRef]
  14. Adkins, K.; Akbaş, M.; Compere, M. Real-Time Urban Weather Observations for Urban Air Mobility. Int. J. Aviat. Aeronaut. Aerosp. 2020, 7, 11. [Google Scholar] [CrossRef]
  15. Romero Rodriguez, L.; Guerrero Delgado, M.; Castro Medina, D.; Ramos, J.; Álvarez, S. Forecasting urban temperatures through crowdsourced data from Citizen Weather Stations. Urban Clim. 2024, 56, 102021. [Google Scholar] [CrossRef]
  16. Kim, Y.; Still, C.; Roberts, D.; Goulden, M. Thermal infrared imaging of conifer leaf temperatures: Comparison to thermocouple measurements and assessment of environmental influences. Agric. For. Meteorol. 2018, 248, 361–371. [Google Scholar] [CrossRef]
  17. Krishnan, P.; Meyers, T.; Hook, S.; Heuer, M.; Senn, D.; Dumas, E. Intercomparison of In Situ Sensors for Ground-Based Land Surface Temperature Measurements. Sensors 2020, 20, 5268. [Google Scholar] [CrossRef]
  18. Li, Z.-L.; Becker, F. Feasibility of land surface temperature and emissivity determination from AVHRR data. Remote Sens. Environ. 1993, 43, 67–85. [Google Scholar] [CrossRef]
  19. Childs, P.R.N.; Greenwood, J.R.; Long, C.A. Review of temperature measurement. Rev. Sci. Instrum. 2000, 71, 2959–2978. [Google Scholar] [CrossRef]
  20. Wang, K.; Wan, Z.; Wang, P.; Sparrow, M.; Liu, J.; Zhou, X.; Haginoya, S.; Wang, C. Estimation of surface long wave radiation and broadband emissivity using Moderate Resolution Imaging Spectroradiometer (MODIS) land surface temperature/emissivity products. J. Geophys. Res. 2005, 110, D11109. [Google Scholar] [CrossRef]
  21. Li, Z.-L.; Li, Y.; Ge, J.; Wu, H.; Tang, R.; Cheng, Y.; Liu, X.; Wang, Y.; Si, M.; Zhao, W.; et al. Recent climate change strengthens the local cooling of European forests. Res. Sq. 2024. [Google Scholar] [CrossRef]
  22. Li, Z.-L.; Si, M.; Liu, X.; Li, Y.; Leng, P.; Tang, R.; Duan, S.-B.; Liu, M.; Zhou, C. Forest and non-forest demonstrate comparable biophysical temperature effects but distinct asymmetry patterns during cropland conversion. Res. Sq. 2024. [Google Scholar] [CrossRef]
  23. Li, Z.-L.; Wu, H.; Duan, S.-B.; Zhao, W.; Liu, X.; Leng, P.; Tang, R.; Ye, X.; Zhu, J.; Sun, Y.; et al. Satellite Remote Sensing of Global Land Surface Temperature: Definition, Methods, Products, and Applications. Rev. Geophys. 2023, 61, e2022RG000777. [Google Scholar] [CrossRef]
  24. Duan, S.-B.; Zhou, S.; Li, Z.-L.; Liu, X.; Chang, S.; Liu, M.; Huang, C.; Zhang, X.; Shang, G. Improving monthly mean land surface temperature estimation by merging four products using the generalized three-cornered hat method and maximum likelihood estimation. Remote Sens. Environ. 2024, 302, 113989. [Google Scholar] [CrossRef]
  25. Litardo, J.; Palme, M.; Borbor-Cordova, M.J.; Caiza-Quinga, R.; Macias-Zambrano, J.; Hidalgo-Leon, R.; Soriano, G. Urban Heat Island intensity and buildings’ energy needs in Duran, Ecuador: Simulation studies and proposal of mitigation strategies. Sustain. Cities Soc. 2020, 62, 102387. [Google Scholar] [CrossRef]
  26. Caboussat, A.; Hess, J.; Masserey, A.; Picasso, M. Numerical simulation of temperature-driven free surface flows, with application to laser melting and polishing. J. Comput. Phys. X 2023, 17, 100127. [Google Scholar] [CrossRef]
  27. Volvach, A.; Kurbasova, G.; Volvach, L. Analysis and numerical simulation of temperature measurements made on earth and from space. Heliyon 2023, 9, e12999. [Google Scholar] [CrossRef]
  28. Pan, Z.; Zhao, W.; Wang, H. Comparative study on numerical simulation of temperature field of farm house with different roof forms. Sci. Rep. 2024, 14, 7772. [Google Scholar] [CrossRef]
  29. Liu, Z.; Cheng, K.Y.; He, Y.; Jim, C.Y.; Brown, R.D.; Shi, Y.; Lau, K.; Ng, E. Microclimatic measurements in tropical cities: Systematic review and proposed guidelines. Build. Environ. 2022, 222, 109411. [Google Scholar] [CrossRef]
  30. Gao, K.; Feng, J.; Yao, L.; Lau, K.; Ng, E. Ensuring accurate microclimate research: How to select representative meteorological data of local climate in microclimate studies. Build. Environ. 2025, 267, 112166. [Google Scholar] [CrossRef]
  31. Yuan, Y.; Xi, C.; Jing, Q. Research progress of urban surface thermal environment. Chin. J. Ecol. 2018, 38, 1134–1147. [Google Scholar]
  32. Dong, L.; Pan, J.; Wang, W.; Feng, Y. Spatiotemporal Pattern of Summer Thermal Field and Its Relationship with Land Cover in Lanzhou Based on RS and GWR. Soils 2018, 50, 404–413. [Google Scholar]
  33. Jimenez-Munoz, J.C.; Cristobal, J.; Sobrino, J.A.; Soria, G.; Ninyerola, M.; Pons, X. Revision of the Single-Channel Algorithm for Land Surface Temperature Retrieval From Landsat Thermal-Infrared Data. IEEE Trans. Geosci. Remote Sens. 2009, 47, 339–349. [Google Scholar] [CrossRef]
  34. Qin, Z.; Karnieli, A.; Berliner, P. A mono-window algorithm for retrieving land surface temperature from Landsat TM data and its application to the Israel-Egypt border region. Int. J. Remote Sens. 2001, 22, 3719–3746. [Google Scholar] [CrossRef]
  35. Jiménez-Muñoz, J.C.; Sobrino, J.A.; Skoković, D.; Mattar, C.; Cristóbal, J. Land Surface Temperature Retrieval Methods From Landsat-8 Thermal Infrared Sensor Data. IEEE Geosci. Remote Sens. Lett. 2014, 11, 1840–1843. [Google Scholar] [CrossRef]
  36. Gillespie, A.; Rokugawa, S.; Matsunaga, T.; Cothern, J.S.; Hook, S.; Kahle, A.B. A temperature and emissivity separation algorithm for Advanced Spaceborne Thermal Emission and Reflection Radiometer (ASTER) images. IEEE Trans. Geosci. Remote Sens. 1998, 36, 1113–1126. [Google Scholar] [CrossRef]
  37. Toparlar, Y.; Blocken, B.; Maiheu, B.; van Heijst, G.J.F. A review on the CFD analysis of urban microclimate. Renew. Sustain. Energy Rev. 2017, 80, 1613–1640. [Google Scholar] [CrossRef]
  38. Ooka, R. Recent development of assessment tools for urban climate and heat-island investigation especially based on experiences in Japan. Int. J. Climatol. A J. R. Meteorol. Soc. 2007, 27, 1919–1930. [Google Scholar] [CrossRef]
  39. Huo, H.-Y.; Chen, F.; Xiaowei, G.; Tao, J.; Liu, Z.; Zhang, W.; Leng, P. Simulation of the USTE Based on Computational Fluid Dynamics: A Comprehensive Review. Sensors 2021, 21, 6898. [Google Scholar] [CrossRef]
  40. Back, Y.; Kumar, P.; Bach, P.M.; Rauch, W.; Kleidorfer, M. Integrating CFD-GIS modelling to refine urban heat and thermal comfort assessment. Sci. Total Environ. 2023, 858, 159729. [Google Scholar] [CrossRef]
  41. Coirier, W.J.; Fricker, D.M.; Furmanczyk, M.; Kim, S. A Computational Fluid Dynamics Approach for Urban Area Transport and Dispersion Modeling. Environ. Fluid Mech. 2005, 5, 443–479. [Google Scholar] [CrossRef]
  42. Hanna, S.R.; Hansen, O.R.; Dharmavaram, S. FLACS CFD air quality model performance evaluation with Kit Fox, MUST, Prairie Grass, and EMU observations. Atmos. Environ. 2004, 38, 4675–4687. [Google Scholar] [CrossRef]
  43. Huber, A.H. A FRAMEWORK FOR FINE-SCALE COMPUTATIONAL FLUID DYNAMICS AIR QUALITY MODELING AND ANALYSIS. In Proceedings of the 5th Annual CMAS Models-3 User’s Conference, Chapel Hill, NC, USA, 16–18 October 2006. [Google Scholar]
  44. Calhoun, R.; Gouveia, F.; Shinn, J.; Chan, S.; Stevens, D.; Lee, R.; Leone, J. Flow around a Complex Building: Experimental and Large-Eddy Simulation Comparisons. J. Appl. Meteorol. 2005, 44, 571–590. [Google Scholar] [CrossRef]
  45. Camelli, F.; Hanna, S.R.; Löhner, R. Simulation of the MUST Field Experiment Using the FEFLURBAN CFD Model. In Proceedings of the Fifth Symposium on the Urban Environment, Vancouver, BC, Canada, 23–26 August 2004; American Meteorological Society: Boston, MA, USA; Volume 13. [Google Scholar]
  46. Tewari, M.; Kusaka, H.; Coirier, W.; Kim, S.; Warner, T. Impact of coupling a microscale computational fluid dynamics model with a mesoscale model on urban scale contaminant transport and dispersion. Atmos. Res. 2010, 96, 656–664. [Google Scholar] [CrossRef]
  47. Feng, X. Fundamental Studies on the Influences of Rainfall on Urbanmicroclimate in Hot-Humid Region. Ph.D. Thesis, South China University of Technology, Guangzhou, China, 2020. [Google Scholar]
  48. Mei, S.-J.; Hang, J.; Fan, Y.; Yuan, C.; Xue, Y. CFD simulations on the wind and thermal environment in urban areas with complex terrain under calm conditions. Sustain. Cities Soc. 2025, 118, 106022. [Google Scholar] [CrossRef]
  49. Loridan, T.; Grimmond, S.; Offerle, B.; Young, D.; Smith, T.; Järvi, L.; Lindberg, F. Local-Scale Urban Meteorological Parameterization Scheme (LUMPS): Longwave Radiation Parameterization and Seasonality-Related Developments. J. Appl. Meteorol. Climatol. 2011, 50, 185–202. [Google Scholar] [CrossRef]
  50. Ward, H.; Kotthaus, S.; Järvi, L.; Grimmond, S. Surface Urban Energy and Water Balance Scheme (SUEWS): Development and evaluation at two UK sites. Urban Clim. 2016, 18, 1–32. [Google Scholar] [CrossRef]
  51. Lemonsu, A.; Grimmond, S.; Masson, V. Modeling the Surface Energy Balance of the Core of an Old Mediterranean City: Marseille. J. Appl. Meteorol. 2004, 43, 312–327. [Google Scholar] [CrossRef]
  52. Kusaka, H.; Bornstein, R.; Ching, J.; Grimmond, S.; Grossman-Clarke, S.; Loridan, T.; Manning, K.; Martilli, A.; Miao, S.; Sailor, D.; et al. The integrated WRF/urban modelling system: Development, evaluation, and applications to urban environmental problems. Int. J. Climatol. 2011, 31, 273–288. [Google Scholar] [CrossRef]
  53. Martilli, A.; Clappier, A.; Rotach, M. An Urban Surface Exchange Parameterisation for Mesoscale Models. Bound.-Layer Meteorol. 2002, 104, 261–304. [Google Scholar] [CrossRef]
  54. Grimmond, S.; Blackett, M.; Best, M.; Barlow, J.; Baik, J.; Belcher, S.E.; Bohnenstengel, S.; Calmet, I.; Dandou, A.; Fortuniak, K.; et al. The International Urban Energy Balance Models Comparison Project: First Results from Phase 1. J. Appl. Meteorol. Climatol. 2010, 49, 1268–1292. [Google Scholar] [CrossRef]
  55. Bueno, B. An Urban Weather Generator Coupling a Building Simulation Program with an Urban Canopy Model. Master’s Thesis, Massachusetts Institute of Technology, Cambridge, MA, USA, 2010. [Google Scholar]
  56. Bueno, B.; Norford, L.; Britter, R. An urban weather generator coupling building simulations with a physically based urban model. In Proceedings of the 7th International Conference on Urban Climate (ICUC-7), Yokohama, Japan, 29 June–3 July 2009. [Google Scholar]
  57. Bueno, B.; Norford, L.; Hidalgo, J.; Pigeon, G. The urban weather generator. J. Build. Perform. Simul. 2013, 6, 269–281. [Google Scholar] [CrossRef]
  58. Bueno, B. Study and Prediction of the Energy Interactions Between Buildings and the Urban Climate. Ph.D. Thesis, Massachusetts Institute of Technology, Cambridge, MA, USA, 2013. [Google Scholar]
  59. Bueno, B.; Roth, M.; Norford, L.; Li, R. Computationally efficient prediction of canopy level urban air temperature at the neighbourhood scale. Urban Clim. 2014, 9, 35–53. [Google Scholar] [CrossRef]
  60. Mao, J.; Norford, L. Urban Weather Generator: Physics-Based Microclimate Simulation for Performance-Oriented Urban Planning; Springer: Cham, Switzerland, 2021; pp. 241–263. [Google Scholar]
  61. Xu, G.; Li, J.; Shi, Y.; Feng, X.; Zhang, Y. Improvements, extensions, and validation of the Urban Weather Generator (UWG) for performance-oriented neighborhood planning. Urban Clim. 2022, 45, 101247. [Google Scholar] [CrossRef]
  62. Bezha, K. Scaling of Urban Heat Island Simulation: Validation of the Urban Weather Generator for Varying Boundaries. Bachelor’s Thesis, TUM School of Engineering and Design der Technischen Universität München, München, Germany, 2024. [Google Scholar]
  63. Hashemi, F.; Salahi, N.; Ghiasi, S.; Passe, U. Comparative Analysis of Urban Heat Island Effects on Building Energy Consumption in the U.S. Midwest A Combined Workflow Using Urban Weather Generator and Future Typical Meteorological Year Climate Scenarios; Wrocław University of Science and Technology Publishing House: Wrocław, Poland, 2024. [Google Scholar]
  64. Elmagri, H.; Kamel, T.M.; Ozer, H. Assessment of the Effectiveness of Cool Pavements on Outdoor Thermal Environment in Urban Areas. Build. Environ. 2024, 266, 112095. [Google Scholar] [CrossRef]
  65. Shen, P.; Liu, J.; Wang, M. Fast generation of microclimate weather data for building simulation under heat island using map capturing and clustering technique. Sustain. Cities Soc. 2021, 71, 102954. [Google Scholar] [CrossRef]
  66. Hamdi, H.; Roupioz, L.; Corpetti, T.; Briottet, X. Evaluation of the Urban Weather Generator on the city of Toulouse (France). Appl. Sci. 2023, 14, 185. [Google Scholar] [CrossRef]
  67. Hirano, Y.; Ichinose, T.; Ohashi, Y.; Shiraki, Y.; Onishi, A.; Yoshida, Y. Simula tion of urban surface temperature and surface heat balance in the Tokyo metropolitan area. Sustain. Cities Soc. 2024, 112, 105596. [Google Scholar] [CrossRef]
  68. Xiao, K.; Xu, H. RS and GIS-based analysis of urban heat island effect in Shanghai. In Proceedings of the 2010 18th International Conference on Geoinformatics, Beijing, China, 18–20 June 2010; pp. 1–5. [Google Scholar]
  69. Mushore, T.D.; Dube, T.; Manjowe, M.; Gumindoga, W.; Chemura, A.; Rousta, I.; Odindi, J.; Mutanga, O. Remotely sensed retrieval of Local Climate Zones and their linkages to land surface temperature in Harare metropolitan city, Zimbabwe. Urban Clim. 2019, 27, 259–271. [Google Scholar] [CrossRef]
  70. Bande, L.; Afshari, A.; Masri, D.; Jha, M.; Norford, L.; Tsoupos, A.; Marpu, P.; Pasha, Y.; Armstrong, P. Validation of UWG and ENVI-met models in an Abu Dhabi District, based on site measurements. Sustainability 2019, 11, 4378. [Google Scholar] [CrossRef]
  71. Zhou, K.; Zhong, L.; Wang, Z.; Liu, J.; Wu, Z. Evaluating the impacts of land use/land cover changes and climate variations on urban heat islands using the WRF-UCM model in Hefei, China. Clim. Change 2024, 177, 121. [Google Scholar] [CrossRef]
  72. Diaz, L.; Melendez, R.; Arregocés, H.A. Urban heat island intensity in coastal cities of northern Colombia using Landsat data and WRF/UCM model. Case Stud. Chem. Environ. Eng. 2024, 9, 100617. [Google Scholar] [CrossRef]
  73. Zhu, Y.; Liu, J.; Aya, H.; Jun, T. Extension and Validation of Urban Canopy Model. Build. Sci. 2007, 2, 84–87. [Google Scholar] [CrossRef]
  74. Setyantho, G.; Yuan, C.; Heo, Y. Evaluation of multi-layer urban canopy model (MLUCM) for urban microclimate predictions at different urban contexts. Urban Clim. 2024, 55, 101882. [Google Scholar] [CrossRef]
  75. Pappaccogli, G.; Zonato, A.; Martilli, A.; Buccolieri, R.; Lionello, P. MLUCM BEP+BEM: An offline one-dimensional Multi-Layer Urban Canopy Model based on the BEP+BEM Scheme. EGUsphere 2025, preprint. [Google Scholar] [CrossRef]
  76. Kondo, H. Heating in the Urban Canopy by Anthropogenic Energy Use. In Proceedings of the International Congress of Biometeorology & International Conference on Urban Climatology, Sydney, Australia, 8–12 November 1999. [Google Scholar]
  77. Afshari, A.; Ramirez, N. Improving the accuracy of simplified urban canopy models for arid regions using site-specific prior information. Urban Clim. 2020, 35, 100722. [Google Scholar] [CrossRef]
  78. Schoetter, R.; Hogan, R.; Caliot, C.; Masson, V. Coupling the urban canopy model TEB (SURFEXv9.0) with the radiation model SPARTACUS-Urbanv0.6.1 for more realistic urban radiative exchange calculation. Geosci. Model Dev. 2025, 18, 405–431. [Google Scholar] [CrossRef]
  79. Chen, H.; Top, S.; Hamdi, R.; Caluwaerts, S. Interaction between Urban Heat Island and Sea-Breeze: A focus on Shanghai. In Proceedings of the EGU General Assembly 2024, Vienna, Austria, 14–19 April 2024. [Google Scholar]
  80. Masson, V. A Physically-Based Scheme For The Urban Energy Budget In Atmospheric Models. Bound.-Layer Meteorol. 2000, 94, 357–397. [Google Scholar] [CrossRef]
  81. Wang, Y.; Wang, K.; Chen, L.; Zhang, L. Simulation study on the influence of air conditioning system on urban atmospheric temperature. Chin. J. Meteorol. 2018, 76, 649–662. [Google Scholar] [CrossRef]
  82. Segura-Barrero, R.; Badia, A.; Ventura, S.; Gilabert, J.; Martilli, A.; Villalba, G. Sensitivity study of PBL schemes and soil initialization using the WRF-BEP-BEM model over a Mediterranean coastal city. Urban Clim. 2021, 39, 100982. [Google Scholar] [CrossRef]
  83. Alhammad, M.; Eames, M.; Vinai, R. Enhancing Building Energy Efficiency through Building Information Modeling (BIM) and Building Energy Modeling (BEM) Integration: A Systematic Review. Buildings 2024, 14, 581. [Google Scholar] [CrossRef]
  84. Guo, H.; Chen, Z.; Chen, X.; Yang, J.; Song, C.; Chen, Y. UAV-BIM-BEM: An automatic unmanned aerial vehicles-based building energy model generation platform. Energy Build. 2024, 328, 115120. [Google Scholar] [CrossRef]
  85. Kun, X. Simulation and Analysis of Refined Meteorological Field in Chengdu Based on Urban Canopy Model. Master’s Thesis, Chengdu University of Information Engineering, Chengdu, China, 2019. [Google Scholar]
  86. Meng, W.; Zhang, Y.; Dai, D.; Li, H. The “Urban Heat Island” Effect and Numerical Research on Its Impact on High Temperature Weather. In Proceedings of the 2008 Annual Meeting of the Chinese Meteorological Society, Beijing, China, 19–22 November 2008; p. 11. [Google Scholar]
  87. Salehipour, F.; Maracchini, G.; Di Giuseppe, E.; D’Orazio, M. Impact of Urban Morphology on Urban Heat Island Intensity in a Mediterranean City: Global Sensitivity and Uncertainty Analysis. In Green Energy and Technology; Springer: Cham, Switzerland, 2023; pp. 129–137. [Google Scholar]
  88. Bilang, R.G.J.; Blanco, A.; Santos, A.; Olaguera, L. Simulation of Urban Heat Island during a High-Heat Event Using WRF Urban Canopy Models: A Case Study for Metro Manila. Atmosphere 2022, 13, 1658. [Google Scholar] [CrossRef]
  89. Mao, J. Automatic Calibration of an Urban Microclimate Model Under Uncertainty. Master’s Thesis, Tongji University, Shanghai, China, 2018. [Google Scholar]
  90. Yang, J.H. The Curious Case of Urban Heat Island: A Systems Analysis. Master’s Thesis, Massachusetts Institute of Technology, Cambridge, MA, USA, 2016. [Google Scholar]
  91. Salvati, A.; Roura, H.; Cecere, C. Urban heat island prediction in the mediterranean context: An evaluation of the urban weather generator model. ACE Archit. City Environ. 2016, 11, 135–156. [Google Scholar] [CrossRef]
  92. Wang, W.; Li, S.; Siyi, G.; Ma, M.; Feng, S.; Bao, L. Benchmarking Urban Local Weather with Long-Term Monitoring Compared with Weather Datasets from Climate Station and EnergyPlus Weather (EPW) Data. Energy Rep. 2021, 7, 6501–6514. [Google Scholar] [CrossRef]
  93. Palme, M.; Carrasco, C.; Lobato-Cordero, A. Quantitative Analysis of Factors Contributing to Urban Heat Island Effect in Cities of Latin-American Pacific Coast. Procedia Eng. 2016, 169, 199–206. [Google Scholar] [CrossRef]
  94. Alchapar, N.; Correa, E.; Pezzuto, C.; Salvati, A. Evaluación del modelo Urban Weather Generator en clima árido y tropical: Aplicaciones en Mendoza, Argentina y Campina, Brasil. In Proceedings of the VI Congreso Latinoamericano de Simulación de Edificios, 17 October 2019. [Google Scholar]
  95. Alchapar, N.; Pezzuto, C.; Correa, E.; Salvati, A. Thermal performance of the Urban Weather Generator model as a tool for planning sustainable urban development. Geogr. Pannonica 2019, 23, 374–384. [Google Scholar] [CrossRef]
  96. Bröde, P.; Blazejczyk, K.; Fiala, D.; Havenith, G.; Holmér, I.; Jendritzky, G.; Kuklane, K.; Kampmann, B. The Universal Thermal Climate Index UTCI Compared to Ergonomics Standards for Assessing the Thermal Environment. Ind. Health 2013, 51, 16–24. [Google Scholar] [CrossRef]
  97. Wieczorek, J.; Bochenek, B.; Strzyżewski, T.; Hajto, M.; Sekuła, P.; Bokwa, A.; Zimnoch, M. Daily heat stress in kraków in the warm period 2012–2022 based on hourly meteorological measurements and radiative fluxes derived from satellite systems. Acta Geogr. Lodz. 2024, 117, 121–133. [Google Scholar] [CrossRef]
  98. Hidalgo García, D.; Founda, D.; Rezapouraghdam, H. Spatiotemporal variability of the Universal Thermal Climate Index during heat waves using the UrbClim climate model: Implications for tourism destinations. Urban Clim. 2025, 59, 102281. [Google Scholar] [CrossRef]
  99. Liu, H.; Huang, B.; Gao, S.; Wang, J.; Yang, C.; Li, R. Impacts of the evolving urban development on intra-urban surface thermal environment: Evidence from 323 Chinese cities. Sci. Total Environ. 2021, 771, 144810. [Google Scholar] [CrossRef]
  100. Salvati, A.; Monti, P.; Roura, H.; Cecere, C. Climatic performance of urban textures: Analysis tools for a Mediterranean urban context. Energy Build. 2019, 185, 162–179. [Google Scholar] [CrossRef]
  101. Nakano, A. Urban weather generator user interface development: Towards a usable tool for integrating urban heat island effect within urban design process. In Proceedings of the IGARSS 2014, Quebec, QC, Canada, 13–18 July 2014. [Google Scholar]
  102. Budzik, G.; Sylla, M.; Kowalczyk, T. Understanding Urban Cooling of Blue–Green Infrastructure: A Review of Spatial Data and Sustainable Planning Optimization Methods for Mitigating Urban Heat Islands. Sustainability 2024, 17, 142. [Google Scholar] [CrossRef]
  103. Evola, G.; Costanzo, V.; Marletta, L. Exergy Analysis of Energy Systems in Buildings. Buildings 2018, 8, 180. [Google Scholar] [CrossRef]
  104. Calice, C.; Clemente, C.; Salvati, A.; Palme, M.; Inostroza, L. Urban Heat Island Effect on the Energy Consumption of Institutional Buildings in Rome. IOP Conf. Ser. Mater. Sci. Eng. 2017, 245, 082015. [Google Scholar] [CrossRef]
  105. Moradi, A.; Kavgic, M.; Costanzo, V.; Evola, G. Impact of typical and actual weather years on the energy simulation of buildings with different construction features and under different climates. Energy 2023, 270, 126875. [Google Scholar] [CrossRef]
  106. Quan, S.J.; Wu, J.; Wang, Y.; Shi, Z.; Yang, T.; Yang, P.P.-J. Urban Form and Building Energy Performance in Shanghai Neighborhoods. Energy Procedia 2016, 88, 126–132. [Google Scholar] [CrossRef]
  107. Hashemi, F.; Poerschke, U.; Iulo, L. A Novel Approach for Investigating Canopy Heat Island Effects on Building Energy Performance: A Case Study of Center City of Philadelphia, PA. In Proceedings of the 2020 AIA/ACSA Intersections Research Conference, Philadelphia, PA, USA, 1–3 October 2020. [Google Scholar]
  108. Ma, R.; Ren, B.; Zhao, D.; Chen, J.; Lu, Y. Modeling urban energy dynamics under clustered urban heat island effect with local-weather extended distributed adjacency blocks. Sustain. Cities Soc. 2020, 56, 102099. [Google Scholar] [CrossRef]
  109. Salvati, A.; Palme, M.; Chiesa, G.; Kolokotroni, M. Built form, urban climate and building energy modelling: Case-studies in Rome and Antofagasta. J. Build. Perform. Simul. 2020, 13, 209–225. [Google Scholar] [CrossRef]
  110. Salvati, A.; Palme, M.; Inostroza, L. Key Parameters for Urban Heat Island Assessment in A Mediterranean Context: A Sensitivity Analysis Using the Urban Weather Generator. IOP Conf. Ser. Mater. Sci. Eng. 2017, 245, 082055. [Google Scholar] [CrossRef]
  111. Salvati, A.; Roura, H.; Morganti, M. Effects of urban compactness on the building energy performance in a Mediterranean climate—CISBAT2017 Poster Presentation. In Proceedings of the CISBAT 2017, Lausanne, Switzerland, 6–8 September 2017. [Google Scholar]
  112. Li, D.; Bou-Zeid, E.; Oppenheimer, M. The effectiveness of cool and green roofs as urban heat island mitigation strategies. Environ. Res. Lett. 2014, 9, 055002. [Google Scholar] [CrossRef]
  113. Ding, X.; Zhao, Y.; Strebel, D.; Fan, Y.; Ge, J.; Carmeliet, J. A WRF-UCM-SOLWEIG framework for mapping thermal comfort and quantifying urban climate drivers: Advancing spatial and temporal resolutions at city scale. Sustain. Cities Soc. 2024, 112, 105628. [Google Scholar] [CrossRef]
  114. Kamal, A.; Abidi, S.; Mahfouz, A.; Hassan, I.; Wang, L. Impact of Urban Morphology on Urban Microclimate and Building Energy Loads. Energy Build. 2021, 253, 111499. [Google Scholar] [CrossRef]
  115. Boccalatte, A.; Fossa, M.; Gaillard, L.; Ménézo, C. Microclimate and Urban Morphology Effects on Building Energy Demand in Different European Cities. Energy Build. 2020, 224, 110129. [Google Scholar] [CrossRef]
  116. Street, M.; Reinhart, C.; Norford, L.; Ochsendorf, J. Urban heat island in boston—An evaluation of urban airtemperature models for predicting building energy use. In Proceedings of the BS 2013: 13th Conference of the International Building Performance Simulation Association, Chambery, France, 25–28 August 2013; pp. 1022–1029. [Google Scholar]
  117. Pacifici, M. Urban Morphology and Climate: Field Assessment and Numerical Modeling of Interactions. Ph.D. Thesis, Universidade de São Paulo, São Paulo, Brazil, 2019. [Google Scholar]
  118. Li, W. Quantifying the Building Energy Dynamics of Manhattan, New York City, Using an Urban Building Energy Model and Localized Weather Data. Energies 2020, 13, 3244. [Google Scholar] [CrossRef]
  119. Mao, J.; Yang, J.; Afshari, A.; Norford, L. Global sensitivity analysis of an urban microclimate system under uncertainty: Design and case study. Build. Environ. 2017, 124, 153–170. [Google Scholar] [CrossRef]
  120. Palme, M.; Salvati, A. Including Weather Data Morphing and Other Urban Effects in Energy Simulations; Routledge: Oxford, UK, 2021. [Google Scholar]
  121. Pezzuto, C.; Alchapar, N.; Correa, E. Urban cooling technologies potential in high and low buildings densities. Sol. Energy Adv. 2022, 2, 100022. [Google Scholar] [CrossRef]
  122. Hammerberg, K.; Vuckovic, M.; Mahdavi, A. Approaches to Urban Weather Modeling: A Vienna Case Study. Appl. Mech. Mater. 2019, 887, 344–352. [Google Scholar] [CrossRef]
  123. Santos, L.G.R.; Afshari, A.; Norford, L.K.; Mao, J. Evaluating approaches for district-wide energy model calibration considering the Urban Heat Island effect. Appl. Energy 2018, 215, 31–40. [Google Scholar] [CrossRef]
  124. Bei, H. The Impact of Changes in the Temporal and Spatial Distribution of Anthropogenic Heat on Urban Local Climate and Its Mechanism. Ph.D. Thesis, Tsinghua University, Beijing, China, 2019. [Google Scholar]
  125. Zhiyong, R. Study on the influence of anthropogenic heat on the urban boundary layer structure. In Proceedings of the 27th Annual Meeting of the China Meteorological Society, Urban Meteorology, Better Life, Beijing, China, 21 October 2010; p. 10. [Google Scholar]
  126. Chunlei, M. Review of Numerical Simulation Research on Urban Land Surface Characteristics. Adv. Meteorol. Sci. Technol. 2014, 29, 464–474. [Google Scholar]
  127. Jiahui, L.; Xiaofeng, Z.; Jianyi, L. Analysis of Anthropogenic Heat Emissions in the Urban Functional Zone of Xiamen Island Based on Surface Energy Balance. J. Geoinform. 2018, 20, 1026–1036. [Google Scholar]
  128. Wangming, Y.; Chong, J.; Xiaoyong, Y.; Xuefeng, C. Anthropogenic Heat Estimation and Effect Research in the Context of Climate Change. Adv. Geogr. 2014, 33, 1029–1038. [Google Scholar]
  129. Quah, A.; Roth, M. Diurnal and weekly variation of anthropogenic heat emissions in a tropical city, Singapore. Atmos. Environ. 2012, 46, 92–103. [Google Scholar] [CrossRef]
  130. Luo, Y. Study on the Estimation of Spatiotemporal Distribution of Anthropogenic Heat Emission in Qinhuai District of Nanjing Based on Inventory Survey Method; Nanjing University of Information Science and Technology: Nanjing, China, 2018. [Google Scholar]
  131. Yu, Z.; Jing, Y.; Yang, G.; Sun, R. A New Urban Functional Zone-Based Climate Zoning System for Urban Temperature Study. Remote Sens. 2021, 13, 251. [Google Scholar] [CrossRef]
  132. Yi, W.; Lisha, L. Research on the Coupling of Thermal Comfort and Behavior Based on ArcGIS Platform: A Case Study of Three Block-style Commercial Complexes in the Central Urban Area of Shanghai. Hous. Sci. 2018, 38, 27–34. [Google Scholar]
  133. Liu, Y. Research on Automatic Optimization Method of Urban Form in Cold Regions Based on Microclimate Performance. Master’s thesis, Southeast University, Nanjing, China, 2018. [Google Scholar]
  134. Awino, H. Design-Integrated Urban Heat Island Analysis Tool and Workflow: Development and Application. Master’s Thesis, Massachusetts Institute of Technology, Cambridge, MA, USA, 2019. [Google Scholar]
  135. Vuckovic, M.; Hammerberg, K.; Mahdavi, A. Urban weather modeling applications: A Vienna case study. Build. Simul. 2019, 13, 99–111. [Google Scholar] [CrossRef]
  136. Salvati, A.; Roura, H.; Cecere, C. Urban morphology and energy performance: The direct and indirect contribution in mediterranean climate. In Proceedings of the PLEA2015, Bologna, Italy, 9–11 September 2015. [Google Scholar]
  137. Lemercier, C.A.G. Sensitivity Analysis of Urban Heat Island Parameters Based on Urban Weather Generator Model. Master’s Thesis, UCrea Académico, Santander, Spain, 2019. [Google Scholar]
  138. Bueno, B.; Pigeon, G.; Norford, L.; Zibouche, K. Development and evaluation of a building energy model integrated in the TEB scheme. Geosci. Model Dev. Discuss. 2011, 4, 2973–3011. [Google Scholar] [CrossRef]
  139. Liu, J.; Shen, L.; Huang, Y.; Deng, X. Study on the spatial differentiation characteristics of Beijing’s nighttime heat island intensity based on local climate zoning. Geogr. Geogr. Inf. Sci. 2020, 36, 39–45+64. [Google Scholar]
  140. Zhang, J. Remote Sensing Detection and Spatiotemporal Evolution of Surface Thermal Environment in the Pearl River Delta Region. Ph.D. Thesis, Chinese Academy of Sciences, Beijing, China, 2006. [Google Scholar]
  141. Belcher, S.; Hacker, J.; Powell, D. Constructing design weather data for future climates. Build. Serv. Eng. Res. Technol. 2005, 26, 49–61. [Google Scholar] [CrossRef]
  142. Qiu, X.; Yang, F.; Corbett-Hains, H.; Roth, M. Procedure to adjust observed climatic data for regional or mesoscale climatic variations. In Final Report of ASHRAE Research Project 1561-RP; American Society of Heating, Refrigerating and Air-Conditioning Engineers: Atlanta, GA, USA, 2015. [Google Scholar]
  143. Wu, C. Analysis and Simulation of USTE Based on Remote Sensing and CFD Technology; Lanzhou University: Lanzhou, China, 2008. [Google Scholar]
  144. Liu, X.; Wang, W.; Wang, Z.; Song, J.; Li, K. Simulation Study on Outdoor Wind Environment of Residential Complexes in Hot-Summer and Cold-Winter Climate Zones Based on Entropy-Based TOPSIS Method. Sustainability 2023, 15, 12480. [Google Scholar] [CrossRef]
  145. Yuan, J.; Masuko, S.; Shimazaki, Y.; Yamanaka, T.; Kobayashi, T. Evaluation of outdoor thermal comfort under different building external-wall-surface with different reflective directional properties using CFD analysis and model experiment. Build. Environ. 2022, 207, 108478. [Google Scholar] [CrossRef]
  146. Palme, M.; Inostroza, L.; Villacreses, G.; Lobato, A.; Carrasco, C. Urban weather data and building models for the inclusion of the urban heat island effect in building performance simulation. Data Brief 2017, 14, 671–675. [Google Scholar] [CrossRef]
  147. Palme, M.; Inostroza, L.; Villacreses, G.; Lobato-Cordero, A.; Carrasco, C. From urban climate to energy consumption. Enhancing building performance simulation by including the urban heat island effect. Energy Build. 2017, 145, 107–120. [Google Scholar] [CrossRef]
  148. Evola, G.; Costanzo, V.; Magrì, C.; Margani, G.; Marletta, L.; Naboni, E. A novel comprehensive workflow for modelling outdoor thermal comfort and energy demand in urban canyons: Results and critical issues. Energy Build. 2020, 216, 109946. [Google Scholar] [CrossRef]
  149. Costanzo, V.; Nocera, F.; Detommaso, M.; Evola, G. Decarbonizing cities through electrification: A strategic study for densely built residential districts in Southern Italy. Sustain. Cities Soc. 2024, 113, 105651. [Google Scholar] [CrossRef]
  150. Costanzo, V.; Evola, G.; Infantone, M.; Marletta, L. Updated Typical Weather Years for the Energy Simulation of Buildings in Mediterranean Climate. A Case Study for Sicily. Energies 2020, 13, 4115. [Google Scholar] [CrossRef]
  151. Liu, Y. Research on Building Climate Analysis and Design Strategy; Xi’an University of Architecture and Technology: Xi’an, China, 2003. [Google Scholar]
  152. Lima, I.; Scalco, V.; Lamberts, R. Estimating the impact of urban densification on high-rise office building cooling loads in a hot and humid climate. Energy Build. 2019, 182, 30–44. [Google Scholar] [CrossRef]
  153. Qian, C. Simulation Analysis of the Influence of Urban Regional Microclimate on Energy Consumption of a Single Building; Shandong Jianzhu University: Jinan, China, 2018. [Google Scholar]
  154. Yang, X.; Zhao, L. A review of research methods on the impact of urban microclimate on building energy consumption. Build. Sci. 2015, 31, 1–7. [Google Scholar] [CrossRef]
  155. Xiaoshan, Y.; Lihua, Z.; Bruse, M.; Qinglin, M. Application of urban microclimate simulation data in building energy consumption calculation. Chin. J. Sol. Energy 2015, 36, 1344–1351. [Google Scholar]
  156. Xiaoshan, Y. Research on the Simulation Method of the Influence of Outdoor Microclimate on Building Air Conditioning Energy Consumption; South China University of Technology: Guangzhou, China, 2012. [Google Scholar]
  157. Xuan, L.; Tianzhen, H.; Kaiyu, S. Simulating thermal resilience of buildings and their influence by urban microclimate using EnergyPlus. In Proceedings of the Building Simulation 2021: 17th Conference of IBPSA, Bruges, Belgium, 1–3 September 2021; pp. 1107–1114. [Google Scholar]
  158. Li, H.; Huo, Y.; Fu, Y.; Yang, Y.; Yang, L. Improvement of methods of obtaining urban TMY and application for building energy consumption simulation. Energy Build. 2023, 295, 113300. [Google Scholar] [CrossRef]
  159. Schiavon, S.; Hoyt, T.; Piccioli, A. Web application for thermal comfort visualization and calculation according to ASHRAE Standard 55. Build. Simul. 2014, 7, 321–334. [Google Scholar] [CrossRef]
  160. Silva, A.S.; Ghisi, E.; Lamberts, R. Performance evaluation of long-term thermal comfort indices in building simulation according to ASHRAE Standard 55. Build. Environ. 2016, 102, 95–115. [Google Scholar] [CrossRef]
  161. Patil, R.; Ruikar, A.; Kumar, P.; Jadhav, S.; Venu, A.J.A.W.C. Methodology to Evaluate the Local Thermal Discomfort Parameters Using CFD Simulations in Compliance with ASHRAE Standard 55. In Proceedings of the ASHRAE, Indianapolis, IN, USA, 22–26 June 2024. [Google Scholar]
  162. Zhang, L.; Liu, H.; Wei, D.; Liu, F.; Li, Y.; Li, H.; Dong, Z.; Cheng, J.; Tian, L.; Zhang, G.; et al. Impacts of Spatial Components on Outdoor Thermal Comfort in Traditional Linpan Settlements. Int. J. Environ. Res. Public Health 2022, 19, 6421. [Google Scholar] [CrossRef]
  163. Mackey, C.; Galanos, T.; Norford, L.; Roudsari, M.S. Wind, Sun, Surface Temperature, and Heat Island: Critical Variables for High-Resolution Outdoor Thermal Comfort. In Proceedings of the 15th Conference of IBPSA Conference, San Francisco, CA, USA, 7–9 August 2017. [Google Scholar]
  164. Fang, Z.; Feng, X.; Lin, Z. Investigation of PMV Model for Evaluation of the Outdoor Thermal Comfort. Procedia Eng. 2017, 205, 2457–2462. [Google Scholar] [CrossRef]
  165. Vellei, M. Thermal Comfort, Control and Energy Use; University of Bath: Bath, UK, 2017. [Google Scholar]
  166. Salata, F.; Golasi, I.; Ciancio, V.; Rosso, F. Dressed for the season: Clothing and outdoor thermal comfort in the Mediterranean population. Build. Environ. 2018, 146, 50–63. [Google Scholar] [CrossRef]
  167. Qingqing, W.; Jianhua, L.; Liang, Z.; Jiawen, Z.; Linlin, J. Effect of temperature and clothing thermal resistance on human sweat at low activity levels. Build. Environ. 2020, 183, 107117. [Google Scholar] [CrossRef]
  168. Moradi, M.; Dyer, B.; Nazem, A.; Nambiar, M.; Nahian, M.R.; Bueno, B.; Mackey, C.; Vasanthakumar, S.; Nazarian, N.; Krayenhoff, E.; et al. The Vertical City Weather Generator (VCWG v1.3.2). Geosci. Model Dev. 2021, 14, 961–984. [Google Scholar] [CrossRef]
Figure 1. Word cloud chart of thermal environment literature based on UWG.
Urbansci 09 00275 g001
Figure 2. Simulation flow of UWG model.
Urbansci 09 00275 g002
Figure 3. Schematic diagram of UWG operation.
Urbansci 09 00275 g003
Figure 4. The urban–rural temperature difference simulated based on UWG of Grasshopper.
Urbansci 09 00275 g004
Figure 5. Four coupling modules of UWG.
Urbansci 09 00275 g005
Figure 6. Energy exchange between each module.
Urbansci 09 00275 g006
Figure 7. Physical domains between UWG modules.
Urbansci 09 00275 g007
Figure 8. Annual dry-bulb temperature and UTCI in Beijing.
Urbansci 09 00275 g008
Figure 9. Rose diagram of annual hourly wind speed in Beijing.
Urbansci 09 00275 g009
Figure 10. Custom morphological extractor of Grasshopper.
Urbansci 09 00275 g010aUrbansci 09 00275 g010b
Figure 11. A custom UWG simulation battery pack.
Urbansci 09 00275 g011
Table 1. Four modules of UWG and their main functions.
UWGMain Function
RSMReads the meteorological data measured every hour at the rural site, calculates the sensible heat flux at the suburban site through the surface energy balance, and provides it as an input parameter to the VDM and UBL models
VDMReads the temperature and humidity data provided by the RSM model, as well as the sensible heat flux calculated by the RSM, calculates the air temperature at different heights above the rural site through the heat diffusion equation, and provides it to the UBL model
UBLBased on the temperatures at different heights provided by the VDM and the sensible heat flux provided by the RSM, the UBL model calculates the air temperature above the urban canopy through energy balance and provides the results to the UC-BEM model
UC-BEMThe air temperature and humidity in the urban canyon are calculated through the TEB and BEM, and the urban sensible heat flux and air temperature and humidity in the urban canyon are provided to the UBL model at the same time
Table 2. Description of internal parameters of *. UWG files.
*. UWG File Internal ParametersSpecifically
Urban areaAverage building height, building coverage, site coverage ratio, facade-to-site ratio, tree coverage, sensible anthropogenic heat (other than from buildings), non-building latent heat, neighborhood characteristic length, latent fraction of trees, latent fraction of grass, albedo of vegetation, vegetation participation begin month, vegetation participation end month, daytime boundary layer height, nighttime boundary layer height, VDM reference height.
ConstructionAlbedo, emissivity, thermal conductivity, volumetric heat capacity, thickness, vegetation coverage, inclination, initial temperature, window to wall ratio, total U-value, total solar heat gain coefficient (SHGC).
BuildingInternal gain, infiltration, ventilation, floor height, radiant fraction of internal heat gains, latent fraction of internal heat gains, efficiency of heating system, cooling setpoint, heating setpoint, amount of heat released to canyon.
Reference siteLongitude and latitude of the city, reference site obstacle height, temperature measurement height, wind measurement height.
Simulation parametersSimulation starting time and end time, simulation duration, simulation step.
Table 6. Comparison of WRF, UWG, Morphing, and CFD microclimate models.
WRFUWGMorphingCFD
Modeling techniquesDynamic downscalingBuilding an urban microclimate model from bottom to top based on TEBGlobal circulation models and regional climate modelsNumerical simulation of flow under the control of basic flow equations
Input dataThree-dimensional finite area model output from GCM (General Circulation Model, used for climate studies) (initial and boundary conditions), physics options describing various physics modules, urban canopy representation, and region sizeUrban morphological parameters, vegetation parameters, building surface material parameters, boundary layer parameters, meteorological parameters, and regional sizeA set of high-resolution, quality-assured “baseline climate” data, algorithms for transforming weather data.Inlet and outlet boundary conditions and internal surface boundaries
Output dataAir temperature, relative humidity, wind speed and direction, solar radiation, and precipitationAir temperature and relative humidityAir temperature, relative humidity, wind speed, solar radiation, and precipitationAir temperature, wind speed and direction, and pressure field
Disclaimer/Publisher’s Note: The statements, opinions and data contained in all publications are solely those of the individual author(s) and contributor(s) and not of MDPI and/or the editor(s). MDPI and/or the editor(s) disclaim responsibility for any injury to people or property resulting from any ideas, methods, instructions or products referred to in the content.

