1. Introduction
It is well known that coal is a relatively inexpensive fuel source for generating electricity. Moreover, the Energy Institute [
1] reports that coal accounts for up to 35% of the global electricity balance as of 2023. However, because coal burning harms human health and the environment, coal consumption in many countries is generally declining. In particular, in the United States, coal consumption has decreased by nearly half over the past 12 years, and the number of coal-fired power stations has also declined. A similar trend is observed in Europe. By contrast, estimates indicate growing coal production and use in China, India, Russia, and other parts of Asia. In some cases, coal spas occur at unmodernized stations that are highly polluted by the environment [
2]. Also, in these regions, people continue to burn coal to heat private homes, which leads to a significant concentration of pollutants in the air. Coal burning releases high concentrations of solid particles (PM
10, PM
2.5), metal contaminants, and carcinogenic gases [
3]. This results in significant health problems for the local population, specifically an increase in respiratory problems, cardiovascular diseases, etc. In particular, Mahlangeni et al. [
4] examine the health impact of coal-fired power station operations on the health of the population living near these stations. As a result, it was found that living near coal-fired power stations is often associated with an increased likelihood of respiratory disorders, adverse consequences of childbirth, and problems with a child’s development.
The American Lung Association [
5] notes that burning coal contaminates the air with solid particles (PM
10, PM
2.5) that can enter the lungs and circulatory system, increasing the risk of cardiovascular and respiratory diseases. Also, when coal burns, sulfur dioxide (SO
2) and nitrogen oxides (NO
2) are released, causing respiratory irritation. Mercury (Hg), lead (Pb), and arsenic (As) particles are also released, which accumulate in the body and can cause neurological and oncological diseases. Research has also examined the impact of burning coal indoors on human health. A study by the International Agency for Research on Cancer (IARC) determined that indoor emissions from coal burning comprise a group 1 carcinogen [
6]. At the same time, indoor coal burning remains the main source of air pollution in many developing countries [
7]. Despite this, the main factor contributing to air pollution worldwide remains the production of energy based on coal.
Henneman et al. [
8] analyzed deaths in the United States associated with exposure to PM
2.5 from coal-fired power stations. As a result, a large dataset of Medicare deaths dating back to 1999 was analyzed. Then, the way in which air flows carry emissions from 480 separate coal-fired power stations was modeled. This allowed them to assess the impact of PM
2.5 carbon particles in locations where affected individuals lived and died. The research team estimated that between 1999 and 2020, approximately 460,000 deaths would not have occurred if there had been no emissions from coal-fired power stations. Another important conclusion from the study [
8] is that installing pollution control sensors (scrubbers) reduced emissions-related deaths. For example, the Keystone facility in Pennsylvania was one of the most powerful power stations during the study period. This station was associated with an average of more than 600 deaths per year before the installation of emissions scrubbers. After installing the scrubbers, this number dropped to 80 deaths per year [
8,
9]. Therefore, it is important to ensure reliable monitoring of pollutant emissions from coal-fired power stations. This is the basis for ensuring the necessary quality of life and health of the population near power stations.
Wesz et al. [
10] developed seven measures based on the ISO standard 37120:2018 [
11] to assess the population’s quality of life in urban agglomerations. These include urban services; culture; economy and recreation; urban mobility; friendliness; safety; and environmental comfort. Environmental comfort includes noise and air pollution, climate comfort, and abundance of water resources. Therefore, studying the impact and characteristics of pollutant emissions from coal-fired power stations is highly relevant for urban studies. This is important for safeguarding the quality of life of the urban population, considering the environmental impact of the urban development of coal mining regions and ensuring the effective use of coal in coal-fired power stations. Ensuring effective monitoring of pollution and considering the characteristics and changes in the concentration of various pollutants should lead to a reduction in air pollution levels and accordingly, a decrease in population morbidity. This, in turn, should improve the population’s standard of living and reduce state spending on medical care.
The pollution issue concerns urban agglomerations that are located near coal mining sites. For example, in the Republic of Kazakhstan, the Pavlodar region in northeastern Kazakhstan is one of the regions where the problem of ensuring environmental safety in cities is acute. The Ekibastuz coal-mining center is located in this region. Ekibastuz is a city, as well as a center of open-pit coal mining. Coal has been extracted here since 1876 in small volumes, but large-scale mining began in the mid-1900s [
12]. In the 1970s, Ekibastuz was the third largest coal producer in the Soviet Union. However, at that time, this region was mostly a rural area, and the urban center was still in the process of formation. Currently, the population of Ekibastuz exceeds 150 thousand people [
13]. The Ekibastuz coal-fired power station is also located in the city, providing electricity to both the domestic market and for export. The Ekibastuz coal-fired power station is one of the largest thermal power stations in Kazakhstan and the world, with a capacity of 4000 MW.
The goal of this study is to investigate long-term memory in air pollution time series by analyzing the dynamic behavior of the Hurst exponent and assessing the predictability index. This type of statistical pre-forecast analysis is essential for building accurate forecasting models for such time series. The accuracy of these forecasts directly impacts the effectiveness of air quality monitoring systems.
2. Literature Review
This section presents a literature review regarding the use of fractal analysis for assessing long-term memory in time series, particularly in the context of the emissions of air pollutants. Conducting a comprehensive study to identify the causes of pollution and explore ways to reduce or mitigate it requires an understanding of various influencing factors, including climatic, economic, technological, and other aspects. Currently, Kazakhstan has adopted the concept of a green economy, along with a national development strategy for Kazakhstan until 2050. These documents serve as the strategic foundation for a consistent transformation of the country’s economy, with the focus on sustainable development. The key factor for achieving carbon neutrality in Kazakhstan’s economy is the energy sector. The energy sector is the main source of greenhouse gas emissions in Kazakhstan. Moreover, the main source of emissions is the coal industry. In 1990, the coal industry accounted for 65% of Kazakhstan’s greenhouse gas emissions. In 2017, this share was estimated at 59% [
14]. Kazakhstan is among the top ten countries in the world when it comes to its coal reserves, estimated at 33.6 billion tons across approximately 400 fields. About 72% of the country’s coal is extracted in the Pavlodar and Karaganda regions.
According to the report in Reference [
14], the EU’s carbon border adjustment mechanism (CBAM) priorities [
15] can significantly impact Kazakhstan’s industry if the country does not abandon its use of coal. Losses in export revenues can reach USD hundreds of millions of annually. The gradual abandonment of coal in the production and energy sectors will help mitigate the associated problems. In 2018, 239 and 263 cancer cases per 100,000 people were recorded in the Karaganda and Pavlodar regions, respectively, while the national average was 184 cases per 100,000 people. According to recent satellite observations, 27,500 kg/h of methane emissions from the Ekibastuz mines was observed in October 2021 [
14]. This corresponds to the emissions of approximately 1.3 million vehicles yearly. Consequently, the region near the city of Ekibastuz experiences significant environmental problems that will continue to accumulate over the years.
In recent years, there has been an improvement in the environmental situation in Kazakhstan due to the fact that industrial enterprises are required to obtain permits for emissions within the established permissible limits [
16]. Maintaining these values depends on ensuring air quality standards and sanitary standards in the surrounding localities. For example, in 2019, Kazakhstan ranked 29th in the global ranking of the most polluted countries [
17]. In 2024, Kazakhstan ranked 71st out of 138 countries in terms of pollution (based on annual average PM
2.5 concentration (µg/m
3)) [
18]. Nevertheless, many cities in Kazakhstan exhibit high pollution rates and rank among the most polluted cities, including Karaganda, Astana, Almaty, etc. The climate in most regions of Kazakhstan is sharply continental, with cold winters; thus, the centralized heating season lasts about 6 months. Accordingly, one of the main sources of pollution is the high rate of coal consumption at power stations, along with coal burning by private households. This leads to significant health problems for local residents. In studies [
19,
20], the reasons for the increased prevalence of chronic obstructive pulmonary disease and bronchial asthma in Kazakhstan were analyzed. Also, the impact of air pollution in Kazakhstan on public health has been evaluated in studies [
21,
22]. In study [
23], the mortality rate from air pollution in the large cities of Kazakhstan was estimated. The highest mortality rate from the potential effects of increased PM
2.5 concentrations is observed in industrial cities. Studies [
24,
25] describe solutions that can improve air quality in regions with high levels of pollution. In particular, the concept of moss-based biotechnological purification filters used in urban environments is described. In study [
25], a model was constructed to determine the best locations for biotechnological cleaning filters by solving the discrete optimization problem. Such approaches often overlook the root causes of air pollution and tend to be ineffective without a thorough analysis of time series data from pollution sources, identification of technological operating modes that influence emissions, and determination of optimal parameters for forecasting, planning, and managing emissions.
This study is dedicated to the analysis of emissions from the Ekibastuz coal-fired power station. The Ekibastuz coal-mining center is located in the Pavlodar region, which, in addition to coal extraction, is known for significant man-made pollution caused by mining activities, oil refining, the chemical industry, and both non-ferrous and ferrous metallurgy. However, the main pollution in the region is due to coal mining and the operation of thermal power stations near the city of Ekibastuz. The population of the region exceeds 750,000 people [
13]. The urban agglomerations of Pavlodar, Aksu, and Ekibastuz are located directly near the regions of intensive mining and the location of thermal power stations. Although the city of Ekibastuz is located 16 km away from the Ekibastuz coal-fired power station, local dispersion models for this plant show that the highest concentrations of pollutants are typically observed within an 8 km radius around the station and spread horizontally [
26]. Moreover, weather conditions can cause the transport of pollutants beyond 8 km. Similar studies conducted for other power stations have revealed that pollution can travel significantly greater distances. For instance, Levy et al. used the CALPUFF atmospheric dispersion model, determining that high concentrations of particulate matter can be detected at distances ranging from 1 km to 40 km [
27]. Goyal et al. observed PM
2.5 dispersion at distances of 60 km and beyond, noting a substantial impact on air quality in cities located up to 100 km away from coal-fired power plants [
28]. The negative effects of locating cities near coal power plants are also discussed in studies [
4,
29].
Therefore, it can be concluded that emissions from the Ekibastuz coal-fired power station have an impact on air quality in the city of Ekibastuz. Given that this power station contributes a significant portion of the region’s annual pollutant load, understanding changes in emissions at the source is critical for predicting their impact on urban areas through the use of dispersion models. Analyzing emissions near the source helps to identify the causes of exceedances and provides a foundation for reducing pollution in urban agglomerations. The complexity of analyzing time series of changes in air pollution levels, especially in urban agglomerations and industrial zones, is associated with the nonlinearity of pollution spread. Therefore, before applying methods for predicting such time series, it is necessary to analyze the structure and investigate the presence of long-term memory in these time series. This can be achieved using fractal analysis methods, specifically, variable range analysis (R/S analysis) or detrended fluctuation analysis (DFA). These methods can also be used to build reliable air quality monitoring systems. In particular, in study [
30], long-term memory in a time series of concentrations of air pollutants (solid particles PM
10, PM
2.5) from four stations in Astana (Kazakhstan) was studied using the fractal R/S analysis method. It was found that the reason for the significant increase in air pollutant concentration is the close location of the coal-fired power station to the city. In study [
31], The MF-DFA method was constructed, and the multifractal structure of the air pollution time series was revealed. The study was conducted using the city of Zhengzhou (China) as an example. In study [
32], data from observations of air pollution levels by solid particles (PM
10, PM
2.5), as well as gaseous materials and meteorological indicators at 412 stations in Germany from 2008 to 2018, were analyzed. According to the Hurst exponent’s analysis of air pollution time series, it was determined that air pollution at certain monitoring stations is generally persistent. In study [
33], the behavior of the time series of air pollution levels in the United States (PM
10, PM
2.5) was analyzed. The results showed that Western states have a higher persistence rate in their air pollution time series compared to Eastern states, where a general downward trend is observed in the Hurst exponent. In addition, the study of long-term memory in time series has been explored in studies [
34,
35,
36,
37]. Other studies have used nonparametric methods, such as DFA [
38] and multifractal detrended fluctuation analysis (MF-DFA) [
39], to estimate the Hurst exponent. If the time series of air pollution are short, the DFA method is used to analyze them [
39,
40]. The predictability index can be calculated based on the fractal dimension, which depends on the Hurst exponent [
41]. This index can be used as an indicator for air quality monitoring systems.
Therefore, the application of fractal analysis to air pollution time series to establish long-term memory and identify the stability of the emissions of pollutants into the air is an urgent task. This is especially true for urban agglomerations near coal-fired power stations, which are characterized by high levels of air pollution because of the high concentrations of pollutants in the air, which harm the health and quality of life of the population.
This paper aims to investigate long-term memory in the time series of air pollution indicators resulting from coal burning, which impacts environmental safety and the population’s quality of life. Another goal of the study is to establish a connection between the calculated estimates of long-term memory and the technological operating modes of the coal-fired power station, as well as the parameters of air pollution forecasting models. This information can be utilized by air quality monitoring systems to enhance their accuracy and reliability. The Ekibastuz coal-mining center, which houses one of Kazakhstan’s largest coal-fired power stations, was chosen as an example for the study. To achieve this goal, the following tasks were identified: to apply the DFA method of a time series of air pollution indicators to calculate the Hurst exponent and the predictability index, as well as to investigate the dynamic changes of the Hurst exponent over time, and to justify how the obtained predictability index estimates can be applied to forecast air pollution time series. The analysis also examined how the Hurst exponent values reflect the technological operating modes of the Ekibastuz coal-fired power station and how this information can be used to reduce the emissions of air pollutants.
The long-term stability of pollutant emissions in the air enables the prediction and control of pollution parameters. The results of the dynamic analysis of the Hurst exponent and the evaluation of the predictability index will help improve the accuracy of forecasting models for air pollution time series and provide insights into how the operating conditions of the power station influence these dynamics. This is crucial for the development of effective air quality monitoring systems. Finally, the results are important for developing urbanism in terms of ensuring the environmental safety and sustainable development of urban agglomerations, particularly those located near coal mining areas and coal-fired power stations.
4. Results
4.1. Collection of Data
The emissions of pollutants at the Ekibastuz coal-fired power station are measured using industrial sensors installed directly on stationary emission sources. To monitor the concentration of suspended particles at the emission source, dust meters are installed that measure the optical density of the smoke flow, allowing for the determination of the level of dust contamination. Gas analyzers are also used and are installed near the source of release. Sampling employs a sampling probe that draws flue gas from the pipe. Before supplying gas to the gas analyzer, the sample is subjected to a preparation stage that includes filtration and cooling to remove condensate and solid impurities that may affect measurements accuracy. After preparation, the sample enters the measuring chamber of the gas analyzer, where the concentration of the corresponding substances is determined.
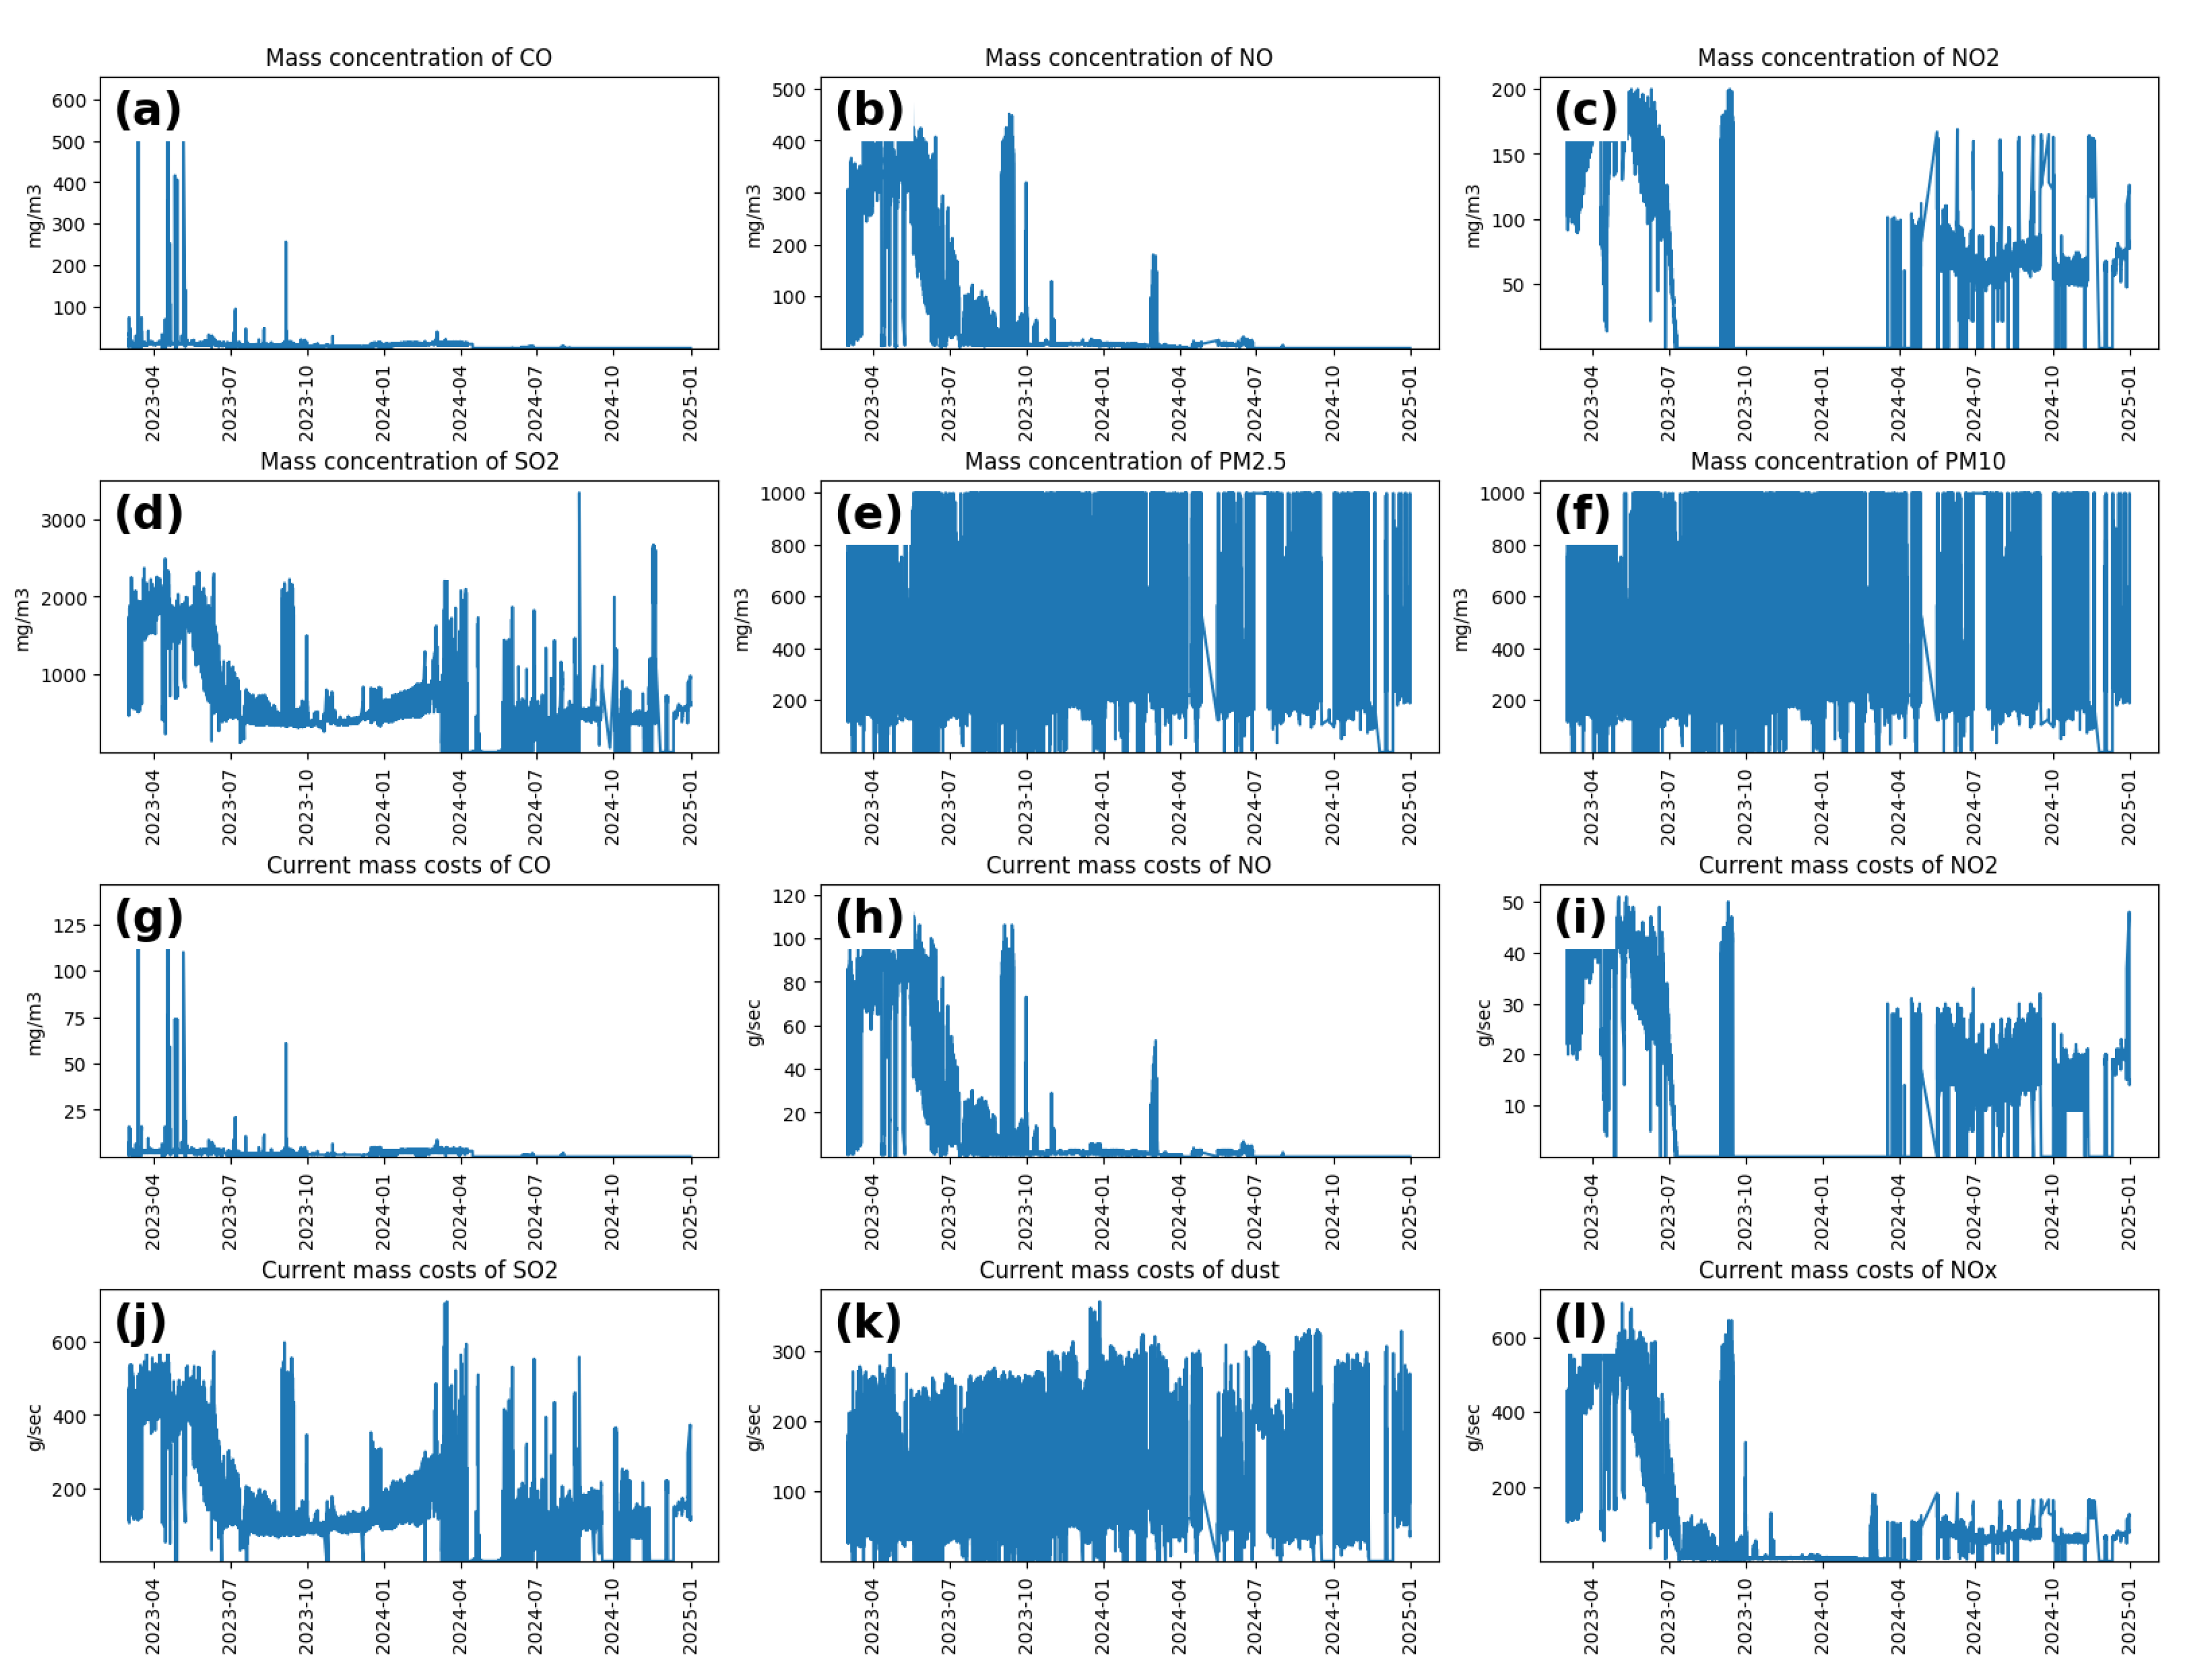
Data for the period from 1 March 2023 to 31 December 2024 were collected and analyzed. Indicators were recorded every 10 min. During this period, 67,527 observations of indicators were completed. The values of 14 indicators were recorded (
Table 1), among which 2 pollution indicators were identified and used in the following studies (the data are specified in the
Supplementary Materials).
The first pollution indicator group consists of the mass concentrations of CO, NO, NO
2, O
2, SO
2, PM
2.5, and PM
10. Indicators of this group are measured in mg/m
3. The second group includes the current mass consumption of CO, NO, NO
2, O
2, CO
2, and dust (PM
2.5 and PM
10 in total). Indicators of this group of pollutants are measured in grams per second. A dataset of indicators in CSV format is available in the
Supplementary Materials.
Table 2 shows some descriptive statistics.
4.2. Application of Detrended Fluctuation Analysis to Calculate the Hurst Exponent
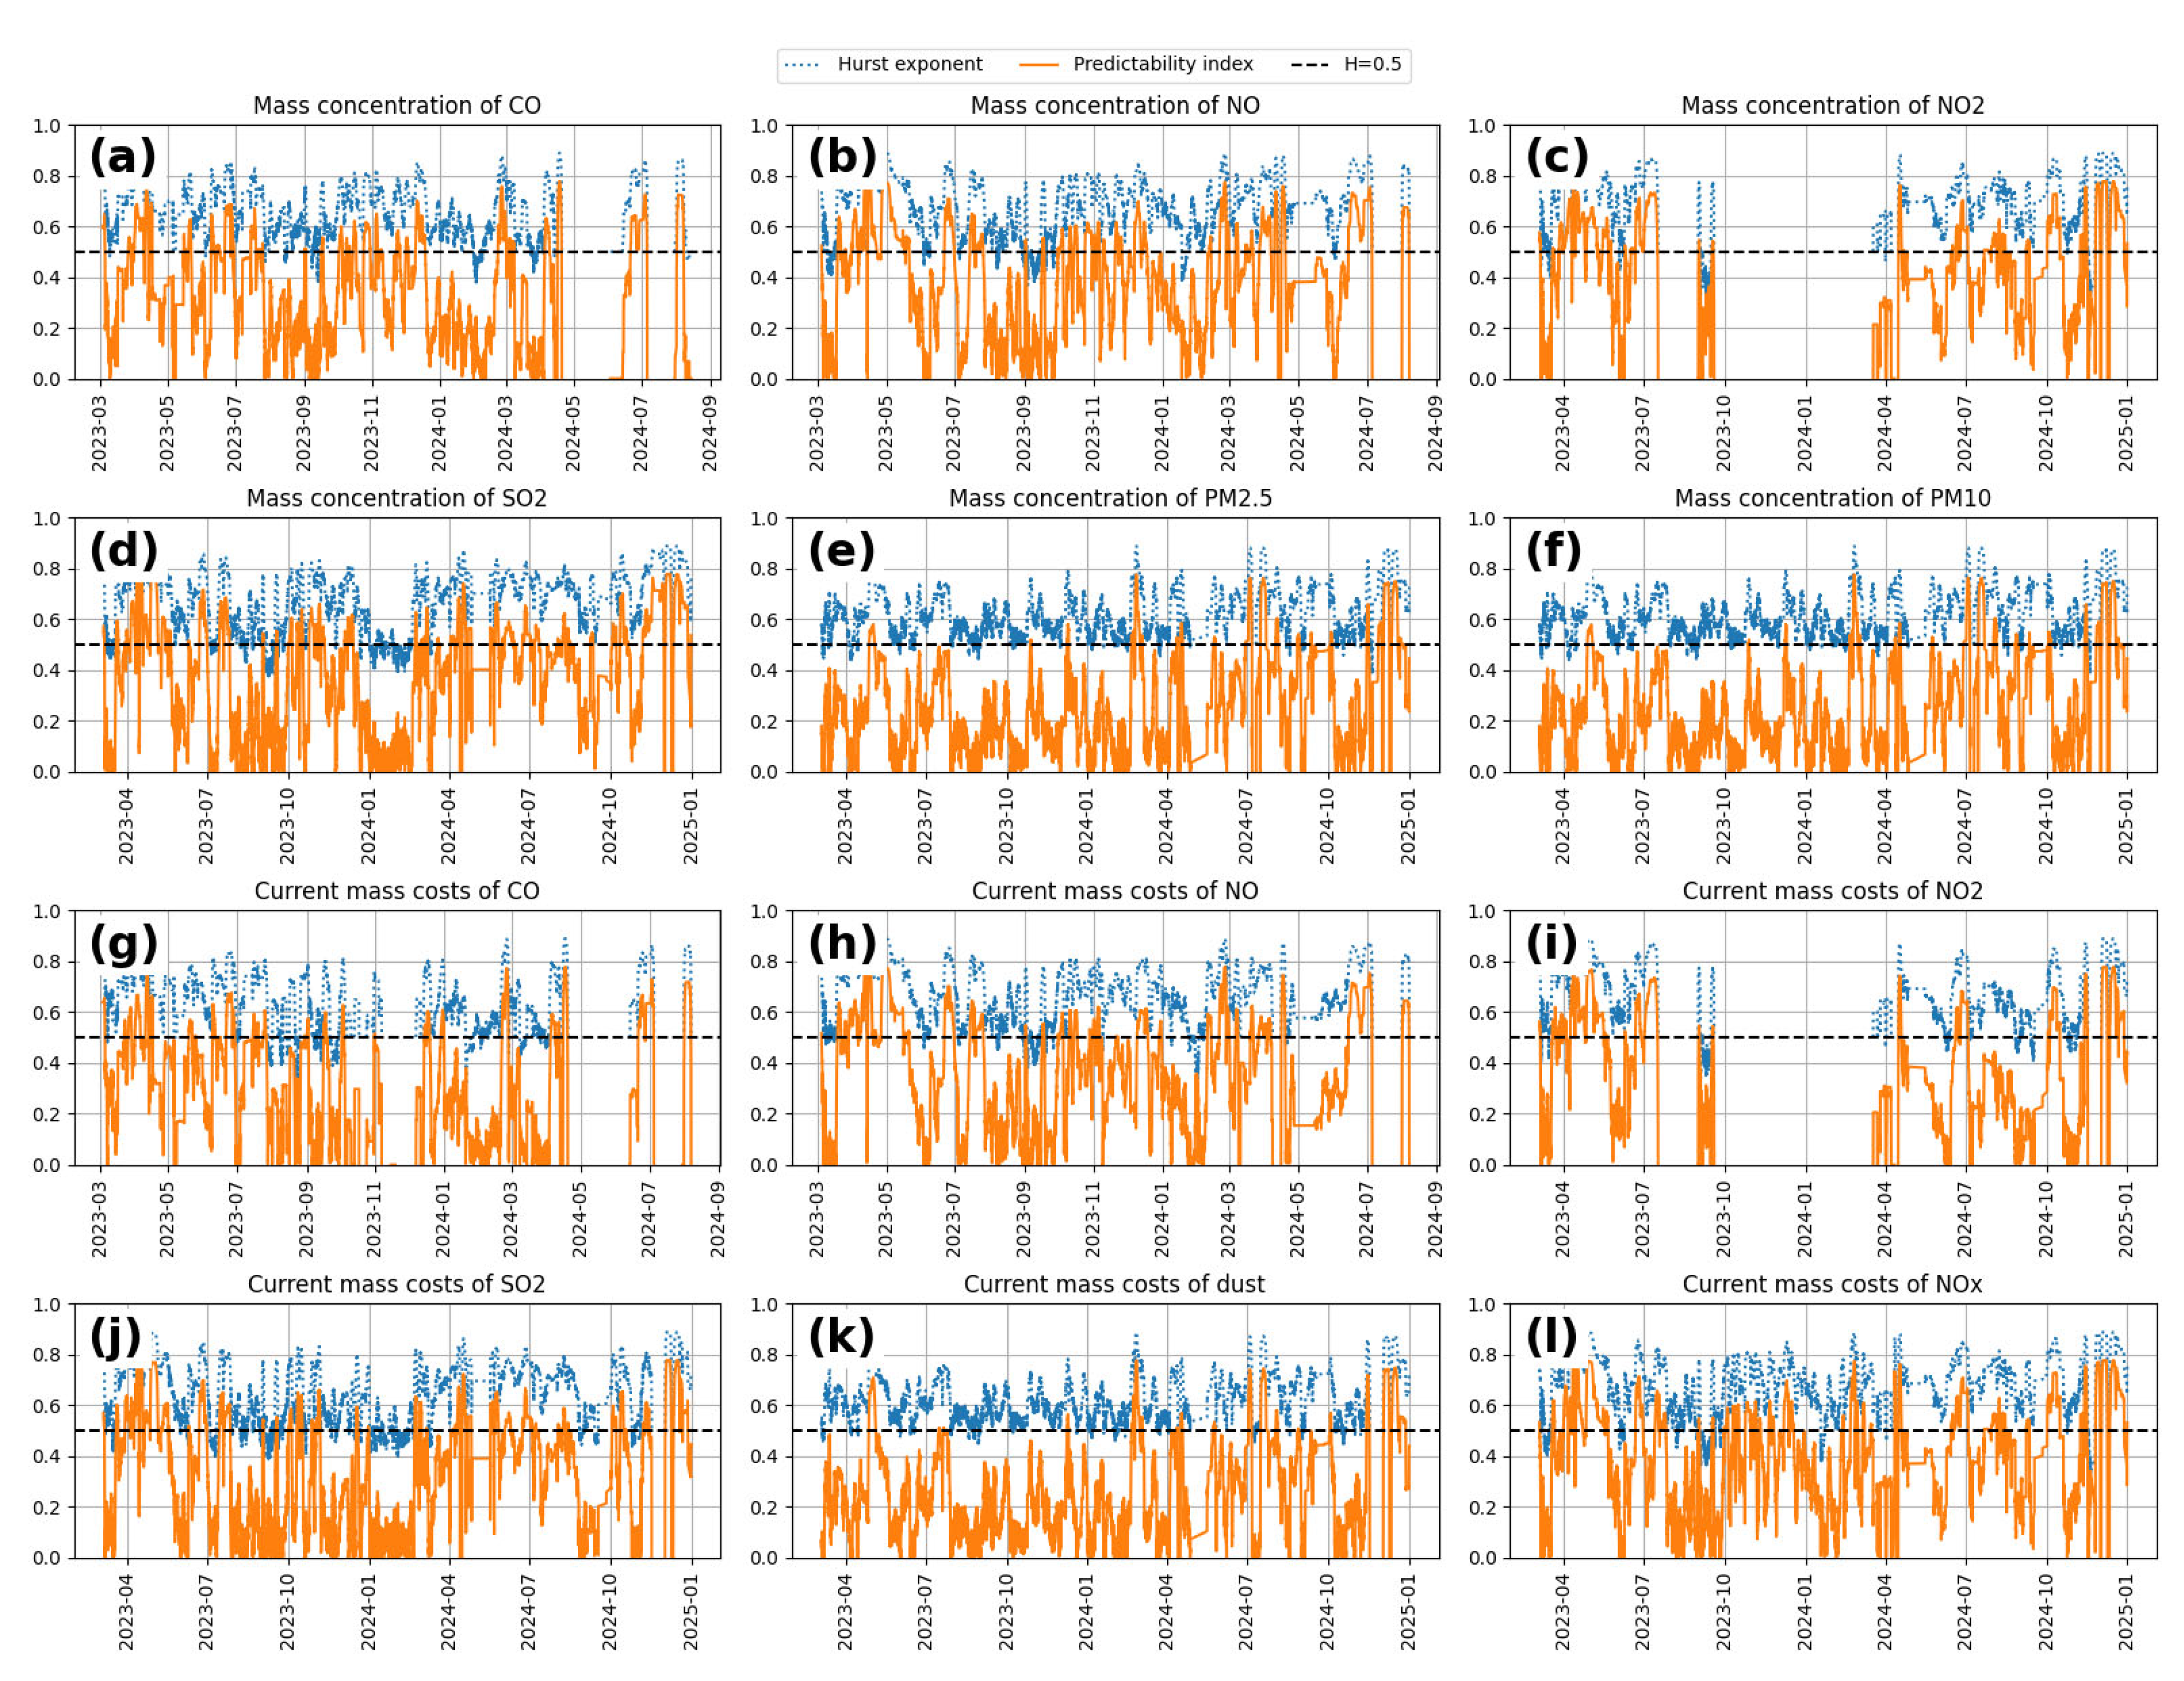
This section presents the results of the experiment assessing the long-term memory and the predictability index for the time series of emissions of air pollutants. Based on the DFA analysis for each time series of pollution indicators, the Hurst exponent, predictability index values were calculated, and the presence of long-term memory in the time series for the established period from 1 March 2023 to 31 December 2024 was investigated.
Figure 2 shows the change in indicators for the entire specified time period. For these, the values of the Hurst exponent and the predictability index were calculated based on the number of points shown in
Table 2. A different number of points was recorded in each time series. This is because the time series of the pollution indicators exhibited gaps that were not considered. Fractal analysis indicators were calculated for time series sections that did not contain gaps.
To validate the choice of sliding window length in the DFA method, a sensitivity analysis of the Hurst exponent α was conducted across a wide range of pollutants. The estimation was performed for multiple window sizes (50, 100, 300, 500, 750, and 1000 data points) in order to evaluate the stability of the α value under varying window lengths.
All analyzed time series can be conditionally divided into two groups. The first group includes indicators for which the Hurst exponent values remain close to 0.5. This applies in particular to the concentrations of CO and nitrogen oxides (NO). For these series, the α values show extremely low sensitivity to window length: the difference in estimates between the smallest and largest window sizes is less than 0.003. Such stability indicates the absence of pronounced long-term memory in the data structure, which is characteristic of nearly random or noise-like processes. In this case, selecting a window length in the range of 300–500 data points is considered safe and does not significantly affect the conclusions. The second group includes time series characterized by Hurst exponent values in the range of 0.7–0.8. This group comprises concentrations of NO2, SO2, PM2.5, PM10, and dust, as well as aggregated NOx indicators. These series exhibit noticeable sensitivity to the choice of window length. For instance, when using short windows (50–100 data points), α values can reach as high as 0.81, whereas increasing the window length to 1000 data points results in a decrease to approximately 0.68. This variability, ranging from 0.1 to 0.13, suggests that short windows may overestimate the level of persistence, while longer windows tend to smooth out local fluctuations, diminishing part of the correlation structure.
Thus, selecting a window length of 500 data points represents a reasonable compromise for both types of time series. For data with low α values, this choice has little impact on the results, while for series exhibiting long-term dependencies, it provides stable estimates without excessively suppressing information about underlying trends. This approach ensures methodological robustness and preserves the informativeness of the results for further analysis or forecasting.
During the data preprocessing stage, an assessment of missing data patterns was conducted across all time series. It was found that the total number of gaps was relatively small (ranging from 2 to 4 segments per series), but the duration of individual gaps was substantial, varying from 124 to 1560 data points. As a result, the use of interpolation methods to fill such long gaps was deemed inappropriate, as it could artificially distort the internal structure of the time series.
Meanwhile, in cases where short gaps were present (up to several dozen data points), the use of specialized interpolation techniques (such as spline interpolation) was indeed considered at other stages of the modeling process. However, in our study, all detected gaps were too long for such methods to be applied effectively. As a result, the corresponding segments were entirely excluded from the analysis. This ensured the integrity of the processed subsequences and maintained compliance with the methodological requirements of the chosen approaches. In addition, the dataset was examined for the presence of statistical outliers. A classical approach was applied, based on identifying deviations exceeding three standard deviations (3σ) from the mean. As a result, 158 observations exceeding 3σ were detected for SO
2, and 346 for NO
x. None of these observations exceeded the threshold of 5σ, which allows them to be classified as anomalously high, but not extreme, values. These observations accounted for only 0.254% of the total dataset. Given their small number and limited deviation from the mean, it was decided not to exclude them from further analysis, as their impact on the overall structure of the time series is minimal.The moving window method with a fixed length of 500 points was used to process time series of air pollution indicators. Calculations were performed only for segments of the series that did not contain missing values, which corresponds to standard practices for ensuring statistical correctness in fractal analysis. Due to gaps in the original data, the number of processed points differed for different time series. These omissions were automatically excluded from the analysis, and the corresponding areas without results are marked on the graphs (
Figure 2 and
Figure 3), allowing for the visual identification of areas with insufficient data quality for inclusion in the study. We visually analyzed the time series for each pollutant. However, due to high variability and significant overlap between the curves, displaying the raw trajectories in full resulted in interpretation difficulties. To address this, we applied data smoothing using a 24 h moving average window. This approach reduced the influence of short-term fluctuations, highlighted long-term trends, and improved the clarity of the plots.
Figure 3 presents the smoothed trajectories of the Hurst exponent, allowing for a clearer comparison of long-term memory dynamics across different pollutants.
Next, the Hurst exponent and predictability index were calculated, and the results are presented in
Table 3. After analyzing the results obtained, we can distinguish three main groups of indicators. For the mass concentration of CO and NO, as well as for the current mass consumption of CO and NO, the predictability index value is close to zero, indicating the random nature of the pollution series. For the mass concentration indicators of dust and the current mass flow rate of NO
2, SO
2, and dust, the predictability index value is close to 0.45, and for the mass concentration indicators of NO
2 and SO
2 and the current mass flow rate of NO
x, the value is close to 0.55. For both groups of indicators, we can conclude that there is a long-term memory or persistence of the time series of the pollutants.
Changes in the values of the Hurst exponent and the predictability index were calculated using the flow window method to identify the causes of such different behaviors of the pollutants over the specified period. The graph of the changes in the indicators is shown in
Figure 3. An analysis of the graphs shows that the predictability index value varies from 0 to 0.8 for all pollution indicators. This index is characterized by sharp variability over time, indicating instability in the predictability of pollution levels. Such fluctuations are probably caused by abnormal emissions that lack a clear periodicity and occur due to unpredictable human-caused or weather factors. Short-term peaks in the emissions of pollutants recorded by individual sensors significantly affect the structure of the time series and reduce the stability of the dynamics, as reflected in the decrease in predictability index values during the corresponding periods. This suggests that the time series of mass concentrations of CO and NO, as well as their current mass consumption, are not fundamentally different from the time series of other pollutants. It should also be noted that predictability index values close to zero can sometimes be caused by missing data at the end of the time series. Such gaps violate the integrity of the signal fluctuation structure and reduce the accuracy of estimating the predictability index. This problem can be partially eliminated by selecting an alternative point for calculation, applying averaging methods, or increasing the analysis window length, which allows for smoother results and reduces the impact of local breaks.
Therefore, based on the analysis results, it can be concluded that for all the time series of air pollution indicators from the Ekibastuz coal-fired power station, the characteristic periods of growth of the Hurst exponent and the predictability index also correspond to periods of decrease in these indicators. The Hurst exponent drops below 0.5, and the predictability index drops to 0. Predictability is index-sensitive to the insignificant influence of random factors on the time series. That is, in the event of a change in the emissions of air pollution that does not correspond to the current trend, this indicator is directed to 0. In general, the results indicate the stability and predictability of pollutant emissions, as most of the time series of pollution indicators are persistent. Thus, using the example of data from the Ekibastuz coal-fired power station, it can be argued that the described tools are effective and can be used to monitor the state of air pollution. When calculating the Hurst exponent using a 500-point window of the air pollution time series, we identified two distinct clusters: periods of persistence (
) and periods of randomness (
). Thus, the operational system of the coal-fired power station can be characterized as alternating between two distinct states, each corresponding to one of the identified clusters. Threshold value
is defined as the expected value of the Hurst exponent for a standard normal process, calculated using the following formula [
47]:
Kristoufek found that for a window size of 512 data points, the average value of
is approximately 0.5316 [
48]. Thus, in our case, it was established that the obtained Hurst exponent values were analyzed alongside the log files of the coal-fired power station’s operation. It was found that the system’s state depends on the boiler load. Specifically, under stable operation with a boiler load of 90–100%, the system tends to remain in a state corresponding to the persistence cluster, with the Hurst exponent values for the emission time series falling within this range. During transitional periods, the boiler load fluctuates between 30% and 70%, and the system enters a state of randomness, with the Hurst exponent values for the emission time series reflecting this random behavior. During these periods, the emissions exhibit unstable fluctuations, indicating a shift in the technological operating mode. This helps explain when and under what conditions the system transitions between states corresponding to persistent and random phases in the emission time series. Proper planning of the coal-fired power station’s operation and timely maintenance allow the system to remain in the persistent cluster state for as long as possible. This is crucial for forecasting and maintaining stability in air pollutant emissions. In particular, calculating the Hurst exponent enabled the development and testing of deep sparse transformer networks for predicting pollutant time series. The implementation of this approach and the verification of results based on data from the Ekibastuz coal-fired power station are detailed in study [
49].
5. Discussion
5.1. Findings, Implications, and Recommendations for Urban Monitoring
The operation of the Ekibastuz coal-mining center is of significant economic importance for the energy sector of Kazakhstan and Central Asia as a whole. Its work plays a key role in providing electricity to industry and maintaining the stability of energy security in this region. However, the operation of such powerful power stations has a negative environmental impact, producing air pollution and greenhouse gas emissions, which significantly harm health and affect the lives of the local population. The population of the Pavlodar region, where the Ekibastuz coal-mining center is located, is approximately 750,000 people [
13]. Studies [
19,
20] indicate a significant prevalence of chronic lung diseases in this region. Currently, projects are being implemented to modernize and improve the efficiency of these stations to reduce harmful emissions. Therefore, monitoring air pollution indicators at the power station is an important element in ensuring the effectiveness of these projects.
This study collected and analyzed data for the period from 1 March 2023 to 31 December 2024 at the Ekibastuz coal-fired power station. During the specified period, 14 indicators (67,527 observations) were collected at 10 min intervals. A DFA was applied, a predictability index was constructed, and changes in the Hurst exponent regarding dynamics were investigated. In general, the analysis of the Hurst exponent showed that all the time series are persistent, and there is a long-term memory in their structure. Such series can be predicted using traditional statistical forecasting models or machine learning models. The results also identified moments when the Hurst exponent decreased to values close to 0.5., which indicates an increase in the influence of random factors on the time series. In this case, the predictability index value is reduced to 0. Such areas may indicate unstable changes in pollutant emissions. A change in the emissions of pollutants with a change in the main trend of the time series is a sign of a sharp change in the current level of emissions, which may indicate emission overages. This information can serve as the basis for air pollution monitoring systems, especially in such a challenging region (from an ecological perspective) as the Ekibastuz coal-mining center, near which tens of thousands of people reside.
To further support the validity of using the DFA method, we conducted additional modeling based on classical time series analysis approaches, particularly ARIMA. These models were applied to all investigated indicators, with a primary focus on evaluating short-term autocorrelation, residual structure, and information criteria. As a result of modeling using the baseline ARIMA(2,1,1) model [
50], short-term memory was detected, evidenced by statistically significant coefficients of the autoregressive components. However, the residuals of this model exhibited autocorrelation (Ljung–Box,
p < 0.001), high variance (σ
2 ≈ 3775), and deviation from normality (Jarque–Bera,
p < 0.001), indicating limited explanatory power. To improve the quality of approximation, an ARIMA(20,1,1) model was applied, incorporating a longer lag structure. This adjustment significantly reduced the information criteria (AIC dropped by more than 13,000 points), decreased the residual variance (to ≈ 3102), and completely eliminated residual autocorrelation (Ljung–Box,
p = 0.80), formally indicating model adequacy.
However, even under these conditions, the residuals exhibited significant heteroscedasticity (α = 0.21, p < 0.001), along with pronounced skewness and excess kurtosis (kurtosis > 13), indicating a complex internal dynamic in the series that was not fully captured by the ARIMA model. Thus, while classical linear models proved suitable for describing short-term memory, they failed to provide reliable estimates of long-term dependencies and large-scale fluctuations—factors that are critical for environmental indicators with potentially fractal structures. In this context, the DFA method was chosen as more suitable for detecting long-term memory properties in non-stationary time series. Unlike traditional approaches, DFA does not require prior stationarization, is robust to trends and structural shifts, and enables direct assessment of large-scale autocorrelation characteristics. While we acknowledge the potential value of wavelet analysis as a multi-scale approach, the primary focus of this study was to evaluate monofractal properties, which are effectively characterized using DFA.
Since the emissions of pollutants were recorded directly at the coal-fired power station, it is important to determine whether these emissions impact air quality in the city of Ekibastuz. The Ekibastuz coal-fired power station is located on the northern shore of Lake Zhengeldy, 16 km north of the city of Ekibastuz [
51]. This relatively short distance indicates that emissions from the station do reach the city, as supported by previous studies on pollutant dispersion distances around coal-fired power plants [
26,
27,
28]. Analyzing and forecasting changes in emissions near the source and how these are influenced by the operational conditions of the power station makes it possible to predict their impact on urban areas through the application of dispersion models. Based on the calculation of the Hurst exponent using a 500-point window in the air pollution time series, we identified two distinct clusters: periods of persistence and periods of randomness. The operational state of the coal-fired power station alternates between these two modes. It was established that the system’s state is directly influenced by boiler load. When the system is in a state corresponding to the randomness cluster, emissions exhibit unstable fluctuations, which reflect changes in the technological operating mode. Such changes may be caused by equipment failures or maintenance work, leading to reduced boiler load and increased pollutant emissions. In contrast, under stable operation without technological disturbances, the boiler operates at full capacity, and emissions remain controlled. These findings help explain when and under what conditions the system transitions between persistent and random phases in the emission time series. Furthermore, the calculated values of the predictability index were used to fine-tune the parameters of a neural network for forecasting emission time series, offering an effective solution for air pollution monitoring. This research is discussed in greater detail in study [
49].
5.2. Limitations and Future Research Lines
Based on the results of the study, some restrictions can be formulated. The first limitation is the small dataset that has been collected and is available for analysis. The period is one and one-half years (from March 2023 to August 2024). The data were collected every 10 min, ensuring a sufficient amount of data for conducting the study and applying the DFA method. However, it would be interesting to study possible changes in the structure of the time series of air pollution indicators that were recorded in previous years. To maintain methodological rigor, long gaps in the dataset (up to 1560 missing points) were excluded from the analysis. While this preserves statistical integrity, it may omit important events such as shutdowns, malfunctions, or extreme emissions episodes, which are critical from a policy perspective.
Another limitation is that other facilities in this region can release pollutants into the air. In general, this study makes a statement about the complex environmental problems of the region where the Ekibastuz coal-fired power station is located. Accordingly, these environmental problems can be harmful to health and worsen the quality of life for the local population. Despite this, data was selected for analysis from the pipe, as well as directly from the source of emissions. Therefore, it is safe to say that the emissions of pollutants was not affected by other objects or weather conditions. However, the direction of wind propagation and the geographical features of the region in which the settlements are located can affect the concentration of pollutants at a distance from the source of emissions. The stations are located north of Ekibastuz. The prevailing southerly wind can impact the air quality in the city. Therefore, for a comprehensive analysis, it is also necessary to analyze the air directly in the city of Ekibastuz, especially when the trend of the Hurst exponent time series changes from the level of persistence to the level of randomness and in the event of a drop in the predictability index. In the future, it will be important to gain access to a larger dataset over a longer period of time, as well as from other coal-fired power stations and coal mining and consumption facilities in the region. This is the only way to conduct a comprehensive analysis of environmental problems and form recommendations for improving the environmental situation in this region.
The results obtained are important for environmental monitoring services in cities located near regions with intensive coal production and consumption, specifically, coal-fired power stations. Prompt response to violations of regulatory requirements for changes in air pollutant concentrations is key to maintaining health and a high quality of life for city residents near emission sources.
As an additional example of operational application, the predictability index can be used as a real-time signal for automated monitoring and anomaly detection in emission control systems at thermal power plants. In particular, this study proposes establishing a threshold value for the index (e.g., p < 0.1), justified through empirical analysis of the historical time series. When the predictability index drops below this threshold, it signals a transition in the time series from stable, trend-driven behavior to a noise-like, random regime characterized by the dominance of short-term fluctuations and the loss of long-term memory.
In practice, such a change may correspond to technological disturbances in boiler operation, such as transitions to low or unstable load levels, deviations from optimal combustion temperatures, or failures in flue gas cleaning systems. These events often lead to unpredictable and potentially excessive pollutant emissions that cannot be adequately captured by static forecasting models.
To implement this approach, the predictability index can be continuously computed within a moving time window using real-time sensor data streams. Such processing allows for near-instant detection of threshold crossings. Upon detection, the monitoring system can initiate a multi-level response protocol, as follows:
Automatic flagging and logging of the event in the environmental management system for regulatory reporting and audit purposes.
Sending notifications (e.g., SMS, email, or integration with SCADA) to plant operators or environmental services for immediate investigation.
Automatic adjustment of the forecasting model parameters (for example, switching to models with shorter memory or retraining on new data) to maintain prediction accuracy under changing dynamics.
Initiating diagnostic procedures to check technological parameters such as fuel quality, combustion temperature, and the effectiveness of flue gas cleaning equipment.
By defining such threshold values for the predictability index, plant operators can create emission monitoring systems that do not merely passively record data but actively detect regime changes in emission behavior. This enables preventive maintenance and supports compliance with environmental standards, reducing the risk of unnoticed exceedances of permitted emission levels.
Moreover, thanks to the high sensitivity of the predictability index to subtle changes in the statistical structure of emission data—even before large-scale exceedances occur—it can serve as an early warning system, providing time to mitigate the problem before it escalates.
Integration of this approach with existing SCADA systems or environmental decision-support platforms enhances real-time monitoring capabilities. Such a system can continuously assess the statistical predictability of emissions, dynamically adapt forecasting strategies, and generally improve the effectiveness of ambient air quality management. A promising direction for future research is refining the selection of threshold values based on historical data analysis, as well as extending the approach to multi-component scenarios using combined predictability indices or multivariate models with long-term memory.
6. Conclusions
Long-term memory was studied in the time series of air pollution indicators that were recorded at the Ekibastuz coal-fired power station (Republic of Kazakhstan) for the period from 1 March 2023 to 31 August 2024, including mass concentrations of CO, NO, NO2, SO2, PM2.5, PM10 and current mass consumption of CO, NO, NO2, SO2, dust, and NOx. For the analysis, a marked fluctuation analysis was used. Since time series exhibit consecutive spaces, and areas without gaps are of small length, this method is best suited for determining the presence of long-term memory in the time series structure. The values of the Hurst exponent and predictability index were calculated. Changes in the Hurst exponent regarding dynamics were also calculated and visualized. The dynamics of the indicator indicate a generally persistent nature of all indicators. On average, the Hurst exponent for all the time series is kept at 0.7. There are also areas of decrease in the Hurst exponent to values close to 0.5 and the predictability index to values close to 0. This means that significant emissions of pollutants occurred during the recorded periods, i.e., the influence of random factors on the time series increased. At the same time, the sensitivity of the predictability index is quite high, since a slight drop in the Hurst exponent provoked a sharp drop in the predictability index values. In general, time series are trend-resistant and can be predicted using traditional time series forecasting methods or machine learning models.
Identifying the time series plots for which the Hurst exponent is falling (analysis of the indicator of dynamics) and the predictability index is a sign of an increase in the influence of random factors on the time series. This is a sign of changes in the dynamics of pollutant release emissions and may indicate possible excess emissions that need to be controlled. Thus, the information obtained can help build air monitoring systems at coal mining and consumption facilities and metal ore processing facilities, generally ensuring effective management of facilities that may harm environmental safety and the health and quality of life of the population living near these facilities.
The dynamic analysis of the Hurst exponent for the emission time series made it possible to identify two clusters corresponding to periods of persistence and randomness in the operation of the coal-fired power station. It was found that the operational state of the system is determined by the boiler load. When the system enters a state of randomness, this typically indicates a reduction in boiler load and changes in the technological operating modes. As a result, emissions exhibit unstable fluctuations. Conversely, when the boiler operates at maximum load, emissions remain stable and are characterized as persistent, according to the DFA method. The study also demonstrated that calculating the predictability index enables the fine-tuning of forecasting model parameters for emission time series, which is crucial for developing reliable air quality monitoring systems.


 ,
, 


