Article

Assessing the Determinants of Energy Poverty in Jordan Based on a Novel Composite Index

by
Mohammad M. Jaber
1,*,
Ana Stojilovska
2 and
Hyerim Yoon
3
1
Institute of Raw Materials Preparation and Environmental Technology, Faculty of Earth and Environmental Sciences and Engineering, University of Miskolc, 3515 Miskolc, Hungary
2
Department of Government and Public Policy, Institute for Political Science, HUN-REN Centre for Social Sciences, 1097 Budapest, Hungary
3
Department of Geography, Universitat Autònoma de Barcelona, 08193 Cerdanyola del Vallès, Spain
*
Author to whom correspondence should be addressed.
Urban Sci. 2025, 9(7), 263; https://doi.org/10.3390/urbansci9070263
Submission received: 8 May 2025 / Revised: 2 July 2025 / Accepted: 4 July 2025 / Published: 8 July 2025
(This article belongs to the Special Issue Sustainable Energy Management and Planning in Urban Areas)

Abstract

Energy poverty, resulting from poor energy efficiency and economic and social barriers to accessing appropriate, modern, and sustainable energy services, remains a critical issue in Jordan, a country facing growing climate pressures, particularly given its history of rapid urbanization. This study examines energy poverty through a multidimensional lens, considering its spatial and socio-demographic variations across Jordan. Drawing on data from 19,475 households, we apply a novel energy poverty index and binary logistic regression to analyze key determinants of energy poverty and discuss their intersection with climate vulnerability. The energy poverty index (EPI) is structured around four pillars: housing, fuel, cooling, and wealth. The results show that 51% of households in Jordan are affected by energy poverty. Contributing factors include geographic location, gender, age, education level, dwelling type, ownership of cooling appliances, and financial stability. The results indicate that energy poverty is both a socio-economic and infrastructural issue, with the highest concentrations in the northern and southern regions of the country, areas also vulnerable to climate risks such as drought and extreme heat. Our findings emphasize the need for integrated policy approaches that simultaneously address income inequality, infrastructure deficits, and environmental stressors. Targeted strategies are needed to align social and climate policies for effective energy poverty mitigation and climate resilience planning in Jordan.

1. Introduction

Energy poverty broadly refers to all situations that impede households’ ability to satisfy essential domestic energy needs, thereby limiting their participation in the lifestyles, customs, and activities that constitute being part of society [1]. It is a complex phenomenon with diverse drivers and causes depending on regional and contextual factors [2], and is commonly attributed to poor energy efficiency, low incomes, and high energy costs [3]. Located in the Middle East and North Africa (MENA) region, Jordan experiences a moderate level of multidimensional energy poverty, with 18% of households facing a disproportionate burden of energy costs relative to their low income (LIHC). This rate is higher than in neighboring countries such as Egypt (8%) but lower than in Lebanon (36%) [4,5]. Previous research defines energy poverty in Jordan as a condition arising from poor energy efficiency and the presence of economic and social barriers to accessing appropriate, modern, and sustainable energy services [6]. Recent studies, particularly from the Zarqa Governorate, highlight the increasing relevance of energy poverty during the summer months [7,8]. Despite these initial findings, there is a lack of understanding of how energy poverty manifests spatially across Jordan, particularly considering the impact of various socio-demographic and infrastructural factors and the growing threat of summer energy poverty. This study adopts an operational definition of energy poverty in Jordan that centers on building inefficiency, economic hardship, and inadequate heating and cooling, emphasizing its spatial distribution and variation.
Climate change exacerbates energy poverty, with the strongest impacts expected in regions already vulnerable to socio-economic and environmental transitions. Recognizing the link between energy poverty and climate change highlights the need to determine the factors and conditions shaping energy poverty, while also providing crucial information for aligning energy poverty alleviation with climate mitigation efforts. Jordan is particularly vulnerable to droughts, which pose serious challenges for the agriculture and water sectors [9], especially in the already water-scarce southern parts of the country [10]. Climate change has direct implications for households living in these areas, which are increasingly exposed to extreme weather and higher temperatures, driving greater demand for cooling and improved housing conditions [11]. Climate change impacts the well-being of households, putting them under increased pressure to make housing, heating, and cooling investments, which underscores the importance of our study. By applying a novel energy poverty index in Jordan, we aim to identify the most predictive factors contributing to energy poverty and to inform which measures address both climate stress and energy poverty most effectively.
In this study, we examine household energy poverty in Jordan through four key pillars: housing, fuel, cooling, and a wealth index. These dimensions are closely linked to both socio-economic conditions and environmental factors, such as weather and climate. To identify the main determinants of energy poverty, we apply binary logistic regression, which allows for a comprehensive analysis of its driving factors. This study has two main objectives. First, we estimate the extent of energy poverty in Jordan using a novel approach that enhances our understanding of the issue in the context of a developing economy by incorporating a multidimensional and spatial understanding of energy poverty. Second, we use binary logistic regression to identify its key determinants in order to understand which factors have the greatest impact on energy poverty, allowing us to propose policy recommendations tailored to the Jordanian context.
Our findings reveal that energy poverty is a distinctly spatial issue concentrated in vulnerable areas where at-risk populations reside. The multidimensional energy poverty index reveals that energy poverty in Jordan is both an infrastructural and socio-economic challenge, with the northern and southern regions identified as the most affected. We also argue that these vulnerable regions are more susceptible to climate risks, highlighting the intersection between household energy access and environmental constraints. Our policy recommendations consider the spatial, socio-economic, and ecological dimensions of energy poverty in Jordan, promoting better integration of income-based, technical, and climate mitigation measures—an approach essential for designing targeted interventions.

2. Literature Review

While energy poverty is a multidimensional problem of high complexity resulting from various drivers, it is widely recognized as being tied to deprived spaces and vulnerable populations [12]. Certain socio-demographic, spatial, and built environment characteristics—extending beyond the Global North–Global South divide—predict the incidence of energy poverty and are often associated with lower levels of climate resilience. We adopt a spatial lens on energy poverty, informed by the understanding that some regions are more vulnerable because of their built environment and available infrastructure, as well as the economic and social determinants closely linked to those locations [12,13]. These spatial patterns also reflect forms of energy injustice, given the close interconnection between justice and space [14].
The spatial dimension of energy poverty (and climate vulnerability, which is defined as the sensitivity of a system to climate variations [15]) is critical for identifying vulnerable spaces and populations. In an environmental context, the placement of energy infrastructure often disproportionately affects vulnerable groups [16]. Spatial factors, along with racial or ethnic segregation, co-shape the experience of energy poverty [17]. However, location is also linked to access to services. For instance, geographic space influences the ability to obtain something, such as access to welfare rights [18]. Space thus plays a crucial role in predicting energy poverty and injustice, and it is also closely tied to other socio-demographic characteristics that heighten vulnerability [19,20], thereby creating vulnerable spaces of energy deprivation. Importantly, the climate adaptability of populations living in such spaces is also limited, for instance, because of precarious labor conditions [21].
The classical triangle of energy poverty drivers—namely, energy prices, the energy efficiency of dwellings, and household income—has long been used as a basis for predicting and detecting energy poverty [22,23]. Among these categories, housing is one of the most complex to address because of the wide variety of housing arrangements, including ownership, size, location, type, and quality. From a spatial perspective, a home’s size and energy efficiency are critical factors in determining energy poverty risk [24,25]. Additionally, the type of heating is also related to energy poverty, especially the use of fuelwood in rural and remote areas, where it is the most affordable and accessible fuel [26]. More recently, the concept of summer energy poverty has expanded our understanding of under-cooled living spaces, which pose severe risks for vulnerable groups, such as the elderly [27].
Income and other socio-demographic features also affect energy poverty outcomes, as households with more resources are more likely to implement energy efficiency measures or undertake other reforms to protect themselves from energy-related risks [28]. Housing, fuel, and cooling—key spatial dimensions of energy poverty—are closely connected to climate change and mitigation policies. These factors increase the need for heating or cooling, requiring investments in efficient housing to prevent a worsening state of energy vulnerability [29]. In this study, we provide an overview of some of the most relevant determinants of energy poverty, such as sparsely populated areas, reliance on traditional energy sources, and essential socio-demographic variables such as education, income, and gender, which form the basis for understanding the multidimensional energy poverty profile of Jordan.
Sparsely populated areas are often associated with higher levels of both energy and transport poverty [30,31]. The latter refers to inequalities related to transport and access, including the unaffordability of transport costs [32]. Poorer energy infrastructure and a higher concentration of elderly residents in such areas help explain the greater incidence of energy poverty [33]. Consequently, in the Global South, these areas are frequently prioritized for renewable energy projects aimed at electrification and the development of basic infrastructure [34]. Limited infrastructure restricts access to modern energy sources, leading rural populations to rely on traditional fuels such as fuelwood. This often results in spatially limited heating practices—for example, heating only part of the home [35]. Furthermore, inhabitants of rural and sparsely populated areas often rely on fuelwood as a coping strategy to alleviate more severe forms of energy poverty [36,37]. These remote rural regions are particularly vulnerable to both energy and transport poverty due to a combination of disadvantages such as population decline, deteriorating living standards, and increased dependence on cars [38,39]. In addition, such areas are frequently more exposed to extreme events caused by climate change [40].
Energy poverty is commonly associated with income poverty. Low-income households are more likely to experience energy poverty across various contexts [41,42,43]. However, some scholars argue that income should not be considered in isolation, but rather in conjunction with other social and health-related factors that contribute to energy poverty [44]. Income distribution also has a spatial dimension, as low-income households are more likely to reside in peripheral locations, as seen in Japan [45]. In Spain, regions with net incomes below the national average are more vulnerable to energy poverty; however, factors such as colder winters, hotter summers, and low energy efficiency also exacerbate the issue [22]. In Jordan, significant inequality exists between rural and urban areas, with even greater disparities across governorates, where the capital, Amman, is the wealthiest region [46]. These inequalities influence how energy poverty is experienced and the degree to which populations can cope with climate-related risks, as individuals affected by poverty are particularly vulnerable to the impacts of extreme events, such as floods and droughts [47].
Household energy choice is a major factor shaping the experience of energy poverty. Previous studies have shown that households often become locked into certain fuel types, such as fuelwood or central heating systems, making it harder to escape energy poverty. Scholars have contributed several conceptual models to understand household fuel choices. The energy ladder model, for example, describes the transition of household energy use in developing countries based on fuel choice for heating, cooling, lighting, and cooking [48]. According to this model, energy choices shift in a linear progression from primitive, unhealthy sources based on solid fuels and biomass (e.g., fuelwood, agricultural, and animal waste), to transitional fuels (e.g., charcoal, kerosene, and coal), and finally to modern and clean sources (e.g., electricity, natural gas, and biogas) as households gain the economic means to afford more expensive fuels. A household’s socio-economic status is a key determinant in this model.
However, this linear interpretation of energy transition has increasingly been challenged. Studies underscore that household energy transitions are far more complex and context-dependent [49,50,51]. In countries such as Mexico, households often rely on multiple fuel types simultaneously—a behavior known as fuel stacking. This strategy enables households to maintain access to preferred fuels (e.g., gas for cooking) while preparing for contingencies such as income variation or unreliable modern energy supply (e.g., keeping a kerosene heater for use during periods of high gas prices or supply disruptions). Empirical research also identifies stacking-up-the-ladder behavior—a mix of upward transition and continued reliance on multiple fuel types [49,52,53]. Thus, household fuel choices depend on socio-economic progress and are shaped by contextual factors such as affordability, accessibility, available technology, geographic conditions, and personal or cultural preferences.
Today’s household energy landscape typically reflects a combination of traditional, transitional, and modern fuel types used for different services. For instance, in Jordan in the early 2000s—despite having near-universal electricity access and being classified as an upper-middle-income country—around 61% of households still relied on kerosene for space heating [8]. Additionally, climate change can influence fuel choices, as extreme events such as floods or landslides may disrupt electricity access, increasing reliance on traditional fuels [54].
Education plays a significant role in mitigating energy poverty. Its contribution to energy transition is well acknowledged; with appropriate training and awareness, it is possible to accelerate household shifts toward cleaner and healthier energy sources [50]. Households with higher levels of education are more likely to adopt cleaner energy mixes, whereas those with lower levels of education tend to rely on more polluting fuels, contributing to higher emissions and indoor pollution [52,55]. In fact, education appears to have a greater influence on reducing energy poverty than income alone [56]. Conversely, electricity access itself enhances educational opportunities, particularly for children and women, by reducing the time spent on fuel collection and enabling study after dark [56]. Households affected by energy poverty and experiencing low thermal comfort often show lower educational attainment and deteriorating health conditions [57,58]. This reinforces a vicious cycle, where households with lower education levels are more likely to become low-income households, face reduced affordability, and remain vulnerable to energy poverty [59]. Moreover, educational disadvantage is associated with increased mortality and morbidity during extreme events, such as heatwaves [60].
Gender has also gained rightful prominence in energy poverty research. Women and women-headed households are more likely to experience energy poverty [61,62], although the nature of these challenges varies by region. In the Global South, women often face severe health risks because of prolonged exposure to biomass smoke during cooking, along with the psychological burden of fuel-related responsibilities [63]. In the Global North, elderly women are particularly vulnerable to cold-related mortality [63]. Energy poverty is gendered, as it disproportionately affects those with caregiving responsibilities and individuals who spend more time at home, most often women [64]. Thus, gendered dimensions of energy poverty reflect broader structural inequalities that women face in society [65]. Furthermore, women are more vulnerable to the impacts of climate change, which intensifies challenges related to food production, water access, and energy availability for heating and cooking, thus increasing both the financial and physical burdens on women [66].
To capture the multidimensional nature of energy poverty in Jordan, we propose a novel energy poverty index (EPI) that integrates housing characteristics (such as the energy efficiency of the dwelling), access to heating fuels (including the type of fuel used), the availability of cooling appliances, and household wealth status. This index is applied at the regional level (governorate level) to reflect spatial variations and population density. In addition, we assess the impact of key socio-demographic variables, such as gender, education level, age, and other relevant factors. This composite approach allows us to capture the intersection of infrastructural, climatic, and socio-economic factors influencing energy poverty, as illustrated in Figure 1. While the index does not directly include climate-related variables, it is conceptually grounded in the broader context of climate change, specifically, in recognizing how climate impacts can exacerbate energy poverty and how mitigation policies can either alleviate or intensify household vulnerability.

3. Materials and Methods

Energy poverty is a multidimensional issue, and a composite indicator is necessary to understand this complex problem better [4,23,67,68,69,70,71]. In this paper, we use EPI to refer to our energy poverty index, which is calculated at the household level. Then, different econometric methods are applied to show geographical and demographic differences in Jordan. The method of building our composite index is based on the instructions given in the OECD handbook on constructing composite indicators [72].

3.1. Variables and Data

Data from the Demographic and Health Surveys (DHS), conducted by the Jordanian Department of Statistics (DOS) [73], forms the basis for this analysis. Funded by the United States Agency for International Development (USAID), the DHS Program aims to provide high-quality data to support the planning, monitoring, and improvement of population, health, and nutrition programs. Conducted across many countries, DHS surveys gather extensive information on household health, fertility, and socio-economic conditions, offering comprehensive insights into housing characteristics, household assets, and individual household members. The dataset also includes various indicators relevant to multidimensional energy poverty. DHS surveys use a two-stage stratified cluster sampling design, first selecting enumeration areas (EAs) with probability proportional to size, then randomly sampling households within the chosen EAs to ensure national representativeness (often including urban/rural and regional levels), in which sample weights are adjusted for different selection probabilities and non-responses [74]. As a nationally representative survey, these collected data are provided in raw format, allowing for detailed analysis and the application of indicators at sub-national levels. This study uses the most recent DHS survey from 2023. As outlined in the conceptual framework, the developed index is organized around four pillars, with three encompassing multiple variables. Table 1 provides more details on the variables used and their estimation.
Score components were classified according to their specifications of modernity, efficiency, and cleanliness. The housing score has three weights, with 1 representing the worst and 3 indicating the best. Regarding fuels used at home, we utilized the energy ladder theory and categorized the fuel types into traditional, transitional, and modern based on their energy efficiency and environmental/health impacts. For cooling, the questions focused on ownership, where a positive response was assigned a value of 1 and a negative response received a value of 0. Last, the wealth index is classified from the poorest to the wealthiest, and we maintained this classification. Table 1 provides more details on the EPI pillars as conceptualized in our study.

3.2. Descriptive Statistics of the Variables Used to Build the EPI

3.2.1. Housing Score

Building materials in Jordan exhibit a strong preference for modern construction options, as shown in Table 2: tiles (60.7%) dominate floors, cement bricks (41.7%) are used in walls, and concrete (90%) is overwhelmingly favored for roofs. Traditional materials such as earth/sand or mud bricks are used minimally, reflecting a shift towards durable, contemporary building practices likely driven by resource availability and the urban or semi-urban context of the study area.

3.2.2. Fuel Score

Table 3 shows a reliance on modern energy sources, with piped natural gas as the primary cooking fuel (96.8%), electricity nearly universal for lighting (99.2%), and liquefied petroleum gas (LPG) leading among heating fuels (58.5%). Traditional fuels such as wood or charcoal are rarely used, suggesting a robust energy infrastructure and a modernized lifestyle among the sampled households, though preferences for heating fuels show some diversity.

3.2.3. Cooling Score

The cooling mix in Table 4 shows that fans are owned by 88.1% of households, far outpacing air conditioners at 35.9%, indicating fans as the predominant and more accessible cooling method. This disparity likely stems from economic or climatic factors, positioning fans as a practical and sufficient solution for most households in this study’s population.

3.2.4. Wealth Index

The DHS wealth index is a composite measure of a household’s relative economic status, based on ownership of assets (e.g., radio and bicycle), housing characteristics (e.g., floor material and water source), and access to utilities. It is constructed using principal components analysis to assign each household a score, then ranked and grouped into five equal-sized wealth quintiles (poorest to richest) [74].
Table 5 reveals a skewed distribution in wealth index, with 30.4% of households in the poorest category and 21.7% in the poorer category, together comprising over half the sample (52.1%). The middle, richer, and richest quintiles account for 19.6%, 17.5%, and 10.7%, respectively, highlighting significant economic disparities that may influence housing quality, energy access, and cooling preferences observed in these data.

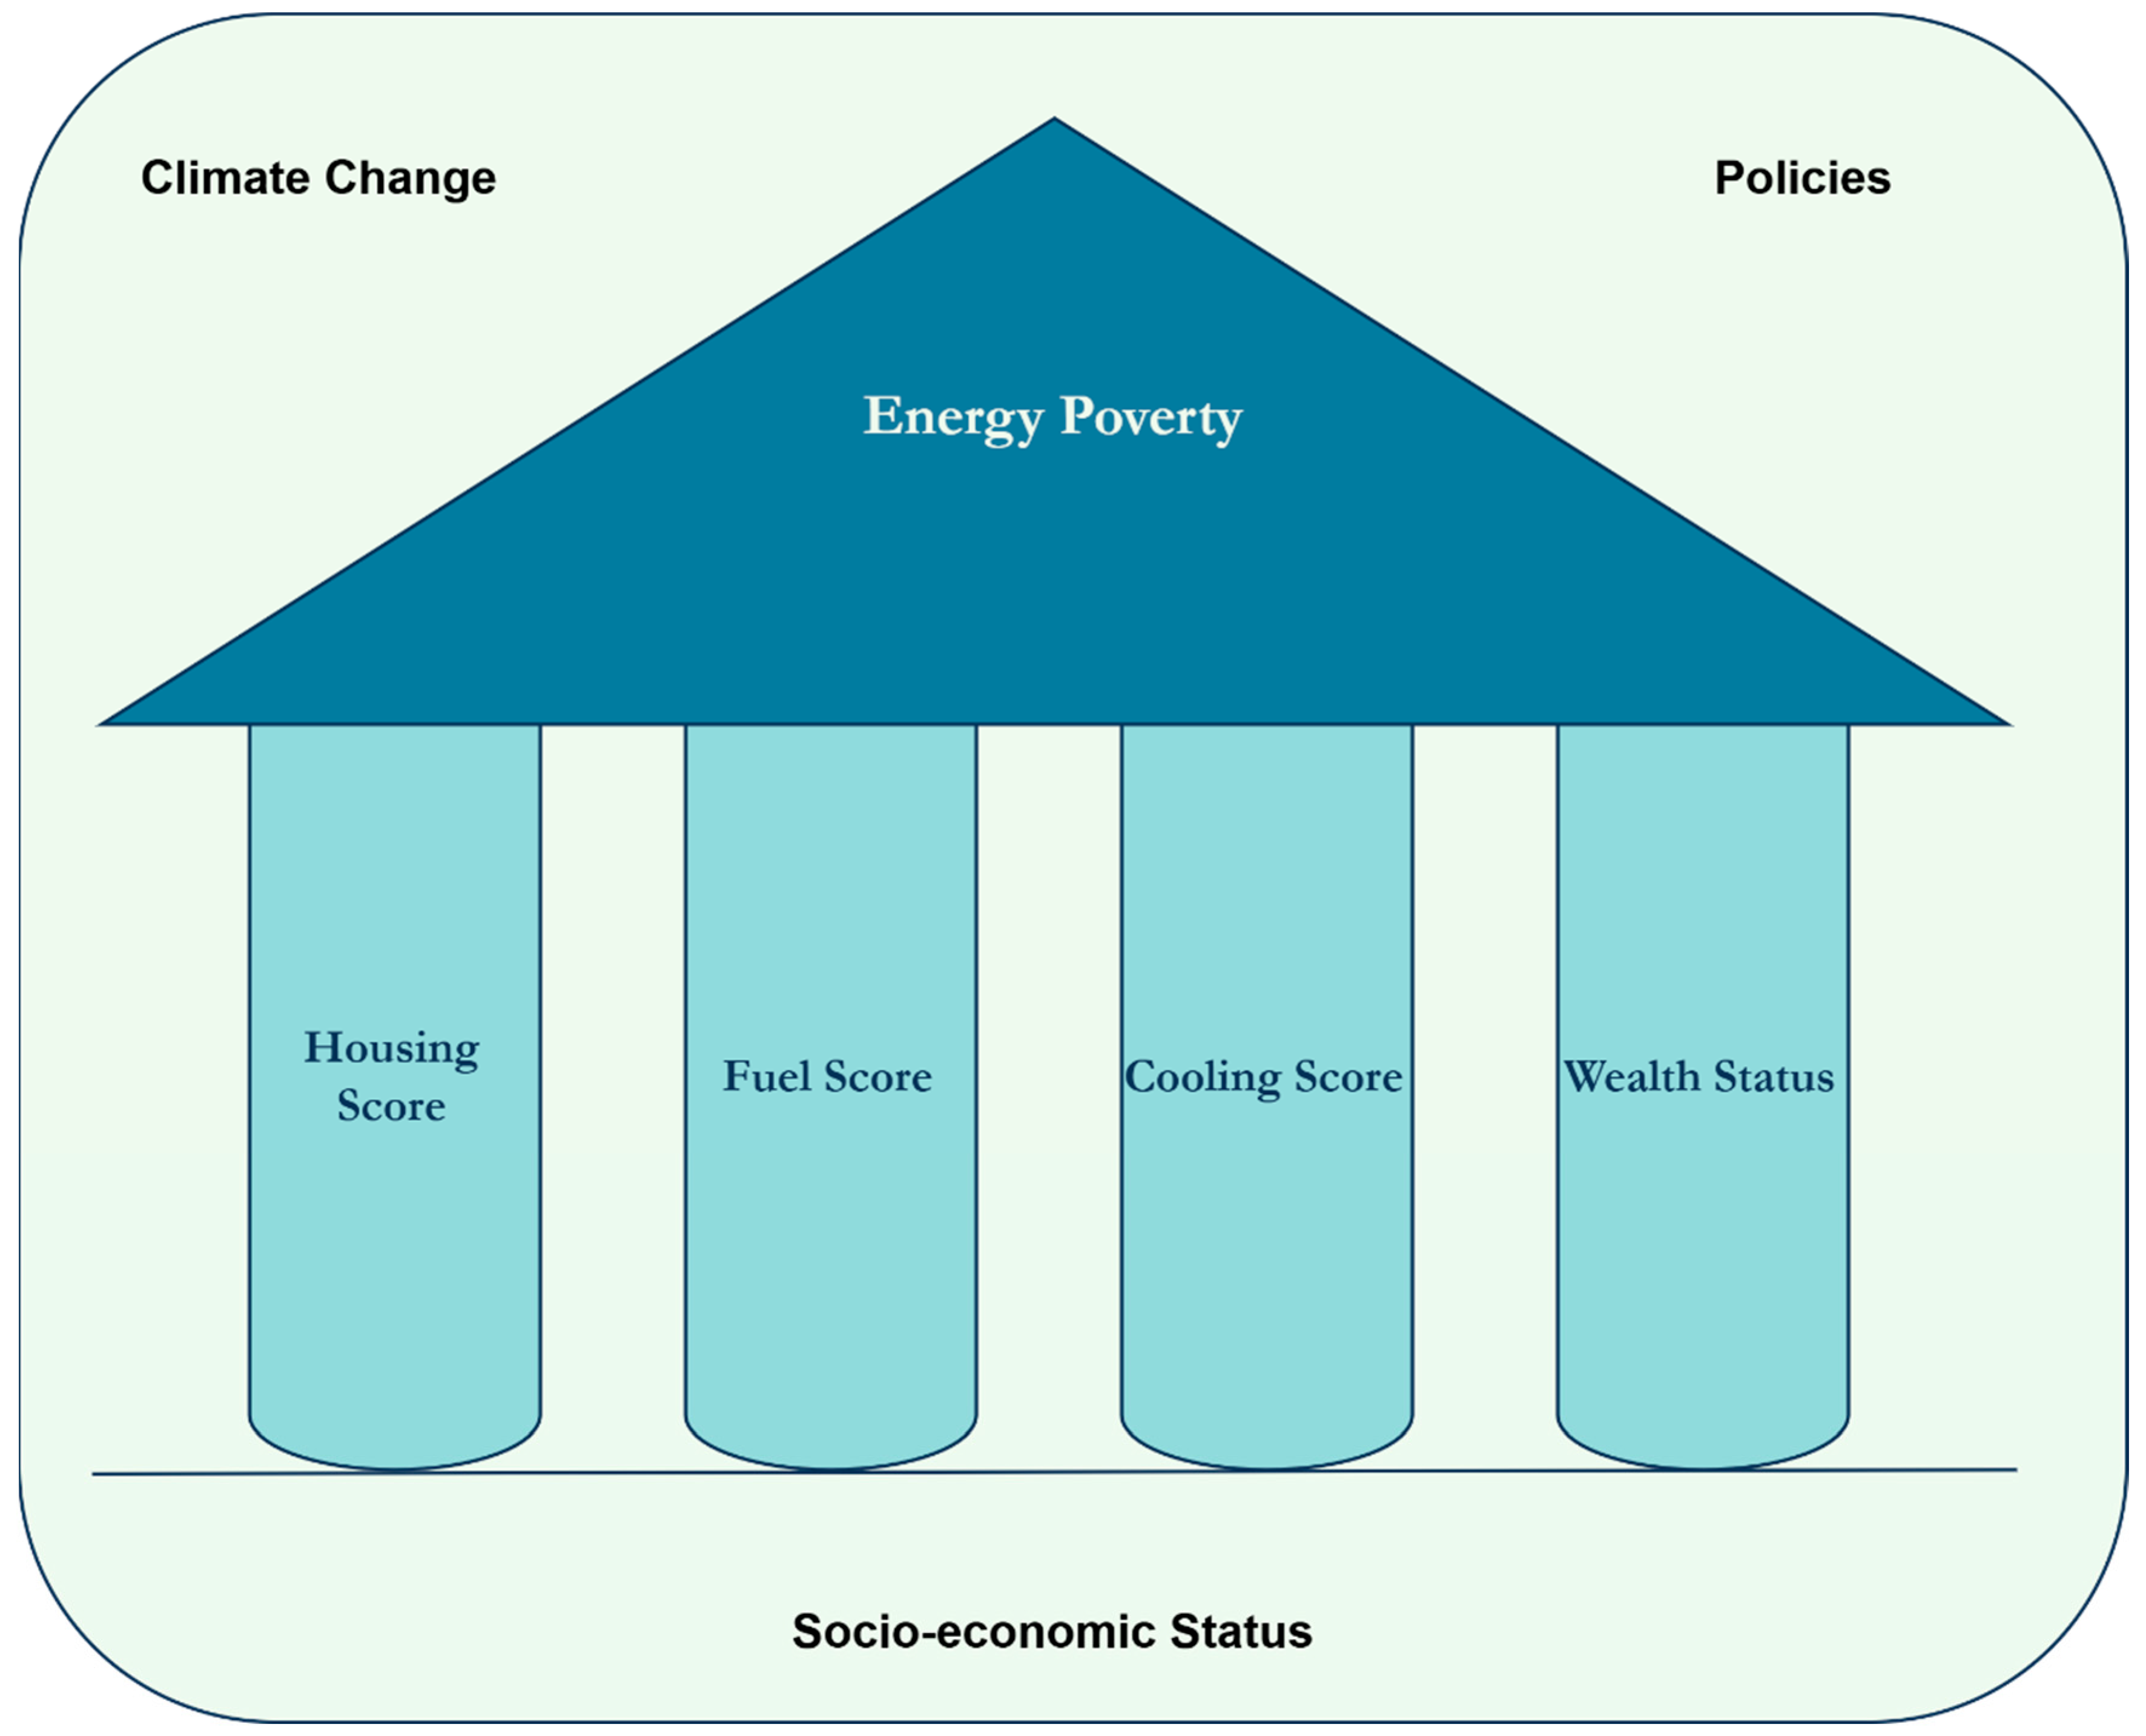
3.3. Energy Poverty Index (EPI)

To calculate the EPI, we start by aggregating the scores. We first classify these data into different groups; the housing score is built using three indicators, and these indicators are grouped into three categories based on their energy and material efficiency from 1, the lowest, to 3, the highest. The same applies to the fuel score, where we use the energy ladder theory to group fuel types into three categories, as shown above. The cooling score is built using only two variables with a yes or no value. Last, the wealth index is a proxy for income levels and has five variables. The scores for each house are calculated according to the following:
H S = M a i n   f l o o r   m a t e r i a l + M a i n   w a l l   m a t e r i a l + M a i n   r o o f   M a t e r i a l 3
F S = T y p e   o f   c o o k i n g   f u e l + T y p e   o f   f u e l   f o r   h e a t i n g + T y p e   o f   l i g h t   a t   h o m e 3
C S = A i r   c o n d i t i o n e r + F a n 2
After calculating the scores, we normalize them because they have different ranges to simplify the calculation and make it more precise. We use a simple normalization method:
N o r m a l i z e d   s c o r e = O b s e r v e d   s c o r e M i n   s c o r e M a x   s c o r e M i n   s c o r e
Finally, assuming equal weights for all scores, we calculate the EPI using the following formula:
E P I = 1 N H S + N F S + N C S + N W S 4
where N refers to “Normalized values”.

3.4. Binary Logistic Regression

Logistic regression is a widely recognized technique for analyzing energy poverty, especially when the dependent variable is binary, making it suitable for the indicators evaluated in this study [8,68,75,76]. This method constructs a statistical model to estimate the likelihood of a categorical outcome based on one or more predictor variables, which may be either continuous or categorical [77]. While logistic regression shares similarities with multiple linear regression, it differs in that the outcome variable is dichotomous rather than continuous [77].
Binary logistic regression builds upon the principles of linear regression [77]. Instead of estimating the change in a dependent variable EPI as a result of predictor variables X, it calculates the probability of EPI occurring given specific values of X or a set of predictors (Xs).
The logistic regression model is represented as follows:
P E P I = 1 1 + e ( b 0 + b 1 X 1 i + b 2 X 2 i + + b n X n i )
where P(EPI) denotes the probability of EPI occurring, e is the base of the natural logarithm, and b represents the regression coefficient associated with each predictor variable X.
Logistic regression results are typically presented using odds ratios, displayed under Exp(B) in the output tables. These odds ratios allow for comparing the likelihood of the outcome variable across different groups of predictors.
To perform the logistic regression in our model, we set a cutoff value equal to the mean value of energy poverty in Jordan. Based on the results discussed below, households with an energy poverty index higher than or equal to 0.3 are considered affected by energy poverty and take a value of 1, while households with an index less than 0.3 take a value of 0. After preparing the dataset with binary data, we analyzed several socio-economic factors.

4. Empirical Results

4.1. EPI Pillar Correlations

After calculating the scores for each pillar of household energy poverty, we checked the correlations. The results in Table 6 indicate that correlation relationships are significant; however, Pearson coefficients are low, which means that multicollinearity does not exist between the scores.

4.2. EPI

The estimation of the energy poverty index (EPI) for Jordan reveals an average score of 0.3. Using this value as a threshold, approximately 51% of households exhibit an EPI equal to or greater than the national average, while 49% fall below it. Notably, some households experience no energy poverty at all (EPI = 0), whereas the maximum observed EPI is 0.96, indicating that certain households face challenges across all key dimensions of energy poverty included in the analysis. Further descriptive statistics and distributional details are provided in Table 7.

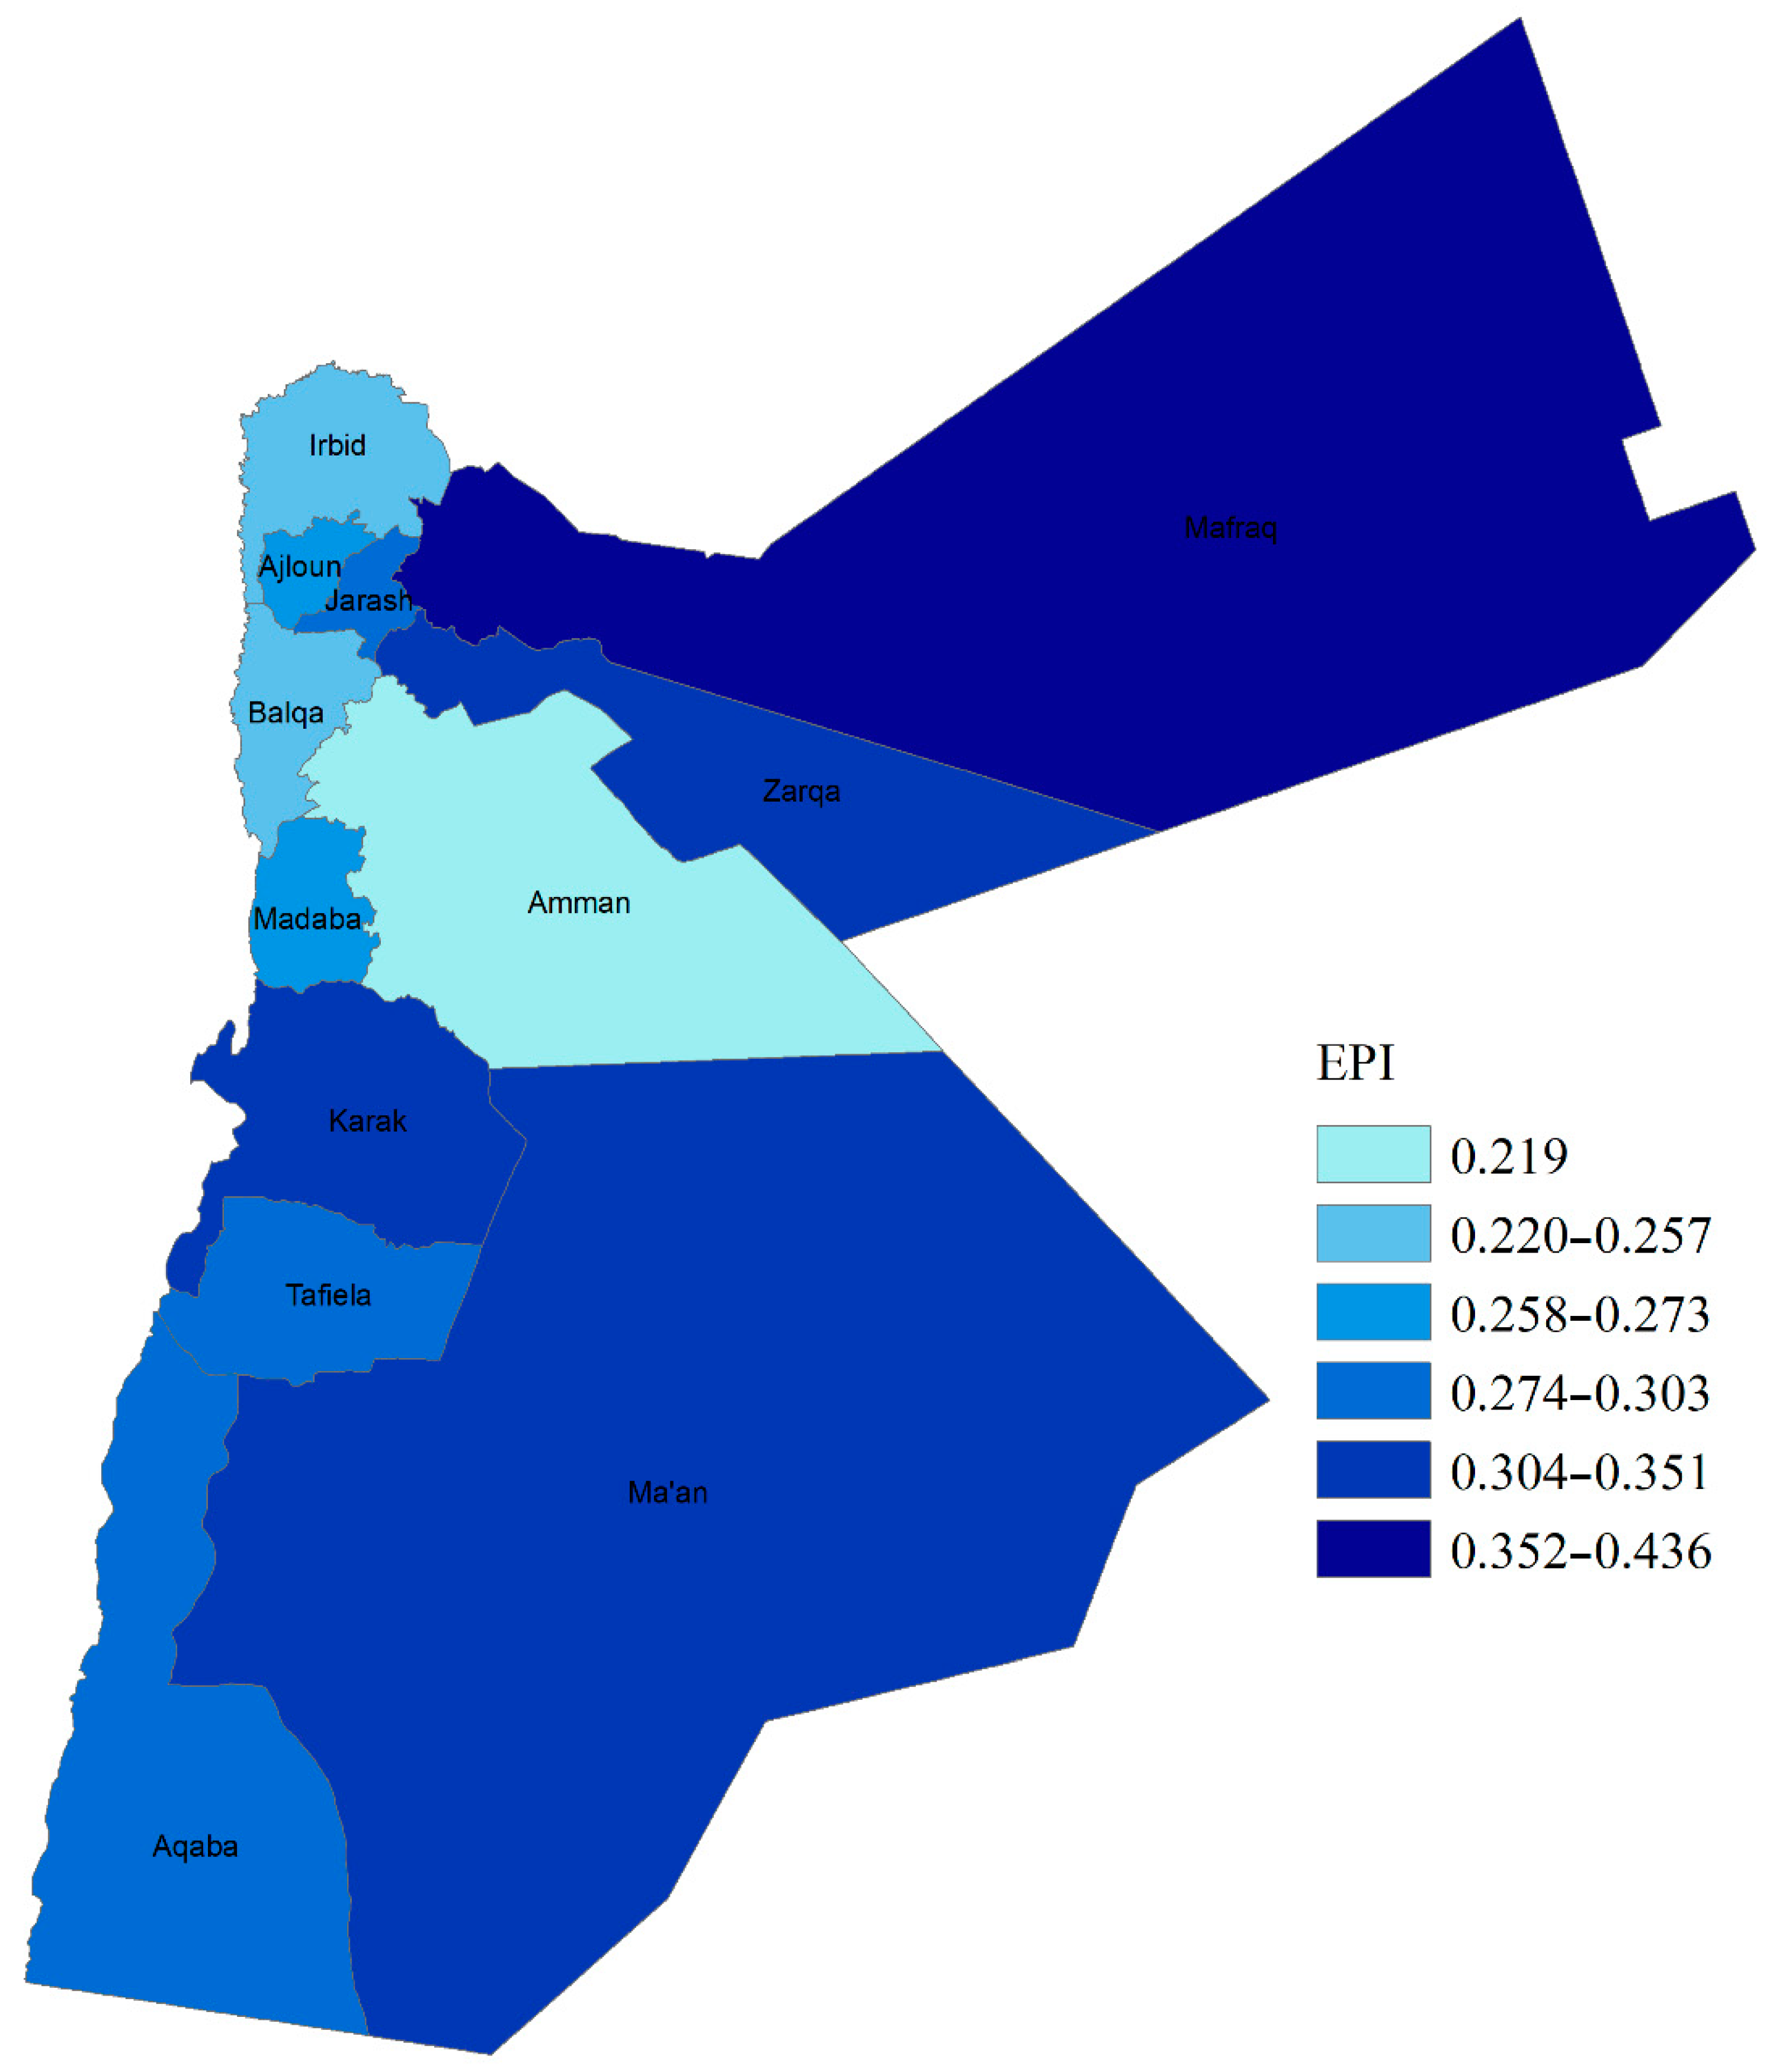
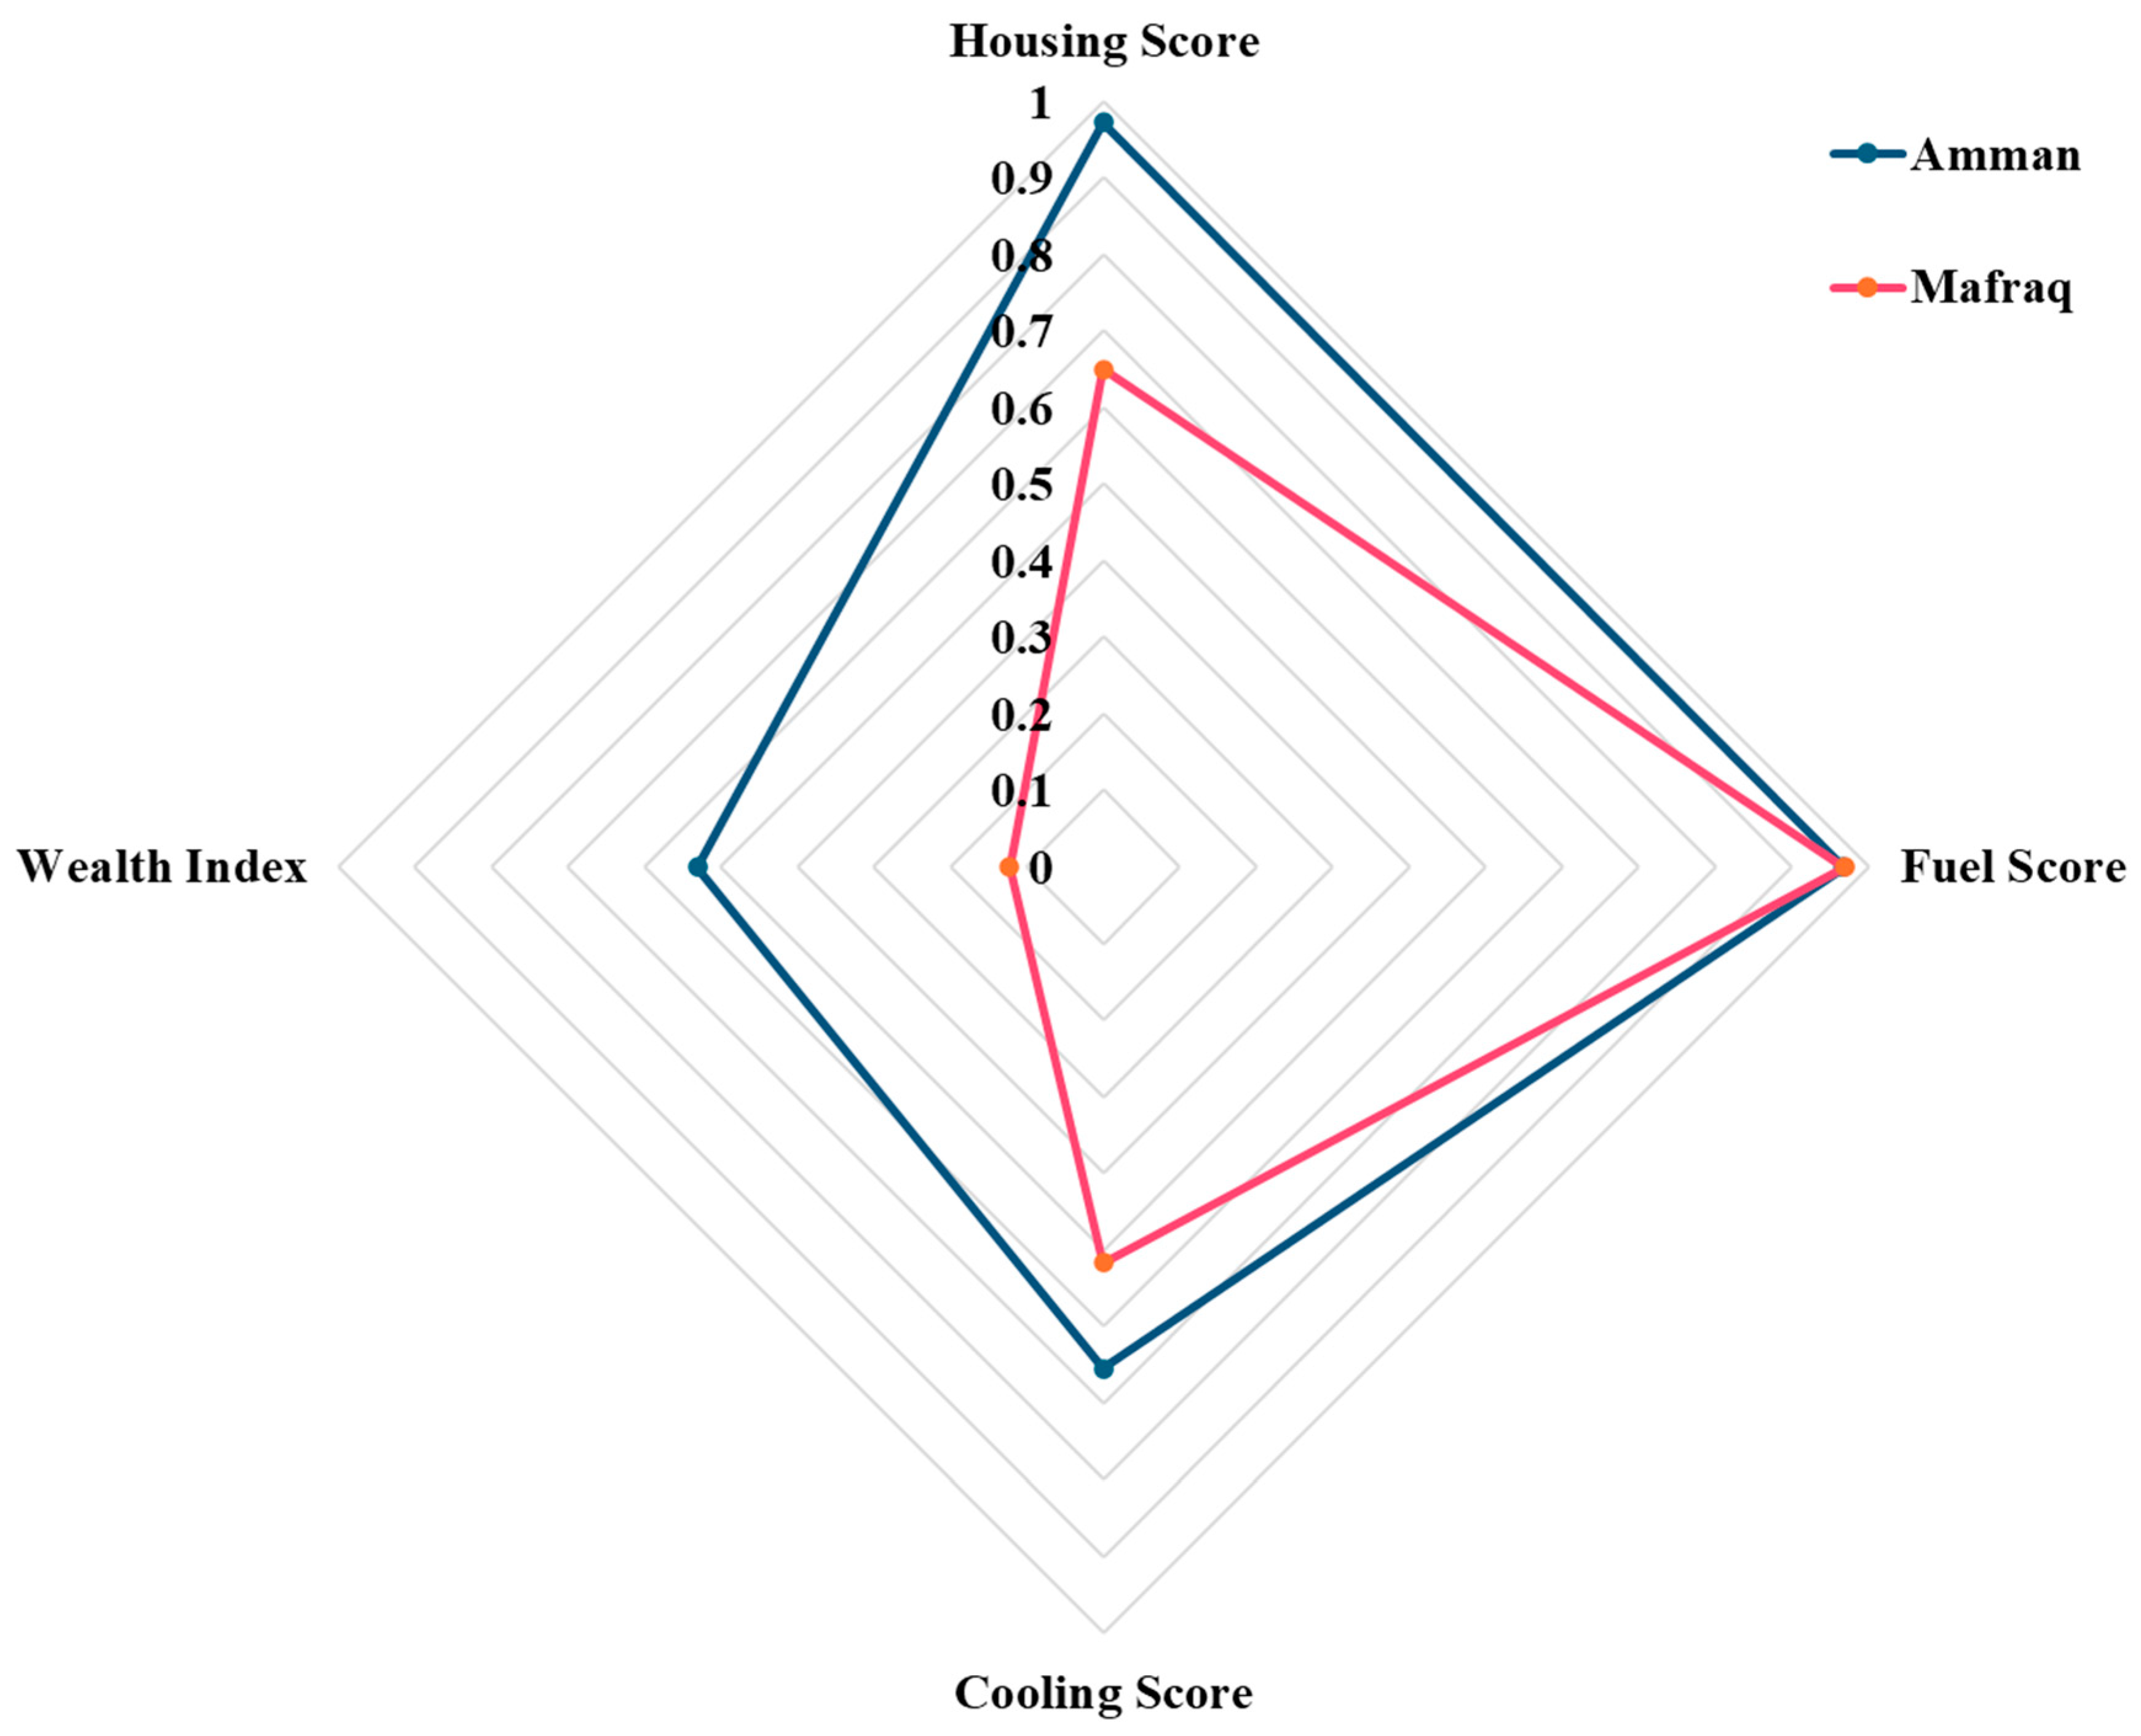
4.3. ANOVA Results and Regional Distribution of EP

One-way ANOVA was conducted to examine whether EPI differs significantly across the regions of Jordan. The results in Table 8 indicate a statistically significant difference in the mean EPI across the 12 governorates, rejecting the null hypothesis that energy poverty levels are the same in all regions. The between-group variation accounts for approximately 12.6% of the total variation in EPI, suggesting that the region of residence has a moderate effect on energy poverty in Jordan.
The geographical distribution of energy poverty is illustrated in Figure 2, revealing that five regions out of twelve in Jordan have energy poverty higher than the average (0.3). Compared with previous results [4], we detect similarities in energy poverty in Jordan, where the Mafraq region retains the highest energy poverty levels in Jordan (0.44) in all studied years, even when different indicators are used. This is followed by Zarqa (0.35), Karak (0.33), Ma’an (0.33), and Tafiela. The rest of the regions experience energy poverty less than the average.
To examine the main differences in energy poverty between Amman and Mafraq, which represent the lowest and highest levels of energy poverty, respectively, the radar chart in Figure 3 illustrates that households in Amman exhibit better housing efficiency and superior building materials. Furthermore, families in Amman are, on average, wealthier than those in Mafraq, with wealth scores nearly four times higher (Amman: 0.53; Mafraq: 0.12).
Interestingly, both regions display a similar fuel score, suggesting that the transition to cleaner fuels is occurring consistently across Jordan. However, in light of their lower wealth status, families in Mafraq may struggle to meet their fuel needs despite access to cleaner options.
Last, in terms of cooling, households in Amman tend to own multiple cooling devices, while those in Mafraq appear to rely primarily on a single device, reflecting greater difficulty in meeting cooling needs.

4.4. Sensitivity Analysis

In our calculated EPI, we initially assigned equal weights to all dimensions. However, to assess the model’s robustness, we conducted a sensitivity analysis. The primary version of the index assumes equal weighting, meaning that each dimension contributes equally to the overall estimation of energy poverty.
To test alternative weighting schemes, we constructed four additional scenarios, each assigning a weight of 0.4 to one specific dimension while fixing the weights of the remaining dimensions at 0.2.
The Spearman’s rank correlation coefficients, as presented in Table 9, indicate a strong positive correlation across all scenarios. This suggests that the EPI results are robust to changes in weighting, and the overall ranking of households remains consistent despite varying the emphasis on different dimensions. Notably, the strongest relationship is observed between EPI S1 and EPI S2 (0.990), while the weakest is between EPI S4 and EPI S5 (0.954). Furthermore, the relationships can be ranked as follows: EPI S1 and S2 > EPI S1 and S4 > EPI S1 and S3 > EPI S2 and S4 > EPI S2 and S3 > EPI S3 and S5 > EPI S4 and S5. This ranking reflects the robustness and alignment of the scenarios, with slightly lower correlations involving scenarios such as EPI S5, which prioritize cooling over other dimensions.

4.5. Determinants of Energy Poverty in Jordan

In Table 10, the chi-square statistic of the model suggests that it is statistically significant, indicating a meaningful relationship between the predictor variables and the EPI. The −2 log-likelihood value demonstrates that the model provides a good fit to these data. Additionally, Nagelkerke’s R-squared value indicates that the model accounts for 43.8% of the variance in the dependent variable. Finally, the results of the Hosmer and Lemeshow test confirm that the logistic regression model adequately represents the observed data.
The results of the binary logistic regression, as presented in Table 11, indicate several significant predictors of energy poverty in Jordan. First, household size plays a notable role: for each additional household member, the likelihood of experiencing energy poverty increases by 10.33%, compared with smaller families.
Geographic location also strongly influences energy poverty risk. Households located outside the capital, Amman, are significantly more likely to experience energy poverty, particularly those in the northern and southern regions. For example, families residing in Karak are 36.62% more likely to live in energy poverty than those living in Amman.
Gender of the household head is another key factor: female-headed households are 12.71% more likely to experience energy poverty than male-headed households. Notably, 17.1% of the surveyed households are headed by women.
Financial inclusion was measured by proxies such as having a bank account, which appears to mitigate energy poverty. Households where the head has a bank account are 2.52% less likely to be energy poor compared with those without access to formal banking.
Concerning age, as the age of the household head increases, the probability of experiencing energy poverty decreases by 9.87%, indicating a protective effect of age, possibly related to accumulated assets or experience.
The type of housing unit is a major determinant. Compared with those living in apartments, households residing in family houses are 16.95% more likely to experience energy poverty. Those in huts or barracks are 1078.46% more likely, reflecting extreme deprivation and lack of basic infrastructure. On the other hand, households in villas are 2.38% less likely to be energy poor compared with those in apartments.
Finally, the education level of the household head plays a critical role. Compared with the non-education/preschool category, higher levels of education are generally associated with a lower probability of experiencing energy poverty, reaffirming the role of education in enhancing household resilience.

5. Discussion

We used a new and comprehensive energy poverty index to assess the level of multidimensional energy poverty in Jordan by including housing, fuel, cooling, and wealth status as factors. This approach was driven by the lack of detailed research on energy poverty in Jordan, particularly concerning cooling, which is becoming more critical because of climate change. Conceptually, our framework emphasizes the spatial aspects of energy poverty and the interconnectedness of vulnerable areas and populations. We also considered the expanding literature on how climate vulnerability is manifested spatially to better understand the variables relevant for determining energy poverty in Jordan.
The analysis has confirmed the severe manifestation of spatial energy poverty in Jordan, with regions further from the capital, especially in the north and south, experiencing deeper levels of energy poverty. These remote regions are less populated with subsequent lower economic intensity and face limited access to energy services. This finding aligns with the existing literature, where such remote rural areas represent their unique eco-systems of functionality embedded in their dependence on their environment, such as reliance on fuelwood and resistance to changes in heating practices [78]. These regions are also more vulnerable to energy price increases because of restricted energy supply options [79], which highlights the importance of developing spatially tailored plans [80].
Based on the effects of the tested pillars, energy poverty emerges as both an infrastructural and socio-economic challenge, with the housing, cooling, and wealth scores contributing most significantly. This finding supports previous research emphasizing the importance of the built environment and income in determining energy poverty and climate resilience [81,82]. It also highlights cooling as an increasingly critical and emerging dimension of energy poverty, particularly under growing climate pressures.
Overall, energy poverty can be understood as a condition of precarity affecting specific spaces and populations [83], reinforcing its spatially uneven character in the context of Jordan. In particular, larger and less energy-efficient dwellings are more difficult to keep thermally comfortable, increasing the risk of energy poverty.
The index identifies vulnerable groups most at risk: large families, female-headed households, and individuals with lower levels of education. As such, energy poverty may be conceptualized as a form of spatial and technological vulnerability, where reliance on outdated infrastructure and energy systems intensifies hardship for already marginalized populations [84]. This further entrenches inequality, revealing how technological deprivation intersects with socio-spatial disadvantage [84].
The interconnectedness between vulnerable populations and vulnerable spaces highlights a more acute and entrenched form of energy poverty, shaped by path dependencies rooted in infrastructure, socio-economic inequalities, and institutional legacies. These dimensions often reinforce one another, deepening existing vulnerabilities. This finding aligns with other research on multidimensional energy poverty, particularly in the Global South, where energy poverty is typically more intense and complex [85,86]. Factors such as lack of electricity access, absence of private transport, and limited access to heating or cooling appliances contribute significantly to the multidimensional nature of energy poverty [87,88].
In tropical and coastal regions, especially in the Global South, poor transport accessibility, limited electricity coverage, and heightened exposure to extreme heat further exacerbate the problem [89,90,91]. In the case of Jordan, a distinctive profile of energy poverty emerges: low-income, female-headed, large households with lower levels of education, residing in inefficient and spacious dwellings located in sparsely populated areas lacking adequate cooling infrastructure. These households face compounded disadvantages that make it particularly difficult to escape energy poverty.
Energy poverty is therefore co-constructed by a confluence of structural and identity-based factors—infrastructure, housing conditions, gender, education, and spatial marginalization—making infrastructure a key lever for transformative change [92]. The way policies respond to these intersecting vulnerabilities is critical. If these energy poverty profiles are ignored or misrepresented in energy or climate policy, this may result in the reproduction and institutionalization of domestic energy vulnerability [93].
Despite the strengths of our approach, there are limitations. The quantitative design of our study does not fully capture the underlying reasons behind high EPI scores. Future research should aim to investigate the lived experiences of households facing energy poverty, particularly to discern whether energy deprivation is due to economic constraints, cultural preferences, or technical limitations (e.g., reliance on traditional fuels or minimal use of cooling technologies by choice or necessity). Moreover, the availability of survey data constrained the selection of socio-economic variables. While the analysis conceptually integrates climate change by linking sectoral vulnerabilities to climate risks, climate change was not directly measured within the EPI. Therefore, future studies should explore more explicit integration of climate indicators in the construction of energy poverty indices.

6. Conclusions

Based on the novel composite multidimensional energy poverty index, energy poverty in Jordan is a spatial phenomenon, manifested in vulnerable spaces where vulnerable populations live, areas that are also more likely to be exposed to heightened climate change risks.
The intersection of vulnerable spaces and vulnerable populations affected by energy poverty in Jordan provides a framework for developing targeted policy interventions. The spatial dimensions of energy poverty enable the identification of which regions to target while also accounting for the vulnerability of residents in those locations [94]. The multidimensional energy poverty index revealed that the most vulnerable energy poverty regions in Jordan are its northern and southern parts, providing relevant information for policymakers about regions in need of policy support. To address the spatial, socio-economic, and ecological dimensions of energy poverty in Jordan, there is a need for greater cohesion among income-based, technical, and climate mitigation measures. In this context, investment in efficient housing is of utmost importance to counterbalance the need for increased heating and cooling and to provide healthier and more comfortable homes in any season [29]. Based on the results from the index, priority should be given to households living in large dwellings with lower energy efficiency.
Climate mitigation policies, if aligned with the priority regions and areas that need attention from an energy poverty perspective, will ensure the development of climate- and energy-poverty-resilient communities. Jordan receives significant international funding and assistance to bolster climate resilience, improve energy access, and promote urban sustainability, which can be used to create cohesive approaches. For instance, the Green Climate Fund (GCF) focuses on boosting energy efficiency and broadening renewable energy access [95], while the Building Resilience to Cope with Climate Change (BRCCJ) program supports communities that lack energy access [96]. The EU’s Green Economy program also supports Jordan’s transition to cleaner energy, energy efficiency, and renewable energy development, aiming to reduce reliance on fossil fuels [97]. Moreover, the Ministry of Planning and International Cooperation provides loans for solar energy initiatives, rural electrification, and energy efficiency projects [98,99]. These efforts reflect broader trends across the MENA region that increasingly advocate for renewable energy policies and strategies because of favorable climate conditions, recognizing the benefits of energy transition while addressing energy poverty [100,101]. These efforts, although prioritizing the mitigation of climate impacts and strengthening the green transition, can be vital in addressing multidimensional energy poverty if they incorporate clear targeting of the most vulnerable regions and populations (such as women, large families, and those with lower education).
Policies aimed at alleviating energy poverty must address multiple drivers, taking into account social, cultural, economic, and gender perspectives. Providing affordable energy is crucial, but transitioning to cleaner renewable energy is increasingly perceived as an opportunity for lower-income countries’ financial development, educational advancement, economic and infrastructure development, and industrialization, all of which are positively correlated with energy access [59]. Therefore, actively educating household leaders, particularly women, on transitioning to cleaner energy, such as the use of solar cooking, heating, and lighting, can be a viable solution to changing energy choices. Various studies also highlight the importance of implementing short-term policy measures that effectively address problems related to the co-existing use of low or transitional energy sources (e.g., kerosene subsidies) [53]. Above all, for households living in energy poverty in Jordan, transitioning to renewable energy is a promising alternative and a step toward better energy security, improved health, and sustainable development [102].

Author Contributions

Conceptualization, M.M.J.; methodology, M.M.J.; software, M.M.J.; validation, M.M.J., A.S. and H.Y.; formal analysis, M.M.J.; investigation, M.M.J., A.S. and H.Y.; resources, M.M.J., A.S. and H.Y.; data curation, M.M.J.; writing—original draft preparation, M.M.J., A.S., and H.Y.; writing—review and editing, M.M.J., A.S. and H.Y.; visualization, M.M.J.; supervision, M.M.J. and A.S.; funding acquisition, M.M.J. All authors have read and agreed to the published version of the manuscript.

Funding

This research received no external funding.

Data Availability Statement

Restrictions apply to the availability of these data. Data were obtained from the DHS Program website and are available at https://www.dhsprogram.com/ with the permission of DHS.

Acknowledgments

Mohammad Jaber would like to acknowledge the support of the European Union’s Horizon Europe programme, CiRCLETECH, under Grant Agreement No. 101079354. Ana Stojilovska would like to acknowledge the support received from the National Research, Development and Innovation Office, Hungary, under the grant PD_23 OTKA no. 145881.

Conflicts of Interest

The authors declare no conflicts of interest.

Abbreviations

The following abbreviations are used in this manuscript:
DOSJordanian Department of Statistics
DHSDemographic and Health Survey
USAIDUnited States Agency for International Development
OECDOrganization for Economic Cooperation and Development
EAsEnumeration Areas
MENAMiddle East and North Africa
EPEnergy Poverty
EPIEnergy Poverty Index
HSHousing Score
FSFuel Score
CSCooling Score
WIWealth Index
GCFGreen Climate Fund
EUEuropean Union
BRCCJBuilding Resilience to Cope with Climate Change

References

  1. Bouzarovski, S.; Petrova, S. A Global Perspective on Domestic Energy Deprivation: Overcoming the Energy Poverty–Fuel Poverty Binary. Energy Res. Soc. Sci. 2015, 10, 31–40. [Google Scholar] [CrossRef]
  2. Al Kez, D.; Foley, A.; Lowans, C.; Del Rio, D.F. Energy Poverty Assessment: Indicators and Implications for Developing and Developed Countries. Energy Convers. Manag. 2024, 307, 118324. [Google Scholar] [CrossRef]
  3. Boardman, B. Fuel Poverty from Cold Homes to Affordable Warmth; Belhaven Press: London, UK, 1991. [Google Scholar]
  4. Jaber, M.M. Multidimensional Energy Poverty in Jordan between 2009 and 2018: Progress and Possible Policy Interventions. Reg. Stat. 2023, 13, 434–450. [Google Scholar] [CrossRef]
  5. Belaïd, F. Mapping and Understanding the Drivers of Fuel Poverty in Emerging Economies: The Case of Egypt and Jordan. Energy Policy 2022, 162, 112775. [Google Scholar] [CrossRef]
  6. Jaber, M. Towards Better Understanding of Energy Poverty in Jordan: A Multidimensional Phenomenon. Ph.D. Thesis, University of Miskolc, Miskolc, Hungary, 2024. [Google Scholar]
  7. Jaber, M.M. Summer Energy Poverty and Climate Change in Jordan. Veresné Somosi, M., Lipták, K., Harangozó, Z., Eds.; 2022, pp. 670–677. Available online: https://m2.mtmt.hu/gui2/?mode=browse&params=publication;33341175 (accessed on 3 July 2025).
  8. Jaber, M.M.; Szép, T. Subjective Indicators of Fuel Poverty in Zarqa Governorate, Jordan. Energy Effic. 2024, 17, 21. [Google Scholar] [CrossRef]
  9. Haddad, R. The Threat of Climate Change in Jordan. Available online: https://carnegieendowment.org/sada/2023/04/the-threat-of-climate-change-in-jordan?lang=en (accessed on 6 April 2025).
  10. Zraick, K. Jordan’s Scarce Water Supply Strained by Rising Temperatures and Growing Population. The Irish Times. Available online: https://www.irishtimes.com/world/middle-east/2022/11/13/jordans-scarce-water-supply-strained-by-rising-temperatures-and-growing-population/ (accessed on 3 July 2025).
  11. Albdour, M.S.; Alhomaidat, F.; Alrsai, M.; Alsanat, H.; Al-Zaidyeen, S.M.M. Proposal for Zero Energy Housing Designs in Jordan. Energy Sustain. Soc. 2024, 14, 53. [Google Scholar] [CrossRef]
  12. Bouzarovski, S.; Simcock, N. Spatializing Energy Justice. Energy Policy 2017, 107, 640–648. [Google Scholar] [CrossRef]
  13. Stojilovska, A.; Guyet, R.; Mahoney, K.; Gouveia, J.P.; Castaño-Rosa, R.; Živčič, L.; Barbosa, R.; Tkalec, T. Energy Poverty and Emerging Debates: Beyond the Traditional Triangle of Energy Poverty Drivers. Energy Policy 2022, 169, 113181. [Google Scholar] [CrossRef]
  14. Walker, G. Beyond Distribution and Proximity: Exploring the Multiple Spatialities of Environmental Justice. Antipode 2009, 41, 614–636. [Google Scholar] [CrossRef]
  15. Füssel, H.-M.; Klein, R.J.T. Climate Change Vulnerability Assessments: An Evolution of Conceptual Thinking. Clim. Change 2006, 75, 301–329. [Google Scholar] [CrossRef]
  16. Waitt, G.; Harada, T. Space of Energy Well-Being: Social Housing Tenants’ Everyday Experiences of Fuel Poverty. Trans. Inst. Br. Geogr. 2019, 44, 794–807. [Google Scholar] [CrossRef]
  17. Varo, A. From Deserving to Denied: Exploring the Social Construction of Energy Excluded Citizens. Energy Res. Soc. Sci. 2024, 113, 103544. [Google Scholar] [CrossRef]
  18. Moroni, S.; De Franco, A. Spatial Justice: A Fundamental or Derivative Notion? City Cult. Soc. 2024, 38, 100593. [Google Scholar] [CrossRef]
  19. Żuk, P.; Żuk, P. Social and Spatial Determinants of Energy Ageism: Calibrating Social Policy towards Older People under the Conditions of Energy Transition in Polish Society. Energy Res. Soc. Sci. 2024, 118, 103795. [Google Scholar] [CrossRef]
  20. López, I.; García-Valdecasas, J.I.; Monge Lasierra, C. Household Strategies for Coping with Energy Poverty: Technological and Socio-Familial Dilemmas. Energy Build. 2025, 329, 115117. [Google Scholar] [CrossRef]
  21. Yoon, H.; Ribas, A. What It Means to Be Resilient to Heatwaves for Vulnerable Households in Mass Tourist Destinations? Clim. Risk Manag. 2025, 47, 100688. [Google Scholar] [CrossRef]
  22. Barrella, R.; Blas-Álvarez, L. Unpacking the Energy Crisis Impact with a Multidimensional Vulnerability Index: A Granular Analysis of the Spanish Case. GeoJournal 2024, 89, 34. [Google Scholar] [CrossRef]
  23. Kashour, M.; Jaber, M.M. Revisiting Energy Poverty Measurement for the European Union. Energy Res. Soc. Sci. 2024, 109, 103420. [Google Scholar] [CrossRef]
  24. Brunner, K.-M.; Spitzer, M.; Christanell, A. Experiencing Fuel Poverty. Coping Strategies of Low-Income Households in Vienna/Austria. Energy Policy 2012, 49, 53–59. [Google Scholar] [CrossRef]
  25. Taltavull de La Paz, P.; Juárez Tárrega, F.; Su, Z.; Monllor, P. Sources of Energy Poverty: A Factor Analysis Approach for Spain. Front. Energy Res. 2022, 10, 847845. [Google Scholar] [CrossRef]
  26. Andadari, R.K.; Mulder, P.; Rietveld, P. Energy Poverty Reduction by Fuel Switching. Impact Evaluation of the LPG Conversion Program in Indonesia. Energy Policy 2014, 66, 436–449. [Google Scholar] [CrossRef]
  27. Torrego-Gómez, D.; Gayoso-Heredia, M.; Núñez-Peiró, M.; Sánchez-Guevara, C. Mapping Summer Energy Poverty: The Lived Experience of Older Adults in Madrid, Spain. Energy Res. Soc. Sci. 2024, 110, 103449. [Google Scholar] [CrossRef]
  28. Healy, J.D.; Clinch, J.P. Quantifying the Severity of Fuel Poverty, Its Relationship with Poor Housing and Reasons for Non-Investment in Energy-Saving Measures in Ireland. Energy Policy 2004, 32, 207–220. [Google Scholar] [CrossRef]
  29. Stojilovska, A.; Thomson, H.; Mejía-Montero, A. Making a Case for Centring Energy Poverty in Social Policy in Light of the Climate Emergency: A Global Integrative Review. Soc. Policy Soc. 2023, 22, 715–729. [Google Scholar] [CrossRef]
  30. Mulder, P.; Dalla Longa, F.; Straver, K. Energy Poverty in the Netherlands at the National and Local Level: A Multi-Dimensional Spatial Analysis. Energy Res. Soc. Sci. 2023, 96, 102892. [Google Scholar] [CrossRef]
  31. Robinson, C.; Mattioli, G. Double Energy Vulnerability: Spatial Intersections of Domestic and Transport Energy Poverty in England. Energy Res. Soc. Sci. 2020, 70, 101699. [Google Scholar] [CrossRef]
  32. Mattioli, G.; Lucas, K.; Marsden, G. Transport Poverty and Fuel Poverty in the UK: From Analogy to Comparison. Transp. Policy 2017, 59, 93–105. [Google Scholar] [CrossRef]
  33. Hou, J.; Zhou, W.; Jiang, Y. Multidimensional Energy Poverty and Depression among China’s Older Adults. Front. Public Health 2022, 10, 977958. [Google Scholar] [CrossRef] [PubMed]
  34. Szabó, S.; Bódis, K.; Huld, T.; Moner-Girona, M. Sustainable Energy Planning: Leapfrogging the Energy Poverty Gap in Africa. Renew. Sustain. Energy Rev. 2013, 28, 500–509. [Google Scholar] [CrossRef]
  35. Stojilovska, A.; Dokupilová, D.; Gouveia, J.P.; Bajomi, A.Z.; Tirado-Herrero, S.; Feldmár, N.; Kyprianou, I.; Feenstra, M. As Essential as Bread: Fuelwood Use as a Cultural Practice to Cope with Energy Poverty in Europe. Energy Res. Soc. Sci. 2023, 97, 102987. [Google Scholar] [CrossRef]
  36. Pereira, D.S.; Marques, A.C. How Do Energy Forms Impact Energy Poverty? An Analysis of European Degrees of Urbanisation. Energy Policy 2023, 173, 113346. [Google Scholar] [CrossRef]
  37. Roberts, E. Warming with Wood: Exploring the Everyday Heating Practices of Rural off-Gas Households in Wales. Energy Policy 2020, 142, 111451. [Google Scholar] [CrossRef]
  38. Bouzarovski, S.; McKenzie, P.; Lonie, A.; Sarpotdar, A.; Mattioli, G.; Martiskainen, M. The Determinants of Double Energy Vulnerability: A Geospatial Analysis. Geogr. J. 2025, 191, e12610. [Google Scholar] [CrossRef]
  39. Lehtonen, O.; Hiltunen, A.P.; Okkonen, L.; Blomqvist, K. Emerging Spatial Clusters of Energy Poverty Vulnerability in Rural Finland—Byproducts of Accumulated Regional Development. Energy Res. Soc. Sci. 2024, 109, 103418. [Google Scholar] [CrossRef]
  40. Barbier, E.B.; Hochard, J.P. Poverty, Rural Population Distribution and Climate Change. Environ. Dev. Econ. 2018, 23, 234–256. [Google Scholar] [CrossRef]
  41. Madsen, L.V.; Hansen, A.R.; Nielsen, R.S.; Gram-Hanssen, K. The Links and Entanglements of Energy Vulnerability: Unpacking the Consequences of the Energy Crisis in Denmark. Energy Res. Soc. Sci. 2024, 118, 103784. [Google Scholar] [CrossRef]
  42. Hernandez-Cruz, P.; Uriarte, I.; Hidalgo-Betanzos, J.M.; Antepara, Í.; Flores-Abascal, I. A Novel Strategy to Guarantee a Minimum Indoor Temperature in Social Housing Buildings. J. Build. Eng. 2023, 76, 107230. [Google Scholar] [CrossRef]
  43. Simões, G.M.F.; Leder, S.M. Energy Poverty: The Paradox between Low Income and Increasing Household Energy Consumption in Brazil. Energy Build. 2022, 268, 112234. [Google Scholar] [CrossRef]
  44. Chen, C.; Greig, J.; Nelson, H.; Li, F. When Disadvantage Collides: The Concentrated Effects of Energy Insecurity and Internet Burdens in the United States. Energy Res. Soc. Sci. 2022, 91, 102713. [Google Scholar] [CrossRef]
  45. Okushima, S.; Simcock, N. Double Energy Vulnerability in Japan. Energy Policy 2024, 191, 114184. [Google Scholar] [CrossRef]
  46. Al Sharafat, A. Spatial Inequality in Jordan. J. Econ. Manag. 2019, 36, 71–83. [Google Scholar] [CrossRef]
  47. Winsemius, H.C.; Jongman, B.; Veldkamp, T.I.E.; Hallegatte, S.; Bangalore, M.; Ward, P.J. Disaster Risk, Climate Change, and Poverty: Assessing the Global Exposure of Poor People to Floods and Droughts. Environ. Dev. Econ. 2018, 23, 328–348. [Google Scholar] [CrossRef]
  48. Leach, G. The Energy Transition. Energy Policy 1992, 20, 116–123. [Google Scholar] [CrossRef]
  49. Choumert-Nkolo, J.; Combes Motel, P.; Le Roux, L. Stacking up the Ladder: A Panel Data Analysis of Tanzanian Household Energy Choices. World Dev. 2019, 115, 222–235. [Google Scholar] [CrossRef]
  50. Masera, O.R.; Saatkamp, B.D.; Kammen, D.M. From Linear Fuel Switching to Multiple Cooking Strategies: A Critique and Alternative to the Energy Ladder Model. World Dev. 2000, 28, 2083–2103. [Google Scholar] [CrossRef]
  51. Waleed, K.; Mirza, F.M. Examining Fuel Choice Patterns through Household Energy Transition Index: An Alternative to Traditional Energy Ladder and Stacking Models. Environ. Dev. Sustain. 2023, 25, 6449–6501. [Google Scholar] [CrossRef]
  52. Alananga, S.S.; Igangula, N.H. Constrained Cooking Energy Choices: Understanding up-the-Ladder Stacking Behaviour in Dar Es Salaam Tanzania. Energy Policy 2022, 168, 113087. [Google Scholar] [CrossRef]
  53. Yadav, P.; Davies, P.J.; Asumadu-Sarkodie, S. Fuel Choice and Tradition: Why Fuel Stacking and the Energy Ladder Are out of Step? Sol. Energy 2021, 214, 491–501. [Google Scholar] [CrossRef]
  54. Elasu, J.; Ntayi, J.M.; Adaramola, M.S.; Buyinza, F.; Atukunda, R.; Ngoma, M. Climate Shocks, Adaptive Mechanisms and Household Energy Transition in Uganda. Discov. Energy 2024, 4, 12. [Google Scholar] [CrossRef]
  55. Apergis, N.; Polemis, M.; Soursou, S.-E. Energy Poverty and Education: Fresh Evidence from a Panel of Developing Countries. Energy Econ. 2022, 106, 105430. [Google Scholar] [CrossRef]
  56. Acharya, R.H.; Sadath, A.C. Energy Poverty and Economic Development: Household-Level Evidence from India. Energy Build. 2019, 183, 785–791. [Google Scholar] [CrossRef]
  57. Lacroix, E.; Chaton, C. Fuel Poverty as a Major Determinant of Perceived Health: The Case of France. Public Health 2015, 129, 517–524. [Google Scholar] [CrossRef]
  58. Liddell, C.; Morris, C. Fuel Poverty and Human Health: A Review of Recent Evidence. Energy Policy 2010, 38, 2987–2997. [Google Scholar] [CrossRef]
  59. Katoch, O.R.; Sharma, R.; Parihar, S.; Nawaz, A. Energy Poverty and Its Impacts on Health and Education: A Systematic Review. Int. J. Energy Sect. Manag. 2023, 18, 411–431. [Google Scholar] [CrossRef]
  60. Arsad, F.S.; Hod, R.; Ahmad, N.; Ismail, R.; Mohamed, N.; Baharom, M.; Osman, Y.; Radi, M.F.M.; Tangang, F. The Impact of Heatwaves on Mortality and Morbidity and the Associated Vulnerability Factors: A Systematic Review. Int. J. Environ. Res. Public Health 2022, 19, 16356. [Google Scholar] [CrossRef]
  61. Cellini, M.; Loos, S.; Mirenda, C.; Pisacane, L.; Striebing, C.; Tagliacozzo, S. Exploring the Nexus of Gender and Energy Transitions: A Systematic Literature Review. Energy Res. Soc. Sci. 2025, 119, 103887. [Google Scholar] [CrossRef]
  62. Shen, B.; Ma, W.; Li, J. Role of Gender in Determining Energy Poverty, Clean Energy Access, and Energy Expenditure: Insights from Rural China. Energy Econ. 2025, 144, 108369. [Google Scholar] [CrossRef]
  63. Pradhan Shrestha, R.; Mainali, B.; Mokhtara, C.; Lohani, S.P. Bearing the Burden: Understanding the Multifaceted Impact of Energy Poverty on Women. Sustainability 2025, 17, 2143. [Google Scholar] [CrossRef]
  64. Middlemiss, L. Who Is Vulnerable to Energy Poverty in the Global North, and What Is Their Experience? WIREs Energy Environ. 2022, 11, e455. [Google Scholar] [CrossRef]
  65. Stojilovska, A.; Feenstra, M. Female Voices of Energy Deprivation the Lived Experience of Energy Vulnerable Women in North Macedonia and Austria. In Living with Energy Poverty Perspectives from the Global North and South; Routledge: London, UK, 2023; pp. 175–188. [Google Scholar]
  66. Amigo-Jorquera, C.; Guerrero-González, M.J.; Sannazzaro, J.; Urquiza-Gómez, A. Does Energy Poverty Have a Female Face in Chile? Tapuya Lat. Am. Sci. Technol. Soc. 2019, 2, 378–390. [Google Scholar] [CrossRef]
  67. Nsenkyire, E.; Nunoo, J.; Sebu, J.; Iledare, O. Household Multidimensional Energy Poverty: Impact on Health, Education, and Cognitive Skills of Children in Ghana. Child Indic. Res. 2022, 16, 293–315. [Google Scholar] [CrossRef]
  68. Huang, Y.; Jiao, W.; Wang, K.; Li, E.; Yan, Y.; Chen, J.; Guo, X. Examining the Multidimensional Energy Poverty Trap and Its Determinants: An Empirical Analysis at Household and Community Levels in Six Provinces of China. Energy Policy 2022, 169, 113193. [Google Scholar] [CrossRef]
  69. Zhang, D.; Li, J.; Han, P. A Multidimensional Measure of Energy Poverty in China and Its Impacts on Health: An Empirical Study Based on the China Family Panel Studies. Energy Policy 2019, 131, 72–81. [Google Scholar] [CrossRef]
  70. Santillán, O.S.; Cedano, K.G.; Martínez, M. Analysis of Energy Poverty in 7 Latin American Countries Using Multidimensional Energy Poverty Index. Energies 2020, 13, 1608. [Google Scholar] [CrossRef]
  71. Sokołowski, J.; Lewandowski, P.; Bouzarovski, S.; Kiełczewska, A. Measuring Energy Poverty in Poland with the Multidimensional Energy Poverty Index. Inst. Badań Strukturalnych 2019. [Google Scholar] [CrossRef]
  72. OECD; European Union; Joint Research Centre—European Commission. Handbook on Constructing Composite Indicators: Methodology and User Guide; OECD: Paris, France, 2008; ISBN 978-92-64-04345-9. [Google Scholar]
  73. Department of Statistics (DoS); DHS Program. Jordan Population and Family Health Survey 2023. 2024. Available online: https://jordan.unfpa.org/en/publications/jordan-population-and-family-health-survey-2023#:~:text=The%202023%20JPFHS%20is%20the%20eighth%20Population%20and,and%20policymakers%20to%20evaluate%20and%20improve%20existing%20programmes (accessed on 3 July 2025).
  74. Macro, O. MEASURE DHS+ Assists Countries Worldwide in the Collection and Use of Data to Monitor and Evaluate Population, Health, and Nutrition Programs. Funded by the US Agency for International Development (USAID), MEASURE DHS+ Is Implemented by ORC Macro in Calverton, Maryland. 2004. Available online: https://www.dhsprogram.com/pubs/pdf/cr6/cr6.pdf (accessed on 3 July 2025).
  75. Abbas, K.; Li, S.; Xu, D.; Baz, K.; Rakhmetova, A. Do Socioeconomic Factors Determine Household Multidimensional Energy Poverty? Empirical Evidence from South Asia. Energy Policy 2020, 146, 111754. [Google Scholar] [CrossRef]
  76. Awan, A.; Bilgili, F.; Rahut, D.B. Energy Poverty Trends and Determinants in Pakistan: Empirical Evidence from Eight Waves of HIES 1998–2019. Renew. Sustain. Energy Rev. 2022, 158, 112157. [Google Scholar] [CrossRef]
  77. Field, A. Discovering Statistics Using IBM SPSS Statistics, 5th ed.; SAGE Publications: Thousand Oaks, CA, USA, 2017; ISBN 978-1-5264-1952-1. [Google Scholar]
  78. Sahlberg, A.; Karlsson, B.S.A.; Sjöblom, J.; Ström, H. Don’t Extinguish My Fire—Understanding Public Resistance to a Swedish Policy Aimed at Reducing Particle Emissions by Phasing out Old Wood Stoves. Energy Policy 2022, 167, 113017. [Google Scholar] [CrossRef]
  79. Roberts, D.; Vera-Toscano, E.; Phimister, E. Fuel Poverty in the UK: Is There a Difference between Rural and Urban Areas? Energy Policy 2015, 87, 216–223. [Google Scholar] [CrossRef]
  80. El Hamidi, F. Energy Subsidy Reform in Egypt: The Gender “Energy” Poverty Nexus. SSRN Electron. J. 2016. [Google Scholar] [CrossRef]
  81. Castaño-Rosa, R.; Pelsmakers, S.; Järventausta, H.; Poutanen, J.; Tähtinen, L.; Rashidfarokhi, A.; Toivonen, S. Resilience in the Built Environment: Key Characteristics for Solutions to Multiple Crises. Sustain. Cities Soc. 2022, 87, 104259. [Google Scholar] [CrossRef]
  82. Robinson, C.; Yan, D.; Bouzarovski, S.; Zhang, Y. Energy Poverty and Thermal Comfort in Northern Urban China: A Household-Scale Typology of Infrastructural Inequalities. Energy Build. 2018, 177, 363–374. [Google Scholar] [CrossRef]
  83. Thomson, H.; Bouzarovski, S.; Snell, C. Rethinking the Measurement of Energy Poverty in Europe: A Critical Analysis of Indicators and Data. Indoor Built Environ. 2017, 26, 879–901. [Google Scholar] [CrossRef]
  84. Stojilovska, A. Synergies Between Heating and Energy Poverty—The Injustice of Heat; Central European University: Budapest, Hungary, 2021. [Google Scholar]
  85. Nussbaumer, P.; Nerini, F.F.; Onyeji, I.; Howells, M. Global Insights Based on the Multidimensional Energy Poverty Index (MEPI). Sustainability 2013, 5, 2060–2076. [Google Scholar] [CrossRef]
  86. Nussbaumer, P.; Bazilian, M.; Modi, V. Measuring Energy Poverty: Focusing on What Matters. Renew. Sustain. Energy Rev. 2012, 16, 231–243. [Google Scholar] [CrossRef]
  87. García, C.L.E.; Toro-García, G.L. Multidimensional Energy Poverty in Colombia: A Department-Level Review from 2018 to 2022. Heliyon 2024, 10, e34395. [Google Scholar] [CrossRef]
  88. Qurat-ul-Ann, A.-R.; Mirza, F.M. Multidimensional Energy Poverty in Pakistan: Empirical Evidence from Household Level Micro Data. Soc. Indic. Res. 2021, 155, 211–258. [Google Scholar] [CrossRef]
  89. World Bank Industry, Innovation & Infrastructure|SDG 9: Industry, Innovation & Infrastructure. Available online: https://datatopics.worldbank.org/sdgatlas/goal-9-industry-innovation-and-infrastructure/?lang=en (accessed on 4 June 2025).
  90. World Bank Access to Electricity. Available online: https://data.worldbank.org (accessed on 4 June 2025).
  91. Working Group II Technical Support Unit. Climate Change 2022: Impacts, Adaptation and Vulnerability Working Group II Contribution to the Sixth Assessment Report of the Intergovernmental Panel on Climate Change; Intergovernmental Panel on Climate Change: Cambridge, UK; New York, NY, USA, 2022. [Google Scholar]
  92. Phillips, J.; Petrova, S. The Materiality of Precarity: Gender, Race and Energy Infrastructure in Urban South Africa. Environ. Plan. A 2021, 53, 1031–1050. [Google Scholar] [CrossRef]
  93. Simcock, N.; Frankowski, J.; Bouzarovski, S. Rendered Invisible: Institutional Misrecognition and the Reproduction of Energy Poverty. Geoforum 2021, 124, 1–9. [Google Scholar] [CrossRef]
  94. Ricci, D.; Konstantinou, T.; Visscher, H. Making Energy Renovations Equitable: A Literature Review of Decision-Making Criteria for a Just Energy Transition in Residential Buildings. Energy Res. Soc. Sci. 2025, 122, 104016. [Google Scholar] [CrossRef]
  95. Jordan Climate Change Projects—Global Green Growth Institute. Available online: http://jordanclimatechange.com/en-us/projects/ (accessed on 17 March 2025).
  96. Green Climate Fund Jordan: Building Resilience to Cope with Climate Change in Jordan through Improving Water Use Efficiency in the Agriculture Sector (BRCCJ). Available online: https://www.greenclimate.fund/countries/jordan (accessed on 17 March 2025).
  97. DAI Jordan—Technical Assistance to European Union Support to Green Economy—DAI: International Development. Available online: https://www.dai.com/our-work/projects/jordan-technical-assistance-to-european-union-support-to-green-economy (accessed on 17 March 2025).
  98. Ministry of Planning and International Cooperation Foreign Assistance—Ministry of Planning and International Cooperation. Available online: https://www.mop.gov.jo/EN/Pages/Foreign_Assistance (accessed on 17 March 2025).
  99. Jaber, M.M.; Ghaith, A.; Kashour, M. Exploring Jordanian Households’ Intentions to Adopt Solar Energy Systems Using the Theory of Planned Behavior. Discov. Sustain. 2025, 6, 332. [Google Scholar] [CrossRef]
  100. Abouaiana, A.; Battisti, A. Towards Clean Energy Transition: An Exploratory Case Study from Rural Egypt. Sustainability 2025, 17, 1597. [Google Scholar] [CrossRef]
  101. Zaidan, S.; Fadel, M.E. Advancing SDG7 (“Affordable and Clean Energy”): Towards Ending Energy Poverty for Net Zero Emissions in the Middle East and North Africa. 2024. Available online: https://www.iaee.org/en/publications/newsletterdl.aspx?id=1107 (accessed on 3 July 2025).
  102. Van Der Kroon, B.; Brouwer, R.; Van Beukering, P.J.H. The Energy Ladder: Theoretical Myth or Empirical Truth? Results from a Meta-Analysis. Renew. Sustain. Energy Rev. 2013, 20, 504–513. [Google Scholar] [CrossRef]
Figure 1. Conceptual framework of EPI in Jordan. Source: Authors’ work.
Urbansci 09 00263 g001
Figure 2. Regional distribution of EP. Source: Authors’ results.
Urbansci 09 00263 g002
Figure 3. EP pillars comparison between the Amman and Mafraq regions. Source: Authors’ results.
Urbansci 09 00263 g003
Table 1. EPI pillars, data, and scores.
PillarData UsedWeight
Housing Score (HS)Main floor material1 = Low efficiency,
2 = Medium efficiency
3 = High efficiency
Main wall material
Main roof material
Household fuel score (HF)Type of cooking fuel1 = Traditional fuel
2 = Transitional fuel
3 = Modern fuel
Type of fuel for home heat
Type of light at home
Cooling score (CS)Air conditionerYes = 1
No = 0
Fan
Wealth score (WS)Wealth IndexPoorest = 1, Poorer = 2, Middle = 3, Richer = 4,
Richest = 5
Source: Authors’ work.
Table 2. Descriptive statistics of housing score variables.
Rank FrequencyPercent
Main floor material1Earth/sand760.4
2Parquet or polished wood2681.4
3Tiles11,81660.7
3Marble/ceramic582229.9
1Cement14707.5
1Other230.1
Main wall material1Mud bricks7223.7
2Mud bricks with stones3331.7
2Cement bricks811341.7
3Cut stones237312.2
3Cut stones and concrete18709.6
3Concrete490625.2
1Zinc9634.9
1Other1951
Main roof material1Mud bricks4712.4
2Mud bricks with stones2761.4
3Concrete17,52190
1Zinc11666
1Other410.2
Source: Authors’ work.
Table 3. Descriptive statistics of fuel score variables.
Rank FrequencyPercent
Type of cooking fuel3Electricity4012.1
3Piped natural gas18,85796.8
2Kerosene/paraffin1400.7
1Coal/lignite570.3
1No food is cooked in-house200.1
Type of fuel for home heat3Electricity290714.9
3Solar air heater1921
3Liquefied petroleum gas (LPG)/cooking gas11,39458.5
2Alcohol/ethanol10
1Gasoline/diesel1170.6
2Kerosene/paraffin199210.2
1Charcoal600.3
1Wood12126.2
1Straw/shrubs/grass1090.6
2Agricultural crop50
1Animal dung/waste70
1Garbage/plastic70
2Peat4472.3
1No heating in the household5863
1Other4392.3
Type of light at home3Electricity19,31099.2
3Solar lantern240.1
2Rechargeable flashlight, torch, or lantern210.1
2Battery-powered flashlight, torch, or lantern320.2
2Biogas lamp60
1Gasoline lamp10
1Kerosene or paraffin lamp80
1Charcoal10
1Wood150.1
1Straw/shrubs/grass40
1Candle10
1No lighting in the household490.3
1Other30
Source: Authors’ work.
Table 4. Descriptive statistics of cooling score variables.
Rank FrequencyPercent
Own an air conditioner0No12,47664.1
1Yes699935.9
Own a Fan0No231711.9
1Yes17,15888.1
Source: Authors’ work.
Table 5. Descriptive statistics of the wealth index variable.
RankFrequencyPercent
Poorest1592630.4
Poorer2422921.7
Middle3382519.6
Richer4341317.5
Richest5208210.7
Total 19,475100
Source: Authors’ work.
Table 6. Cross-correlations between the EPI pillars.
HSFSCSWI
HS--
FS0.038 **--
CS0.148 **0.039 **--
WI0.382 **0.127 **0.510 **--
** Significance at the 0.001 level. Source: Authors’ results.
Table 7. EPI results in Jordan.
N19,475
Missing0
Mean0.30
Median0.31
Std. Deviation0.17
Range0.96
Minimum0
Maximum0.96
Source: Authors’ results.
Table 8. One-way ANOVA results.
Sum of SquaresdfMean SquareFSig.
Between Groups68.905116.264254.1310.000
Within Groups479.74619,4630.025
Total548.65119,474
Source: Authors’ results.
Table 9. Rank correlation coefficients between the five scenarios.
EPI S1EPI S2EPI S3EPI S4
EPI S20.990 **--
EPI S30.987 **0.974 **--
EPI S40.988 **0.975 **0.973 **--
EPI S50.982 **0.967 **0.958 **0.954 **
** Correlation is significant at the 0.01 level (2-tailed). Source: Authors’ results.
Table 10. Logistic regression model statistics for predicting EPI.
dfSignificance
Model chi-square7748.511240.000
−2 log-likelihood19,242.504
Nagelkerke R Square0.438
Hosmer and Lemeshow Test4.81380.777
Source: Authors’ results.
Table 11. Logistic regression model for predicting EPI in Jordan.
BSig.95% C.I. for EXP(B)
LowerExp(B)Upper
Number of household members0.0320.0001.0141.0331.051
Governorate0.000
Balqa0.2500.0031.0901.2841.513
Zarqa0.1780.0231.0241.1951.394
Madaba0.1690.0431.0061.1841.393
Irbid0.1370.0590.9951.1471.322
Mafraq0.7710.0001.8012.1632.598
Jarash0.4420.0001.3131.5561.843
Ajloun0.5790.0001.5171.7832.097
Karak1.2980.0003.1023.6624.323
Tafiela1.0400.0002.4042.8303.333
Ma’an0.7630.0001.8032.1442.549
Aqaba0.2200.0081.0581.2461.468
Female head of household0.2400.0001.1451.2711.411
Age of the head of household−0.0130.0000.9850.9870.990
Has a bank account (1 = yes)−1.3770.0000.2330.2520.273
Type of housing unit0.000
Family house0.5280.0001.5661.6951.835
Villa−1.4360.0010.1000.2380.565
Hut/barrack4.6810.00014.898107.846780.704
Other2.9970.0007.38720.02854.305
Number of rooms in the house−0.6670.0000.4940.5130.533
Highest educational level attained0.000
Primary−0.1700.0380.7190.8440.991
Secondary−0.8760.0000.3600.4170.481
Higher−1.6400.0000.1650.1940.228
Don’t know−0.3030.6300.2150.7392.537
Constant3.8580.000 47.380
Source: Authors’ results.
Disclaimer/Publisher’s Note: The statements, opinions and data contained in all publications are solely those of the individual author(s) and contributor(s) and not of MDPI and/or the editor(s). MDPI and/or the editor(s) disclaim responsibility for any injury to people or property resulting from any ideas, methods, instructions or products referred to in the content.

