Article

Are Urban Green Spaces’ Attributes Relevant to Explain the Occurrence of Invasive Species Within Urban Green Infrastructure?

by
Mónica Andrade
1,*,
Cláudia Fernandes
2 and
Albano Figueiredo
3
1
Department of Life Sciences, University of Coimbra, 3000-456 Coimbra, Portugal
2
Departamento de Geociências, Ambiente e Ordenamento de Território, Faculdade de Ciências, Universidade do Porto, 4169-007 Porto, Portugal
3
Centre of Studies in Geography and Spatial Planning, Department of Geography and Tourism, University of Coimbra, 3004-530 Coimbra, Portugal
*
Author to whom correspondence should be addressed.
Urban Sci. 2025, 9(7), 260; https://doi.org/10.3390/urbansci9070260
Submission received: 9 May 2025 / Revised: 28 June 2025 / Accepted: 30 June 2025 / Published: 4 July 2025

Abstract

Despite the importance of Urban Green Infrastructure (UGI) as a provider of multiple Ecosystem Services (ESs), some concerns have been raised regarding Ecosystem Disservices (EDs) associated with UGI design and management, namely, the link between Urban Green Spaces’ (UGSs) attributes and invasion spatial patterns. This research takes the UGI of Coimbra, a medium-sized Portuguese city, as a case study to explore the relationships between UGS attributes and the occurrence of invasive plant species. The methodology involved aerial photo-interpretation and full patch survey to collect data about UGSs types, maintenance level and occurrence of invasive plant species, and landscape metrics analysis. Our results showed that the UGI of Coimbra exhibits a large prevalence of small UGSs with regular maintenance and the occurrence of invasive plant species in a low number of patches (17%). Although these patches correspond to 64% of the UGI. The area of recent sprawl (zone 2) registers higher occurrence of invasive plant species across different UGSs types, with higher prevalence in patches with no or low maintenance. Mapping the occurrence of invasive plant species in UGS is of utmost importance to implement appropriate maintenance practices, allowing medium-sized cities like Coimbra to optimize ESs associated with UGI and minimize potential EDs.

1. Introduction

Green Infrastructure is defined by the European Commission [1] as “a strategically planned network of natural and semi-natural areas with other environmental features, designed and managed to deliver a wide range of ecosystem services, while also enhancing biodiversity”. In cities, Urban Green Infrastructure (UGI) takes the form of a diverse range of Urban Green Spaces (UGSs), including public or private gardens, urban forests, and agriculture, among others, that provide multiple benefits to both urban residents and the environment [2], promoting sustainable urban development [3,4]. More recently, around the world, UGI has been recognized as an essential tool for adaptation and resilience to climate change [5,6,7,8,9,10,11,12,13,14,15]. For this reason, the complexity and multifunctionality of UGI has drawn attention not only from key players in urban planning, landscape architecture, environmental sciences, and public health professionals but governmental entities have also been promoting strategies focused on the management and design of UGI as a way to achieve disaster risk reduction and management, aiming to reduce urban floods or to mitigate the urban heat island effect and protect biodiversity [1].
Despite the diversity of UGSs types included in UGI, researchers usually focus on larger UGSs [16,17,18,19], such as parks and recreational areas [20,21], green roofs and green walls [22,23], urban forests and tree-lined streets [24,25,26,27,28,29], and green corridors and greenways [3,30,31], excluding other UGSs types, usually with reduced dimensions, such as UGSs associated with single-family houses, buildings or facilities, and vacant lots, among others, who also contribute to ESs provision and very often have a significant presence in urban areas. Furthermore, composition [24,32,33], size and geometry [34,35], and maintenance [36,37] are key attributes of UGSs for maximizing the provision of ESs. However, these same attributes can also reveal potential to promote disservices. In fact, when such attributes are overlooked under the UGS planning and management perspective, Ecosystem Disservices (EDs) can outweigh the ESs associated with UGI [38].
Factors commonly associated with UGI, such as disturbance and habitat fragmentation and the introduction of ornamental plants, make urban areas prime targets for the colonization and proliferation of invasive plant species [39,40]. But other attributes have also been considered. The composition of UGSs is a topic closely related to invasion phenomena [41,42,43], with the use of native species as a strategy to reduce susceptibility to invasion [44]. And the occurrence of invasive plants species as been positively related to some UGSs types, such as natural areas and leisure facilities [45], road margins, ruderal sites, and railway sites [46,47], while others have discovered that larger spaces provide more opportunities for invasive species to thrive and spread [39,48]. In this context, maintenance level has also been identified as a key driver to reduce invasion [44], reinforcing the need for well-designed and well-maintained UGSs to prevent [49,50] and detect invasive plant species in the UGI at an early stage [51].
In recent years, trends and concepts related to the management of invasive species in urban areas have emerged [52], but there is still a lack of a holistic understanding of the correlation between the diverse attributes of UGSs (types, size and geometry, and maintenance) and the occurrence of invasion patterns, which is a crucial pre-requisite for the prevention and management of such species. Thus, taking Coimbra as a case study, this study aims to assess if there is an association between UGSs attributes (type, size and geometry, and maintenance level) and the frequency of invasive plants species, contributing to a deeper understanding of invasion patterns by non-native plants within the UGI. By providing insights about the phenomena and patterns of species’ invasiveness, the findings will contribute to increased ecological knowledge in urban areas and, consequently, better management and conscious decision-making regarding UGI.

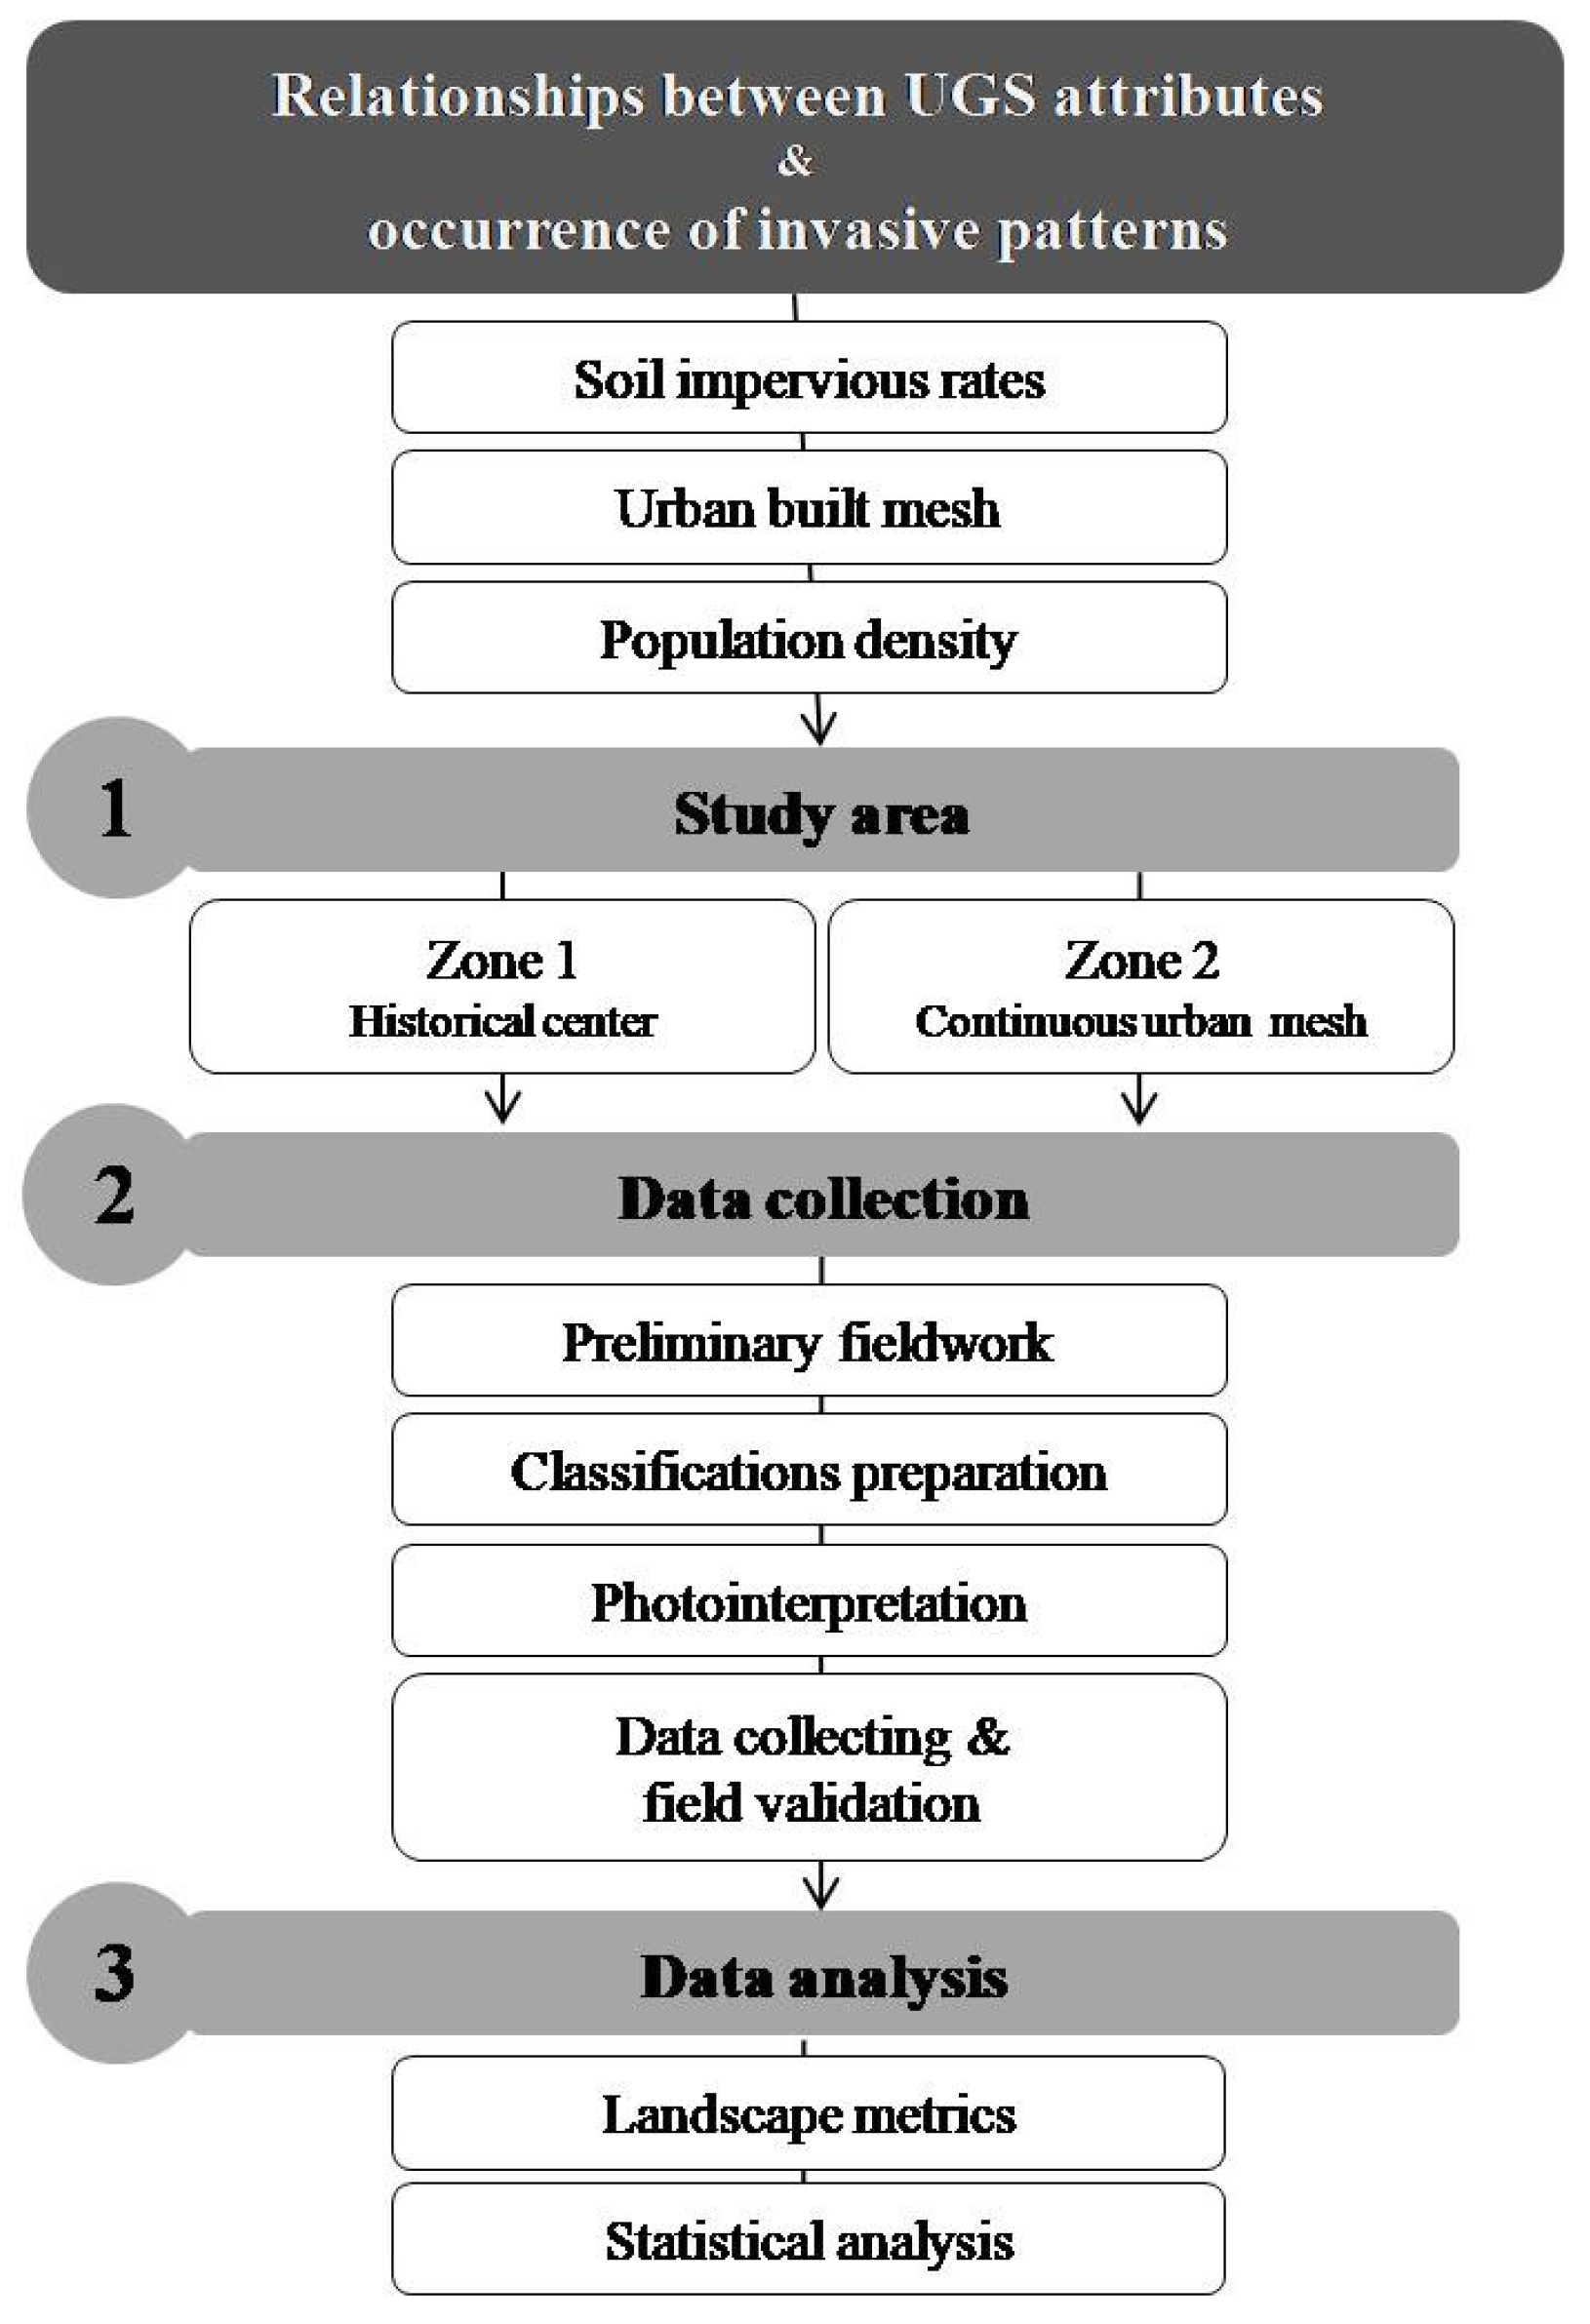
2. Materials and Methods

Coimbra, located in the western fringe of the Iberian Peninsula, in the Center Region of mainland Portugal, approximately at the latitude 40° N and longitude 8° W, has a Mediterranean climatic pattern. It is a historical city, with a very dense urban mesh in the city center and sparse occupation in surrounding areas. For this study, a part of Coimbra urban area was selected (Figure 1) based on the following criteria: areas with high soil impervious rates, defined as greater than 80% imperviousness according to the Imperviousness Density 2018 dataset [53] (Figure 2a); areas dominated by vertical, continuous urban built mesh (Figure 2b), identified using Portuguese Land Use and Land Cover outputs [54]; areas with higher population density (Figure 2c), based on statistics from [55]; and, wherever possible, areas bordered by main roads builtsurrounding the highest density urban area. By using such criteria to define the study area, we aimed to discard areas of low urban density that are mainly dominated by forest and agriculture, with them being associated with rural or suburban areas.
Since the urban morphology of Coimbra reflects several historical eras [56,57], the study area was divided into two zones (Figure 3). The historical part (zone 1), defined by the Coimbra Municipal Master Plan [58], is characterized by compact and continuous vertical construction with narrow and winding alleys, with small UGSs, surrounded by a vertical continuous built mesh and single-family houses (zone 2). Zone 2, in turn, presents broader roads designed for heavy vehicular traffic, with a contemporary layout, where UGSs are more common and larger in size. Around those areas, small villages dominate the Municipality of Coimbra, with single-family houses surrounded by agriculture and forests.
Having by reference the classification proposed by [59] for UGSs types and [60] for access to users, preliminary fieldwork and a previous delimitation of polygons was prepared in a Geographic Information System (QGIS 3.28.5 software) based on high-resolution satellite imagery. The classifications for maintenance frequency and scales for invasive species occurrence were developed based on previous field observations. The invasive species were identified based on a national list [61], and to assess the occurrence of such species in fieldwork, we used the full patch survey strategy, whenever possible.
Data collection and field validation for UGSs attributes and occurrence of invasive plant species was carried out in the field during the summer of 2023, using a GPS device (Geomax Zenith 16 GNSS). After validation, and for each patch, information, such as maintenance level and data related to the occurrence of invasive plant species, was recorded following the classifications and scales prepared to collect quantitative data for the different variables (Table 1).
Considering difficulties in collecting data for some UGSs, namely, for UGSs associated with single-family houses, buildings, and facilities, tools such as Basemap (ESRI ArcGis 10.8), Google Maps, and Google Street View were used. To explore potential relationships between UGS attributes and invasive species occurrence, a simple statistical analysis and chi-square test were carried out using IBM SPSS Statistics 29.0.0.0. based on data collected in the field.

3. Results

3.1. Characterization of Urban Green Infrastructure

The UGI occupies 46% of the study area, with a well-balanced distribution in the two zones considered. The historical center of the city, corresponding to zone 1, despite the high urban density, covers 43% of the area classified as UGI, corresponding to approximately 16% of the total UGI of the study area. In zone 2, about 46% of the area is classified as UGI, corresponding to 84% of the UGI of the study area (Figure 4).

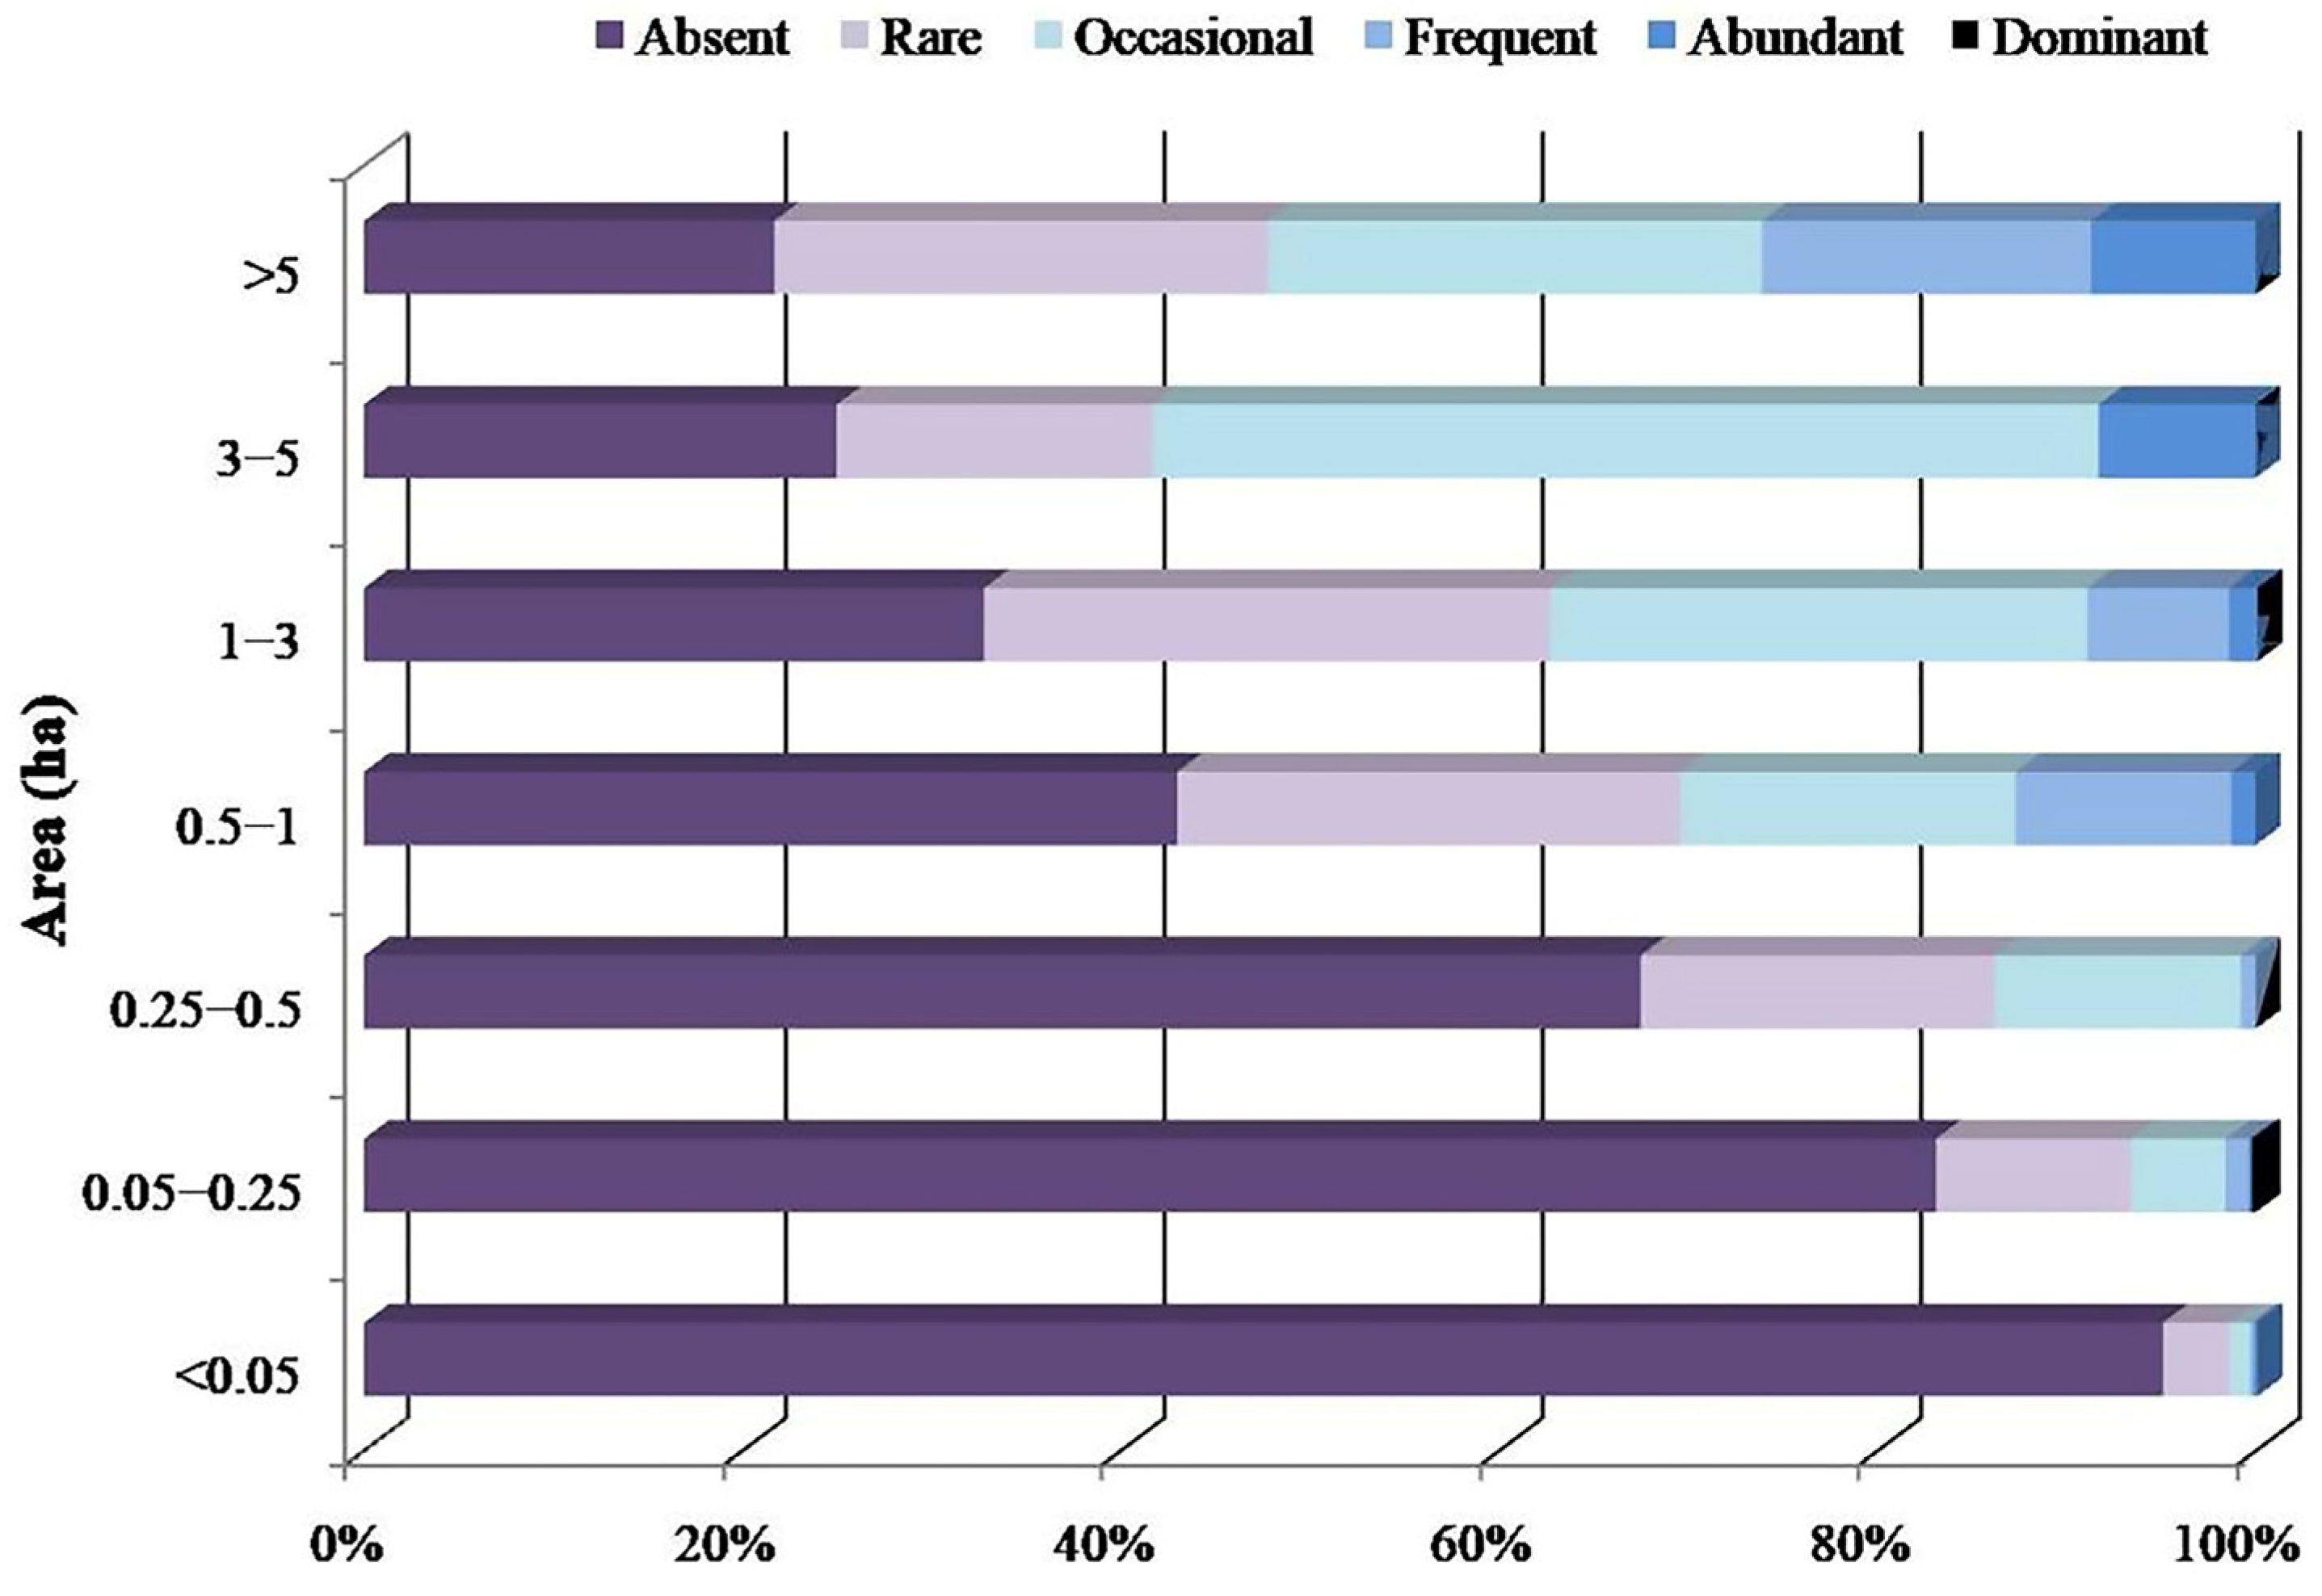
3.1.1. Types, Size, and Geometry of Urban Green Spaces

Considering the number of patches, tree-lined streets (41%), UGSs associated with single-family houses (26%), and UGSs associated with buildings (12%) are the most frequent types in the UGI (Figure 5). However, tree-lined streets occupy a small percentage (2%) of the total UGI area, and have a low average area (mean patch size: 0.01 ha or 100 m2), even considering tree canopy area. Their conditions vary widely (e.g., bed size and surface cover), and field survey analyses are challenging. Typically implemented in small-sized tree pits often topped with non-soil materials, tree-lined streets are distinct from other UGSs types [62], which justifies their exclusion from deeper analysis in this study. UGSs types with lower representation (< to 5%) include scarps (1.2%) and vacant lots (4%), which present a low number of polygons and are mostly found in zone 2. In contrast, agricultural areas (183.7 ha—31%), urban forests (124.2 ha—21%), and single-family house UGSs (65.9 ha—11%) emerge as the most representative types, despite marked differences in terms of attributes, with the first two represented only in zone 2.
Agricultural areas and urban forests are characterized by large patches (mean size ~1 ha) with significant size variability (standard deviation of 3.5 ha and 5.5 ha, respectively). UGSs linked to single-family houses, on the other hand, consist of smaller patches (mean size: 0.09 ha, median size: 0.04 ha), with 50% under 0.04 ha, exhibiting the greatest irregularity among the different UGSs types (Area-Weighted Mean Shape, AWMSI: 2.80) and across both zones (see more details in Supplementary Materials). With a significant contribution for the total edge length (29%) of the UGI, it maintains consistent importance in terms of area (zone 1: 15%; zone 2: 10%) and number of patches (zone 1: 30%; zone 2: 25%). Not all UGSs types share this balance. Depending on the zone, some differences can be identified in the attributes of the UGI, namely, in the prevalence of the UGSs types (Figure 5). While UGSs associated with facilities present a higher representation (29% of zone 1; 5% of the study area) in zone 1, agricultural areas (33%) and urban forests (22%) are dominant in zone 2, collectively accounting for 51.4% of the total UGI. In terms of patch irregularity, higher AWMSI values are associated with scarps in zone 1 (3.17) and UGSs associated with single-family houses in zone 2 (2.89).

3.1.2. Urban Green Spaces by Access to Users

The study area has a diverse range of UGSs types, providing approximately 114 m2 UGS per capita. However, when considering only UGSs with conditional and public access, this score reduces to 60 m2 UGS per capita. The value decreases further to 19 m2 UGS per capita when limited to exclusively public access UGSs (Figure 6). While this exceeds the World Health Organization minimum of 9 m2 per capita, it falls below the 50 m2 per capita suggested by the authors of [63].

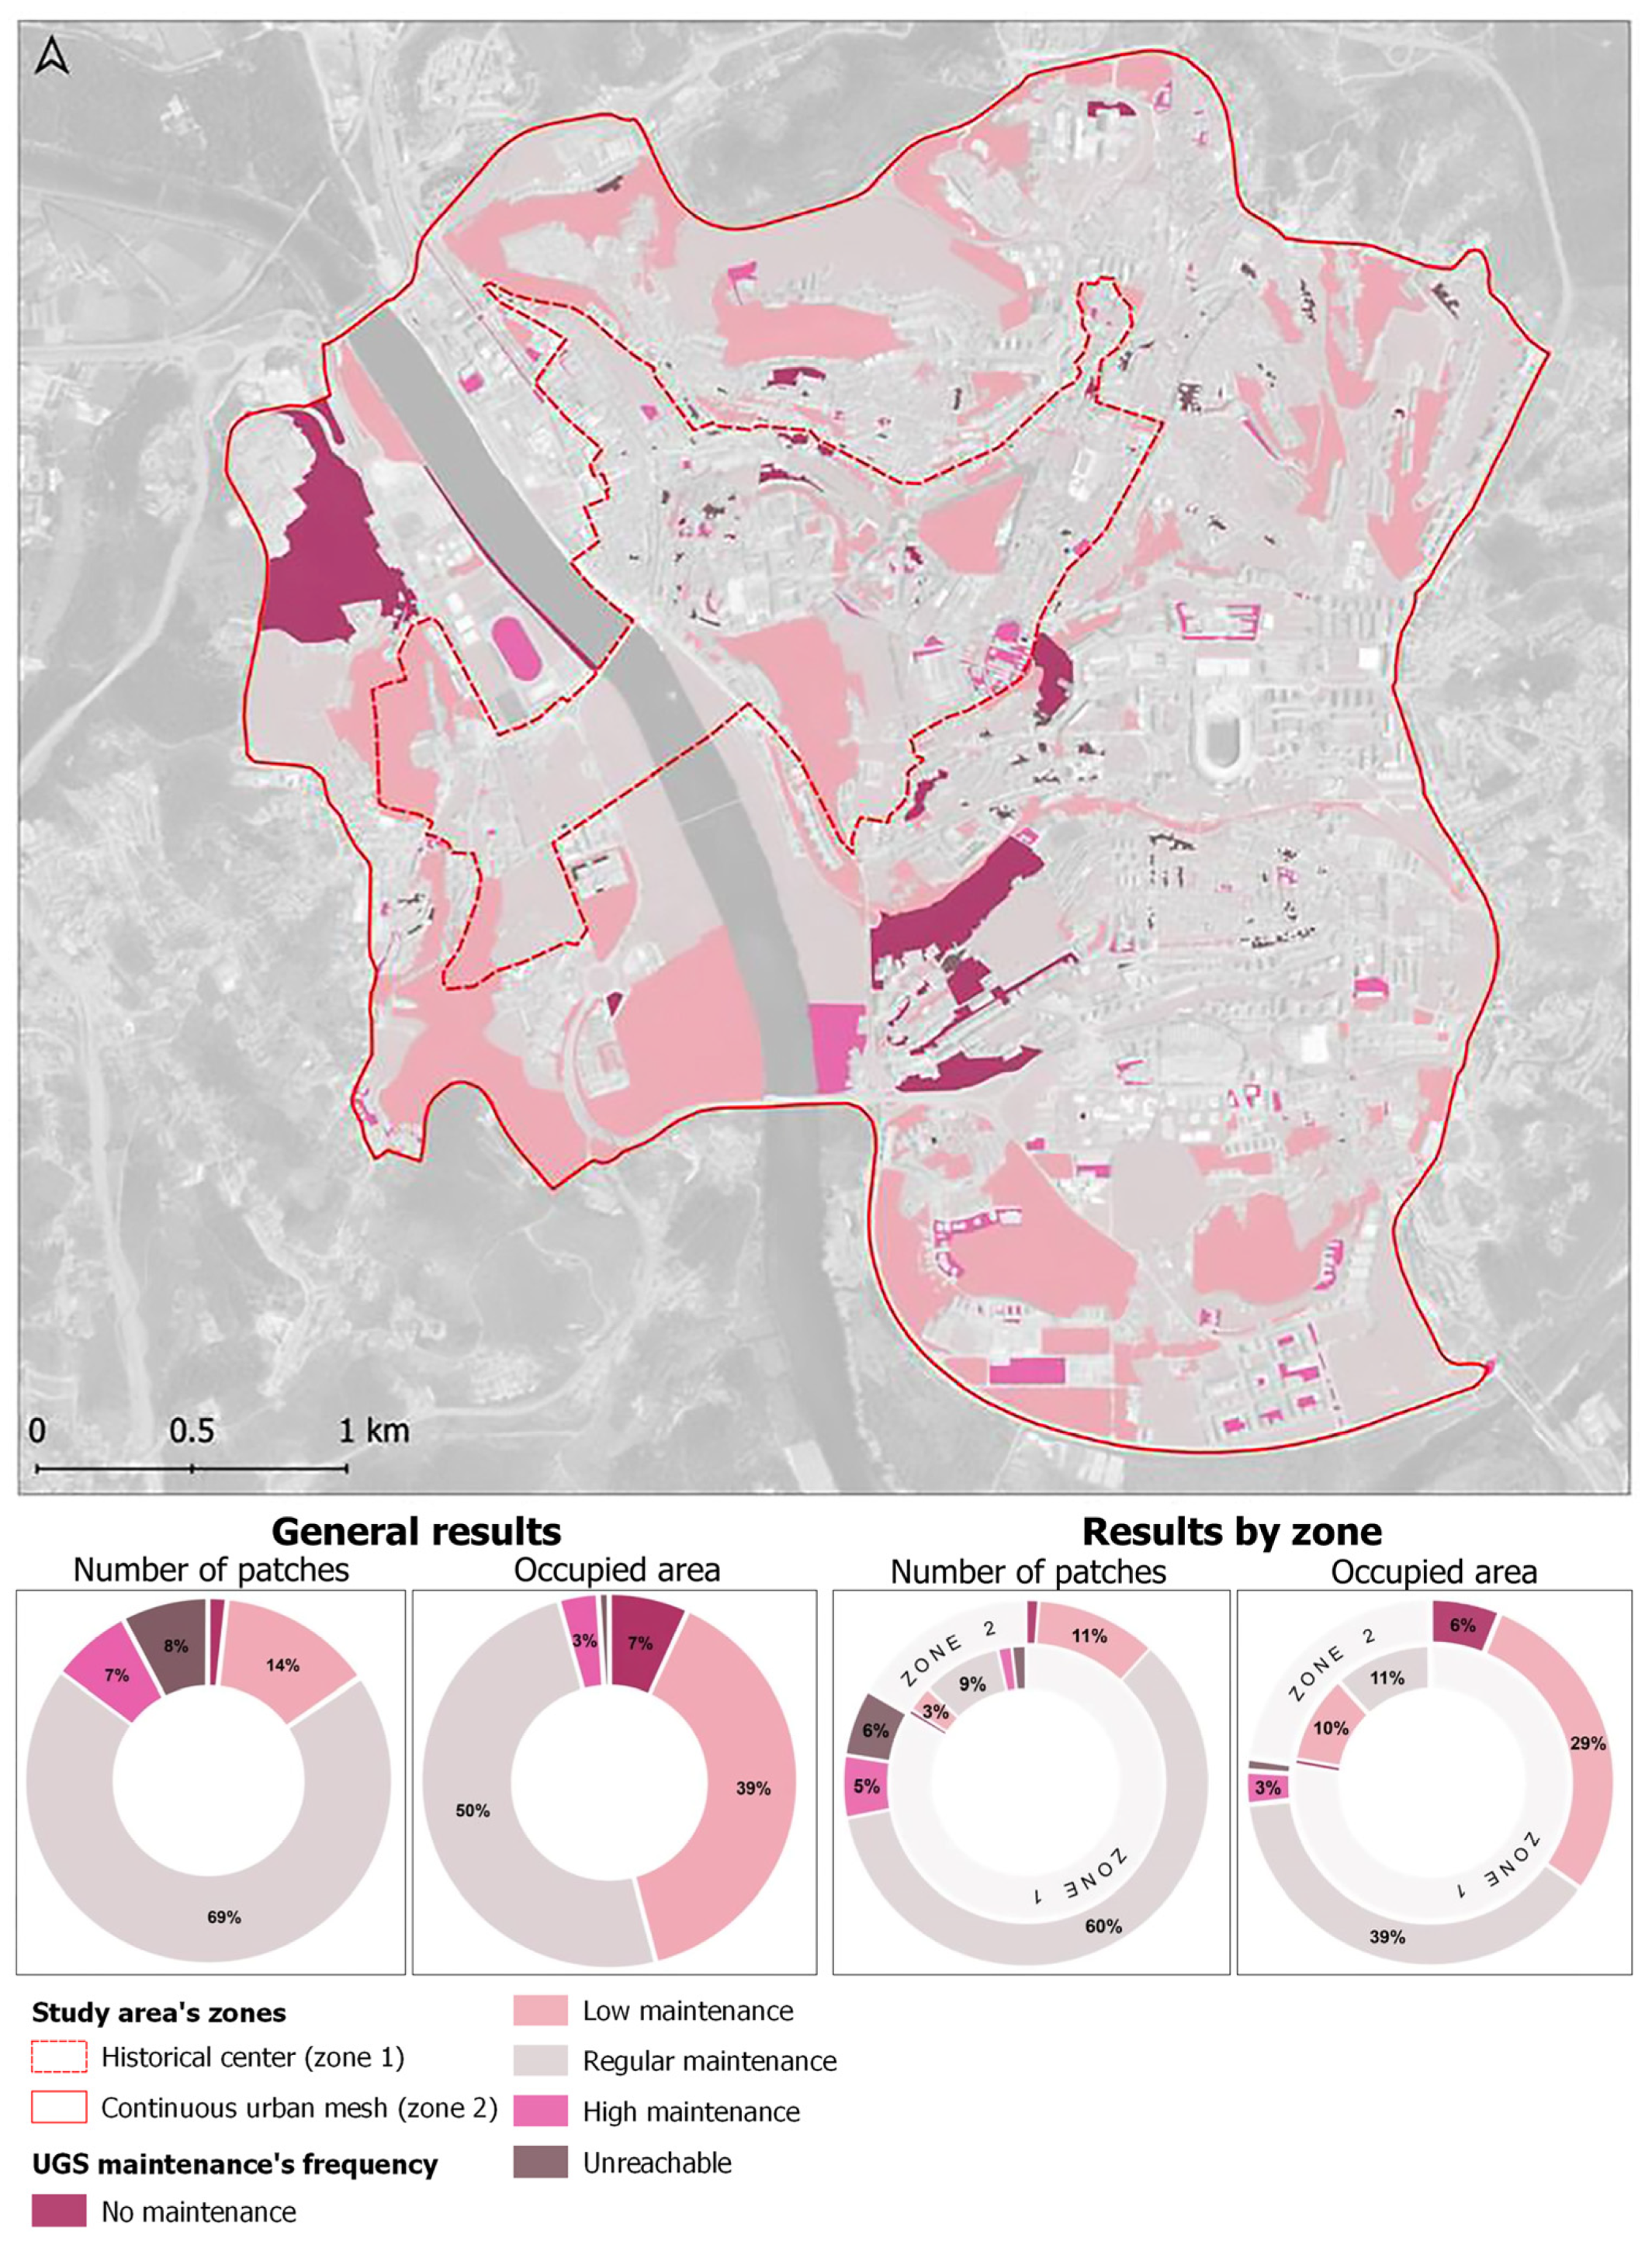
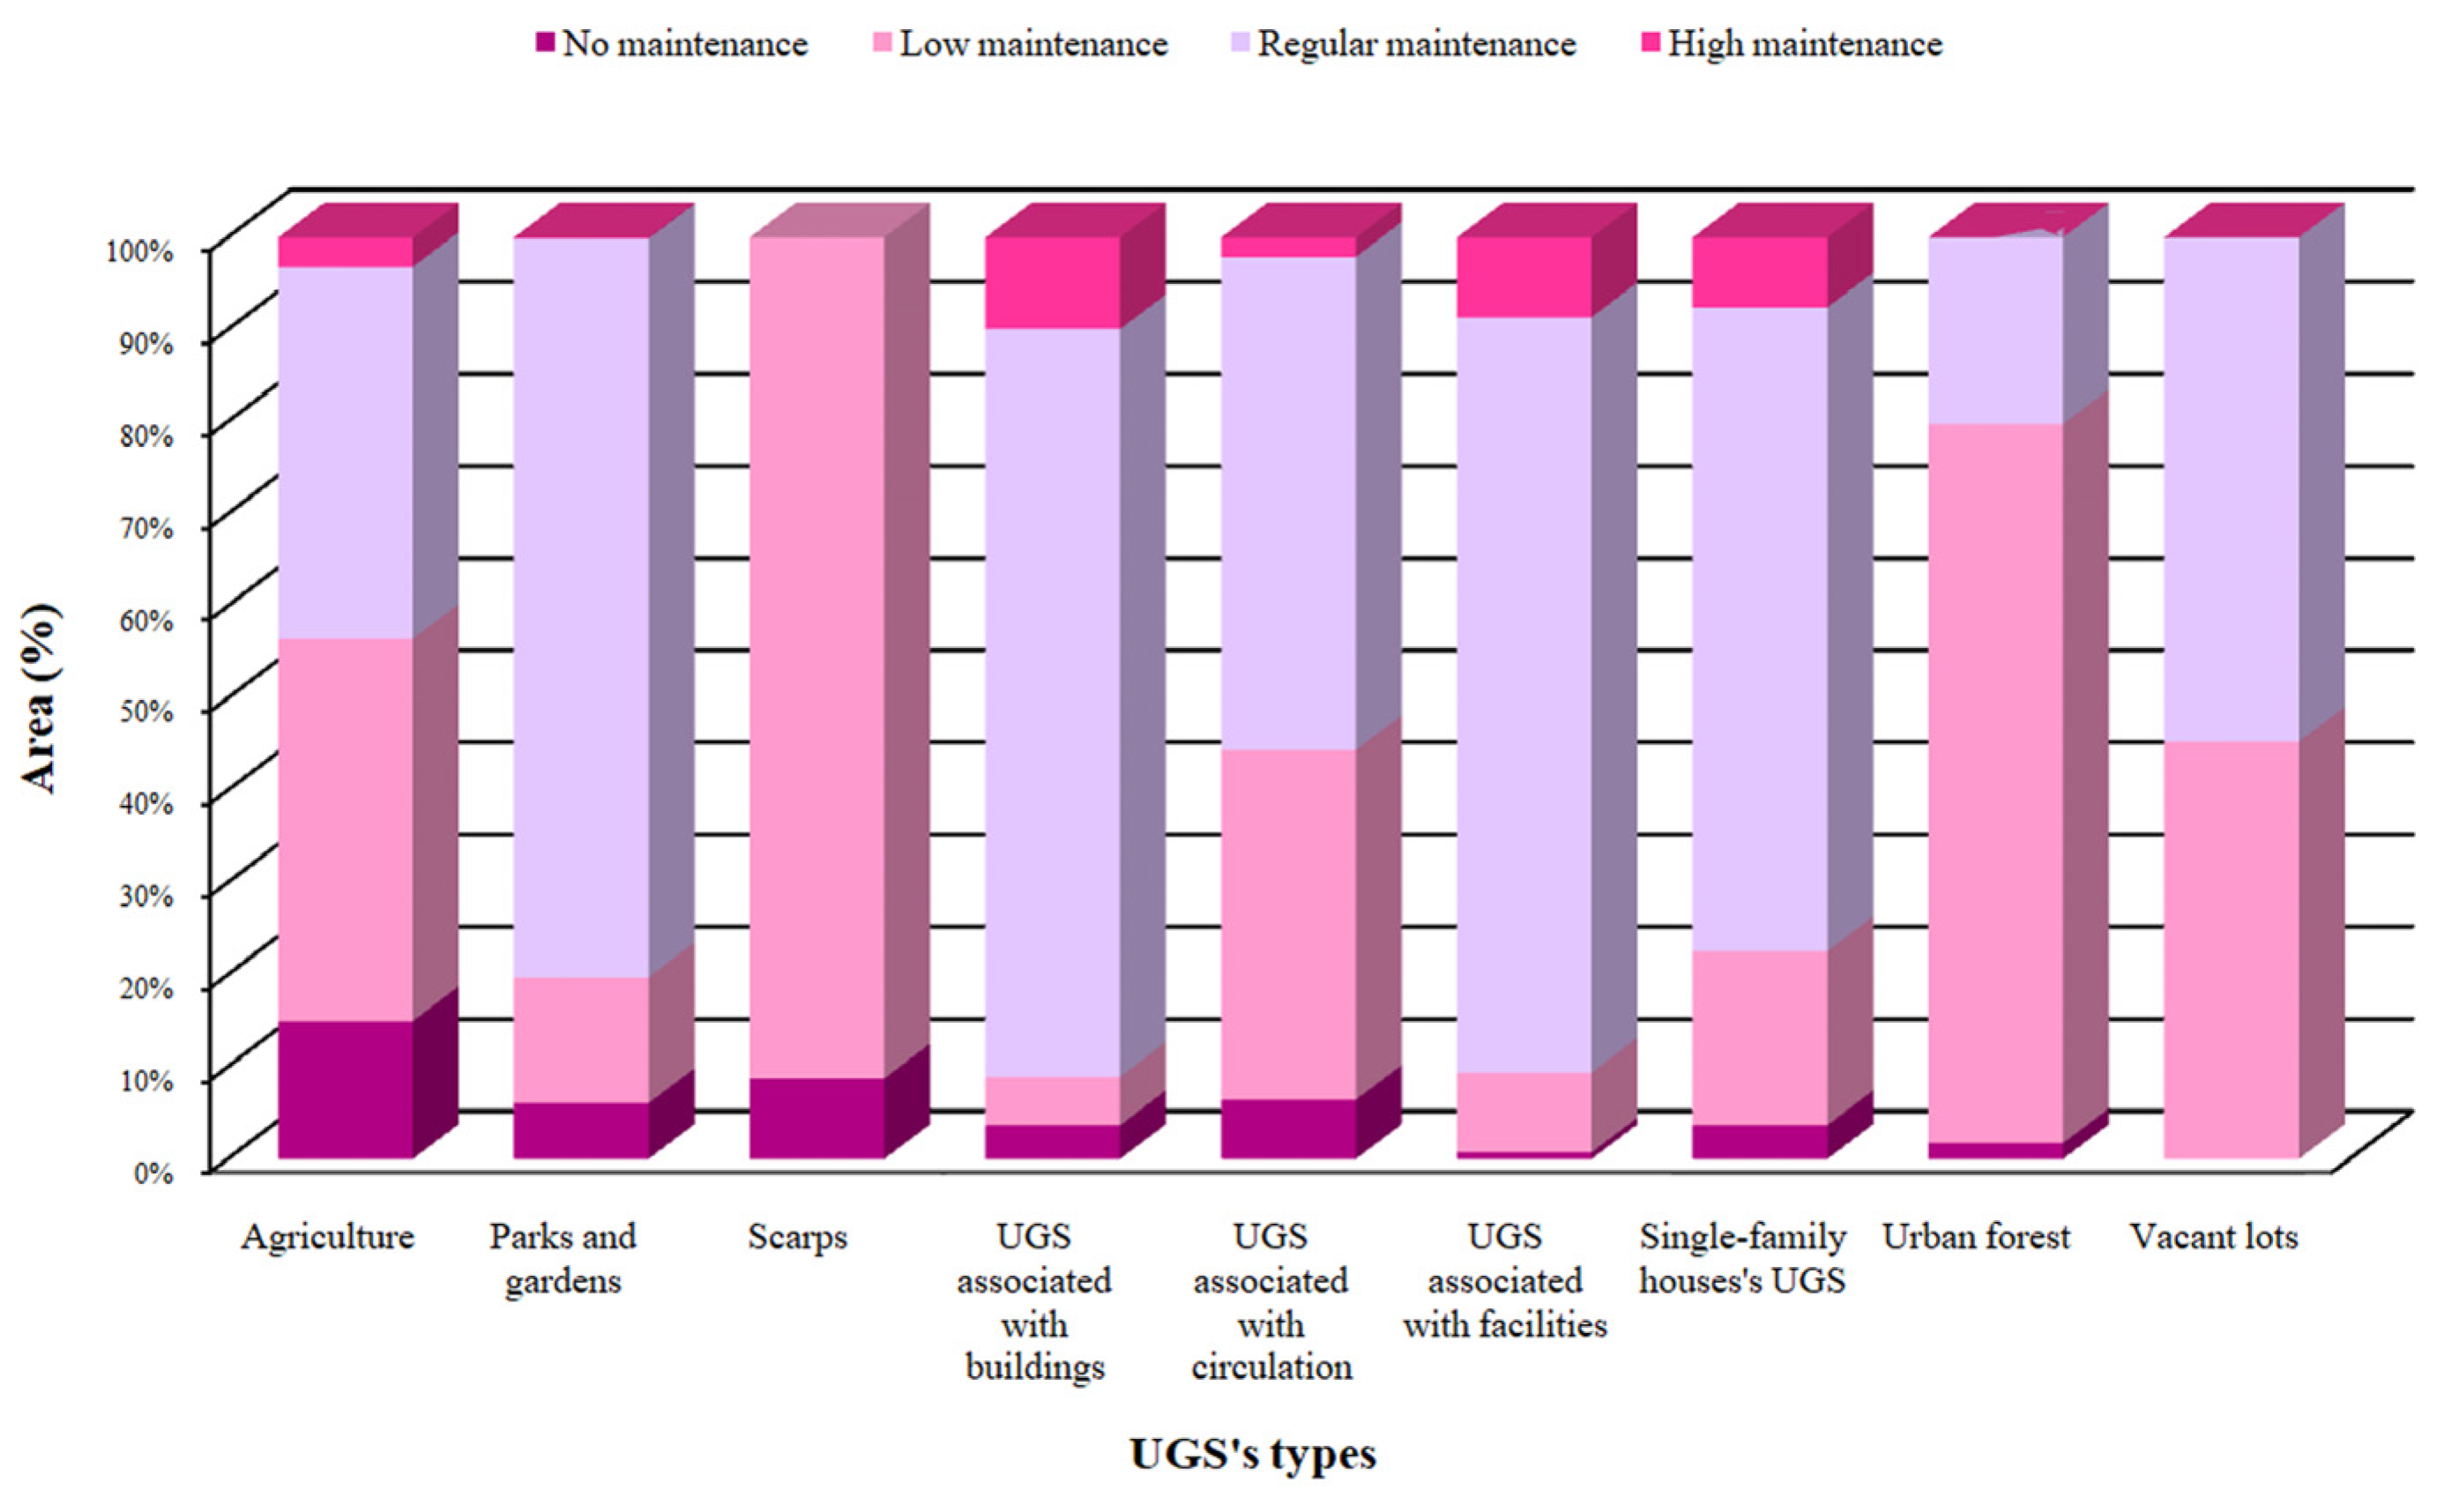
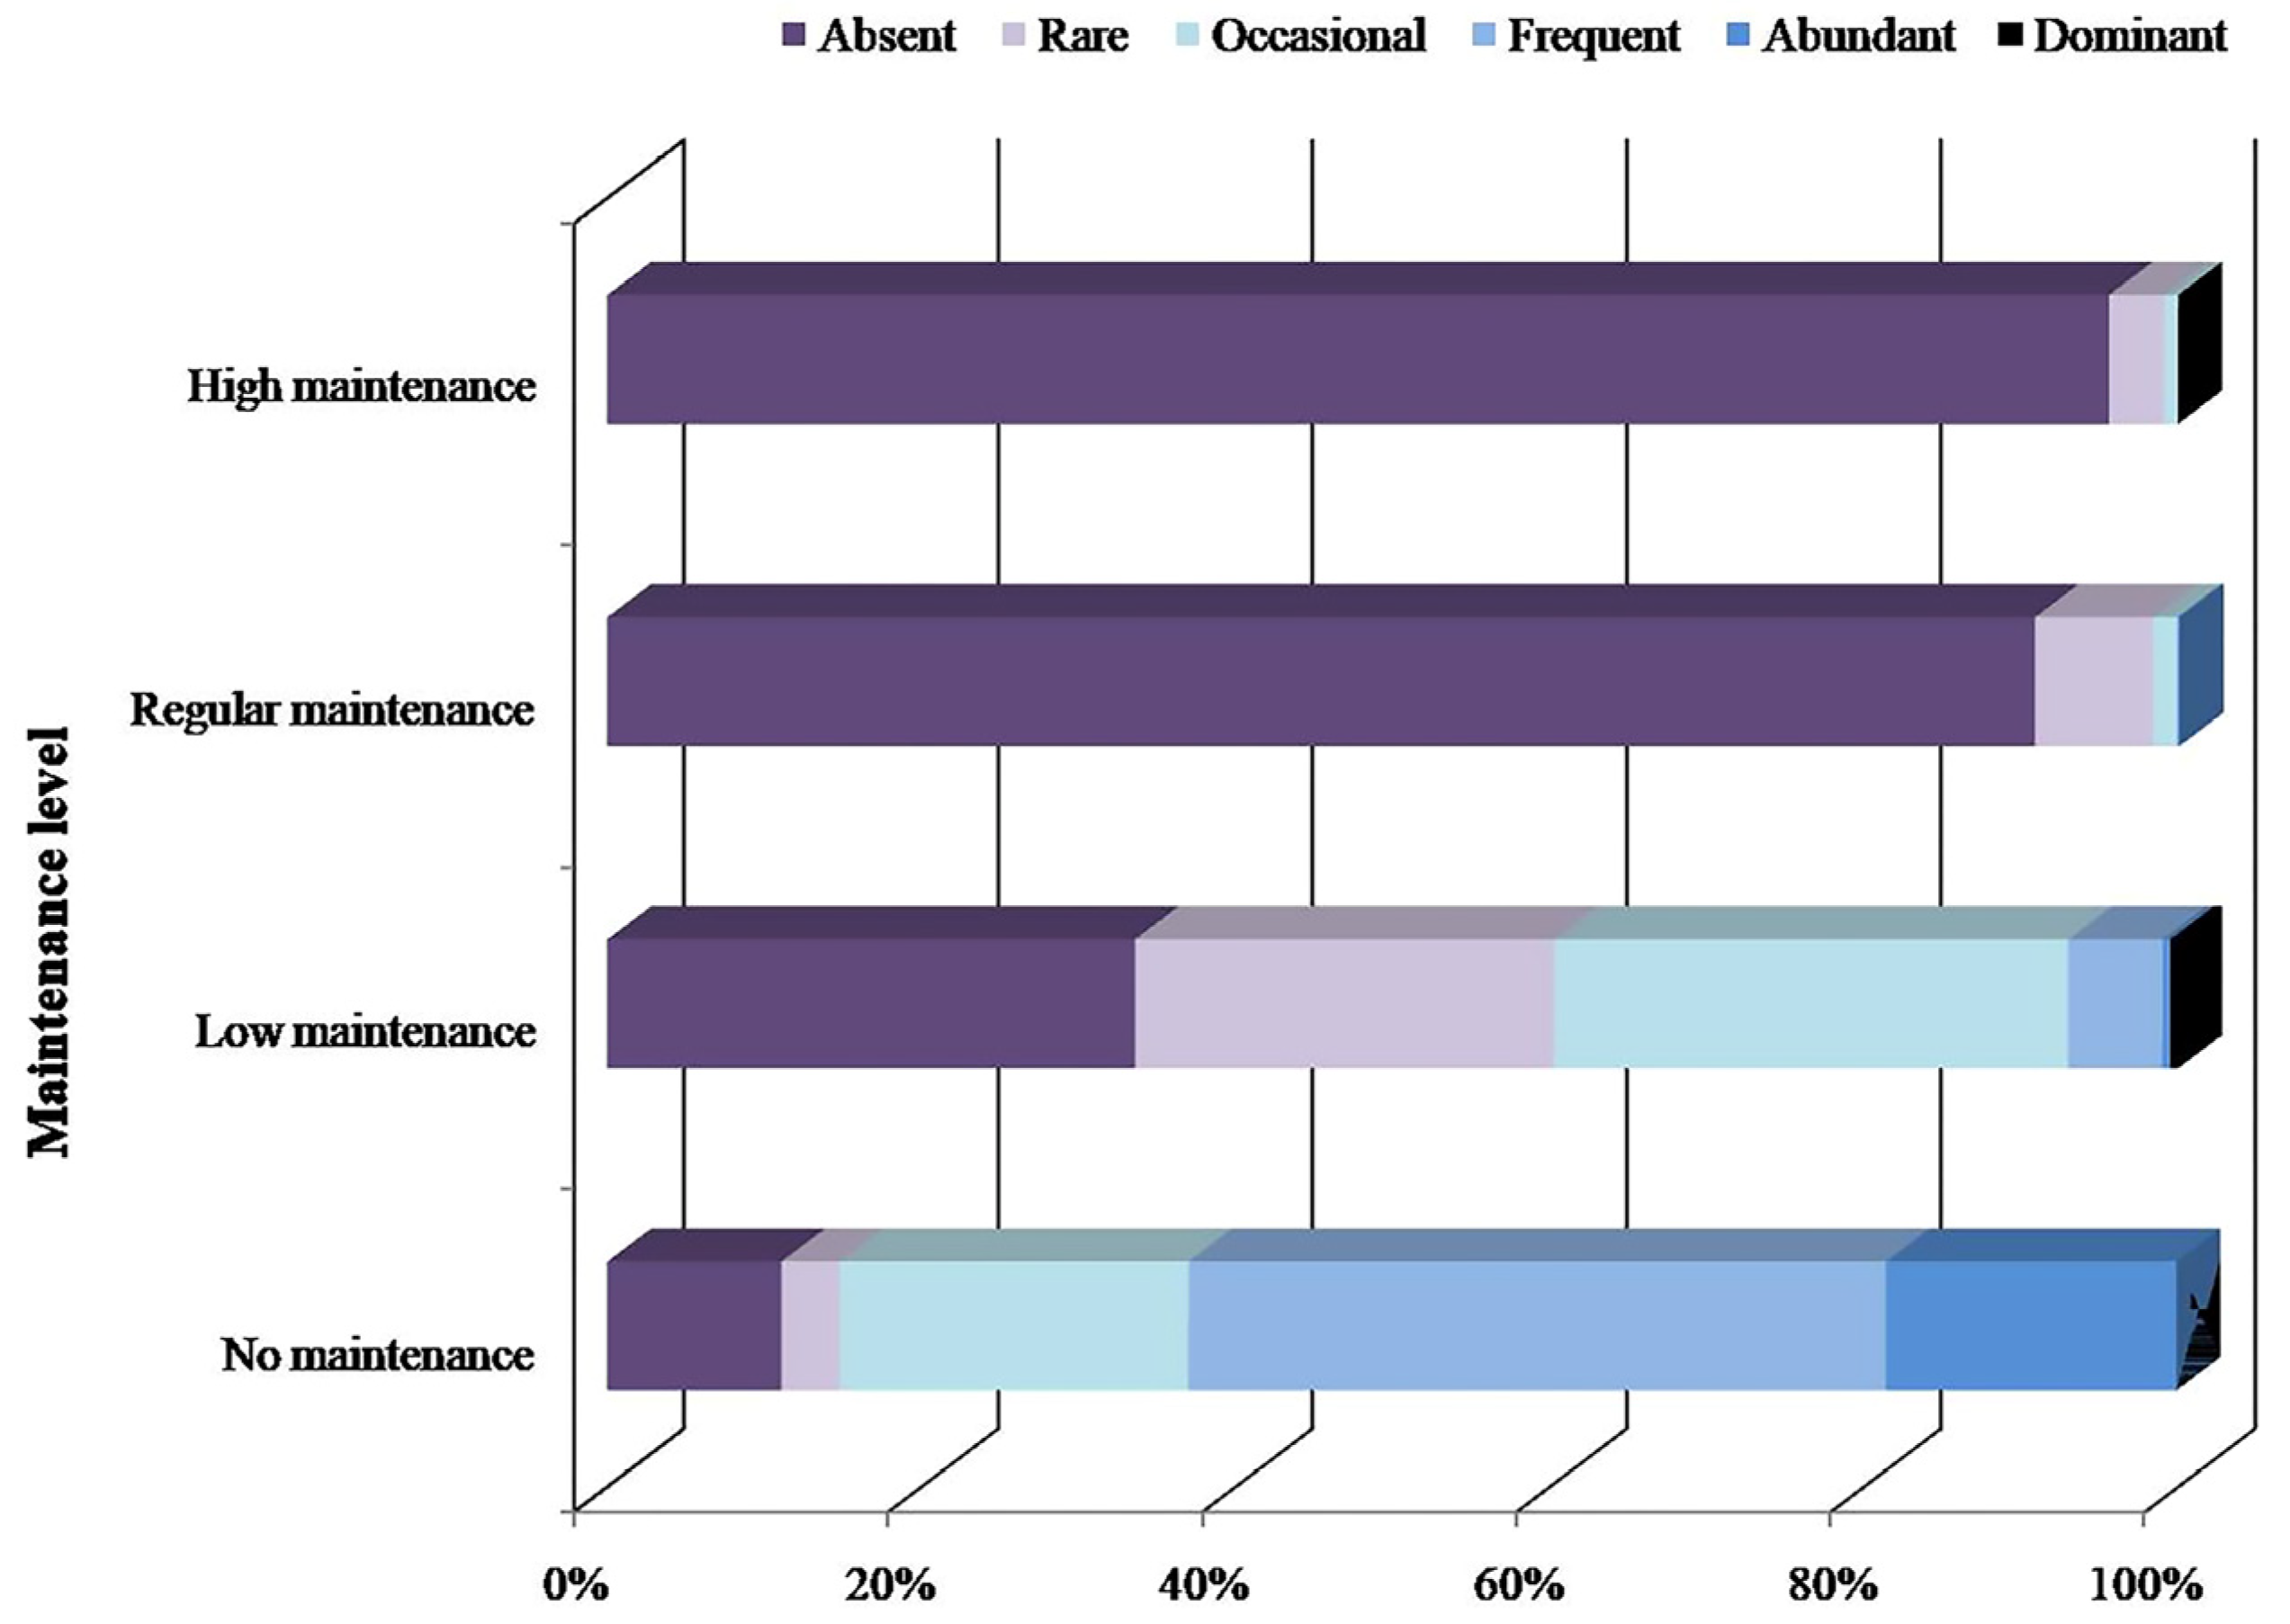
3.1.3. Maintenance Level of Urban Green Spaces

Despite UGSs with regular maintenance being the most prevalent (Figure 7), accounting for 69% of the UGI spaces (number of patches), UGSs with low maintenance frequency have a significant prevalence (14%), while those with high maintenance are less represented (7%). When analysing the area associated with each maintenance level, spaces with regular maintenance prevail, covering 50% (292.3 ha) of the UGI area. This is followed by UGSs with low maintenance, representing 39% (230.6 ha), and those with no maintenance, accounting for 7% (39.7 ha).
Considering the number of patches, 60% of the UGSs in zone 2 have regular maintenance, followed by UGSs with a low (11%) and high (5%) frequency of maintenance. Of note, 6% of these UGSs were considered unreachable due to lack of visibility. Regarding the frequency of maintenance by occupied area, our data show that 39% of UGSs in zone 2 have regular maintenance, followed by UGSs with a high frequency of maintenance (29%), no maintenance (6%) and high frequency of maintenance (3%).
According to our results, UGSs types dedicated to provisioning or conservation functions, such as urban forests and agricultural areas, typically have low levels of maintenance (Figure 8). Approximately 78% of urban forests and 42% of agricultural areas are maintained at a low frequency. In contrast, UGSs types with recreational purposes, such as parks and gardens, as well as UGSs associated with facilities, buildings, and single-family houses, are mainly associated with regular maintenance. Interestingly, areas with no maintenance were detected across all UGSs types, except for vacant lots. These no maintenance areas were particularly notable in agricultural areas and scarps, while also being present in parks and gardens, including UGSs associated with circulation and single-family houses. The results for vacant lots were unexpected. It was expected that they would have a higher percentage of no maintenance spaces. However, the field surveys confirmed that the vacant lots has low (42%) or regular maintenance (68%).

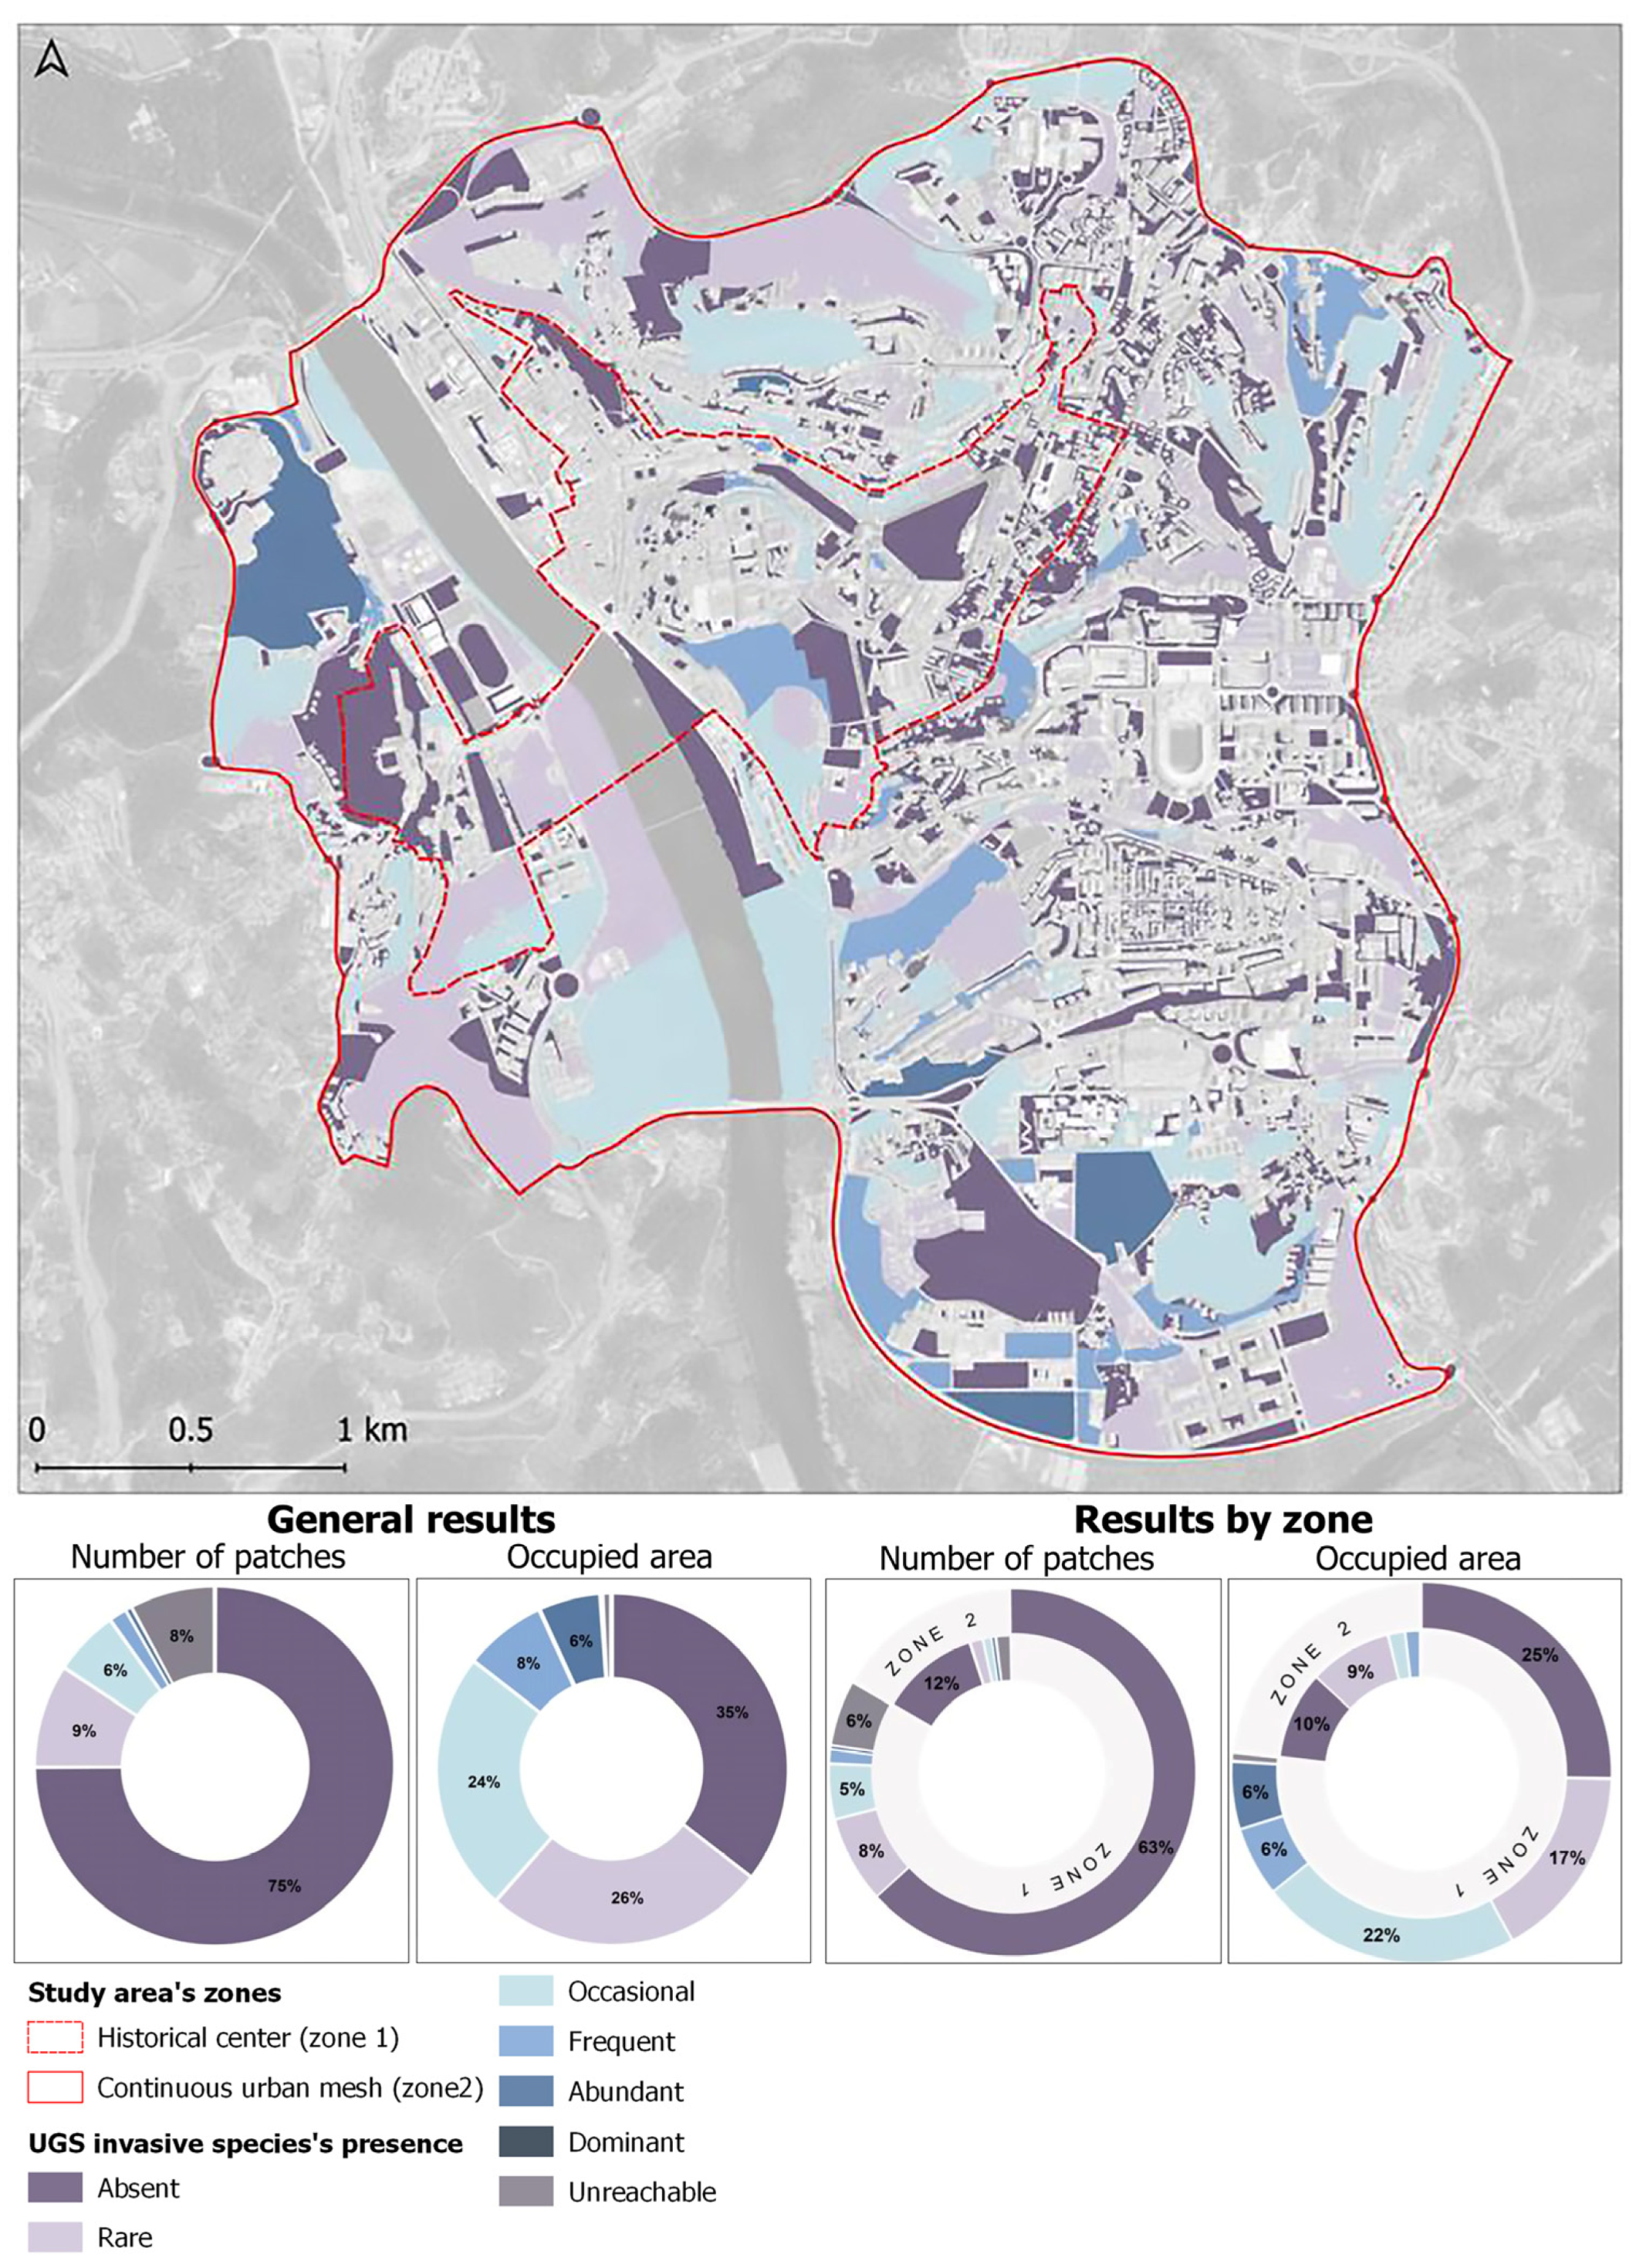
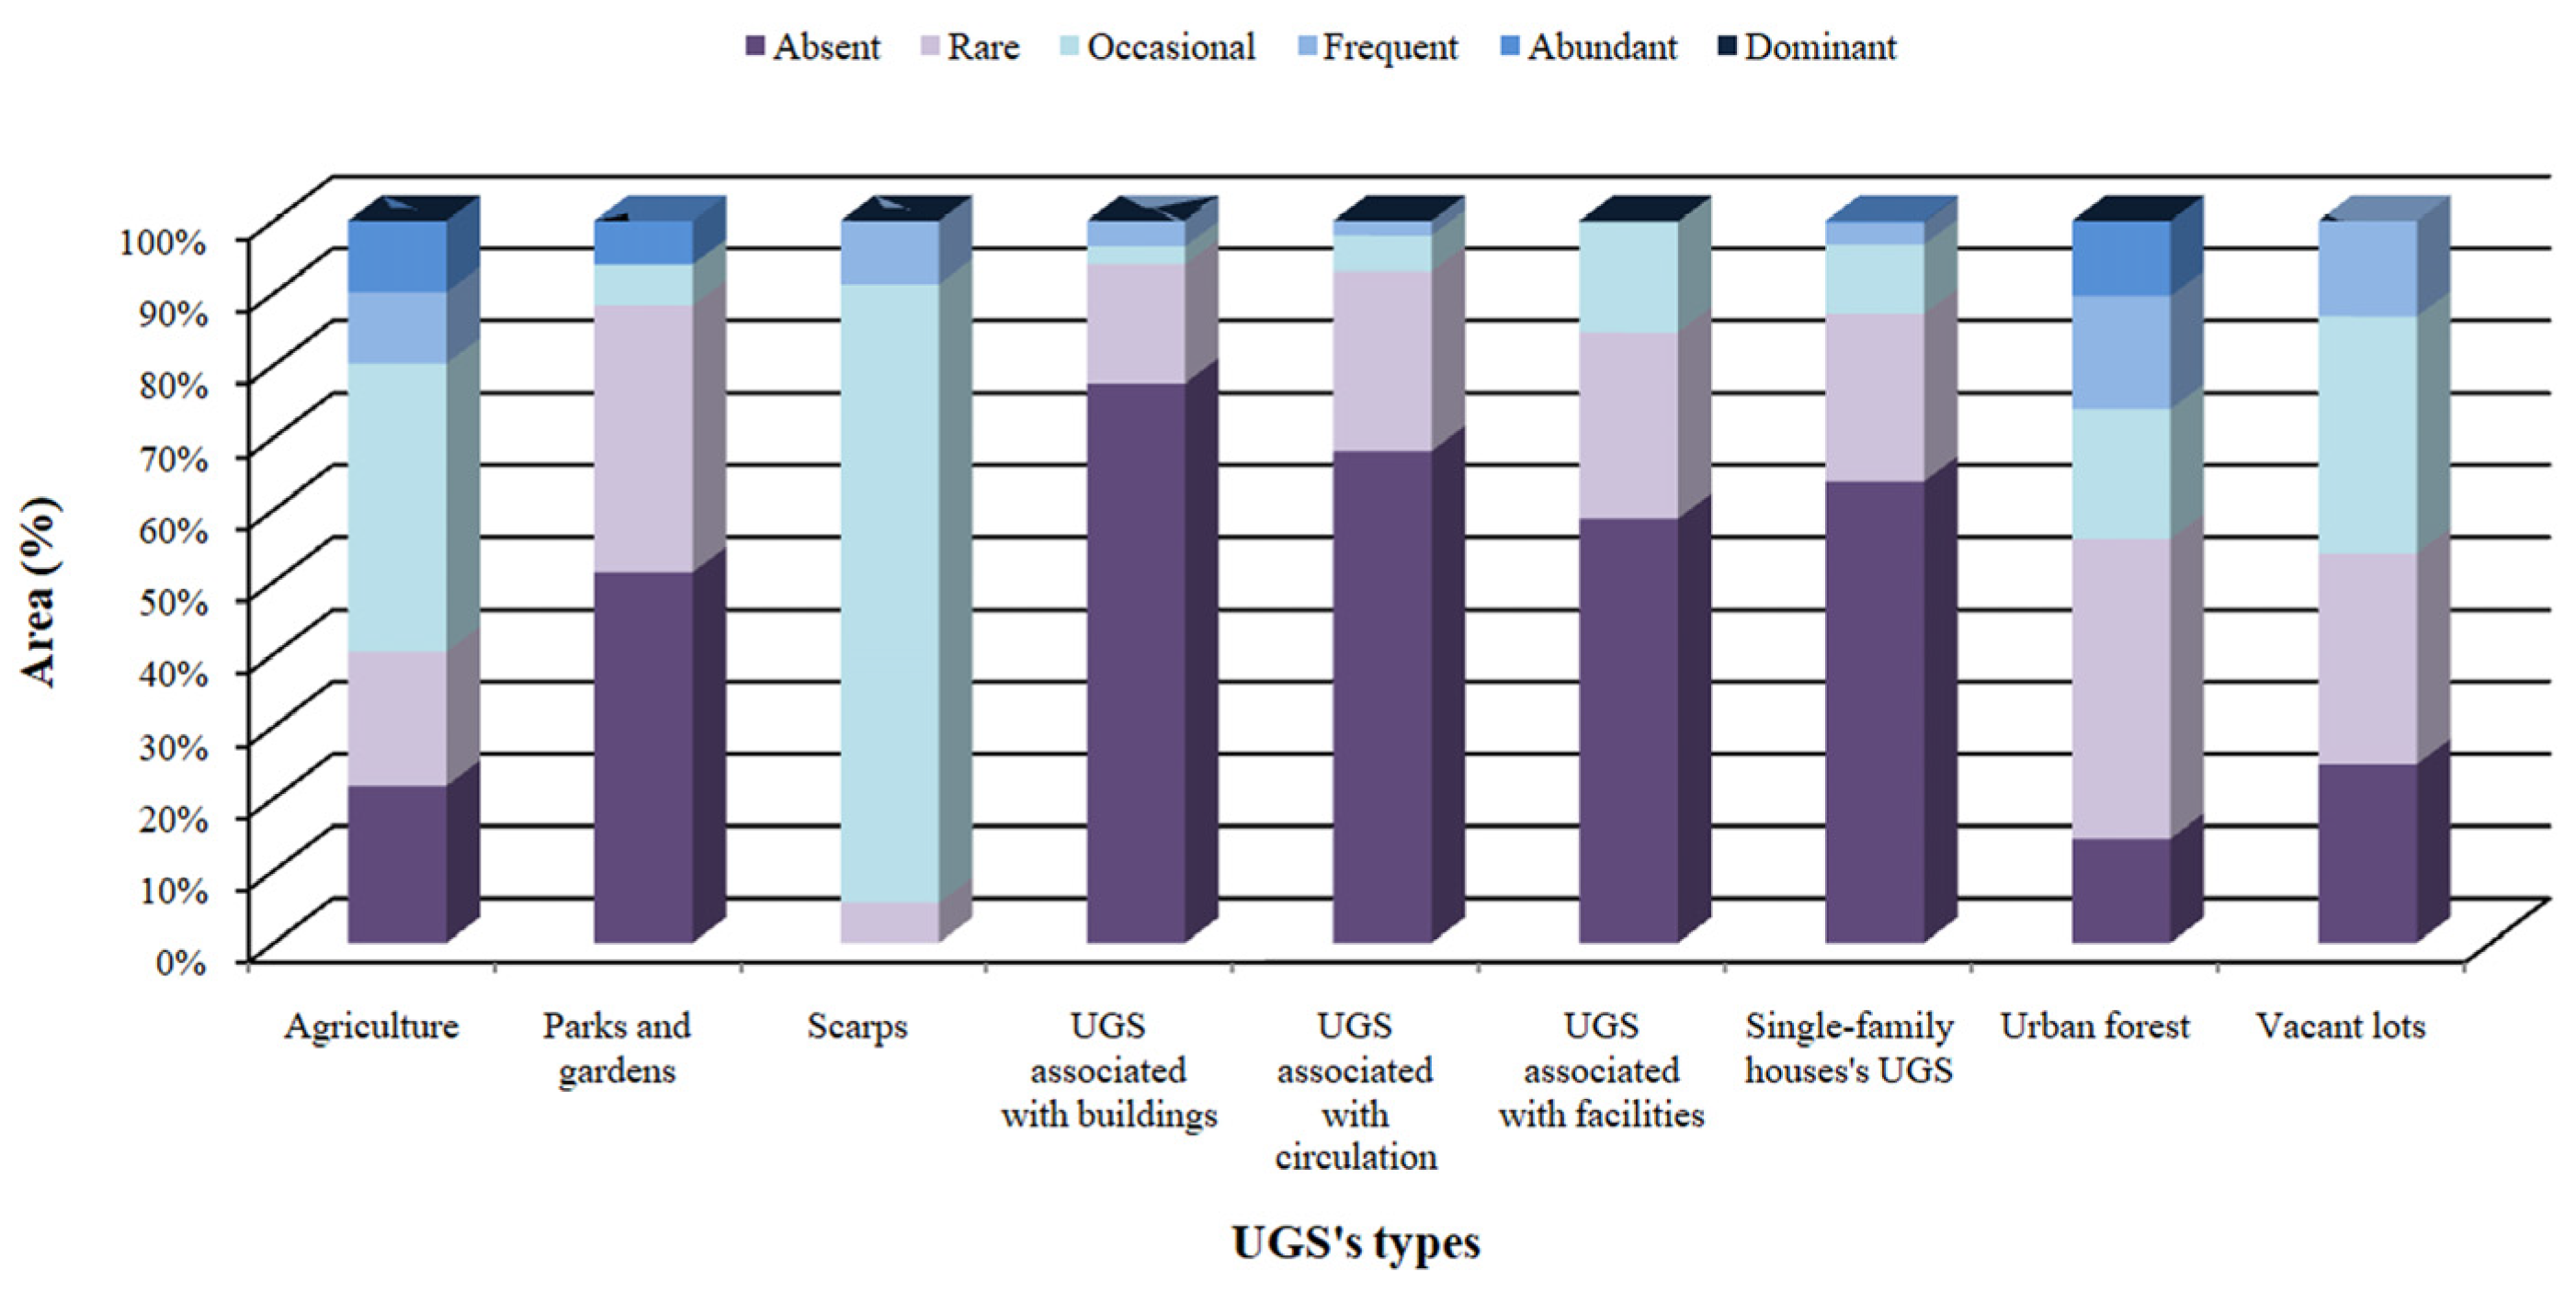
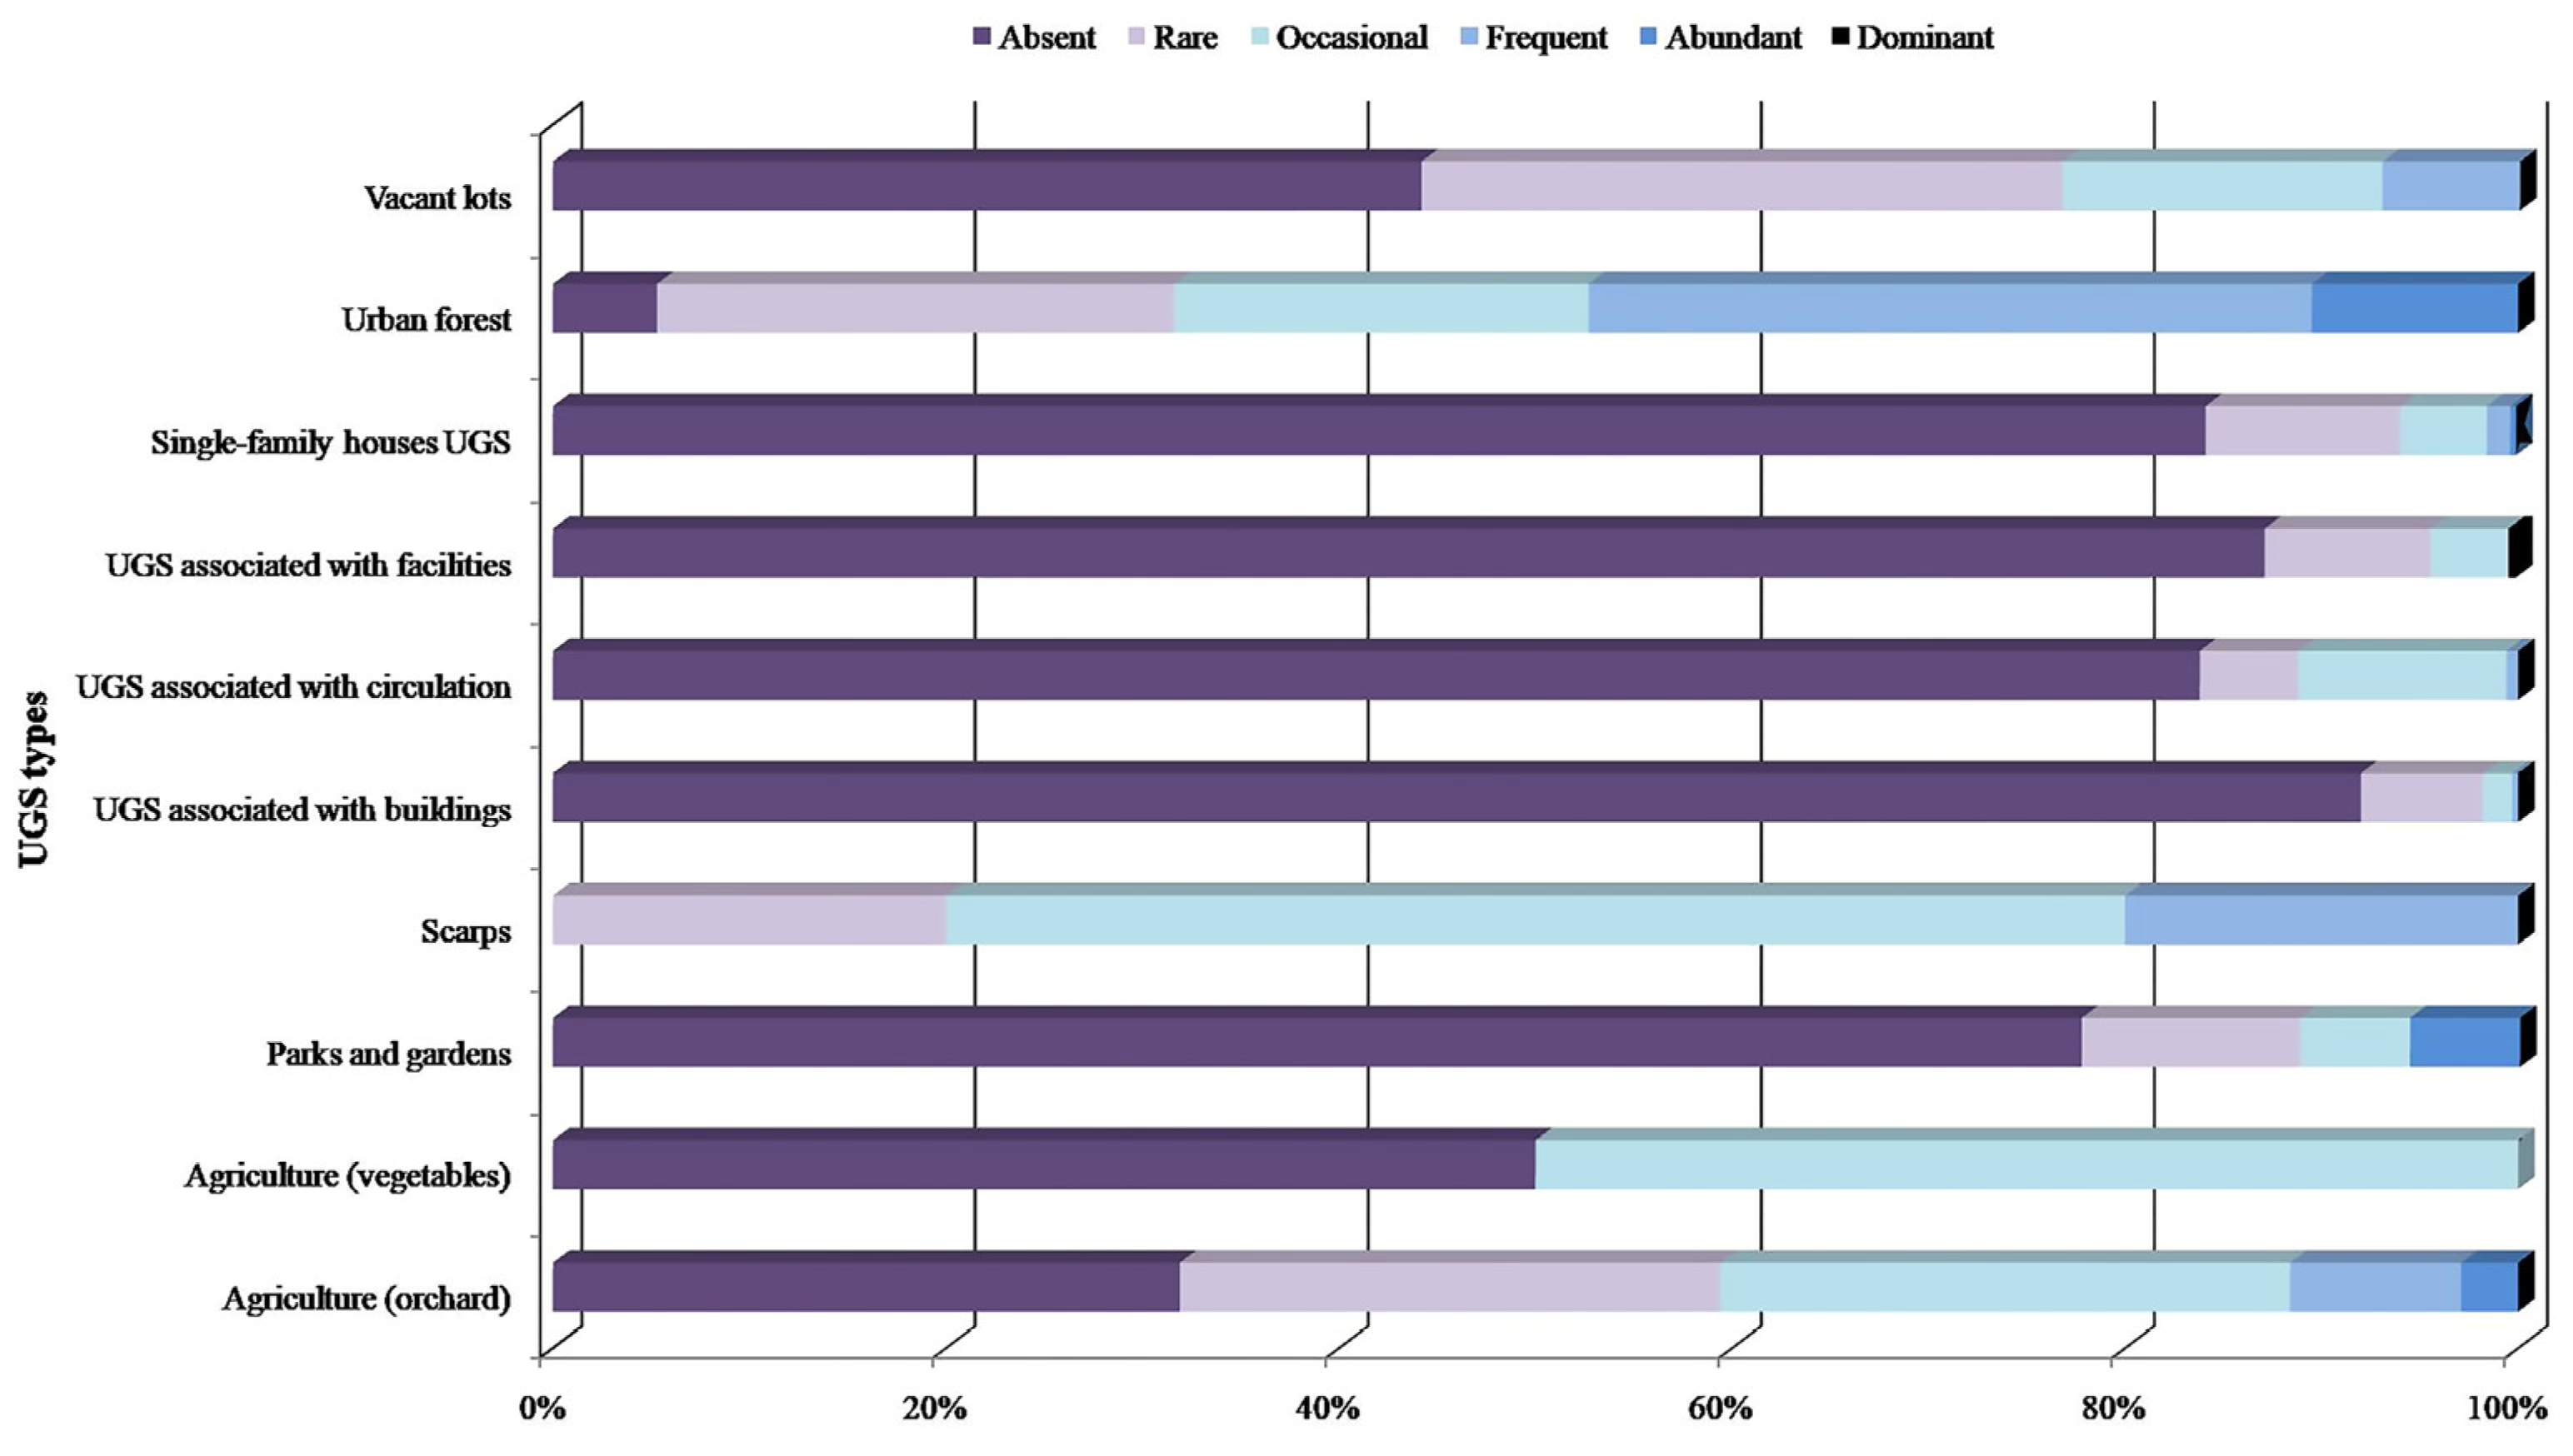
3.2. Invasive Plant Species in Urban Green Infrastructure

Regarding the occurrence of invasive plant species in the UGI (Figure 9), no occurrences were recorded in 75% of the UGSs (number of patches). Rare presence was registered in 9% of the patches, occasional presence in 6%, frequent presence in approximately 1.5%, with abundant and dominant only in 0.5%, with a prevalence of Acacia sp., Ailanthus altissima, Arundo donax, Cortaderia selloana, Ipomoea sp., Lantana camara, Opuntia sp., and Robinia pseudoacacia. It was not possible to confirm the presence of invasive plants in 8% of the patches, which were classified as unreachable. Despite the low percentage of patches (number) with records for invasive species, considering the area of the patches, about 64% of the UGSs already register the presence of invasive plants. Of note, 35% of UGSs have no invasive species (208.7 ha), followed by UGSs with rare presence accounting for 26% (152.7 ha), and occasional presence representing 24% (141.8 ha). UGSs with frequent presence of invasive species comprise 8% (45.1 ha), while those with abundant or dominant presence of invasive species account for 6% (34.2 ha). Unreachable spaces make up 1%, corresponding to 5.5 ha of the UGI area.
According to our data, and regarding the number of patches, invasive plant species were recorded in 14% of the UGSs in zone 2, mostly with rare (8%) or occasional presence (5%), with only 1% presenting frequent occurrence. Such scores are lower in zone 1; once invasive plant species were recorded in 5% of the patches, presenting rare (2%), occasional (1%), and frequent occurrence (2%) (Figure 9). The same pattern applies to the occupied area. Invasive plant species were recorded in UGSs that represent around 51% of the UGI of zone 2, ranging from rare (17%) or occasional (22%), the most common situations, to frequent (6%) or abundant occurrence (6%). In zone 1, 13% of the UGSs have in their composition invasive plant species—9% with rare presence, 2% with occasional presence, and 2% with frequent presence (Figure 9).
Despite the existence of records of invasive plant species in all types of UGSs, a significant number of patches have no records (Figure 10). Scarps, urban forests, agricultural areas, vacant lots, and parks and gardens are the types in which invasive plant species exhibit higher prevalence, particularly larger spaces. This pattern can be attributed to the fact that larger spaces provide more opportunities for invasive species to establish and spread by offering more abundant resources and habitat [39,48]. However, invasive species were recorded even in smaller UGSs. For instance, invasive plant species were found in UGS associated with facilities (45%), single-family houses (40%), circulation (35%), and buildings (25%), highlighting that size alone does not fully determine invasions and other factors likely contribute to their establishment.
Maintenance frequency of UGSs seems to directly interfere with the establishment and proliferation of invasive plant species [42,44,50]. Our results show that UGSs with no maintenance exhibit higher presence of invasive plant species in their composition (Figure 11). Conversely, as maintenance practices increase, the occurrence of invasive plant species decreases.

Chi-Square Test

To verify whether there is a correlation between the diverse attributes (UGSs type, patch area, and maintenance level) and the invasive species occurrence, a chi-square test was conducted. According to our results, there is a significant relationship between the variables (p value < 0.001). The analysis of Cramer’s V coefficient, which quantifies the strength of the association between variables, reveals that the UGSs maintenance level is the most significant attribute (Cramer’s V = 0.470, sig. < 0.001) compared to the UGSs types (Cramer’s V = 0.256, sig. < 0.001) or considering the UGSs area (Cramer’s V = 0.252, sig. < 0.001) to invasive species occurrence.
Considering the UGSs types, the results obtained confirm the higher chance for the occurrence of invasive species in scarps, urban forests, agricultural areas, and vacant lots (Figure 12).
When assessing the role of patch area, our findings show a significant (sig. < 0.01) positive (Spearman = 0.44) correlation between patch area and invasive species occurrences (Figure 13), confirming that an increase in patch area is followed by an increase in invasive species occurrence.
As previously mentioned, the UGSs maintenance level is the variable with a higher contribution to explaining invasive species occurrence. In fact, approximately 63% of the areas with no maintenance present frequent (44%) to abundant (19%) occurrence of invasive species (Figure 14). Also, more than 50% of the areas with low maintenance register rare (27%) or occasional (33%) occurrence for such species. As expected, approximately 91% of areas with regular maintenance do not have records of invasive species, with a rare presence being detected in only 8% of patches. With a high maintenance level, only 4% of patches record the rare occurrence of invasive species. Although heavily invaded areas (level 4 and 5) have a low maintenance level (level 1), around 14% of areas with an abundant presence (level 4) of invasive species have regular maintenance.

4. Discussion

The multifunctionality and complexity of the UGI, as a network of UGSs delivering a wide range of ESs, underscores the importance of deepening our understanding of its structure and functioning. This requires a detailed analysis of the UGSs types, their composition, size and geometry, and maintenance practices, aiming to promote UGI management strategies that maximize ESs while minimizing potential EDs.
Although most studies focused on UGI primarily examine larger UGSs [16,17,18,19], the nature of this study required the inclusion of all UGSs types. This comprehensive approach posed significant challenges to data collection. In particular, the identification and visual assessment of smaller UGSs proved difficult, highlighting the practical limitations researchers face when aiming to incorporate the full diversity of UGSs in UGI analysis. To overcome this gap, the use of photointerpretation could be a solution. In our case, it contributed to significantly reducing the area excluded to approximately 1% of the area of the UGI. Nevertheless, the potential subjectivity in classifying maintenance levels or the occurrence of invasive species, the temporal snapshot of the invasion data, or the limited visual access to the total area for some UGSs are still important challenges. Despite the fact that our results are based on Coimbra UGI-specific conditions, some key points can be outlined, namely, the novelty of including in the analysis UGSs types very often excluded in other studies, such as UGSs associated with single-family houses, which emerge as one of the most representative types in zone 2 of the study area. In fact, our results highlight the importance of small UGSs in the UGI, once they integrate high diversity considering the type (e.g., UGSs associated with facilities, circulation, and buildings), ownership (public, private, or conditional) and maintenance level carried out [64]. Such small UGSs have, predominantly, regular maintenance, a different condition recorded for larger UGSs, dedicated to provisioning ESs, such as urban forests and agricultural areas, which have a low level of maintenance. Such attributes, linked with the use and functionality of each space, have a direct impact on the occurrence of invasive plant species [33]. In Coimbra, invasive plant species are more prevalent in UGSs located on slopes, such as scarps, and in large patches of urban forests and agricultural areas, all of which are characterized by low maintenance level. These findings are aligned with results from other studies [45,46,65,66], which indicate that the likelihood of invasive plant species occurrence is significantly higher in natural UGSs types than in areas designated for leisure or recreation. This pattern is largely attributed to the reduced maintenance typically observed in natural areas compared to UGSs intended for recreational or aesthetic purposes [67]. In particular, UGSs with infrequent mowing or soil disturbance [44,50], poor irrigation, or nutrient-deficient soils [42], tend to create favorable conditions for the establishment and spread of invasive plant species, which can outcompete native vegetation. However, despite periodically or with less representation, invasive plant species can be found in areas with regular maintenance, like parks and gardens, UGSs associated with facilities, single-family houses, circulation, and buildings.
Although invasive species occurrence increases in large patches [39,48], their susceptibility to invasion is significant even in small areas with regular or high maintenance levels. Also, some studies have considered the association between the occurrence of invasive species with road margins, ruderal sites, and railway systems [46,47,68]. Our results confirm that UGSs associated with circulation can contribute to invasion even in urban areas. Approximately 11% of UGS patches associated with circulation registered the occasional occurrence of invasive species, and 8% with low maintenance and 3% with regular maintenance present rare occurrence. It is likely that the type and maintenance level of UGSs does not adequately consider the issue of invasive species occurrence, and it may be necessary to adjust measures to reduce susceptibility to invasion. Thus, dedicated measures to reduce spread must focus on all UGSs types and involve owners and entities responsible for maintenance. Recognizing these findings is the first step towards establishing appropriate management and design practices adapted to reduce the susceptibility to invasion by non-native plant species.
Given the high proportion of exotic species in the UGI [43], it can become a platform that mediates the exchange of invasive species between the urban areas and the surrounding natural environments [69,70]. This dynamic reinforces the need for integrated management strategies. Regular monitoring, early detection, and prompt removal of invasive plant species [49,51], along with restriction on the use of exotic plant species in the design and composition of UGSs [42,44],are among the key measures recommended in the literature to limit the spread of these species, which are known to contribute to ecological disservices. However, more research about the interactions and occurrence of invasive species in urban areas is essential to understand invasion patterns and prevent the spread of such species.

5. Conclusions

As a network of UGSs, UGI presents intrinsic and unquestionable value for the ESs it provides. Therefore, the in-depth study of its UGSs types and its attributes, such as size and geometry, and maintenance, is essential to optimize the provision of ESs and minimize potential EDs. While most research focuses on larger UGSs, our work intends to provide a detailed analysis of Coimbra UGI, including UGSs types associated with small patches.
Coimbra has a diverse range of UGSs types, in which urban forests, agricultural areas, and UGSs associated with single-family houses are more representative. While larger UGSs dedicated to ESs provisioning, such as urban forests and agricultural areas, have shown low maintenance efforts, smaller UGSs for ESs recreation, such as UGSs associated with facilities, buildings, or single-family houses, have regular maintenance. The study highlights the importance of recognizing the presence of invasive plant species in various UGSs types, highlighting the potential role of small UGSs in the proliferation of these species.
By recognizing the importance of all UGSs types, and their attributes, included in the UGI, implementing appropriate management strategies and addressing invasive plant species issues, it becomes possible to harness the full potential of the UGI of medium-sized cities like Coimbra, safeguarding its ecological integrity. Understanding the interconnection between UGI, UGSs, ESs, and EDs is essential for sustainable urban planning that prioritizes biodiversity conservation.

Supplementary Materials

The following supporting information can be downloaded at: https://www.mdpi.com/article/10.3390/urbansci9070260/s1, Landscape metrics.

Author Contributions

Conceptualization: M.A., C.F., and A.F.; methodology: M.A., C.F., and A.F.; field data survey and validation: M.A. and A.F.; data curation and analysis: M.A.; writing—original draft preparation: M.A.; writing—review and editing: M.A., C.F., and A.F. All authors have read and agreed to the published version of the manuscript.

Funding

This research received support from national funds through Fundação para a Ciência e Tecnologia, I. P (FCT), under the project BLINC (2023.11451.PEX).

Data Availability Statement

The data that support the findings of this study are available from the corresponding author upon reasonable request.

Acknowledgments

The authors acknowledge support from CEGOT (Centre of Studies in Geography and Spatial Planning), funded by National Funds through Fundação para a Ciência e a Tecnologia (FCT) under the reference UIDB/04084/2025; and from CIBIO/InBIO (Centro de Investigação em Biodiversidade e Recursos Genéticos) funded by National Funds through FCT-Fundação para a Ciência e a Tecnologia in the scope of the project LA/P/0048/2020.

Conflicts of Interest

The authors declare no conflicts of interest. The funders had no role in the design of the study; in the collection, analysis, or interpretation of the data; in the writing of the manuscript; or in the decision to publish the results.

Abbreviations

The following abbreviations are used in this manuscript:
ESsEcosystem Services
EDsEcosystem Disservices
UGIUrban Green Infrastructure
UGSsUrban Green Spaces

References

  1. European Union. Report from the Commission to the European Parliament, the Council, the European Economic and Social Committee and the Committee of the Regions. Review of Progress on Implementation of the EU Green Infrastructure Strategy 2019. Available online: https://eur-lex.europa.eu/legal-content/EN/TXT/PDF/?uri=CELEX:52019DC0236&qid=1562053537296&from=EN (accessed on 11 November 2024).
  2. Hasen, R.; Pauleit, S. From Multifunctionality to Multiple Ecosystem Services? A Conceptual Framework for Multifunctionality in Green Infrastructure Planning for Urban Areas. AMBIO 2014, 43, 516–529. [Google Scholar] [CrossRef] [PubMed]
  3. Ahern, J. Green Infrastructure for Cities: The Spatial Dimension; University of Massachusetts: Amherst, MA, USA, 2007. [Google Scholar]
  4. Mell, I. Can green infrastructure promote urban sustainability? Proc. Inst. Civ. Eng.-Eng. Sustain. 2009, 162, 23–34. [Google Scholar] [CrossRef]
  5. Gill, S.; Handley, J.F.; Ennos, R.; Pauleit, S. Adapting Cities for Climate Change: The Role of the Green Infrastructure. Built Environ. 2007, 33, 115–133. [Google Scholar] [CrossRef]
  6. Demuzere, M.; Orru, K.; Heidrich, O.; Olazabal, E.; Geneletti, D.; Orru, H.; Bhave, A.G.; Mittal, N.; Feliu, E.; Faehnle, M. Mitigating and adapting to climate change: Multi-functional and multi-scale assessment of green urban infrastructure. J. Environ. Manag. 2014, 146, 107–115. [Google Scholar] [CrossRef]
  7. Jones, S.; Somper, C. The role of green infrastructure in climate change adaptation in London. Geogr. J. 2014, 180, 191–196. [Google Scholar] [CrossRef]
  8. Lindley, S.J.; Gill, S.E.; Cavan, G.; Yeshitela, K.; Nebebe, A.; Woldegerima, T.; Kibassa, D.; Shemdoe, R.; Renner, F.; Buchta, K.; et al. Green Infrastructure for Climate Adaptation in African Cities. In Urban Vulnerability and Climate Change in Africa: A Multidisciplinary Approach; Pauleit, S., Coly, A., Fohlmeister, S., Gasparini, P., Jørgensen, G., Kabisch, S., Kombe, W.J., Lindley, S., Simonis, I., Yeshitela, K., Eds.; Springer International Publishing: Berlin/Heidelberg, Germany, 2015; pp. 107–152. [Google Scholar]
  9. Carter, J.G.; Handley, J.; Butlin, T.; Gill, S. Adapting cities to climate change—Exploring the flood risk management role of green infrastructure landscapes. J. Environ. Plan. Manag. 2018, 61, 1535–1552. [Google Scholar] [CrossRef]
  10. Belčáková, I.; Świąder, M.; Bartyna-Zielińska, M. The Green Infrastructure in Cities as A Tool for Climate Change Adaptation and Mitigation: Slovakian and Polish Experiences. Atmosphere 2019, 10, 552. [Google Scholar] [CrossRef]
  11. De la Sota, C.; Ruffato-Ferreira, V.J.; Ruiz-García, L.; Alvarez, S. Urban green infrastructure as a strategy of climate change mitigation. A case study in northern Spain. Urban For. Urban Green 2019, 40, 145–151. [Google Scholar] [CrossRef]
  12. Sturiale, L.; Scuderi, A. The Role of Green Infrastructures in Urban Planning for Climate Change Adaptation. Climate 2019, 7, 119. [Google Scholar] [CrossRef]
  13. Locatelli, L.; Guerrero, M.; Russo, B.; Martínez-Gomariz, E.; Sunyer, D.; Martínez, M. Socio-Economic Assessment of Green Infrastructure for Climate Change Adaptation in the Context of Urban Drainage Planning. Sustainability 2020, 12, 3792. [Google Scholar] [CrossRef]
  14. Ramyar, R.; Ackerman, A.; Johnston, D.M. Adapting cities for climate change through urban green infrastructure planning. Cities 2021, 117, 103316. [Google Scholar] [CrossRef]
  15. Mumtaz, M. Green infrastructure as key tool for climate adaptation planning and policies to mitigate climate change: Evidence from a Pakistani City. Urban Clim. 2024, 56, 102074. [Google Scholar] [CrossRef]
  16. Tzoulas, K.; Korpela, K.; Venn, S.; Yli-Pelkonen, V.; Kaźmierczak, A.; Niemela, J.; James, P. Promoting ecosystem and human health in urban areas using Green Infrastructure: A literature review. Landsc. Urban Plan. 2007, 81, 167–178. [Google Scholar] [CrossRef]
  17. Haase, D.; Larondelle, N.; Andersson, E.; Artmann, M.; Borgström, S.; Breuste, J.; Gomez-Baggethun, E.; Gren, Å.; Hamstead, Z.; Hansen, R.; et al. A Quantitative Review of Urban Ecosystem Service Assessments: Concepts, Models, and Implementation. AMBIO 2014, 43, 413–433. [Google Scholar] [CrossRef]
  18. Filazzola, A.; Shrestha, N.; MacIvor, J.S. The contribution of constructed green infrastructure to urban biodiversity: A synthesis and meta-analysis. J. Appl. Ecol. 2019, 56, 2131–2143. [Google Scholar] [CrossRef]
  19. Farkas, J.Z.; Hoyk, E.; Batista de Morais, M.; Csomós, G. A systematic review of urban green space research over the last 30 years: A bibliometric analysis. Heliyon 2023, 9, e13406. [Google Scholar] [CrossRef]
  20. Wolch, J.R.; Byrne, J.; Newell, J.P. Urban green space, public health, and environmental justice: The challenge of making cities‘just green enough’. Landsc. Urban Planning 2014, 125, 234–244. [Google Scholar] [CrossRef]
  21. Eldridge, D.J.; Cui, H.; Ding, J.; Berdugo, M.; Sáez-Sandino, T.; Duran, J.; Gaitan, J.; Blanco-Pastor, J.L.; Rodríguez, A.; Plaza, C.; et al. Urban greenspaces and nearby natural areas support similar levels of soil ecosystem services. Urban Sustain. 2024, 4, 15. [Google Scholar] [CrossRef]
  22. Getter, K.L.; Rowe, D.B. The Role of Extensive Green Roofs in Sustainable Development. HortScience 2006, 41, 1276–1285. [Google Scholar] [CrossRef]
  23. Langemeyer, J.; Wedgwood, D.; McPhearson, T.; Baró, F.; Madsen, A.L.; Barton, D.N. Creating urban green infrastructure where it is needed—A spatial ecosystem service-based decision analysis of green roofs in Barcelona. Sci. Total Environ. 2020, 707. [Google Scholar] [CrossRef]
  24. Nowak, D.J.; Hirabayashi, S.; Bodine, A.; Greenfield, E. Tree and forest effects on air quality and human health in the United States. Environ. Pollut. 2014, 193, 119–129. [Google Scholar] [CrossRef]
  25. Richards, D.R.; Edwards, P.J. Quantifying street tree regulating ecosystem services using Google Street View. Ecol. Indic. 2017, 77, 31–40. [Google Scholar] [CrossRef]
  26. Tan, X.; Hirabayashi, S.; Shibata, S. Estimation of Ecosystem Services Provided by Street Trees in Kyoto, Japan. Forests 2021, 12, 311. [Google Scholar] [CrossRef]
  27. Berglihn, E.C.; Gómez-Baggethun, E. Ecosystem services from urban forests: The case of Oslomarka, Norway. Ecosyst. Serv. 2021, 51, 101358. [Google Scholar] [CrossRef]
  28. Mitchell, M.G.E.; Devisscher, T. Strong relationships between urbanization, landscape structure, and ecosystem service multifunctionality in urban forest fragments. Landsc. Urban Plan. 2022, 228, 104548. [Google Scholar] [CrossRef]
  29. Sui, Q.; Jia, H.; Zhao, M.; Zhou, Y.; Fan, L. Quantitative Evaluation of Ecosystem Services of Urban Street Trees: A Case Study of Shengjing Historical and Cultural Blockin Shenyang, China. Sustainability 2023, 15, 2532. [Google Scholar] [CrossRef]
  30. Zhang, M.; He, J.; Liu, D.; Huang, J.; Yue, Q.; Li, Y. Urban green corridor construction considering daily life circles: A case study of Wuhan city, China. Ecol. Eng. 2022, 184, 106786. [Google Scholar] [CrossRef]
  31. Huang, H.; Qi, J.; Xiao, S.; Wende, W.; Xin, Y. A Reflection on the Implementation of a Water front Greenway from a Social—Ecological Perspective: A Case Study of Huangyan-Taizhou in China. Land 2024, 13, 989. [Google Scholar] [CrossRef]
  32. Goddard, M.A.; Dougill, A.J.; Benton, T.G. Scaling up from gardens: Biodiversity conservation in urban environments. Trends Ecol. Evol. 2010, 25, 90–98. [Google Scholar] [CrossRef]
  33. Davies, Z.G.; Edmondson, J.L.; Heinemeyer, A.; Leake, J.R.; Gaston, K.J. Mapping an urban ecosystem service: Quantifying above-ground carbon storage at a city-wide scale. J. Appl. Ecol. 2011, 48, 1125–1134. [Google Scholar] [CrossRef]
  34. Gascon, M.; Triguero-Mas, M.; Martinez, D.; Dadvand, P.; Forns, J.; Plasència, A.; Nieuwenhuijsen, M. Mental Health Benefits of Long-Term Exposure to Residential Green and Blue Spaces: A Systematic Review. Int. J. Environ. Res. Public Health 2015, 12, 4354–4379. [Google Scholar] [CrossRef] [PubMed]
  35. Kabisch, N.; Strohbach, M.; Haase, D.; Kronenberg, J. Urban green space availability in European cities. Ecological Indicators. 2016, 70, 586–596. [Google Scholar] [CrossRef]
  36. Benedict, M.; MacMahon, E. Green Infrastructure: Smart Conservation for the 21st Century. Renew. Resour. J. 2002, 20, 12–17. [Google Scholar]
  37. McPhearson, T.; Hamstead, Z.A.; Kremer, P. Urban Ecosystem Services for Resilience Planning and Management in New York City. AMBIO 2014, 43, 502–515. [Google Scholar] [CrossRef]
  38. Lyytimäki, J.; Petersen, L.K.; Normander, B.; Bezák, P. Nature as a nuisance? Ecosystem services and disservices to urban lifestyle. Environ. Sci. 2008, 5, 161–172. [Google Scholar] [CrossRef]
  39. Mckinney, M. Effects of urbanization on species richness: A review of plants and animals. Urban Ecosyst. 2008, 11, 161–176. [Google Scholar] [CrossRef]
  40. Kueffer, C. Plant invasions in the Anthropocene. Science 2017, 358, 724–725. [Google Scholar] [CrossRef]
  41. Stohlgren, T.; Barnett, D.; Kartesz, J. The Rich Get Richer: Patterns of Plant Invasions in the United States. Front. Ecol. Environ. 2003, 1, 11–14. [Google Scholar] [CrossRef]
  42. Simberloff, D.; Martin, J.-L.; Genovesi, P.; Maris, V.; Wardle, D.A.; Aronson, J.; Courchamp, F.; Galil, B.; García-Berthou, E.; Pascal, M.; et al. Impacts of biological invasions: What’s what and the way forward. Trends Ecol. Evol. 2013, 28, 58–66. [Google Scholar] [CrossRef]
  43. Andrade, M.; Fernandes, C.; Coutinho, A.; Figueiredo, A. Urban Green Infrastructure: Does Species’ Origin Impair Ecosystem Services Provision? Land 2024, 13, 23. [Google Scholar] [CrossRef]
  44. Pyšek, P.; Jarošík, V.; Hulme, P.E.; Pergl, J.; Hejda, M.; Schaffner, U.; Vilà, M. A global assessment of invasive plant impacts on resident species, communities and ecosystems: The interaction of impact measures, invading species’ traits and environment. Glob. Chang.Biol. 2012, 18, 1725–1737. [Google Scholar] [CrossRef]
  45. Nguyen, N.-A.; Eskelson, B.N.I.; Gergel, S.E.; Murray, T. The occurrence of invasive plant species differed significantly across three urban greenspace types of Metro Vancouver, Canada. Urban For. Urban Green. 2021, 59, 126999. [Google Scholar] [CrossRef]
  46. Štajerová, K.; Šmilauer, P.; Brůna, J.; Pyšek, P. Distribution of invasive plants in urban environment is strongly spatially structured. Landsc. Ecol. 2017, 32, 681–692. [Google Scholar] [CrossRef]
  47. Szumańska, I.; Lubińska-Mielińska, S.; Kamiński, D.; Rutkowski, L.; Nienartowicz, A.; Piernik, A. Invasive Plant Species Distribution Is Structured by Soil and Habitat Type in the City Landscape. Plants 2021, 10, 773. [Google Scholar] [CrossRef]
  48. Parendes, L.A.; Jones, J.A. Role of Light Availability and Dispersal in Exotic Plant Invasion along Roads and Streams in the H.J. Andrews Experimental Forest, Oregon. Conserv. Biol. 2000, 14, 64–75. [Google Scholar] [CrossRef]
  49. D’Antonio, C.M.; Vitousek, P.M. Biological Invasions by Exotic Grasses, the Grass/Fire Cycle, and Global Change. Annu. Rev. Ecol. Evol. Syst. 1992, 23, 63–87. [Google Scholar] [CrossRef]
  50. Hobbs, R.J.; Higgs, E.; Harris, J.A. Novel ecosystems: Implications for conservation and restoration. Trends Ecol. Evol. 2009, 24, 599–605. [Google Scholar] [CrossRef]
  51. Hulme, P.E. Climate change and biological invasions: Evidence, expectations, and response options. Biol. Rev. 2017, 92, 1297–1313. [Google Scholar] [CrossRef]
  52. Teixeira, C.P.; Fernandes, C.O. Novel ecosystems: A review of the concept in non-urban contexts. Landsc. Ecol. 2020, 35, 23–39. [Google Scholar] [CrossRef]
  53. Copernicus Land Monitoring Service. Imperviousness Density 2018. Available online: https://land.copernicus.eu/en/products/high-resolution-layer-imperviousness/imperviousness-density-2018#general_info (accessed on 4 June 2024).
  54. Direção Geral doTerritório. Registo Nacional de Dados Geográficos. Available online: https://snig.dgterritorio.gov.pt/rndg/srv/por/catalog.search#/search?resultType=details&sortBy=referenceDateOrd&anysnig=Carta%20de%20Uso%20e%20Ocupação%20do%20Solo%20-%202018&geometry=region:http://id.igeo.pt/so/AU/AdministrativeUnit/Freguesias_060334/2017&fast=index&from=1&to=20 (accessed on 4 June 2024).
  55. Instituto Nacional de Estatística (INE). Recenseamento da população e habitação–Censos 2021. Available online: https://mapas.ine.pt/download/index2021.phtml (accessed on 4 June 2024).
  56. Cordeiro, A.M.R. Morphological System and Urban Settlements. Coimbra (Portugal): A City from the Roman Times to thePresent. Cuad. Vivienda Urban. 2021, 14, 1–19. [Google Scholar]
  57. Calmeiro, M.R. Evolution and Permanence in Coimbra’s Urban Form. The Emergence of Urban Planning in Portugal at theTurn of the Twentieth-Century. In International Planning History Society Proceedings, 19th IPHS Conference, City-Space-Transformation, TU Delft, Delft, The Netherlands, 5–6 July 2022; Hein, G., Ed.; TU Delft Open: Delft, The Netherlands, 2022. [Google Scholar]
  58. Coimbra Municipal Master Plan. Planta de Ordenamento—Classificação e Qualificação do Solo. Available online: https://www.cm-coimbra.pt/wp-content/uploads/2018/10/Altera%C3%A7%C3%A3o%20por%20Adapta%C3%A7%C3%A3o%20do%20PDM%20-%20Planta%20de%20Ordenamento%20%E2%80%93%20Classifica%C3%A7%C3%A3o%20e%20Qualifica%C3%A7%C3%A3o%20do%20Solo.pdf (accessed on 14 April 2025).
  59. Farinha-Marques, P.; Fernandes, C.; Lameiras, J.; Silva, S.; Leal, I.; Guilherme, F. Morfologia e Biodiversidade nos EspaçosVerdes da Cidade do Porto—Livro 1: Selecção das areas de Estudo, 2a Edição, Revista e Aumentada; Faculdade de Ciências da Universidade do Porto (FCIP): Porto, Portugal, 2014. [Google Scholar]
  60. Barchetta, L.; Chiodelli, F. The Variety of Urban Green Spaces and Their Diverse Accessibility; Gran Sasso Science Institute: L’Aquila, Italy, 2015. [Google Scholar]
  61. ICNF. Lista Nacional de Espécies Invasoras, Conforme Previsto no n.º 1 do Artigo 17.º. Instituto de Conservação da Natureza e das Florestas. Available online: https://www.icnf.pt/api/file/doc/cf455e5a84ab1d96 (accessed on 13 March 2022).
  62. Jim, C.Y.; Chen, W.Y. Assessing the ecosystem service of air pollutant removal by urban trees in Guangzhou (China). J. Environ. Manag. 2008, 88, 665–676. [Google Scholar] [CrossRef] [PubMed]
  63. Maes, J.; Zulian, G.; Guenther, S.; Thijssen, M.; Raynal, J. Enhancing Resilience of Urban Ecosystems Through Green Infrastructure (En Route); Publications Office of the European Union: Luxembourg, 2019. [Google Scholar]
  64. Pearse, W.D.; Cavender-Bares, J.; Hobbie, S.E.; Avolio, M.L.; Bettez, N.; Roy Chowdhury, R.; Darling, L.E.; Groffman, P.M.; Grove, J.M.; Hall, S.J.; et al. Homogenization of plant diversity, composition, and structure in North American urban yards. Ecosphere 2018, 9, e02105. [Google Scholar] [CrossRef]
  65. Gulezian, P.Z.; Nyberg, D.W. Distribution of invasive plants in a spatially structured urban landscape. Landsc. Urban Plan. 2010, 95, 161–168. [Google Scholar] [CrossRef]
  66. Ali, S.M.; Malik, R.N. Vegetation communities of urban open spaces: Green belts and parks in Islamabad city. Pak. J. Bot. 2010, 42, 1031–1039. [Google Scholar]
  67. Branquinho, C.; Cvejić, R.; Eler, K.; Gonzales, P.; Haase, D.; Hansen, R.; Kabischh, N.; Rall, E.L.; Niemela, J.; Pauliet, S.; et al. A Typology of Urban Green Spaces, Ecosystem Services Provisioning Services and Demands. Report D3.1 for the GREEN SURGE Project (2013–2017). 2015. Available online: https://assets.centralparknyc.org/pdfs/institute/p2p-upelp/1.004_Greensurge_A+Typology+of+Urban+Green+Spaces.pdf (accessed on 15 June 2022).
  68. Deparis, M.; Legay, N.; Isselin-Nondedeu, F.; Bonthoux, S. Considering urban uses at a fine spatial resolution to understandthe distribution of invasive plant species in cities. Landsc. Ecol. 2022, 37, 1145–1159. [Google Scholar] [CrossRef]
  69. Heywood, V.H. The nature and composition of urban plant diversity in the Mediterranean. Flora Mediter. 2017, 27, 195–220. [Google Scholar]
  70. Hui, C.; Richardson, D.; Visser, V. Ranking of invasive spread through urban green areas in the world’s 100 most populous cities. Biol. Invasions 2017, 19, 3527–3539. [Google Scholar] [CrossRef]
Figure 1. Methodological diagram. The division of the study area into two zones—historical center and continuous urban mesh—will inform the spatial distribution of data in landscape metrics and statistical analysis. The data collection process involved a preliminary fieldwork to prepare the classifications and assist in the photointerpretation process. Data collection and field validation occurred simultaneously.
Urbansci 09 00260 g001
Figure 2. Criteria considered to identify the study area: (a) urban soil impervious rate; (b) urban built mesh, and (c) urban population density.
Urbansci 09 00260 g002
Figure 3. Location of the study area and subdivision into two zones—historical center (zone 1) and continuous urban mesh (zone 2).
Urbansci 09 00260 g003
Figure 4. UGI of the study area divided by zones.
Urbansci 09 00260 g004
Figure 5. Number of patches (%) and occupied area (%) by UGSs type for the entire study area and divided by zones—historical center (zone 1) and continuous urban mesh (zone 2).
Urbansci 09 00260 g005
Figure 6. UGS by access to users, with percentage for the number of patches and occupied area for the entire study area and divided by zone—historical center (zone 1) and continuous urban mesh (zone 2).
Urbansci 09 00260 g006
Figure 7. UGI classified by maintenance level considering number of patches (%) and occupied area by class (%) for the study area and divided by zones. Note: Tree-lined streets type was not considered.
Urbansci 09 00260 g007
Figure 8. Maintenance frequency by UGSs type. Note: Tree-lined streets type was not considered.
Urbansci 09 00260 g008
Figure 9. Relative importance of invasive plant species by classes of occurrence in the UGI (percentage for the number of patches and for the occupied area).
Urbansci 09 00260 g009
Figure 10. Occurrence of invasive plant species by UGSs type.
Urbansci 09 00260 g010
Figure 11. Occurrence of invasive plant species by frequency of maintenance.
Urbansci 09 00260 g011
Figure 12. Occurrence of invasive plant species by UGS type according to the chi-square test.
Urbansci 09 00260 g012
Figure 13. Occurrence of invasive plant species by patch area according to the chi-square test.
Urbansci 09 00260 g013
Figure 14. Occurrence of invasive plant species by UGS maintenance level according to the chi-square test.
Urbansci 09 00260 g014
Table 1. Summary table of UGSs attributes considered.
NumberNameDescription
Classification of urban green spaces by type
(adapted from [59])
1AgricultureAgricultural use, for example, crops, orchards, or vineyards.
2Parks and gardensDesigned space with paths and facilities (benches and toilets), dominated by vegetation (tree patches and shrubs, flowerbeds, lawns), and dedicated to direct public use.
3ScarpsAreas with a slope equal to or greater than 45°. Generally with rocky outcrops and herbaceous and scattered woody vegetation with no signs of recent cultivation. Usually heterogeneous in texture and color.
4Tree-lined streetsUGSs associated with circulation (avenues and streets) that have a tree layer in a tree pit or continuous green strip, in alignment.
5UGS associated with buildingsOutdoor spaces associated with multi-family housing, such as social neighborhoods and urbanizations.
6UGS associated with circulationGreen verges alongside railways, roads, or motorways. Examples of these areas are lateral green areas, nodes, and central strips. Garden areas of single-family or collective housing and tree-lined streets are excluded from this type.
7UGS associated with facilitiesOutdoor spaces with vegetation located around public buildings or with public services such as schools, hospitals, churches, universities, barracks, police stations, sports complexes, and public administrations (parish councils, municipal councils, etc.).
8Single-family house UGSOutdoor spaces associated with single-family housing, generally with private maintenance.
9Urban forestOutdoor spaces without spatial organization of plant structure and design, with significant forest-type tree cover with no signs of cultivation and paved paths.
10Vacant lotsUnbuilt spaces, possibly surplus or abandoned, lack programmed function or explicit human use. They may result from the incomplete urbanization or abandonment of outdoor spaces associated with houses or farms.
Classification of urban green spaces by access to users
(adapted from [60])
1PublicUGSs with free access.
UGSs types include parks and gardens, tree-lined streets and UGSs associated with circulation.
2ConditionalUGSs with restricted access.
UGSs types include botanical gardens, urban forests, UGSs associated with facilities, and vacant lots.
3PrivatePrivate UGSs.
UGSs types include UGSs associated with single-family houses, buildings, and agricultural areas.
Classification of urban green spaces by maintenance level
0No maintenanceEvidence of neglect signs (e.g., obstructed drainage networks and disrepair pavements), with prevalence of spontaneous vegetation and unmanaged ornamental woody species grown.
1Low maintenanceDisplay inadequate signs of maintenance, both in its structures (e.g., broken benches, non-functional lighting, pavements deterioration, and damaged drainage networks) and vegetation. Ornamental plants show signs of inadequate care (e.g., broken branches, dead plants, dry branches, and unnecessary supports) and spontaneous vegetation on built structures, circulation areas, and clearings.
2Regular maintenanceShow adequate signs of maintenance (e.g., structures in good condition or regularly repaired with well- maintained pavements and drainage networks). Ornamental vegetation with minimal signs of degradation and occasional spontaneous vegetation with limited spatial expression.
3High maintenancePresent structures, pavements, and drainage networks in excellent condition. Presence of ornamental vegetation with high maintenance requirements: lawns with frequent watering and mowing, seasonal plants replaced seasonally (4x year), trees and shrubs in good phytosanitary conditions, and cut hedges. Absence of spontaneous vegetation.
Scale of occurrence for invasive plant species
0AbsentNo invasive species were identified in the UGS.
1RareSparse individuals.
2OccasionalPatches that occupy up to 25% of the area.
3FrequentPatches that occupy 25% to 50% of the area.
4AbundantPatches that occupy 50% to 75% of the area.
5DominantLarge patches that occupy more than 75% of the area.
Disclaimer/Publisher’s Note: The statements, opinions and data contained in all publications are solely those of the individual author(s) and contributor(s) and not of MDPI and/or the editor(s). MDPI and/or the editor(s) disclaim responsibility for any injury to people or property resulting from any ideas, methods, instructions or products referred to in the content.

