Systematic Review

A Comprehensive Systematic Review of Machine Learning Applications in Assessing Land Use/Cover Dynamics and Their Impact on Land Surface Temperatures

1
Environmental Dynamics Program, University of Arkansas, Fayetteville, AR 72701, USA
2
Department of Geosciences, University of Arkansas, Fayetteville, AR 72701, USA
*
Author to whom correspondence should be addressed.
Urban Sci. 2025, 9(7), 234; https://doi.org/10.3390/urbansci9070234
Submission received: 16 March 2025 / Revised: 3 June 2025 / Accepted: 16 June 2025 / Published: 20 June 2025

Abstract

In a world experiencing rapid urbanization, the phenomenon of land surface temperature (LST) variation has invited substantial attention due to its profound impact on the environment and human well-being. Changes in land use and land cover (LULC) within urban areas significantly influence the dynamics of LST and are a major driver of urban eco-environmental change. The complex connections between LULC dynamics, LST, and climate change are investigated in this systematic review, with a focus on the combined effects of these variables and the use of Machine Learning (ML) techniques. The data in this study, based on peer-reviewed publications from the past 25 years, were obtained from Science Direct and Web of Science databases. Based on our findings, Landsat is the most widely used dataset for analyzing the impacts of LULC on LST. Additionally, built-up areas, vegetation, and population density had the biggest effects on LST values based on focused studies. This systematic review reveals that Artificial Neural Networks (ANNs), Cellular Automata-Markov (CA-Markov), and Random Forest (RF) are the most used ML techniques in predicting LULC and LST. The study finds that NDBI and NDVI are recognized as the key LULC indices that have strong correlations with LST. We also highlight key LULC classes that have the most impact on LST variation. To validate the results, these studies employ Pearson correlation, the NDVI and NDBI index, and other linear regression methods. This review concludes by highlighting future research directions and the current need for interdisciplinary efforts to address the intricate dynamics of LULC and the Earth’s surface temperature.

1. Introduction

Land Surface Temperature (LST) represents the thermal state of the Earth’s surface, as detected primarily through thermal infrared satellite imagery. This parameter serves as a valuable environmental indicator, providing insights into heat exchanges at the ground level. Notably, LST is highly sensitive to alterations in land use and land cover (LULC), for example, the transformation of vegetated areas into urban infrastructure. The proliferation of impervious surfaces such as concrete and asphalt, which typically accompanies rapid urbanization, leads to pronounced increases in surface temperature. This process underpins the well-documented urban heat island (UHI) phenomenon, where urban regions exhibit significantly higher temperatures than their rural surroundings [1].
In urban settings, elevated LST can significantly influence local climate conditions, energy demands, public health, and overall sustainability [2]. For instance, higher surface temperatures can exacerbate heat-related illnesses, deteriorate air quality, and lead to increased energy consumption for cooling buildings. Understanding the complex interactions between LULC and LST is therefore crucial for effective urban planning and climate adaptation strategies. The recent surge in Remote Sensing (RS) technologies and Machine Learning (ML) methods has improved our ability to analyze these interactions accurately and efficiently. ML approaches combined with high-resolution RS data allow detailed exploration of how urban expansion affects temperature patterns, providing valuable insights that traditional methods often miss [3,4].
Although previous reviews have addressed aspects of LULC–LST relationships and ML in Earth system modeling, none have provided an integrated, methodologically focused analysis of ML applications for LULC-driven LST variation. For example, Pal and Sharma reviewed ML applications in land surface modeling but focused on physical process improvements such as evapotranspiration and soil moisture simulation—within land surface models—rather than urban-scale LULC changes or LST outcomes [5,6]. Meanwhile, Patel, Indraganti, and Jawarneh conducted a comprehensive review of how LULC influences LST and outdoor thermal comfort, identifying key datasets, comfort indices, and mitigation strategies. However, their analysis focused on spatial trends, correlation measures, and urban design implications, rather than classifying or critically evaluating ML algorithms or validation techniques [7].
This systematic review aims to tackle these challenges by assessing recent developments in ML techniques for examining the relationship between LULC changes and LST. It synthesizes findings from peer-reviewed studies over the past 25 years (2000–2025), identifying commonly utilized satellite datasets, important indices like the normalized difference vegetation index (NDVI) and normalized difference built-up index (NDBI), as well as key ML algorithms such as Cellular Automata-Markov (CA-Markov), Artificial Neural Networks (ANNs), and Random Forest (RF). This review also points out geographical and methodological gaps, discusses validation issues, and suggests future research directions to enhance ML applications in urban climate studies.
The paper is organized as follows: Section 1.1 outlines factors influencing LST in urban environments. Section 2 describes the systematic review methodology, including databases, search queries, and screening processes. Section 3 presents key results, while Section 4 discusses these findings and their implications. Section 5 concludes this review by summarizing insights and suggesting priority areas for future research.

1.1. Factors Affecting LST in Urbanized Cities

Urban planners and climate scientists are keenly interested in understanding the implications of rising LST, especially as it relates to changes in LULC [8]. The discernible impact of LST is most prominent in densely urbanized areas, where the prevalence of impermeable surfaces significantly contributes to this phenomenon [9]. Studies indicate that elevated LSTs are caused by a number of variables, including impermeable surfaces, less-than-ideal urban designs, darker building materials and colors, dense urban vegetation, and the use of heat-absorbing building materials [10,11].
Urban landscapes, characterized by impervious surfaces, intensify the absorption of solar radiation, leading to elevated temperatures [12]. Metropolitan cities are seeing an increase in the “canyon effect” phenomenon. It happens when tall buildings artificially create a canyon-like effect by flanking both sides of city streets [13]. It has been linked to detrimental effects on air quality, temperature, light levels, wind patterns, and even mental health outcomes [14]. Densely populated areas may encounter the ‘canyon effect,’ impeding airflow and trapping heat, thereby causing temperature spikes. The selection of dark building colors and non-reflective surfaces further accentuates temperature levels. Common urban infrastructure materials, including bridges, parking areas, and pedestrian spaces, contribute to heightened thermal conductivity, augmenting impervious surfaces [15]. The transformation of natural surfaces into built structures due to urban development and LULC alterations also plays a substantial role in temperature elevation [16]. Furthermore, external factors that affect LST significantly include the natural environment and geographic locations. Low wind speed is one factor that can increase low LST, and coastal hot and dry cities and regions with higher humidity show higher LST than their inland counterparts [17].
UHIs refer to areas, typically found in urban environments, that exhibit elevated temperatures compared to the surrounding rural areas [18,19,20,21,22]. Higher LSTs are experienced in urban areas compared to surrounding rural areas due to the UHI effect [7,8,9]. The temperature variation between these areas can reach up to 5 °C, influenced by a high ratio of impervious surfaces in urban environments [10]. LST is determined by the balance of incoming and outgoing radiation at the land–atmosphere interface, which is impacted by surface–atmosphere interactions like solar irradiance, wind conditions, and air temperature [11]. The properties of the underlying LULC also affect heat absorption and dissipation. For example, vegetated areas and wet soil tend to have lower temperatures than bare ground or built-up urban surfaces with more heat-absorbing materials. Understanding the sophisticated interplay of these factors is essential for proactive planning to mitigate increasing LST. This can help with sustainable urban development and reduce the bad effects of climate change globally.

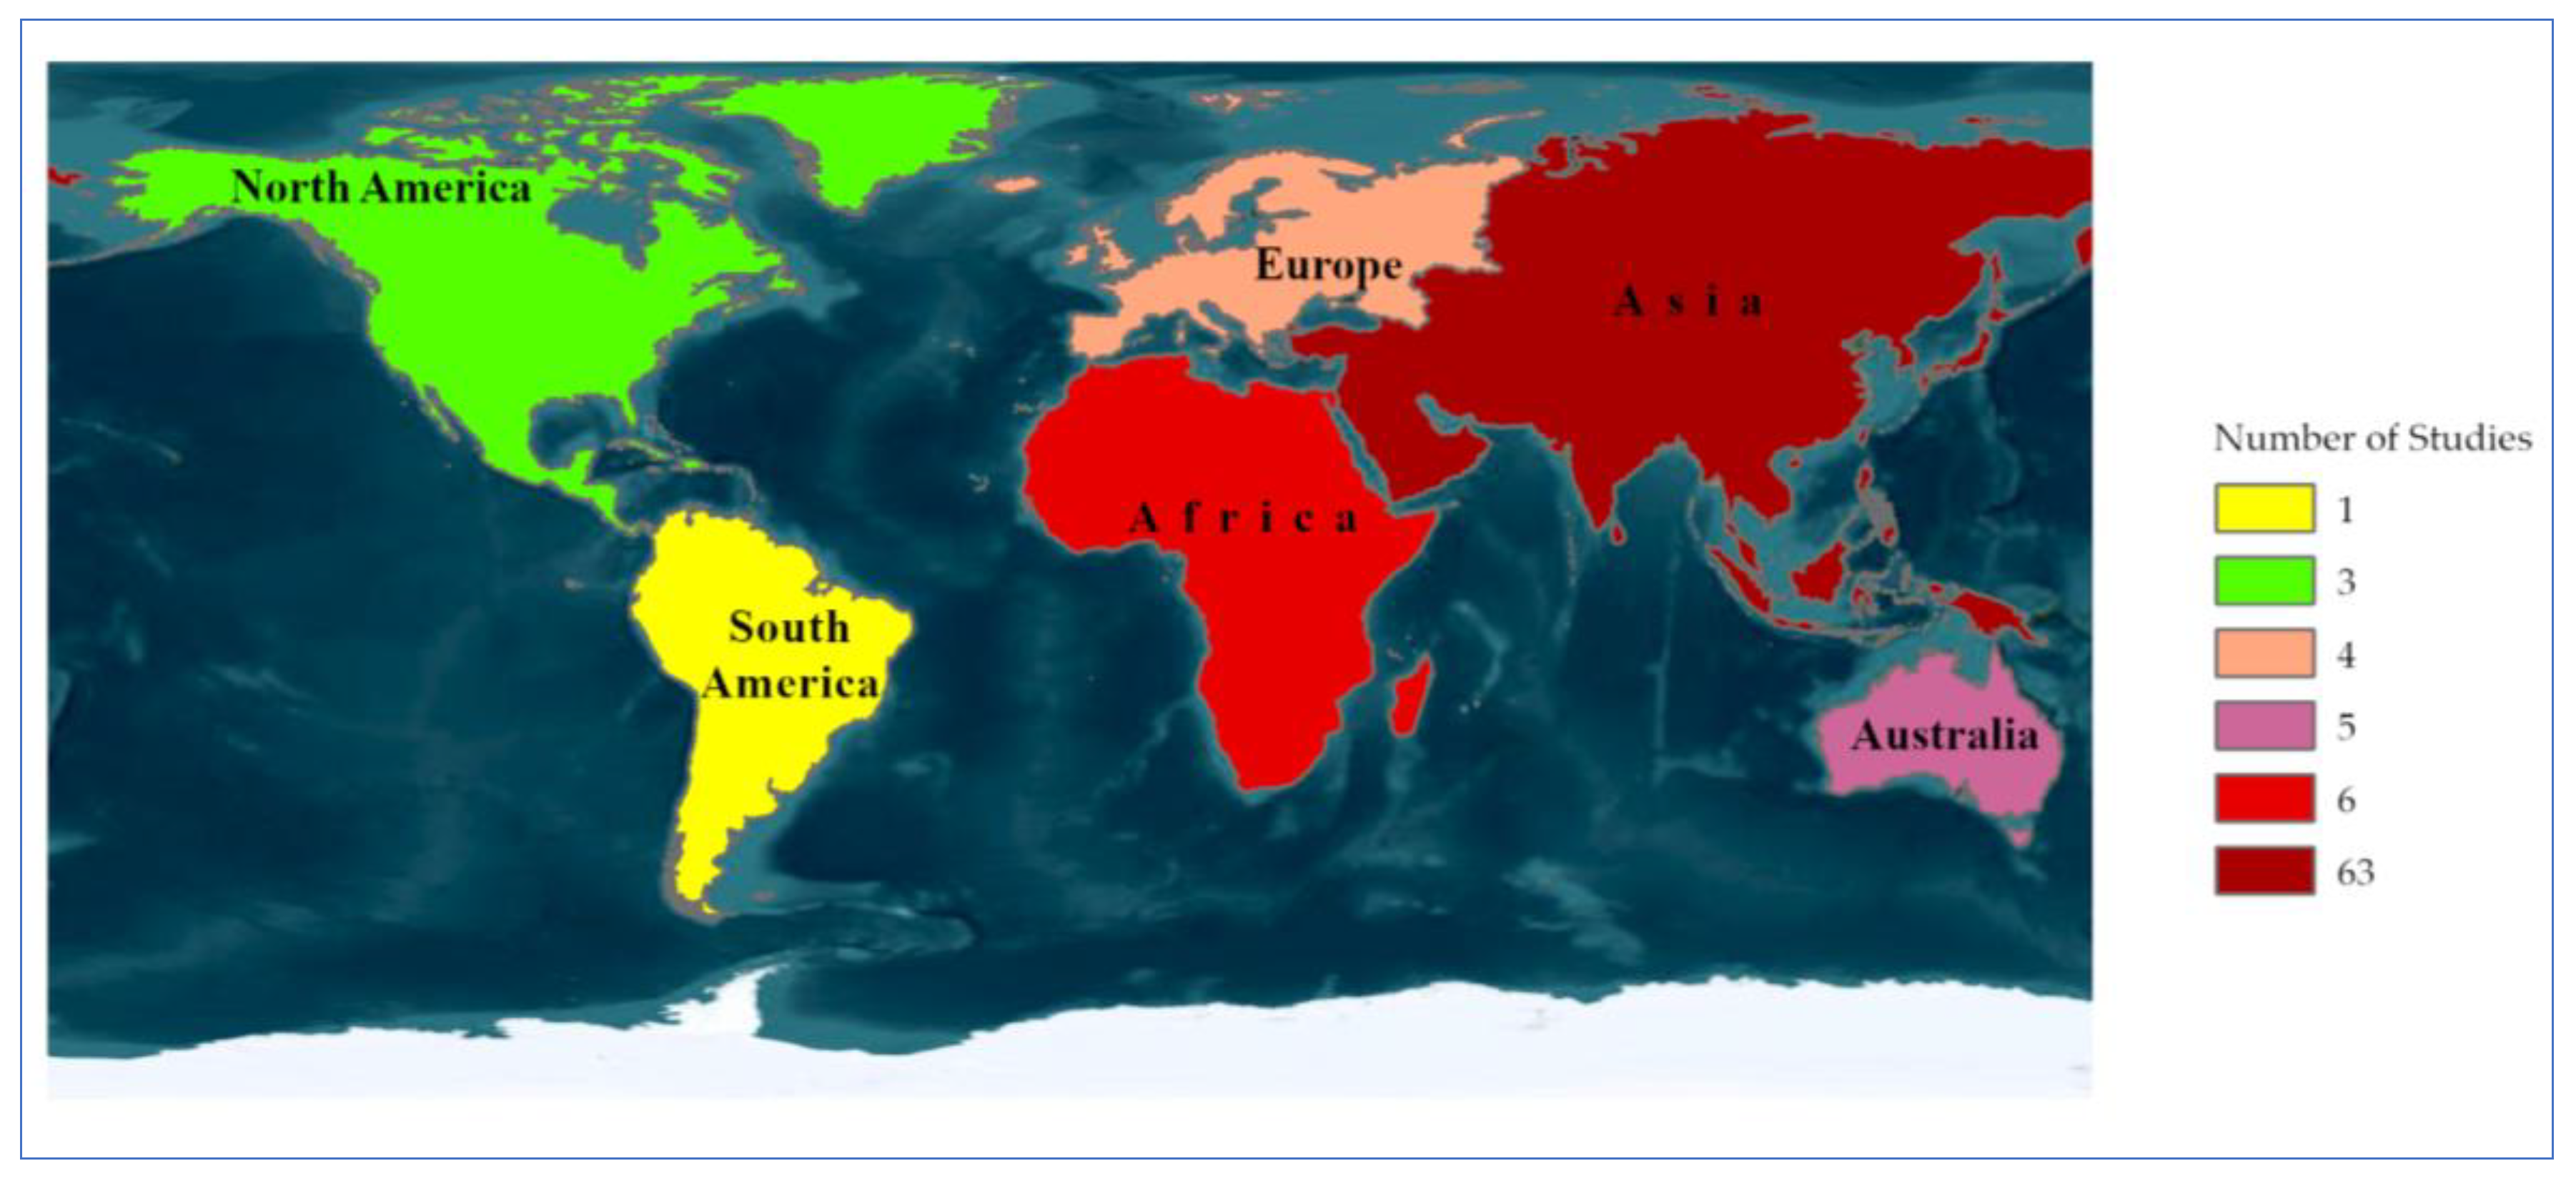
1.2. Exploring Worldwide Perspectives: Comprehensive Approaches and Case Analyses

The incorporation of ML methodologies has played a crucial role in understanding the complex correlation between LULC and LST, hence enabling the development of predictive modeling strategies for the effects of UHIs. For more than 70 years, there has been concern about the rise in urban temperatures and the development of UHIs which highlights the need for thorough research and intervention [23,24,25,26,27,28]. One study explored the relationship between LST, LULC, and socioeconomic variables in Phoenix, Arizona [23]. The research used satellite-derived LST data from ECOSTRESS and high-resolution land cover and census data. The study found that socioeconomically vulnerable communities are more likely to experience higher temperatures due to UHI effects. The research also aimed to identify potential interventions to mitigate these effects. The Multi-Resolution Land Characteristics (MRLC) dataset has been used in numerous research projects conducted in the United States. The Multi-Resolution Land Characteristics (MRLC) dataset, a comprehensive resource gathered from ten federal agencies and evaluated by the Environmental Protection Agency, provides detailed information on land cover patterns and impermeable surface features [29,30,31]. This long-term view of land cover, spanning several years and including cities across the US, is valuable for scholars studying the dynamics of changing land cover over time [32,33,34]. Another study investigated LST changes in the Khulna City Corporation area of Bangladesh between 1999 and 2019 using Landsat 5 and Landsat 8 data. The study predicted LST using CA-Markov algorithm and found that LST increased significantly over this period, with the highest temperature zone expanding, indicating the growth of urban areas [20]. Assaf and Hu developed a knowledge-based white-box Bayesian network model to predict the severity of the UHI effect at the census tract level in New Jersey, USA. The model uses 13 influencing factors as inputs, including LULC, demographic, and meteorological variables [30]. The model allows estimating changes in UHI severity under different urban growth or development scenarios [31]. Another research investigated the correlation between green space morphology and UHI intensity using RF algorithm and MODIS data in Shenzhen, China. It uses LST data to identify UHI intensity patterns and analyzes green space morphology. Results showed UHI intensity is negatively correlated with core, perforation, and loop categories of green space morphology, but positively correlated with green space islets. The study suggested that a few large core green space areas are better for mitigating UHI and that fragmented patches should be integrated for enhanced cooling capacity [35,36]. Furthermore, studies have established a correlation between LULC, LST, and other variables using regression models, the normalized difference vegetation index (NDVI), and the normalized difference built-up index (NDBI) [37,38].
The increasing availability of diverse RS data sources, coupled with advances in computational capacity, has enabled the development of sophisticated ML algorithms for modeling LULC and LST dynamics [39,40,41,42,43,44]. However, current research exhibits several critical gaps [45,46]. Most studies disproportionately focus on major urban centers in Asia, North America, and parts of Europe, while regions such as Africa, South America, and smaller or arid inland cities remain significantly underrepresented [47,48,49,50]. There is also no clear consensus on the most effective ML models for different geographic or climatic contexts, with performance outcomes varying across studies. While ML tools offer substantial predictive power, few studies translate their findings into actionable, spatially explicit urban planning or policy frameworks.
This systematic review of 81 peer-reviewed studies over the past 25 years addresses these gaps by highlighting underexplored regions and variables, evaluating the contextual strengths and limitations of commonly used ML models, and identifying key opportunities for future research and policy translation. It aims to serve as a comprehensive reference for researchers and policymakers involved in LULC planning and urban heat mitigation. This review adopts a structured approach, assessing different satellite imagery data, as well as various indices, modeling techniques, and validation methods used to predict LULC and LST dynamics. Finally, the study discusses existing challenges and outlines future directions to support the development of more accurate, scalable, and policy-relevant modeling approaches in this interdisciplinary field.

2. Methodology

A thorough explanation of the methodology used for the selection, screening, classification, and analysis of relevant research is provided in this section. The procedure comprised a detailed and systematic exploration of the ScienceDirect and Web of Sciences databases with the goal of gathering a comprehensive set of data regarding various approaches applied to evaluate the impact of LULC on LST in urbanized regions around the world, with a particular emphasis on the incorporation of ML approaches in the estimation and prediction of LULC and LST. These databases are widely recognized for their rigorous indexing criteria, multidisciplinary coverage, and high-quality peer-reviewed content. They offer extensive resources across environmental science, RS, ML, and LST research fields, making them ideal platforms for retrieving the relevant literature.
While Scopus is also a comprehensive database covering a broad range of scientific publications, its structure often provides only metadata access for many articles, with full texts being restricted behind publisher paywalls. In contrast, ScienceDirect was selected because it offers direct full-text access to a large volume of peer-reviewed research, facilitating a more detailed review of methodologies, results, and discussions which maintain a high level of methodological transparency and consistency in systematic review [33]. Therefore, the combination of Web of Science’s broad indexing and ScienceDirect’s full-text availability ensured comprehensive coverage, relevance, and accessibility of the selected studies.
The search strategy included a set of targeted keywords, including “land use and land cover”, “land surface temperature”, and a combination related to ML and LULC impact on LST. The complete query was constructed as follows: (“land use” OR “land cover” OR “land use change” OR “land cover change”) AND (“land surface temperature” OR “surface temperature” OR “thermal RS”) AND (“machine learning” OR “artificial intelligence” OR “predictive modeling”).
This review followed a rigorous and systematic process to identify and select relevant studies for evaluation and data extraction. The inclusion criteria focused on peer-reviewed articles written in English, published from the year 2000 onwards, to ensure linguistic consistency and minimize potential inaccuracies introduced by translation. Only articles that aligned with the research objectives, demonstrated methodological rigor, and were sourced from reputable academic databases were considered to reduce selection bias.
The literature search was conducted across two major databases: Web of Science and Science Direct. The search returned 73 articles from Web of Science and 125 articles from Science Direct, resulting in a total of 198 records. After removing 19 duplicate records and 22 records for other reasons, 157 records remained for screening. Title and abstract screening were conducted manually to assess relevance to the research questions. Studies were excluded if they did not focus on the relationship between LULC change and LST, or if they lacked a clear integration of ML methods.
Following this initial screening, 84 full-text articles were retrieved for detailed review. During full-text assessment, three articles were excluded for falling outside the defined objectives and screening criteria. Ultimately, 81 studies were included in the final synthesis. Throughout the selection process, a clear emphasis was placed on ensuring that the studies incorporated robust ML approaches relevant to land use and LST dynamics.
This review includes peer-reviewed studies published between January 2000 and March 2025, spanning a 25-year period. Studies published prior to 2000 were excluded to ensure consistency with contemporary methodological standards and to focus on research that reflects advancements in RS, ML, and LULC–LST modeling during this timeframe. This timeframe was chosen strategically to capture the historical evolution of the field, incorporating significant advancements while avoiding outdated information. Additionally, it facilitates a robust basis for comparative analysis. Inclusion of studies that contain a minimum of the four keywords mentioned in this paper, ensuring relevance to the thematic focus and the integration of ML techniques in assessing the LULC impact on LST for current and future scenarios. This selection process ensures the inclusion of relevant studies that align with the objectives of this research, providing a robust foundation for a comprehensive and insightful analysis.

Screening Criteria

In accordance with the guidelines outlined by the preferred reporting items for systematic reviews and meta-analyses (PRISMA), we conducted a comprehensive review (Figure 1). PRISMA serves as a standardized framework for the identification, organization, and analysis of databases, aiming to enhance quality and transparency, minimize bias, and improve the evaluation process. The literature search for this examination utilized resources from two reputable databases: Clarivate Analytics Web of Science Core Collection and ScienceDirect, accessed through the University of Arkansas library. The final search was completed on 14 March 2025. It is important to note that our review primarily used ScienceDirect and Web of Science, databases that primarily index peer-reviewed journal articles. Therefore, significant improvements in ML methodologies initially presented at conferences might be underrepresented. To address this, future systematic reviews could consider integrating additional databases such as IEEE Xplore or ACM Digital Library, which provide comprehensive analyses of conference proceedings. However, we have ensured inclusion of major methodological advancements initially introduced at conferences and later published in peer-reviewed journals, thus maintaining methodological rigor and comprehensiveness within our study’s context.
A pivotal step in systematic literature searching involves the definition of key concepts and associated search keywords. Both Web of Science and ScienceDirect employ keywords with Boolean operators and wildcards. Boolean syntax, incorporating operators like AND, NOT, and OR, enables users to effectively combine keywords. Wildcards, represented by an asterisk (*), facilitate the inclusion of spelling variations and derivatives without the need for separate inputs.
An advanced search has been conducted based on predefined keywords and concepts to find relevant papers on the study objectives. Keywords were systematically selected to align with the research focus, incorporating terms like ‘LST,’ machine learning,’ and ‘RS.’ Boolean operators and database filters ensured relevance and precision in article selection. The refinement of several search strings through trial-and-error ensured the identification of relevant papers during database searching. The selected keywords were the outcome of a thorough literature search on LULC/LST prediction and ML.
It is crucial to acknowledge that, depending on the research goals, different search strategies using varied keywords and inclusion/exclusion criteria may yield different article numbers. Despite our best efforts to encompass all relevant studies and document data accurately, certain articles may not have been chosen due to the above-mentioned restrictions. The study question directing methodological investigation to understand the relationship between changes in LULC and LST is as follows: What specific methods, techniques, and indices are employed in investigating the relationship between changes in LULC and LST through RS and ML?
Following rigorous stages of research study selection, filtering, and examination, 81 studies were included. The selection of 81 studies reflects a rigorous process adhering to PRISMA guidelines, emphasizing relevance, quality, and recent advancements. While this may appear limited, it ensures focused analysis of impactful studies, minimizing redundancy and prioritizing methodological insights. These papers were further condensed based on parameters such as the year of publication, abstract, methodology, conclusions, and restrictions.
Based on Figure 2 results, the year-wise distribution of the conducted research revealed a significant increase in relevant studies from 2017 onwards, with a sharp rise in publications during the past three years (2021–2023). Notably, 61 (75.3%) of the 81 studies were published during this period, highlighting a growing interest and awareness of the escalating impact of LULC on LST. Figure 3 depicts the geographical distribution of the selected studies across continents, showing that a substantial proportion of the research was conducted in Asia, with a particular focus on countries such as Bangladesh and India.
There is a noticeable geographical imbalance in the distribution of studies across continents. The majority of LULC–LST research has been conducted in Asia and North America, while Africa, South America, and parts of Southeast Asia remain significantly underrepresented. For example, the current literature barely mentions nations like Laos, Cambodia, and the inland areas of Indonesia in Southeast Asia; Bolivia, Paraguay, and Peru in South America; and Nigeria, Ethiopia, Kenya, and Uganda in Africa.
The generalizability of current ML-based models is limited by this lack of geographic diversity, and they might not function well in situations with varying climatic, socioeconomic, or urban development conditions. Future research should give priority to these underrepresented regions in order to increase the LULC–LST study’s global relevance. Focused efforts in these areas—data collection, model calibration, and contextual analysis—may yield more inclusive insights and help develop more informed climate resilience plans that are suited to local requirements.

3. Results

With advancements in methodologies, there has been a significant improvement in understanding the dynamic relationships between LULC and LST. RS and ML techniques have played a critical role in uncovering the connections between land-use changes and the emergence of UHIs, which, in turn, contribute to broader climate change effects. The following section delves into key findings and trends, emphasizing the interplay between datasets, analytical techniques, and scientific progress.

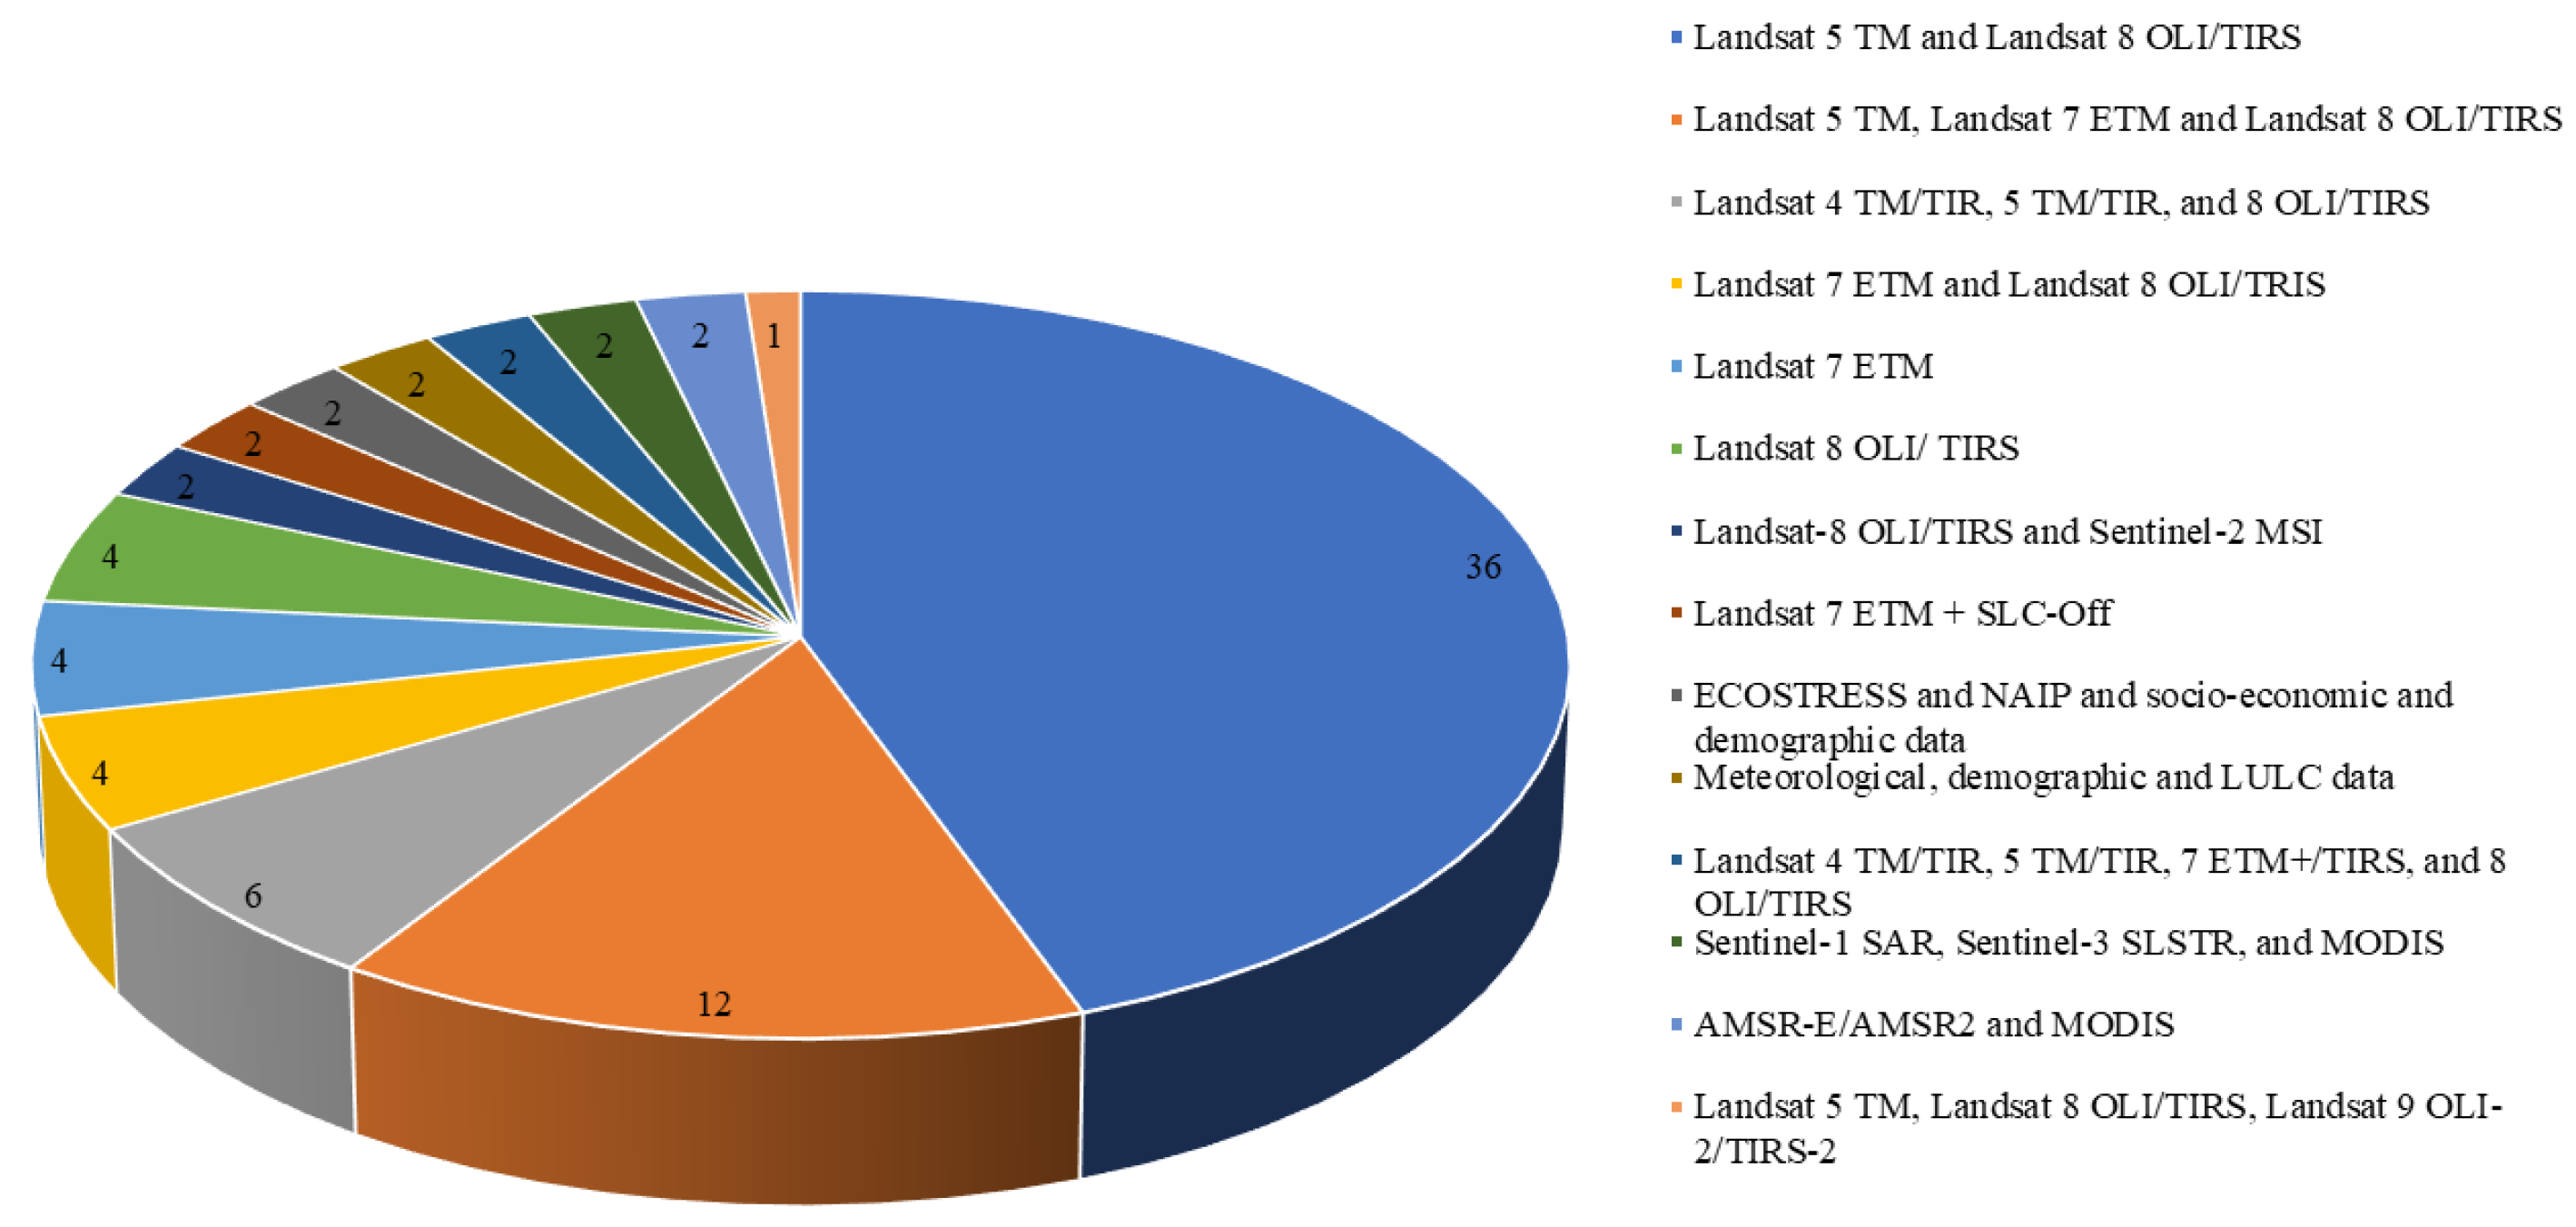
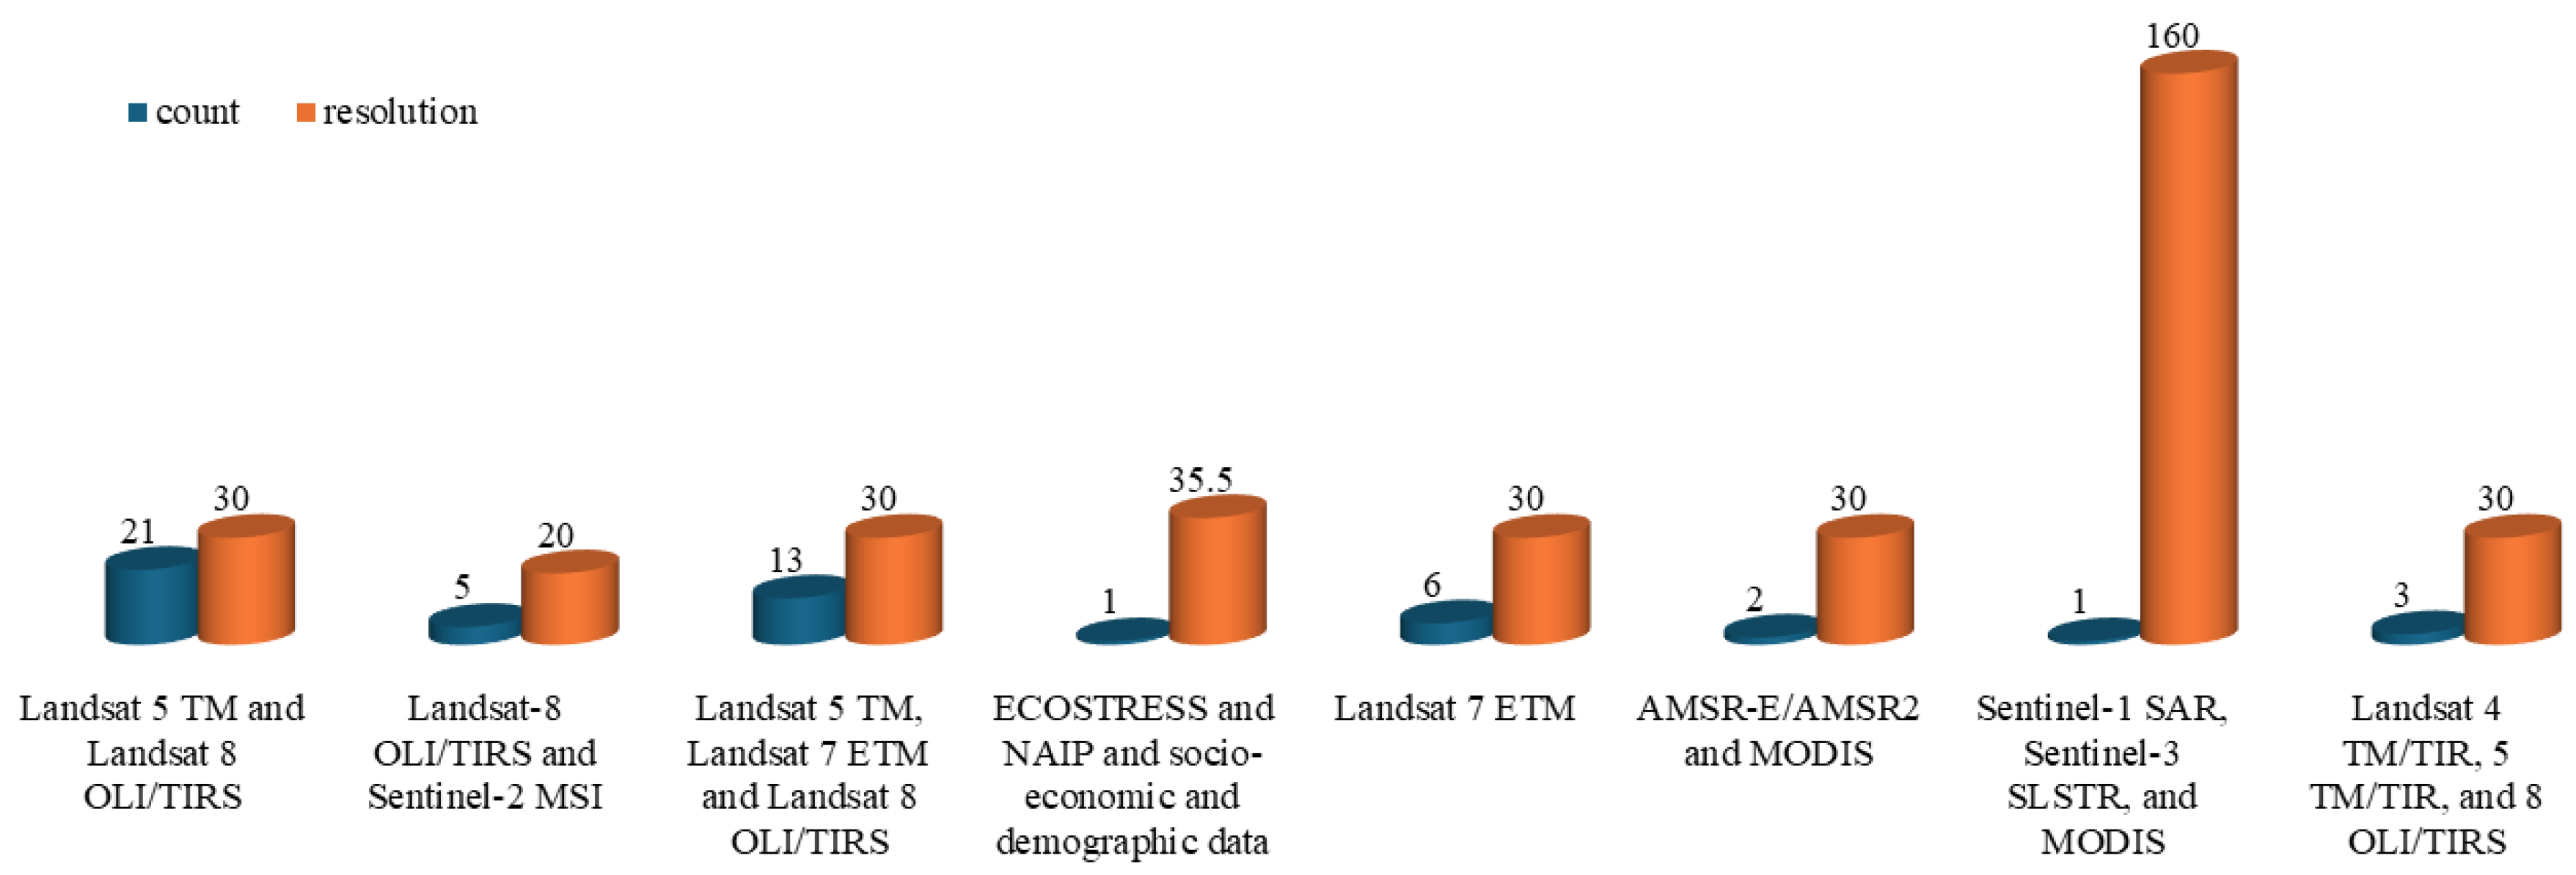
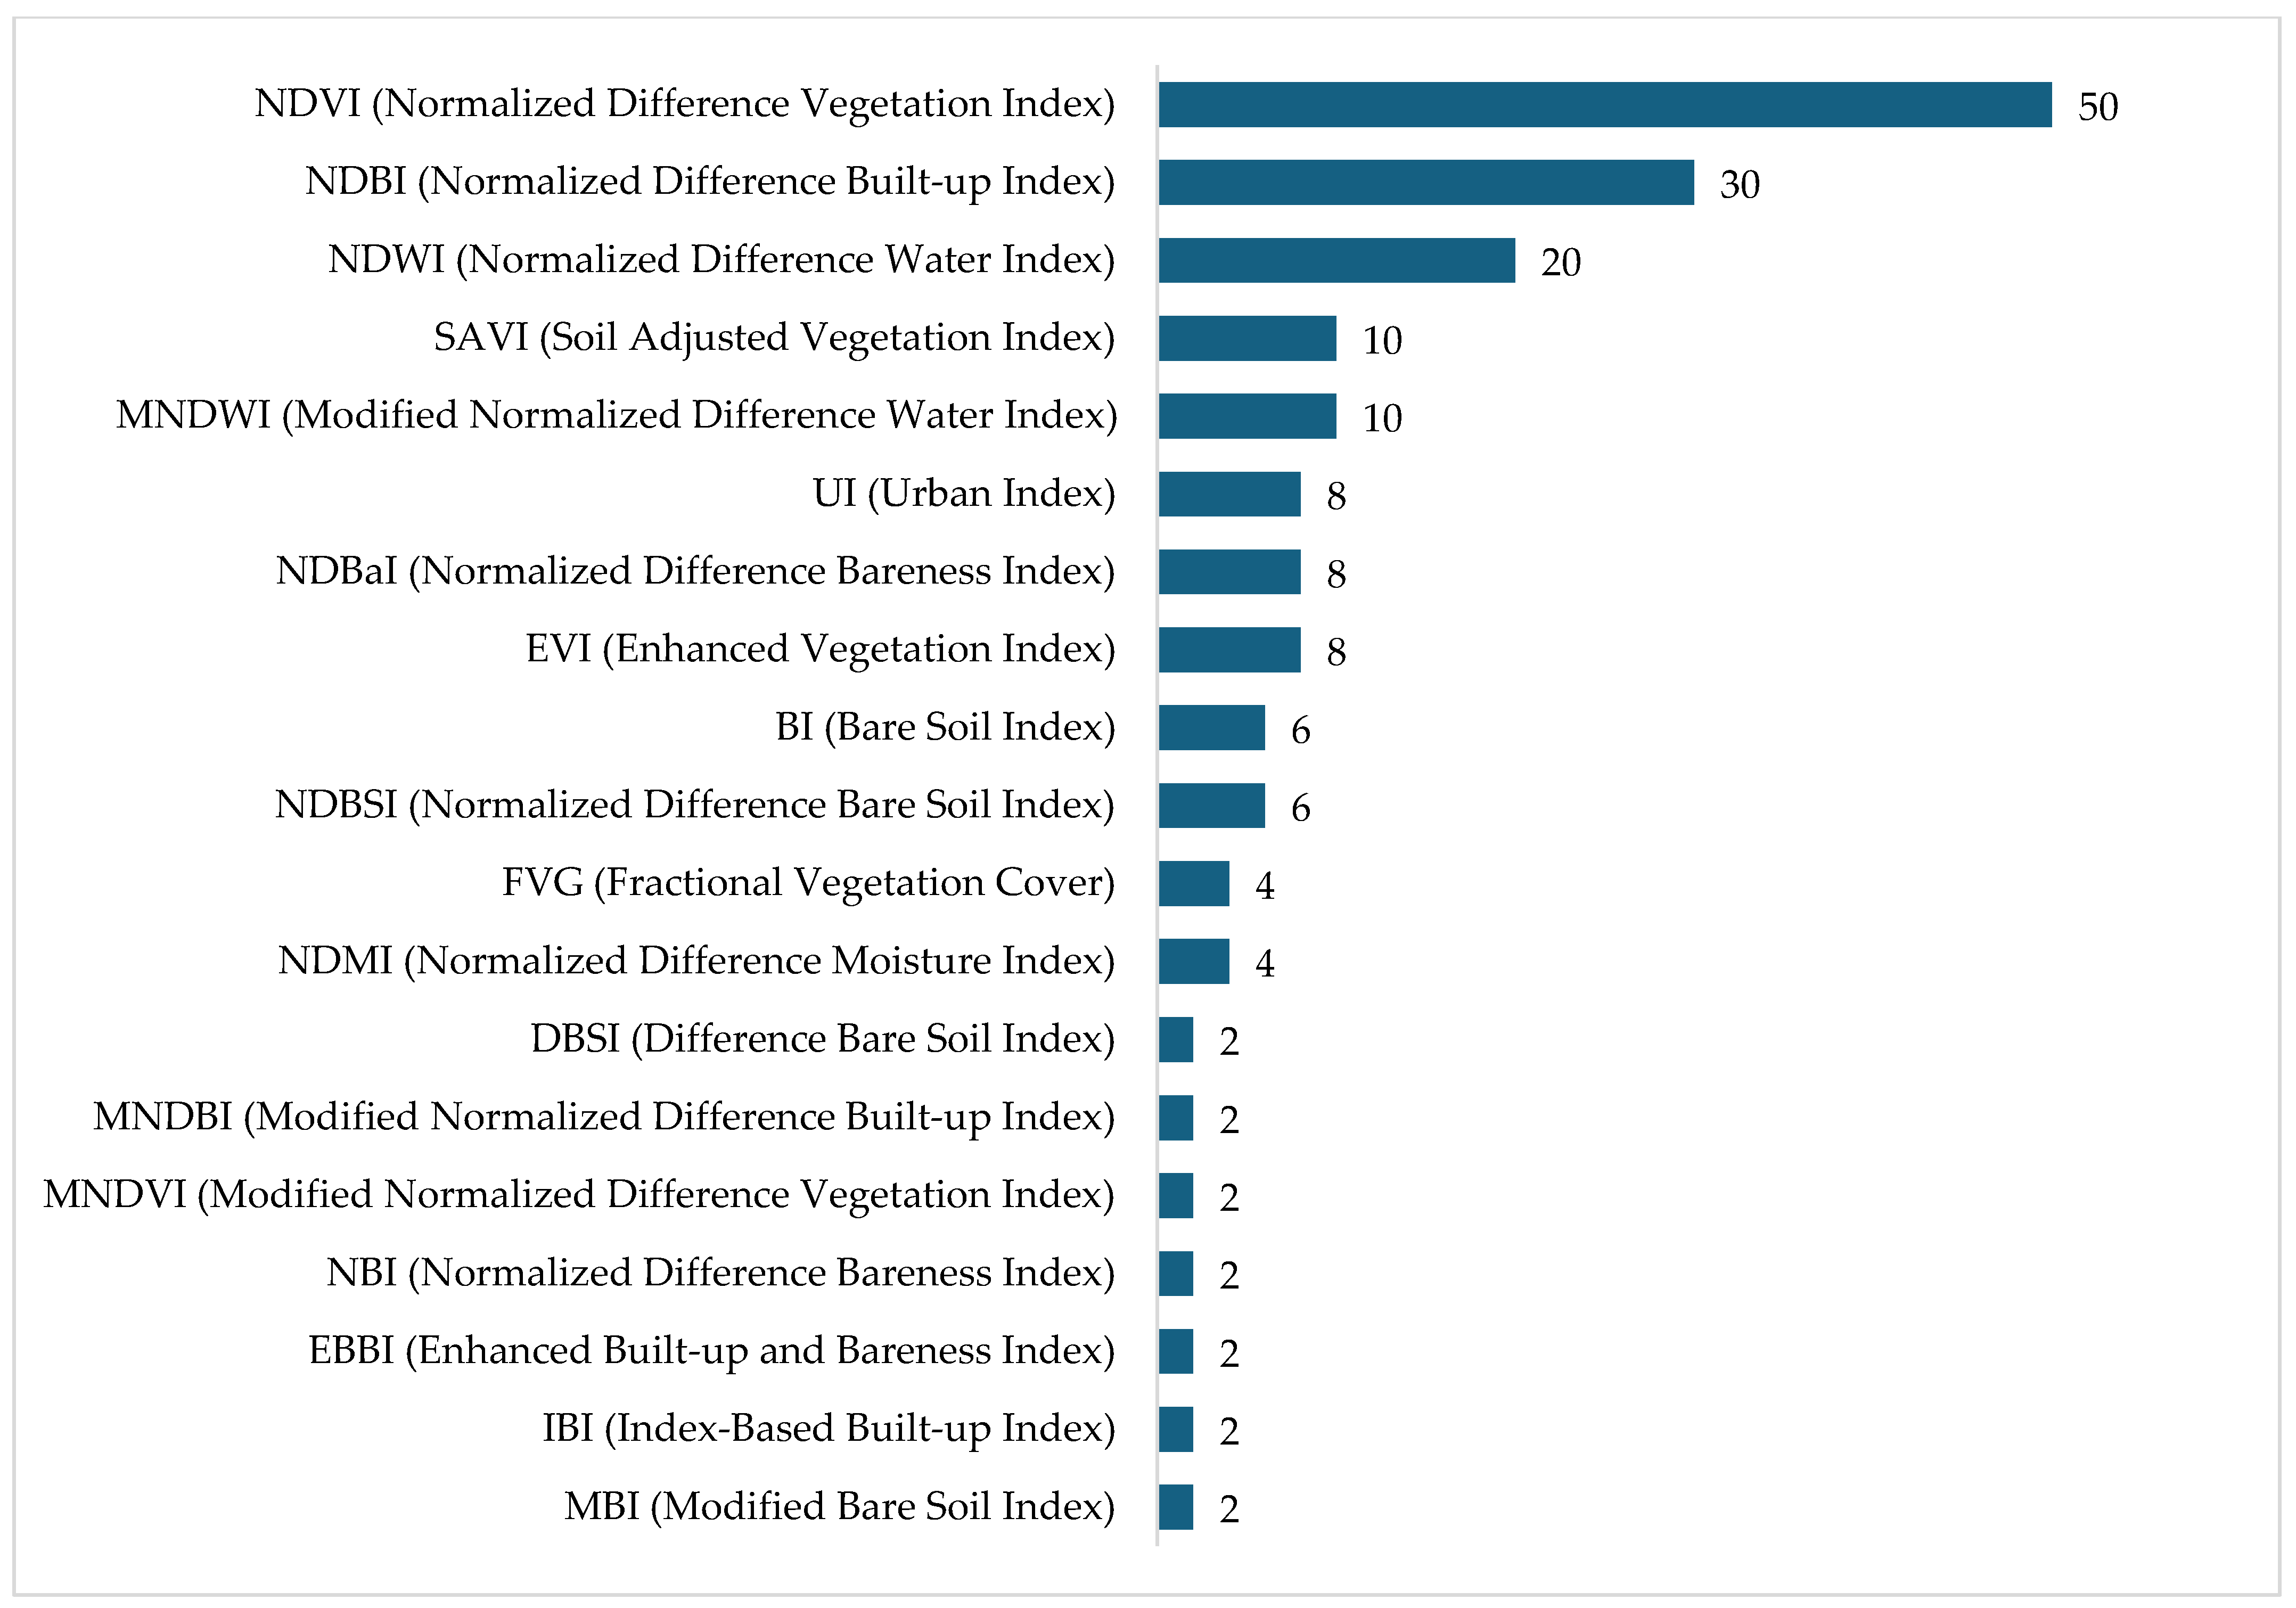
3.1. Approaches to Land Use and Land Cover Data Collection and Processing

Landsat imagery is the most widely used satellite data source in the reviewed studies (Figure 4). Its popularity can be attributed to its long historical record, consistent 30 m spatial resolution, and frequent temporal coverage, making it highly suitable for long-term monitoring of LULC changes. Studies often combine data from multiple Landsat missions (such as Landsat 5 TM, Landsat 7 ETM, and Landsat 8 OLI/TIRS) to enhance temporal consistency and address potential gaps due to cloud cover or sensor limitations.
Recent approaches also integrate newer high-resolution sensors like Sentinel-2 MSI alongside Landsat data to improve the accuracy of classification and change detection tasks. In addition to optical datasets, some studies incorporate multi-source data, such as ECOSTRESS thermal observations, socio-economic layers, and MODIS products, to enrich analyses related to LST estimation. The selection of satellite sources across the studies reflects a preference for datasets that offer global coverage, free public access, moderate to high spatial resolution, and a long archive period, all of which are essential for studying dynamic urban and environmental processes over time.
The findings highlight a significant concentration of spatial resolution values, with 30 m accounting for 89.19% of the dataset (Figure 5). This prominence underscores the 305 common use or preference for images with a spatial resolution of 30 m, primarily 306 attributed to Landsat data.
In the analysis of LULC classes across the reviewed studies, as depicted in Figure 6, distinct patterns emerge, highlighting the dominance of specific categories in LULC classification efforts. The built-up and vegetation area takes precedence, featured in 38 studies, reflecting a significant emphasis on urban development and infrastructure changes and anticipating changes in natural ecosystems. Bare land is considered in 36 studies, indicating a concerted effort to understand the dynamics of open spaces and land devoid of vegetation. Water bodies rank as the third most frequently employed category, appearing in 34 studies, emphasizing the attention given to aquatic environments and associated transformations. This thorough examination of several LULC classes highlights the complex character of land-use studies by capturing the unique characteristics of both natural and man-made changes in various types of landscapes.

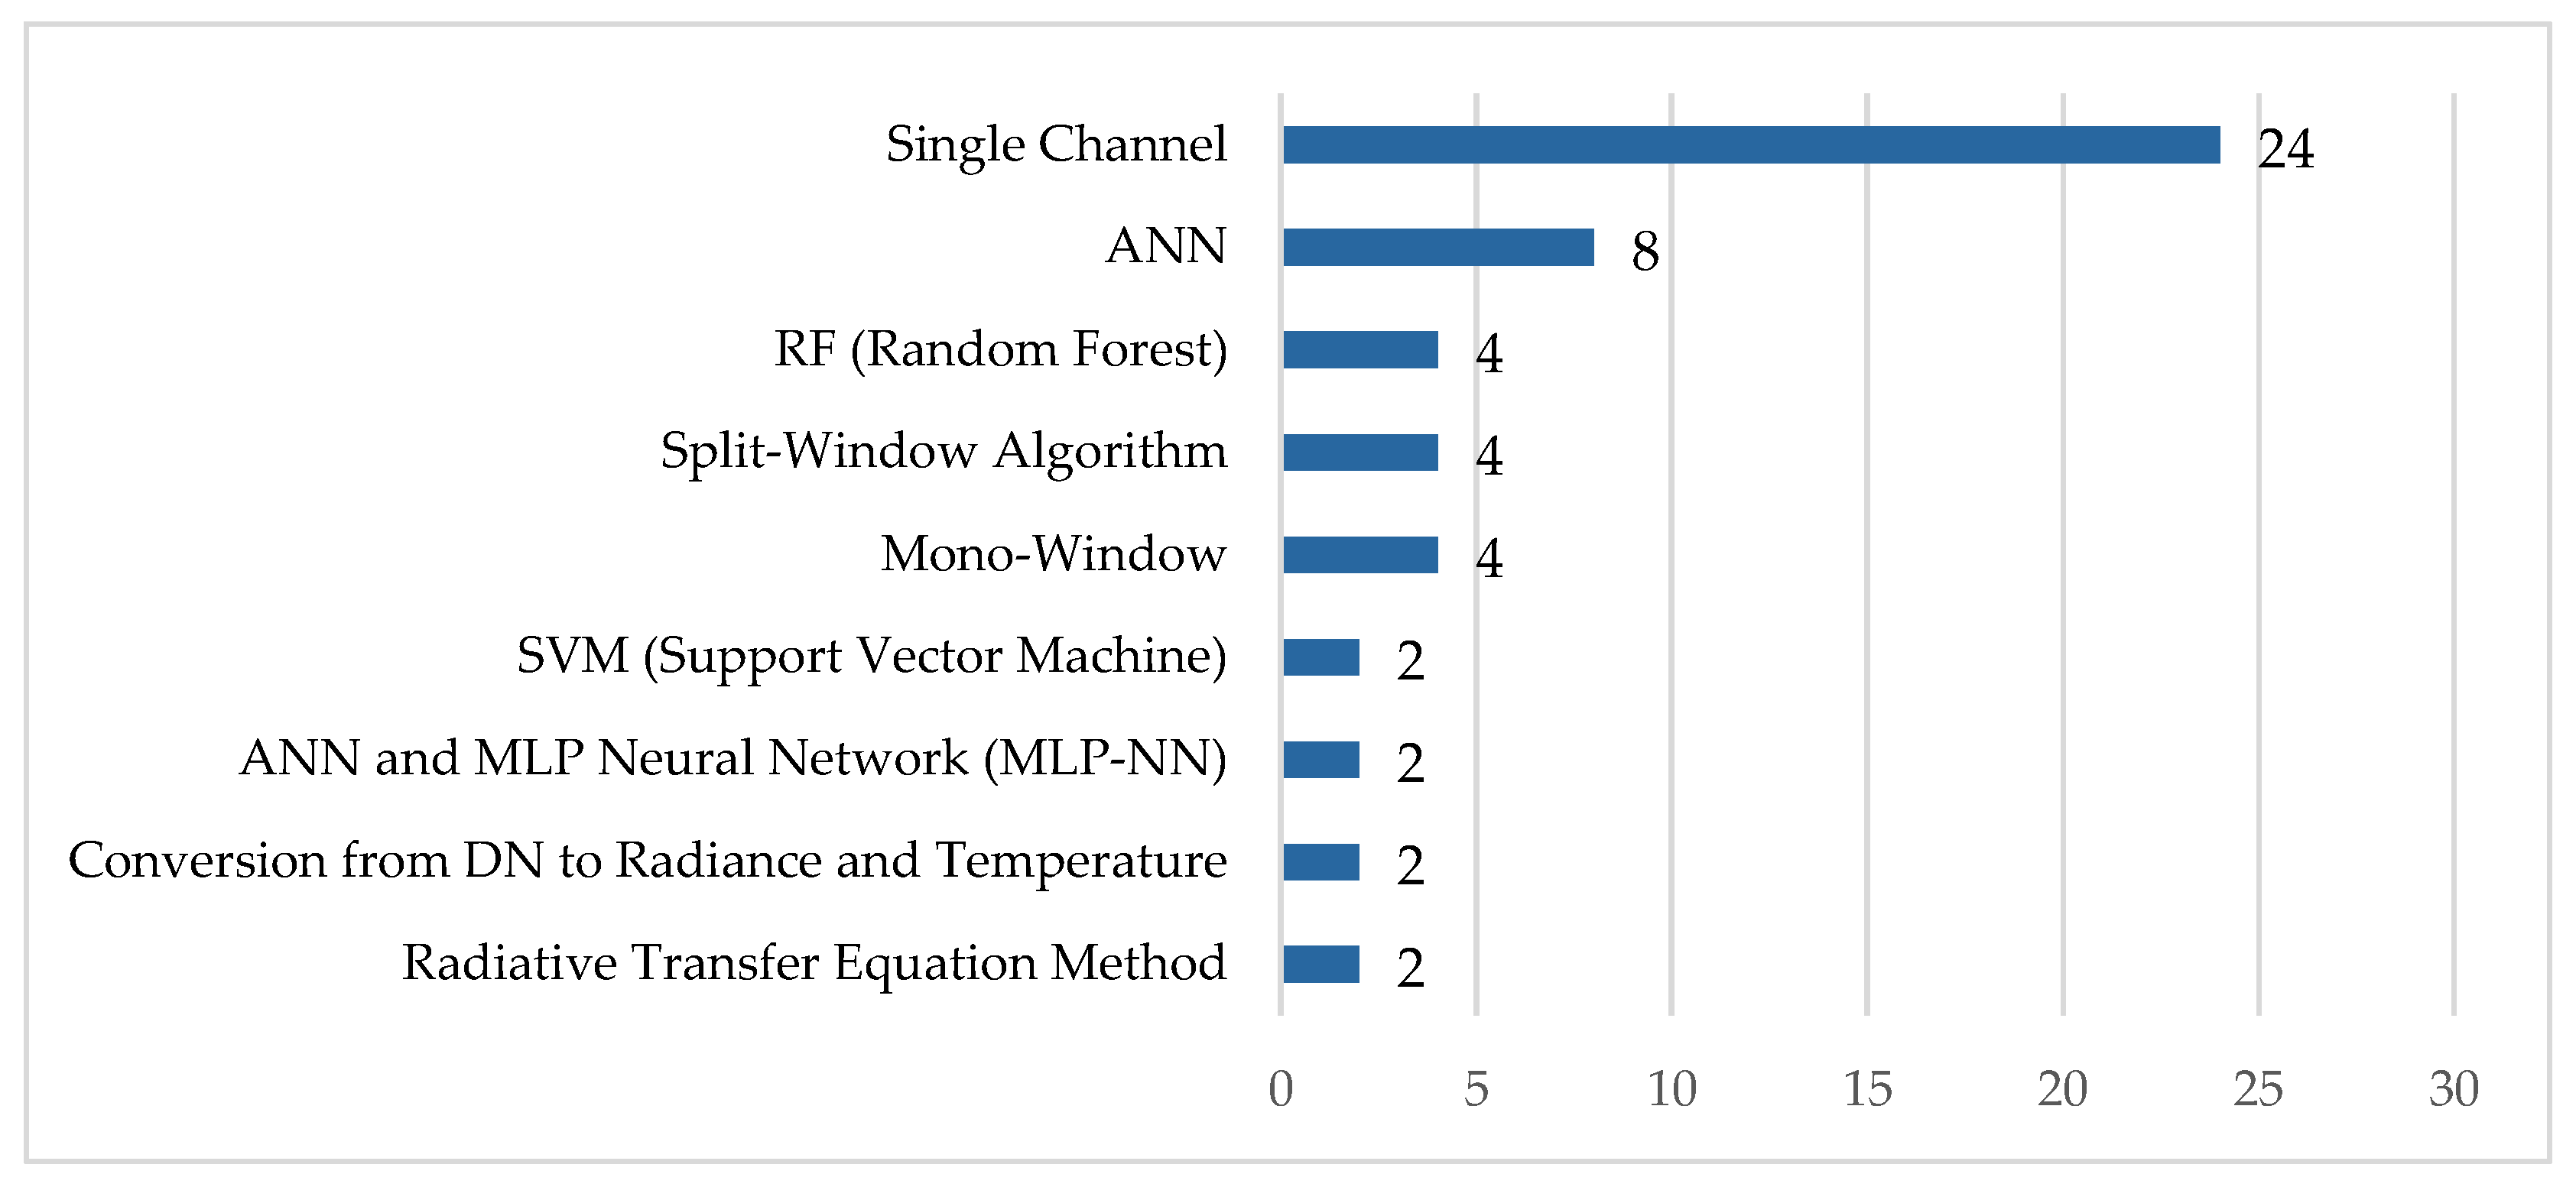
3.2. Techniques Used for Estimating LST

Single-channel methods are widely used to derive LST values (Figure 7), as evidenced by the 24 studies that employed them. These methods are favored for their simplicity and computational efficiency, offering a straightforward approach that minimizes complexity while yielding reliable temperature estimations. Their emphasis on utilizing information from a single channel simplifies the estimation process, making them an attractive choice when computational resources are limited or when a simple, yet effective solution is required.
Mono-Window and Split-Window algorithms are each employed in four studies, demonstrating their value in specific thermal data processing scenarios. Similarly, the RF method is used in four studies, underscoring its robustness for both classification and regression tasks. Less frequently applied methods include the Radiative Transfer Equation and the Conversion from Digital Number (DN) to Radiance and Temperature, each appearing in only two studies. Additionally, SVM is employed in two studies, indicating its niche role in LST estimation.
Overall, this distribution of methods highlights the methodological diversity in LST research, with traditional techniques like Single-Channel and Split-Window approaches coexisting alongside modern ML methods such as ANN and RF. The choice of method often depends on the type of satellite data, the study’s objectives, and the complexity of the landscape under investigation.

3.3. Overview of Machine Learning Approaches for LULC and LST Prediction

The LST estimation results obtained from the systematic review demonstrate a wide range of approaches used in the examined studies (Table 1). The selected papers in this review encompass a wide range of ML algorithms applied to LULC and LST prediction. CA-Markov and RF appear as the most frequently utilized techniques due to their robust capabilities in modeling spatial patterns and handling complex datasets. CA-Markov, by combining CA with Markov chain analysis, effectively captures both spatial dependencies and temporal dynamics in LULC transitions. Similarly, RF is valued for its ensemble learning ability, providing high accuracy and resilience against overfitting across diverse environmental datasets.
ANN, including their hybrid form with ANN-CA, are also prominently applied for both LULC and LST modeling. ANN techniques excel in learning complex nonlinear relationships, making them particularly effective in areas with intricate land transformation dynamics. SVM, sometimes enhanced with tools like the MOLUSCE plugin, are noted for their strong performance in high-dimensional classification tasks, although their sensitivity to parameter selection is acknowledged.
Emerging techniques such as Extreme Gradient Boosting (XGB) and Gene Expression Programming (GEP) are increasingly adopted for LST estimation, reflecting a growing trend towards more sophisticated predictive models. Regression-based methods, including Multiple Linear Regression and Kernel Ridge Regression, continue to play a role, particularly in studies prioritizing interpretability and computational simplicity.
Overall, the wide variety of ML algorithms employed across LULC and LST prediction studies highlights the adaptability and methodological richness of the field. The choice of techniques is influenced largely by study objectives, data characteristics, and the desired balance between model complexity, accuracy, and interpretability (Table 1).
Among the various indices analyzed (Figure 8), NDVI in 50 studies and NDBI in 30 studies were the most employed, underscoring their importance in vegetation and urban land assessment, respectively. The high use of NDVI highlights the continued reliance on vegetation indices to monitor ecosystem health, detect deforestation, and assess urban expansion’s effects on green spaces. In contrast, NDBI’s extensive application reflects the increasing focus on built-up area detection, which is needed for understanding the rate and patterns of urbanization.
Water and moisture indices such as NDWI (twenty occurrences) and NDMI (four occurrences) offer further understandings into hydrological changes associated with urban growth. As impervious surfaces expand, water bodies and soil moisture levels are affected, influencing local climate patterns and increasing surface runoff. The moderate use of SAVI and EVI emphasizes the need for vegetation indices that minimize soil background influence, particularly in semi-arid and rapidly urbanizing regions.
The interaction between urban expansion and surface temperature is directly linked to indices such as NDBI, UI (eight occurrences), and LST-related indices, which help measure the UHI effect. Increased built-up areas contribute to rising LST, altering local climate conditions and exacerbating heat stress in densely populated areas. The combination of vegetation, built-up, and moisture indices allows researchers to analyze how urbanization affects land–atmosphere interactions, providing crucial awareness for sustainable urban planning.

4. Discussions

4.1. Data Sources

RS systems have played a key role in the effective monitoring of spatiotemporal ecosystem change, biodiversity, and changes in climatic conditions at the local, regional, and global scales [46,47]. The reviews highlight that scientists have utilized a range of satellite sensors and datasets to enhance their understanding of Earth’s changes. Among these, the widespread use of Landsat 5 TM and Landsat 8 OLI/TIRS highlights their continued importance in contemporary environmental studies [48,49].
The mix of old and new data such as Landsat 4 TM/TIR, 5 TM/TIR, and 8 OLI/TIRS helps researchers obtain a complete picture of how our environment is changing [50,51]. There is also a trend of using different sensors together, like Landsat 7 ETM with Landsat 8 OLI/TIRS, or just Landsat 8 OLI/TIRS alone in two studies [52]. It suggests that these sensors have unique features that make them useful on their own or combined. Therefore, choosing between resolution and coverage is a key consideration when selecting satellite data. The findings confirm a common observation: high-resolution images provide rich detail, while moderate-resolution sensors offer broader spatial coverage and higher temporal frequency.
Looking beyond Landsat, researchers are getting creative with data. Some studies combine microwave and optical sensors, such as AMSR-E/AMSR2 and MODIS, to obtain a high-resolution result. Also, reviewed results show the combination of meteorological, LULC data together to find the relationship between LULC and LST [53]. However, many studies used meteorological data for validation of estimated LST. This mix-and-match trend extends to fusing Landsat 8 OLI/TIRS with Sentinel-2 MSI in one study. Based on the diversity of the used tools, researchers are interested in using data from different satellites to obtain better observations [54]. Despite certain sensors’ limitations, such as those of Landsat 7 ETM, researchers manage to get the most out of them. Even a study that employs Landsat 7 ETM + SLC-Off demonstrates how researchers creatively overcome obstacles [55]. Overall, the mix of satellite sensors and datasets used in environmental research shows a changing landscape in how we study our planet. Scientists are using a variety of tools and approaches to obtain a deeper understanding of Earth’s complex systems.
In addition, the prominence of 30 m resolution images highlights the common preference for images with a spatial resolution of 30 m, primarily attributed to Landsat data. Higher spatial resolutions are often associated with thermal images from MODIS, where spatial resolution is less critical and has minimal impact on LST estimation outcomes [56]. Landsat’s high-resolution images (30 m) enable detailed land cover examination and provide extensive historical data for morphological research on LULC. However, the 16-day revisit interval of Landsat imagery limits the availability of daily data [57]. In contrast, MODIS offers continuous imagery at coarser resolutions (250–1000 m), facilitating regional and national-scale analyses. Notably, Landsat data, despite being launched earlier than some satellites, spans a longer period, covering additional years compared to its counterparts [35]. The dataset also includes other satellite types, such as Sentinel-2 MSI, Sentinel-3 SLSTR, and AMSR-E/AMSR2, though their representation is relatively limited, with only a few studies utilizing these sources [106]. This distribution reflects the widespread preference for Landsat due to its balance of spatial resolution, temporal coverage, and accessibility, while MODIS and other satellites are employed for specific applications requiring broader spatial or temporal scales [58].
The preference for older sensors, such as Landsat 5 TM and Landsat 7 ETM, persists in environmental research due to their ability to provide long-term datasets essential for detecting historical changes and understanding past trends in LULC and LST [115]. These sensors offer decades of consistent imagery, enabling researchers to compare historical and contemporary landscapes and identify clear patterns of variation over time. Such stability is vital for studies focused on long-term change detection, as it allows for a more robust analysis of environmental trends and the impacts of urbanization and other anthropogenic activities [27]. Additionally, by incorporating meteorological datasets, researchers can examine the correlation between climatic factors such as temperature, precipitation, and humidity, and changes in land cover and surface temperature [116,117,118,119]. This fusion of data sources with advancements in ML enhances the precision and scalability of environmental studies, while open-access datasets like Sentinel-1 democratize research, advancing innovation and reproducibility [120].

4.2. Variable Selection and Accuracy Assesment

The selection of land cover indices in LULC studies plays a vital role in assessing the impact of urbanization, population growth, and climate on land surface characteristics [121]. Water bodies, vegetation, barren ground, and built-up regions are key LULC classifications frequently found to significantly influence LST dynamics, and the findings completely support it [122,123]. The findings of this review emphasize that the careful selection of a few key spectral indices significantly enhances the ability to detect LULC changes and understand their impact on LST dynamics. Among the numerous indices employed, five stood out for their critical roles: NDVI, NDBI, NDWI, SAVI, and EVI [124,125,126,127].
One of the most effective mitigating factors for high LST is vegetation cover, often measured using the NDVI. Numerous studies have demonstrated a negative correlation between LST and NDVI, highlighting the critical role of vegetation in cooling urban areas and mitigating the UHI effect [2]. Similarly, indices like the NDWI and NDBI illustrate how water bodies and urban infrastructure, respectively, contribute to spatial temperature changes. These findings highlight the importance of preserving and expanding green spaces in urban planning to combat rising LST effectively [6].
The combination of these results emphasizes the importance of considering both natural and human factors when examining the impact of climate change on LST from a LULC change perspective [58]. The complex interplay between these factors, including urbanization, changes in water bodies, and shifts in vegetation patterns, determines the dynamics of the local climate [55]. Utilizing ML techniques provides valuable insights for land-use planners and policymakers to mitigate the effects of climate change on local temperature patterns [108]. The complete approach taken in these studies advances our understanding of the complex interactions among climate change, LULC, and LST, facilitating informed decision-making in sustainable environmental management [113].
The correlations shown in Table 2 in numerous studies reveal interconnected dynamics between LST, LULC changes, and climate patterns. Urbanization emerges as a crucial factor influencing LST variations, with elevated temperatures correlating with increased built-up areas, indicating the impact of human activity on local temperature landscapes. The positive correlation between socioeconomic disparities and the spatial distribution of LST further complicates the socio-environmental fabric influencing urban temperature patterns [128].
Climate change increases the effects of LULC changes on LST, as seen in the influence of variations in built-up areas and green space density on UHI intensity. The consistent negative correlation between LST and green spaces or NDVI draws attention to the role of vegetation in mitigating temperature. Negative relationships between LST and various indices, including NDVI, NDWI, and NDBa, highlight the sensitivity of temperature patterns to variations in land cover [22,113,129]. This synthesis emphasizes the intricate interactions among LST, LULC changes, and climate change, underscoring the necessity of a comprehensive knowledge base for well-informed urban planning and climate resilience strategies. Urban planners should prioritize green-blue infrastructure (e.g., urban parks, permeable pavements) in high-NDBI zones to offset temperature rises.
The accuracy assessment methodologies employed across these LULC–LST studies reveal both strengths and limitations in current validation approaches. While correlation analyses (particularly Pearson) dominate the field—appearing in over 60% of examined studies—their reliance on linear assumptions may obscure important non-linear relationships that ML models are capable of detecting [12]. The consistently strong negative correlations between NDVI and LST (reaching −0.95 in some cases) robustly confirm vegetation’s cooling effects, yet the moderate explanatory power of even the best-performing indices (like NDBI’s 36–38% LST variance explanation) suggests significant missing variables in current models [116].
Several critical gaps emerge when examining these validation approaches. First, despite the gradual nature of urbanization impacts, only about one-quarter of studies incorporated multi-decadal validation timelines. Second, pixel-based analyses reveal substantial microclimate variability (2–35% in NDVI-LST relationships) that aggregate metrics often mask. Third, the fundamentally different index-LST relationships observed in arid versus coastal cities highlight the context-dependent nature of these thermal patterns that generic models frequently overlook [36].
The exceptional performance of hybrid models like CA-Markov (achieving Kappa = 0.92 in Lahore) points toward promising solutions [74]. These approaches combine the spatial explicitness needed for urban planning with the statistical rigor required for scientific validation. Such advancements will be crucial for creating validation protocols that match the complexity of modern urban thermal environments. To address current limitations associated with heavy reliance on Pearson correlation analyses and improve ML model interpretability, we recommend adopting more advanced interpretability techniques such as SHapley Additive exPlanations (SHAP) and Local Interpretable Model-agnostic Explanations (LIME). SHAP provides valuable insights by quantifying each feature’s contribution to model predictions, enhancing transparency and enabling urban planners to better understand model outcomes. For instance, recent studies such as Gavade and Gavade and Zheng, Meninti and Hu successfully demonstrated SHAP’s and LIME effectiveness in interpreting complex LST predictions, significantly improving policy-making relevance [128,130]. Similarly, LIME offers localized explanations of predictions, enabling clearer insights into model behavior at specific geographic or demographic scales. Incorporating these interpretability methods in future validation strategies could substantially enhance both the transparency and practical utility of ML-based environmental models.

4.3. Machine Learning for Assessing Land Use Impacts on LSTs

As ML refines our understanding of the complex relationships between climate change, land use dynamics, and LST, it becomes a valuable tool for shaping evidence-based policies [27]. The integration of ML-driven insights into urban planning strategies enhances our capacity to formulate proactive measures that mitigate rising temperatures, foster sustainable land use practices, and support climate resilience [22]. The systematic review highlights the extensive and diverse application of ML algorithms in modeling LULC dynamics and estimating LST. The findings emphasize that model selection in LULC–LST studies is closely aligned with the complexity of landscape transformations, data availability, and the trade-off between model accuracy and interpretability.
CA-Markov and RF emerged as the most widely adopted algorithms. CA-Markov excels in simulating spatially explicit land transitions by combining cellular automata’s spatial rules with Markov chains’ temporal dynamics, making it ideal for gradual urban expansion scenarios. However, its assumption of stationary transition probabilities limits its ability to capture abrupt changes from extreme events or policy shifts. RF, on the other hand, demonstrates strong predictive power across diverse environmental datasets due to its ensemble learning structure. Its robustness to noise, ability to model complex nonlinear relationships, and resistance to overfitting make it highly suitable for integrated LULC–LST studies [130]. Nevertheless, while RF offers excellent performance metrics, its “black box” nature often limits interpretability, posing challenges for policy-oriented applications where model transparency is essential. For example, Zhang et al. (2023) demonstrated that ANN-based LST predictions in Baghdad lacked transparency in identifying which urban features most influenced results, limiting their utility for zoning decisions [49]. Similarly, RF models in Dhaka showed high R2 accuracy but could not explain why certain informal settlements exhibited higher LST variability than others [131].
ANN and their hybrid versions such as ANN-CA were also prominent among the reviewed techniques [42,95]. ANN models excel in learning complex, nonlinear spatial patterns, making them particularly effective in heterogeneous landscapes with intricate land transformation dynamics [96]. The hybrid ANN-CA models leverage the pattern recognition capabilities of neural networks alongside CA’s spatial simulation strength, offering improved spatial realism in LULC predictions [95,97,100]. However, the need for large, well-labeled training datasets and the difficulty in interpreting model decisions remain notable limitations of ANN-based approaches.
SVM, sometimes combined with spatial simulation tools like the MOLUSCE plugin, also featured prominently in LULC classification tasks [36]. SVM models are effective in handling high-dimensional data and small sample sizes, providing competitive classification accuracy [57]. However, SVMs are sensitive to kernel and parameter selection, which can complicate their deployment, particularly when working with highly heterogeneous or noisy datasets [37].
Emerging methods such as XGB and GEP are gaining traction for LST modeling. Their adoption reflects a broader shift towards more sophisticated, high-performance predictive models capable of capturing subtle nonlinear interactions among variables [110]. XGB models offer advantages in computational efficiency and feature importance estimation, addressing some of the interpretability concerns associated with ensemble techniques like RF [108]. GEP, a form of evolutionary algorithm, provides flexible model structures that can uncover hidden relationships in environmental data, although it remains relatively underexplored in LULC–LST studies [103]. XGB and GEP provide significant improvements over traditional models such as CA-Markov and ANN. XGB, for example, significantly improves computational efficiency, accuracy, and interpretability due to its built-in feature importance metrics, making it ideal for dealing with large datasets with missing values [100,109]. GEP, on the other hand, provides flexible modeling capabilities thanks to its evolutionary algorithm structure, which effectively uncovers complex nonlinear relationships in environmental datasets. However, unlike CA-Markov, these emerging techniques may lack explicit spatial-temporal modeling capabilities, limiting their applicability in scenarios requiring detailed spatial predictions [110]. While ANN methods are still effective at modeling complex nonlinearities, their high data demands and computational costs often make XGB and GEP more practical in situations with limited resources or large datasets [96].
Regression-based approaches such as Multiple Linear Regression and Kernel Ridge Regression continue to play roles in LST modeling, particularly in studies prioritizing simplicity, interpretability, and low computational cost [59]. While these models offer ease of use and clear variable effect interpretations, their limited capacity to capture nonlinear and complex spatial interactions restricts their suitability for dynamic urban environments [64].
The diversity of ML techniques employed in LULC–LST research highlights the field’s methodological adaptability and richness. Model selection typically depends on research priorities, whether accuracy, interpretability, spatial realism, or computational efficiency. However, key challenges persist, including (1) the need for improved model interpretability to enhance utility for urban management; (2) hybrid approaches (e.g., integrating ANN’s nonlinear modeling with CA’s spatial explicitness) to leverage complementary strengths; and (3) automated parameter tuning and feature selection to minimize user bias and improve regional generalizability [96]. Future work should prioritize explainable ML frameworks, incorporate climate and socioeconomic variables into predictive models, and expand comparative studies across diverse urban and ecological settings to refine context-specific solutions.
While ML models like RF and ANN offer robust predictive capabilities, limitations remain. The “black-box” nature of ANN, for instance, hinders interpretability, and ensemble methods like RF may require substantial computational resources [39]. Models trained on imbalanced or noisy datasets may produce biased outputs, as found in Anil and Priyanka when predicting LULC changes across heterogeneous urban landscapes [129]. Similarly, another study found that while RF models effectively predicted temperature hotspots in Dhaka, they offered limited insight into why certain informal settlements consistently showed higher LST, limiting their application for climate justice analysis [88]. Such interpretability gaps can hinder the translation of ML outputs into actionable urban strategies. Furthermore, ensemble models like RF, while reducing overfitting, often demand substantial computational resources, particularly for high-dimensional RS datasets, as discussed by Gasirabo et al. [130]. Moreover, another study noted that ANN-based predictions of LST in Baghdad could not clearly explain the contribution of different urban features (e.g., vegetation vs. building materials), limiting their utility for zoning regulation [132]. Addressing these limitations requires a shift toward explainable ML models, such as explainable artificial intelligence techniques, and the integration of feature importance analyses to make models more transparent and actionable. Additionally, the accuracy of ML models in calculating LULC changes and their impact on LST is greatly subject to the quality and quantity of input data [132,133,134,135]. These cases exemplify how black-box models, despite their predictive power, may not translate well into actionable strategies without supplementary interpretability techniques or post hoc analysis [136,137,138,139].
In regions with limited field data or persisted cloud cover in satellite images, regular LULC mapping faces challenges that can affect model performance [140,141,142]. Furthermore, the spatial and temporal resolution of available satellite imagery may not always align with the specific requirements of a study area, potentially leading to less accurate predictions [143]. Addressing these limitations requires integrating multiple data sources, employing advanced preprocessing techniques, and selecting appropriate model design to enhance the reliability of ML applications in this domain [144].
Overall, while ML models have significantly advanced our understanding of the LULC–LST nexus, future research must continue addressing challenges related to model transparency, data integration, and regional generalizability. By prioritizing explainable, hybrid, and climate-aware modeling approaches, researchers can better translate predictive insights into practical strategies for sustainable urban planning and climate adaptation.
Table 2. Summary of publications quantifying the correlation between LULC and LST.
TechniqueQuantitative RelationshipLocationRef.
linear regression analysisA strong negative correlation between LST and vegetation cover and strong positive correlation between socioeconomic disparities and spatial distribution of summer daytime and nighttime LST (Mean LST across Phoenix (28.86 °C) was lower than the urban core (29.14 °C).Phoenix, AZ, USA[29]
Pearson correlation coefficientThe UHI intensity was negatively related to the density of green space, aquatic area, NDVI, altitude, and sky view factor (p < 0.01), and the UHI intensity was positively related to the density of built-up areas, population density, and mean building height (p < 0.01).Shenzhen, China[80]
Pearson correlationIn 1995, a strong positive association was found between LST and NDBI and NDBSI, with a negative correlation to NDVI and NDWI. High temperature differences led to decreased water content and green cover, while excessive bear soil and buildup increased LST values.Dhaka, Bangladesh[136]
Pearson correlation coefficientThere is a strong negative correlation between LST and the NDVI each year with the mean LST increase of 0.19 °C.Rajshahi, Bangladesh[135]
Pearson correlation coefficientStrong positive correlation between NDBI and LST (36.38% and 38.44% of the NDBI variability can be ascribed to LST during 2000, 2014, and 2022), a negative relationship between LST and
NDVI (22.86% and 23.46% of the NDVI variability can be ascribed to LST during 2000, 2014, and 2022).
Kamrup, India[134]
pixel-based correlation analysisThe study found a correlation between LST and NDVI, showing 2% to 35% variability in NDVI. The correlation between LST and NDBI was also low, showing 5% to 26% variability.Irbid governorate, Jordan[66]
NDBI indexThe NDBI-LST relationship shows the significance of the built-up zone on the final surface temperature increase (LST). As the built-up area increases, the impervious layers rise in elevation, leading to higher LST.Kuwait[40]
Pearson correlation coefficientPositive correlations between built-up areas and SUHII (0.82), and negative correlations between vegetation cover and SUHII (−0.73).Bangkok, Thailand[68]
Linear regressionLST represents strong and positive correlation with NDBI (29.36 °C in 1999, 29.69 °C in 2009, 39.52 °C in 2019) and strongly negative correlation with NDVI, NDWI, and NDBa.Rajshahi, Bangeladesh[135]
Pearson correlation coefficientStrong negative correlation between NDVI and LST, with a correlation coefficient of −0.935. Dhaka’s core urban area experienced LST around 34 °C in 2000, increasing to over 35 °C as urbanization increased. Greener areas with more vegetation had lower LST.Dhaka, Bangeladesh[136]
NDBI indexFrom 1999 to 2019, urban areas increased from 20.45 km2 to 26.31 km2, while vegetation and water bodies decreased. Bare land area increased from 3.52 km2 to 12.48%, with the highest positive net changes for urban area and bare land.Cumilla, Bangladesh[125]
Pearson correlationStrong negative correlation between LST and various indices in 2010 (0.93) and a strong negative relationship with the NDVI and NDWI (−0.95 in 2020).Al Kut, Iraq[37]
Linear analysisUrban index (UI) was the most influential parameter contributing 30.16% to LST, followed by Normalized Difference Built-up Index (NDBI) at 27.5%, Normalized Difference Vegetation Index (NDVI) at 24.73%, and Normalized Difference Water Index (NDWI) at 18.04%.Freetown, Sierra-Leon[41]
Kapa CoefficientThe study revealed significant urbanization in Lahore, with built-up areas increasing by 359.8 km2 from 1994 to 2024, while vegetation decreased by 198.7 km2 and barren land by 158.5 km2. Water bodies continued to be relatively stable. Future projections for 2034 and 2044 indicate continued urban expansion at the expense of vegetation and barren land. The CA-Markov model achieved a high prediction accuracy with a Kappa coefficient of 0.92.Lahore, Pakistan[141]

5. Conclusions

This systematic review focused on ML techniques to investigate how LULC changes affect LST. For LULC and LST dynamics prediction, the most popular models were CA-Markov, ANN, and RF. It was discovered that among the LULC classes, bare land, water bodies, vegetation cover, and built-up areas all had a significant impact on LST variation. It was common practice to quantify these effects using indicators like the NDVI and NDBI. Green spaces play a critical cooling role, as evidenced by the consistent negative correlation between vegetation cover and LST across global case studies. ML models, particularly hybrid and ensemble approaches, have demonstrated strong performance in simulating the intricate relationships between surface temperature and land cover. Nonetheless, problems such as model interpretability, computational complexity, and data quality persist as challenges.
To advance this field, future research should incorporate real-time climate variables into LULC–LST modeling frameworks and investigate emerging deep learning architectures, such as transformer-based models, to improve scalability and generalization. Improving interdisciplinary collaboration among experts in geography, climatology, RS, and ML will be critical for developing interpretable and actionable insights to support sustainable urban development and climate resilience.

Author Contributions

Both authors contributed to the design of the methodology and writing of the paper. R.V. conducted the systematic review, collected the data, and performed the analysis. M.H.A. provided supervision, resources, and contributed to the review, editing, and guidance throughout the research process. Both authors participated in the preparation of the manuscript and approved the final version for publication. All authors have read and agreed to the published version of the manuscript.

Funding

This research received no external funding.

Data Availability Statement

This study is a systematic review of published literature. No new data were created or analyzed, and all sources are publicly available as cited in the references.

Conflicts of Interest

The authors declare no conflicts of interest.

References

  1. Patel, S.; Indraganti, M.; Jawarneh, R.N. Land surface temperature responses to land use dynamics in urban areas of Doha, Qatar. Sustain. Cities Soc. 2024, 104, 105273. [Google Scholar] [CrossRef]
  2. Ullah, W.; Ahmad, K.; Ullah, S.; Tahir, A.A.; Javed, M.F.; Nazir, A.; Abbasi, A.M.; Aziz, M.; Mohamed, A. Analysis of the relationship among land surface temperature (LST), land use land cover (LULC), and normalized difference vegetation index (NDVI) with topographic elements in the lower Himalayan region. Heliyon 2023, 9, e13322. [Google Scholar] [CrossRef] [PubMed]
  3. Kim, M.; Kim, D.; Kim, G. Examining the Relationship between Land Use/Land Cover (LULC) and Land Surface Temperature (LST) Using Explainable Artificial Intelligence (XAI) Models: A Case Study of Seoul, South Korea. Int. J. Environ. Res. Public Health 2022, 19, 15926. [Google Scholar] [CrossRef] [PubMed]
  4. Kafy, A.-A.; Saha, M.; Faisal, A.-A.; Rahaman, Z.A.; Rahman, M.T.; Liu, D.; Fattah, M.A.; Al Rakib, A.; AlDousari, A.E.; Rahaman, S.N.; et al. Predicting the impacts of land use/land cover changes on seasonal urban thermal characteristics using machine learning algorithms. Build. Environ. 2022, 217, 109066. [Google Scholar] [CrossRef]
  5. Li, H.; Zhou, Y.; Li, X.; Meng, L.; Wang, X.; Wu, S.; Sodoudi, S. A new method to quantify surface urban heat island intensity. Sci. Total Environ. 2018, 624, 262–272. [Google Scholar] [CrossRef]
  6. Pal, S.; Sharma, P. A Review of Machine Learning Applications in Land Surface Modeling. Earth 2021, 2, 174–190. [Google Scholar] [CrossRef]
  7. Patel, S.; Indraganti, M.; Jawarneh, R.N. A Comprehensive Systematic Review: Impact of Land Use/Land Cover (LULC) on Land Surface Temperatures (LST) and Outdoor Thermal Comfort. Build. Environ. 2024, 249, 111130. [Google Scholar] [CrossRef]
  8. Pal, S.; Ziaul, S.K. Detection of land use and land cover change and land surface temperature in English Bazar urban centre. Egypt. J. Remote Sens. Space Sci. 2017, 20, 125–145. [Google Scholar] [CrossRef]
  9. Naserikia, M.; Hart, M.A.; Nazarian, N.; Bechtel, B.; Lipson, M.; Nice, K.A. Land surface and air temperature dynamics: The role of urban form and seasonality. Sci. Total Environ. 2023, 905, 167306. [Google Scholar] [CrossRef]
  10. Santhosh, L.G.; Shilpa, D.N. Assessment of LULC change dynamics and its relationship with LST and spectral indices in a rural area of Bengaluru district, Karnataka India. Remote Sens. Appl. Soc. Environ. 2023, 29, 100886. [Google Scholar] [CrossRef]
  11. Mokarram, M.; Taripanah, F.; Pham, T.M. Investigating the effect of surface urban heat island on the trend of temperature changes. Adv. Space Res. 2023, 72, 3150–3169. [Google Scholar] [CrossRef]
  12. Rostami, E.; Vahid, R.; Zarei, A.; Amani, M. Dynamic Analysis of Water Surface Extent and Climate Change Parameters in Zarivar Lake, Iran. Environ. Sci. Proc. 2024, 29, 71. [Google Scholar] [CrossRef]
  13. Wang, S.; Huang, X.; Liu, P.; Zhang, M.; Biljecki, F.; Hu, T.; Fu, X.; Liu, L.; Liu, X.; Wang, R.; et al. Mapping the landscape and roadmap of geospatial artificial intelligence (GeoAI) in quantitative human geography: An extensive systematic review. Int. J. Appl. Earth Obs. Geoinf. 2024, 128, 103734. [Google Scholar] [CrossRef]
  14. Vujovic, S.; Haddad, B.; Karaky, H.; Sebaibi, N.; Boutouil, M. Urban Heat Island: Causes, Consequences, and Mitigation Measures with Emphasis on Reflective and Permeable Pavements. CivilEng 2021, 2, 459–484. [Google Scholar] [CrossRef]
  15. Krishnan, V.; Firoz, C. Impact of land use and land cover change on the environmental quality of a region: A case of Ernakulam district in Kerala, India. Reg. Stat. 2021, 11, 102–135. [Google Scholar] [CrossRef]
  16. Pal, S.C.; Chowdhuri, I.; Das, B.; Chakrabortty, R.; Roy, P.; Saha, A.; Shit, M. Threats of climate change and land use patterns enhance the susceptibility of future floods in India. J. Environ. Manag. 2022, 305, 114317. [Google Scholar] [CrossRef]
  17. Petkar, H.J. Machine Learning: Techniques and Principles [Internet]; Academic Guru Publishing House: Bhopal, India, 2023; Available online: https://books.google.com/books?hl=en&lr=&id=zJbgEAAAQBAJ&oi=fnd&pg=PA1&dq=Furthermore,+machine+learning%27s+capacity+for+unsupervised+learning,+clustering,+and+anomaly+detection+opens+avenues+for+uncovering+hidden+insights+within+vast+datasets&ots=G8QPypJOS4&sig=Me-2RydOjGXzfZ7qRsZrXi5Kr2E (accessed on 31 December 2023).
  18. Wang, C.; Li, Y.; Myint, S.W.; Zhao, Q.; Wentz, E.A. Impacts of spatial clustering of urban land cover on land surface temperature across Köppen climate zones in the contiguous United States. Landsc. Urban Plan. 2019, 192, 103668. [Google Scholar] [CrossRef]
  19. Wickham, J.; Homer, C.; Vogelmann, J.; Mckerrow, A.; Mueller, R.; Herold, N.; Coulston, J. The Multi-Resolution Land Characteristics (MRLC) Consortium—20 Years of Development and Integration of USA National Land Cover Data. Remote Sens. 2014, 6, 7424–7441. [Google Scholar] [CrossRef]
  20. Rana, M.S.; Sarkar, S.; Sadat, M.N.; Tabassum, T.; Fahim, A.U. Predicting Potential Change in Land Cover and Its Effect on the Temperature of the Land Surface: A Case Study of Khulna City Corporation, Bangladesh. Environ. Urban. ASIA 2022, 13, 247–264. [Google Scholar] [CrossRef]
  21. Li, F.; Yigitcanlar, T.; Nepal, M.; Nguyen, K.; Dur, F. Machine learning and remote sensing integration for leveraging urban sustainability: A review and framework. Sustain. Cities Soc. 2023, 96, 104653. [Google Scholar] [CrossRef]
  22. Sanchez, L.; Reames, T.G. Cooling Detroit: A socio-spatial analysis of equity in green roofs as an urban heat island mitigation strategy. Urban For. Urban Green. 2019, 44, 126331. [Google Scholar] [CrossRef]
  23. Simwanda, M.; Ranagalage, M.; Estoque, R.C.; Murayama, Y. Spatial Analysis of Surface Urban Heat Islands in Four Rapidly Growing African Cities. Remote Sens. 2019, 11, 1645. [Google Scholar] [CrossRef]
  24. Sun, Z.; Li, Z.; Zhong, J. Analysis of the Impact of Landscape Patterns on Urban Heat Islands: A Case Study of Chengdu, China. Int. J. Environ. Res. Public Health 2022, 19, 13297. [Google Scholar] [CrossRef] [PubMed]
  25. Supe, H.; Abhishek, A.; Avtar, R. Assessment of the solar energy–agriculture–water nexus in the expanding solar energy industry of India: An initiative for sustainable resource management. Heliyon 2024, 10, e23125. [Google Scholar] [CrossRef]
  26. Sohn, H.; Dzwonczyk, M.; Straser, E.G.; Kiremidjian, A.S.; Law, K.H.; Meng, T. An experimental study of temperature effect on modal parameters of the Alamosa Canyon Bridge. Earthq. Eng. Struct. Dyn. 1999, 28, 879–897. [Google Scholar] [CrossRef]
  27. Li, Z.; Zhang, H.; Wen, C.-Y.; Yang, A.-S.; Juan, Y.-H. Effects of height-asymmetric street canyon configurations on outdoor air temperature and air quality. Build. Environ. 2020, 183, 107195. [Google Scholar] [CrossRef]
  28. Santamouris, M. Analyzing the heat island magnitude and characteristics in one hundred Asian and Australian cities and regions. Sci. Total Environ. 2015, 512, 582–598. [Google Scholar] [CrossRef]
  29. Zhu, Y.; Myint, S.; Schaffer-Smith, D.; Muenich, R.; Tong, D.; Li, Y. Formulating Operational Mitigation Options and Examining Intra-Urban Social Inequality Using Evidence-Based Urban Warming Effects. Front. Environ. Sci. 2022, 9, 795474. [Google Scholar] [CrossRef]
  30. Assaf, G.; Hu, X.; Assaad, R. Predicting Urban Heat Island severity on the census-tract level using Bayesian networks. Sustain. Cities Soc. 2023, 97, 104756. [Google Scholar] [CrossRef]
  31. Lin, J.; Qiu, S.; Tan, X.; Zhuang, Y. Measuring the relationship between morphological spatial pattern of green space and urban heat island using machine learning methods. Build. Environ. 2023, 228, 109910. [Google Scholar] [CrossRef]
  32. Mallick, J. Evaluation of Seasonal Characteristics of Land Surface Temperature with NDVI and Population Density. Pol. J. Environ. Stud. 2021, 30, 3163–3180. [Google Scholar] [CrossRef] [PubMed]
  33. Zha, Y.; Gao, J.; Ni, S. Use of normalized difference built-up index in automatically mapping urban areas from TM imagery. Int. J. Remote Sens. 2003, 24, 583–594. [Google Scholar] [CrossRef]
  34. Saim, A.A.; Aly, M.H. Fusion-Based Approaches and Machine Learning Algorithms for Forest Monitoring: A Systematic Review. Wild 2025, 2, 7. [Google Scholar] [CrossRef]
  35. Page, M.J.; McKenzie, J.E.; Bossuyt, P.M.; Boutron, I.; Hoffmann, T.C.; Mulrow, C.D.; Shamseer, L.; Tetzlaff, J.M.; Akl, E.A.; Brennan, S.E.; et al. The PRISMA 2020 statement: An updated guideline for reporting systematic reviews. BMJ 2021, 372, n71. [Google Scholar] [CrossRef]
  36. Abdulla-Al Kafy; Abdullah-Al-Faisal; Al Rakib, A.; Akter, K.; Rahaman, Z.; Jahir, D.; Subramanyam, G.; Michel, O.; Bhatt, A. The operational role of remote sensing in assessing and predicting land use/land cover and seasonal land surface temperature using machine learning algorithms in Rajshahi, Bangladesh. Appl. Geomat. 2021, 13, 793–816. [Google Scholar] [CrossRef]
  37. Edan, M.H.; Maarouf, R.M.; Hasson, J. Predicting the impacts of land use/land cover change on land surface temperature using remote sensing approach in Al Kut, Iraq. Phys. Chem. Earth Parts ABC 2021, 123, 103012. [Google Scholar] [CrossRef]
  38. Feyzolahpour, M. Measuring the spring and autumn fluctuations of land use indices (LULC) using support vector machine (SVM) method and analyzing the correlation relationships of LST with NDBI, MNDWI and NDVI indices (in the Heyran Pass area). Hydrogeomorphology 2024, 11, 19–39. [Google Scholar] [CrossRef]
  39. Kasahun, M.; Legesse, A. Machine learning for urban land use/cover mapping: Comparison of artificial neural network, random forest and support vector machine, a case study of Dilla town. Heliyon 2024, 10, e39146. [Google Scholar] [CrossRef]
  40. AlDousari, A.E.; Kafy, A.-A.; Saha, M.; Fattah, M.A.; Almulhim, A.I.; Faisal, A.-A.; Al Rakib, A.; Jahir, D.M.A.; Rahaman, Z.A.; Bakshi, A.; et al. Modelling the impacts of land use/land cover changing pattern on urban thermal characteristics in Kuwait. Sustain. Cities Soc. 2022, 86, 104107. [Google Scholar] [CrossRef]
  41. Kaloop, M.R.; Iqbal, M.; Elnabwy, M.T.; Mustafa, E.K.; Hu, J.W. A novel AI approach for modeling land surface temperature of Freetown, Sierra Leone, based on land-cover changes. Int. J. Digit. Earth 2022, 15, 1236–1258. [Google Scholar] [CrossRef]
  42. Al-Dousari, A.; Mishra, A.; Singh, S. Land use land cover change detection and urban sprawl prediction for Kuwait metropolitan region, using multi-layer perceptron neural networks (MLPNN). Egypt. J. Remote Sens. Space Sci. 2023, 26, 381–392. [Google Scholar] [CrossRef]
  43. He, T.; Liu, F.; Wang, A.; Fei, Z. Estimating Monthly Surface Air Temperature Using MODIS LST Data and an Artificial Neural Network in the Loess Plateau, China. Chin. Geogr. Sci. 2023, 33, 751–763. [Google Scholar] [CrossRef]
  44. Zeshan, M.; Mustafa, M.; Baig, M. Monitoring Land Use Changes and Their Future Prospects Using GIS and ANN-CA for Perak River Basin, Malaysia. Water 2021, 13, 2286. [Google Scholar] [CrossRef]
  45. Lukas, P.; Melesse, A.M.; Kenea, T.T. Prediction of Future Land Use/Land Cover Changes Using a Coupled CA-ANN Model in the Upper Omo–Gibe River Basin, Ethiopia. Remote Sens. 2023, 15, 1148. [Google Scholar] [CrossRef]
  46. Addas, A. Machine Learning Techniques to Map the Impact of Urban Heat Island: Investigating the City of Jeddah. Land 2023, 12, 1159. [Google Scholar] [CrossRef]
  47. Aka, K.; Akpavi, S.; Dibi, N.; Kabo-Bah, A.; Gyilbag, A.; Boamah, E. Toward understanding land use land cover changes and their effects on land surface temperature in yam production area, Cote d’Ivoire, Gontougo Region, using remote sensing and machine learning tools (Google Earth Engine). Front. Remote Sens. 2023, 4, 1221757. [Google Scholar] [CrossRef]
  48. Tramontana, G.; Ichii, K.; Camps-Valls, G.; Tomelleri, E.; Papale, D. Uncertainty analysis of gross primary production upscaling using Random Forests, remote sensing and eddy covariance data. Remote Sens. Environ. 2015, 168, 360–373. [Google Scholar] [CrossRef]
  49. Liu, X.; Fu, D.; Zevenbergen, C.; Busker, T.; Yu, M. Assessing Sponge Cities Performance at City Scale Using Remotely Sensed LULC Changes: Case Study Nanjing. Remote Sens. 2021, 13, 580. [Google Scholar] [CrossRef]
  50. Zhang, Z.; Hörmann, G.; Huang, J.; Fohrer, N. A Random Forest-Based CA-Markov Model to Examine the Dynamics of Land Use/Cover Change Aided with Remote Sensing and GIS. Remote Sens. 2023, 15, 2128. [Google Scholar] [CrossRef]
  51. Yoo, B.; Kim, K.; Park, J.; Moon, K.; Ahn, J.; Fleisher, D. Spatial portability of random forest models to estimate site-specific air temperature for prediction of emergence dates of the Asian Corn Borer in North Korea. Comput. Electron. Agric. 2022, 199, 107113. [Google Scholar] [CrossRef]
  52. Zheng, M.; Zhang, J.; Wang, J.; Yang, S.; Han, J.; Hassan, T. Reconstruction of 0.05° all-sky daily maximum air temperature across Eurasia for 2003-2018 with multi-source satellite data and machine learning models. Atmos. Res. 2022, 279, 106398. [Google Scholar] [CrossRef]
  53. Jin, Z.; Ma, Y.; Chu, L.; Liu, Y.; Dubrow, R.; Chen, K. Predicting spatiotemporally-resolved mean air temperature over Sweden from satellite data using an ensemble model. Environ. Res. 2022, 204, 111960. [Google Scholar] [CrossRef] [PubMed]
  54. Badjana, H.; Olofsson, P.; Woodcock, C.; Helmschrot, J.; Wala, K.; Akpagana, K. Mapping and estimating land change between 2001 and 2013 in a heterogeneous landscape in West Africa: Loss of forestlands and capacity building opportunities. Int. J. Appl. Earth Obs. Geoinf. 2017, 63, 15–23. [Google Scholar] [CrossRef]
  55. Liu, X.; Liang, X.; Li, X.; Xu, X.; Ou, J.; Chen, Y.; Li, S.; Wang, S.; Pei, F. A future land use simulation model (FLUS) for simulating multiple land use scenarios by coupling human and natural effects. Landsc. Urban Plan. 2017, 168, 94–116. [Google Scholar] [CrossRef]
  56. Aftab, B.; Wang, Z.; Wang, S.; Feng, Z. Application of a Multi-Layer Perceptron and Markov Chain Analysis-Based Hybrid Approach for Predicting and Monitoring LULCC Patterns Using Random Forest Classification in Jhelum District, Punjab, Pakistan. Sensors 2024, 24, 5648. [Google Scholar] [CrossRef]
  57. Pande, C.B.; Srivastava, A.; Moharir, K.N.; Radwan, N.; Mohd Sidek, L.; Alshehri, F.; Pal, S.C.; Tolche, A.D.; Zhran, M. Characterizing land use/land cover change dynamics by an enhanced random forest machine learning model: A Google Earth Engine implementation. Environ. Sci. Eur. 2024, 36, 84. [Google Scholar] [CrossRef]
  58. Avcı, C.; Budak, M.; Yağmur, N.; Balçık, F. Comparison between random forest and support vector machine algorithms for LULC classification. Int. J. Eng. Geosci. 2023, 8, 1–10. [Google Scholar] [CrossRef]
  59. Liao, J.; Tang, L.; Shao, G. Coupling Random Forest, Allometric Scaling, and Cellular Automata to Predict the Evolution of LULC under Various Shared Socioeconomic Pathways. Remote Sens. 2023, 15, 2142. [Google Scholar] [CrossRef]
  60. Ouma, Y.O.; Nkwae, B.; Odirile, P.; Moalafhi, D.B.; Anderson, G.; Parida, B.; Qi, J. Land-Use Change Prediction in Dam Catchment Using Logistic Regression-CA, ANN-CA and Random Forest Regression and Implications for Sustainable Land–Water Nexus. Sustainability 2024, 16, 1699. [Google Scholar] [CrossRef]
  61. Cotugno, A.; Smith, V.; Baker, T.; Srinivasan, R. A Framework for Calculating Peak Discharge and Flood Inundation in Ungauged Urban Watersheds Using Remotely Sensed Precipitation Data: A Case Study in Freetown, Sierra Leone. Remote Sens. 2021, 13, 3806. [Google Scholar] [CrossRef]
  62. Arunab, K.S.; Mathew, A. Exploring spatial machine learning techniques for improving land surface temperature prediction. Kuwait J. Sci. 2024, 51, 100242. [Google Scholar] [CrossRef]
  63. Al-Hameedi, W.M.M.; Chen, J.; Faichia, C.; Nath, B.; Al-Shaibah, B.; Al-Aizari, A. Geospatial Analysis of Land Use/Cover Change and Land Surface Temperature for Landscape Risk Pattern Change Evaluation of Baghdad City, Iraq, Using CA–Markov and ANN Models. Sustainability 2022, 14, 8568. [Google Scholar] [CrossRef]
  64. Huang, Y.; Yang, B.; Wang, M.; Liu, B.; Yang, X. Analysis of the future land cover change in Beijing using CA-Markov chain model. Environ. Earth Sci. 2020, 79, 60. [Google Scholar] [CrossRef]
  65. Hua, A. Spatial-Temporal Analysis of Pattern Changes and Prediction in Penang Island, Malaysia Using Lulc and CA-Markov Model. Appl. Ecol. Environ. Res. 2018, 16, 4619–4635. [Google Scholar] [CrossRef]
  66. Khawaldah, H.; Farhan, I.; Alzboun, N. Simulation and prediction of land use and land cover change using GIS, remote sensing and CA-Markov model. Glob. J. Environ. Sci. Manag. GJESM 2020, 6, 215–232. [Google Scholar] [CrossRef]
  67. Jawarneh, R.; Abulibdeh, A.; Hashem, N.; Awawdeh, M.; Al-Awadhi, T.; Abdullah, M.; Kenawy, A. Assessing and predicting land cover dynamics for environmental sustainability in Jordan’s arid ecosystems using CA-Markov model. Remote Sens. Appl. Soc. Environ. 2024, 35, 101262. [Google Scholar] [CrossRef]
  68. Tariq, A.; Shu, H. CA-Markov Chain Analysis of Seasonal Land Surface Temperature and Land Use Land Cover Change Using Optical Multi-Temporal Satellite Data of Faisalabad, Pakistan. Remote Sens. 2020, 12, 3402. [Google Scholar] [CrossRef]
  69. Selmy, S.A.H.; Kucher, D.E.; Mozgeris, G.; Moursy, A.R.A.; Jimenez-Ballesta, R.; Kucher, O.D.; Fadl, M.E.; Mustafa, A.-r.A. Detecting, Analyzing, and Predicting Land Use/Land Cover (LULC) Changes in Arid Regions Using Landsat Images, CA-Markov Hybrid Model, and GIS Techniques. Remote Sens. 2023, 15, 5522. [Google Scholar] [CrossRef]
  70. Das, S.; Shit, P.; Patel, P. Ecosystem services value assessment and forecasting using integrated machine learning algorithm and CA-Markov model: An empirical investigation of an Asian megacity. Geocarto Int. 2022, 37, 8417–8439. [Google Scholar] [CrossRef]
  71. Da Cunha, E.R.; Santos, C.A.G.; da Silva, R.M.; Bacani, V.M.; Pott, A. Future scenarios based on a CA-Markov land use and land cover simulation model for a tropical humid basin in the Cerrado/Atlantic forest ecotone of Brazil. Land Use Policy 2021, 101, 105141. [Google Scholar] [CrossRef]
  72. Tariq, A.; Yan, J.; Mumtaz, F. Land change modeler and CA-Markov chain analysis for land use land cover change using satellite data of Peshawar, Pakistan. Phys. Chem. Earth 2022, 128, 103286. [Google Scholar] [CrossRef]
  73. Taloor, A.K.; Sharma, S.; Parsad, G.; Jasrotia, R. Land use land cover simulations using integrated CA-Markov model in the Tawi Basin of Jammu and Kashmir India. Geosyst. Geoenviron. 2024, 3, 100268. [Google Scholar] [CrossRef]
  74. Weslati, O.; Bouaziz, S.; Sarbeji, M. Modelling and Assessing the Spatiotemporal Changes to Future Land Use Change Scenarios Using Remote Sensing and CA-Markov Model in the Mellegue Catchment. J. Indian Soc. Remote Sens. 2023, 51, 9–29. [Google Scholar] [CrossRef]
  75. Tahir, Z.; Haseeb, M.; Mahmood, S.A.; Batool, S.; Abdullah-Al-Wadud, M.; Ullah, S.; Tariq, A. Predicting land use and land cover changes for sustainable land management using CA-Markov modelling and GIS techniques. Sci. Rep. 2025, 15, 3271. [Google Scholar] [CrossRef]
  76. Hamad, R.; Balzter, H.; Kolo, K. Predicting Land Use/Land Cover Changes Using a CA-Markov Model under Two Different Scenarios. Sustainability 2018, 10, 3421. [Google Scholar] [CrossRef]
  77. Luan, C.; Liu, R. A Comparative Study of Various Land Use and Land Cover Change Models to Predict Ecosystem Service Value. Int. J. Environ. Res. Public Health 2022, 19, 6484. [Google Scholar] [CrossRef]
  78. Gao, Y.; Chen, J.; Luo, H.; Wang, H. Prediction of hydrological responses to land use change. Sci. Total Environ. 2020, 708, 134998. [Google Scholar] [CrossRef]
  79. Arfasa, G.F.; Owusu-Sekyere, E.; Doke, D.A. Predictions of land use/land cover change, drivers, and their implications on water availability for irrigation in the Vea catchment, Ghana. Geocarto Int. 2023, 38, 2243093. [Google Scholar] [CrossRef]
  80. Feng, Y.; Li, H.; Tong, X.; Chen, L.; Liu, Y. Projection of land surface temperature considering the effects of future land change in the Taihu Lake Basin of China. Glob. Planet. Change 2018, 167, 24–34. [Google Scholar] [CrossRef]
  81. Rimal, B.; Zhang, L.; Keshtkar, H.; Sun, X.; Rijal, S. Quantifying the Spatiotemporal Pattern of Urban Expansion and Hazard and Risk Area Identification in the Kaski District of Nepal. Land 2018, 7, 37. [Google Scholar] [CrossRef]
  82. Wang, Q.; Guan, Q.; Lin, J.; Luo, H.; Tan, Z.; Ma, Y. Simulating land use/land cover change in an arid region with the coupling models. Ecol. Indic. 2021, 122, 107231. [Google Scholar] [CrossRef]
  83. Wang, Q.; Wang, H.; Chang, R.; Zeng, H.; Bai, X. Dynamic simulation patterns and spatiotemporal analysis of land-use/land-cover changes in the Wuhan metropolitan area, China. Ecol. Model. 2022, 464, 109850. [Google Scholar] [CrossRef]
  84. Lu, Y.; Wu, P.; Ma, X.; Li, X. Detection and prediction of land use/land cover change using spatiotemporal data fusion and the Cellular Automata-Markov model. Environ. Monit. Assess. 2019, 191, 68. [Google Scholar] [CrossRef] [PubMed]
  85. Lin, Z.; Peng, S. Comparison of multimodel simulations of land use and land cover change considering integrated constraints—A case study of the Fuxian Lake basin. Ecol. Indic. 2022, 142, 109254. [Google Scholar] [CrossRef]
  86. Kondum, F.A.; Rowshon, M.K.; Luqman, C.A.; Hasfalina, C.M.; Zakari, M.D. Change analyses and prediction of land use and land cover changes in Bernam River Basin, Malaysia. Remote Sens. Appl. Soc. Environ. 2024, 36, 101281. [Google Scholar] [CrossRef]
  87. Dinda, S.; Das Chatterjee, N.; Ghosh, S. An integrated simulation approach to the assessment of urban growth pattern and loss in urban green space in Kolkata, India: A GIS-based analysis. Ecol. Indic. 2021, 121, 107178. [Google Scholar] [CrossRef]
  88. Ghosh, P.; Mukhopadhyay, A.; Chanda, A.; Mondal, P.; Akhand, A.; Mukherjee, S.; Nayak, S.K.; Ghosh, S.; Mitra, D.; Ghosh, T.; et al. Application of Cellular automata and Markov-chain model in geospatial environmental modeling—A review. Remote Sens. Appl. Soc. Environ. 2017, 5, 64–77. [Google Scholar] [CrossRef]
  89. Amir Siddique, M.; Wang, Y.; Xu, N.; Ullah, N.; Zeng, P. The Spatiotemporal Implications of Urbanization for Urban Heat Islands in Beijing: A Predictive Approach Based on CA–Markov Modeling (2004–2050). Remote Sens. 2021, 13, 4697. [Google Scholar] [CrossRef]
  90. Farhan, M.; Wu, T.; Anwar, S.; Yang, J.; Naqvi, S.A.A.; Soufan, W.; Tariq, A. Predicting Land Use Land Cover Dynamics and Land Surface Temperature Changes Using CA-Markov-Chain Models in Islamabad, Pakistan (1992–2042). IEEE J. Sel. Top. Appl. Earth Obs. Remote Sens. 2024, 17, 16255–16271. Available online: https://ieeexplore.ieee.org/abstract/document/10632614 (accessed on 27 April 2025). [CrossRef]
  91. Meng, X.; Meng, F.; Zhao, Z.; Yin, C. Prediction of Urban Heat Island Effect over Jinan City Using the Markov-Cellular Automata Model Combined with Urban Biophysical Descriptors. J. Indian Soc. Remote Sens. 2021, 49, 997–1009. [Google Scholar] [CrossRef]
  92. Gemitzi, A. Predicting land cover changes using a CA Markov model under different shared socioeconomic pathways in Greece. GISci. Remote Sens. 2021, 58, 425–441. [Google Scholar] [CrossRef]
  93. Yadav, V.; Ghosh, S.K. Assessment and prediction of urban growth for a mega-city using CA-Markov model. Geocarto Int. 2021, 36, 1960–1992. [Google Scholar] [CrossRef]
  94. Sisay, G.; Gessesse, B.; Fürst, C.; Kassie, M.; Kebede, B. Modeling of land use/land cover dynamics using artificial neural network and cellular automata Markov chain algorithms in Goang watershed, Ethiopia. Heliyon 2023, 9, e20088. [Google Scholar] [CrossRef] [PubMed]
  95. Pandey, S.; Kumari, N. Prediction and monitoring of LULC shift using cellular automata-artificial neural network in Jumar watershed of Ranchi District, Jharkhand. Environ. Monit. Assess. 2023, 195, 130. [Google Scholar] [CrossRef]
  96. Rahman, M.T.U.; Esha, E.J. Prediction of land cover change based on CA-ANN model to assess its local impacts on Bagerhat, southwestern coastal Bangladesh. Geocarto Int. 2022, 37, 2604–2626. [Google Scholar] [CrossRef]
  97. Roy, S.; Chintalacheruvu, M.R. LULC Dynamics Study and Modeling of Urban Land Expansion Using CA-ANN. In Recent Advances in Civil Engineering; Swain, B.P., Dixit, U.S., Eds.; Springer Nature: Singapore, 2024; pp. 79–90. [Google Scholar]
  98. Abbas, Z.; Yang, G.; Zhong, Y.; Zhao, Y. Spatiotemporal Change Analysis and Future Scenario of LULC Using the CA-ANN Approach: A Case Study of the Greater Bay Area, China. Land 2021, 10, 584. [Google Scholar] [CrossRef]
  99. Dede, M.; Asdak, C.; Setiawan, I. Spatial dynamics model of land use and land cover changes: A comparison of CA, ANN, and ANN-CA. Regist. J. Ilm. Teknol. Sist. Inf. 2021, 8, 38–49. [Google Scholar] [CrossRef]
  100. Uddin, M.S.; Mahalder, B.; Mahalder, D. Assessment of Land Use Land Cover Changes and Future Predictions Using CA-ANN Simulation for Gazipur City Corporation, Bangladesh. Sustainability 2023, 15, 12329. [Google Scholar] [CrossRef]
  101. Baig, M.F.; Mustafa, M.R.U.; Baig, I.; Takaijudin, H.B.; Zeshan, M.T. Assessment of Land Use Land Cover Changes and Future Predictions Using CA-ANN Simulation for Selangor, Malaysia. Water 2022, 14, 402. [Google Scholar] [CrossRef]
  102. Değermenci, A.S. Spatio-temporal change analysis and prediction of land use and land cover changes using CA-ANN model. Environ. Monit. Assess. 2023, 195, 1229. [Google Scholar] [CrossRef]
  103. Mogaraju, J.K. Artificial Intelligence assisted prediction of land surface temperature (LST) based on significant air pollutants over the Annamayya district of India [Internet]. Res. Sq. 2023. preprint. Available online: https://www.researchsquare.com/article/rs-3186697/v1 (accessed on 27 April 2025).
  104. Firozjaei, M.K.; Sedighi, A.; Firozjaei, H.K.; Kiavarz, M.; Homaee, M.; Arsanjani, J.J.; Makki, M.; Naimi, B.; Alavipanah, S.K. A historical and future impact assessment of mining activities on surface biophysical characteristics change: A remote sensing-based approach. Ecol. Indic. 2021, 122, 107264. [Google Scholar] [CrossRef]
  105. Mushore, T.D.; Odindi, J.; Dube, T.; Mutanga, O. Prediction of future urban surface temperatures using medium resolution satellite data in Harare metropolitan city, Zimbabwe. Build. Environ. 2017, 122, 397–410. [Google Scholar] [CrossRef]
  106. Raza, A.; Vishwakarma, D.K.; Acharki, S.; Al-Ansari, N.; Alshehri, F.; Elbeltagi, A. Use of gene expression programming to predict reference evapotranspiration in different climatic conditions. Appl. Water Sci. 2024, 14, 152. [Google Scholar] [CrossRef]
  107. Islam, M.; Islam, K.; Ahasan, R.; Mia, M.; Haque, M. A data-driven machine learning-based approach for urban land cover change modeling: A case of Khulna City Corporation area. Remote Sens. Appl.-Soc. Environ. 2021, 24, 100634. [Google Scholar] [CrossRef]
  108. Akbarpour, S.; Craig, J. Simulating thaw-induced land cover change in discontinuous permafrost landscapes. Remote Sens. Appl.-Soc. Environ. 2022, 28, 100829. [Google Scholar] [CrossRef]
  109. Mohammad, P.; Goswami, A.; Chauhan, S.; Nayak, S. Machine learning algorithm based prediction of land use land cover and land surface temperature changes to characterize the surface urban heat island phenomena over Ahmedabad city, India. Urban. Clim. 2022, 42, 101116. [Google Scholar] [CrossRef]
  110. Abdi, A.M. Land cover and land use classification performance of machine learning algorithms in a boreal landscape using Sentinel-2 data. GISci. Remote Sens. 2020, 57, 1–20. [Google Scholar] [CrossRef]
  111. Tanoori, G.; Soltani, A.; Modiri, A. Machine Learning for Urban Heat Island (UHI) Analysis: Predicting Land Surface Temperature (LST) in Urban Environments. Urban Clim. 2024, 55, 101962. [Google Scholar] [CrossRef]
  112. Cheng, J.; Yang, D.; Qie, K.; Wang, J. Analysis of land surface temperature drivers in Beijing’s central urban area across multiple spatial scales: An explainable ensemble learning approach. Energy Build. 2025, 338, 115704. [Google Scholar] [CrossRef]
  113. Liu, B.; Yan, S.; You, H.; Dong, Y.; Li, Y.; Lang, J.; Gu, R. Road surface temperature prediction based on gradient extreme learning machine boosting. Comput. Ind. 2018, 99, 294–302. [Google Scholar] [CrossRef]
  114. Duan, S.-B.; Lian, Y.; Zhao, E.; Chen, H.; Han, W.; Wu, Z. A Novel Approach to All-Weather LST Estimation Using XGBoost Model and Multisource Data. IEEE Trans. Geosci. Remote Sens. 2023, 61, 5004614. [Google Scholar] [CrossRef]
  115. Tran, D.X.; Pla, F.; Latorre-Carmona, P.; Myint, S.W.; Caetano, M.; Kieu, H.V. Characterizing the relationship between land use land cover change and land surface temperature. ISPRS J. Photogramm. Remote Sens. 2017, 124, 119–132. [Google Scholar] [CrossRef]
  116. Traore, M.; Lee, M.S.; Rasul, A.; Balew, A. Assessment of land use/land cover changes and their impacts on land surface temperature in Bangui (the capital of Central African Republic). Environ. Chall. 2021, 4, 100114. [Google Scholar] [CrossRef]
  117. Rao, P.; Tassinari, P.; Torreggiani, D. Exploring the land-use urban heat island nexus under climate change conditions using machine learning approach: A spatio-temporal analysis of remotely sensed data. Heliyon 2023, 9, e18423. [Google Scholar] [CrossRef]
  118. Sundar, P.; Deka, P. Spatio-temporal classification and prediction of land use and land cover change for the Vembanad Lake system, Kerala: A machine learning approach. Environ. Sci. Pollut. Res. 2022, 29, 86220–86236. [Google Scholar] [CrossRef]
  119. Saha, M.; Al Kafy, A.; Bakshi, A.; Al-Faisal, A.; Almulhim, A.; Rahaman, Z.; Al Rakib, A.; Fattah, M.; Akter, K.; Rahman, M.; et al. Modelling microscale impacts assessment of urban expansion on seasonal surface urban heat island intensity using neural network algorithms. Energy Build. 2022, 275, 112452. [Google Scholar] [CrossRef]
  120. Zheng, C.; Jia, L.; Hu, G. Global land surface evapotranspiration monitoring by ETMonitor model driven by multi-source satellite earth observations. J. Hydrol. 2022, 613, 128444. [Google Scholar] [CrossRef]
  121. Chen, F.; Tang, L.; Wang, C.; Qiu, Q. Recovering of the thermal band of Landsat 7 SLC-off ETM+ image using CBERS as auxiliary data. Adv. Space Res. 2011, 48, 1086–1093. [Google Scholar] [CrossRef]
  122. Magidi, J.; Ahmed, F. Spatio-temporal variations of land surface temperature using Landsat and MODIS: Case study of the City of Tshwane, South Africa. S. Afr. J. Geomat. 2020, 9, 379–396. [Google Scholar] [CrossRef]
  123. Frey, C.; Kuenzer, C. Analysing a 13 Years MODIS Land Surface Temperature Time Series in the Mekong Basin. In Remote Sensing Time Series: Revealing Land Surface Dynamics; Kuenzer, C., Dech, S., Wagner, W., Eds.; Springer: Cham, Switzerland, 2015; Volume 22, 119p. [Google Scholar]
  124. Coulter, L.; Stow, D.; Tsai, Y.; Ibanez, N.; Shih, H.; Kerr, A.; Benza, M.; Weeks, J.; Mensah, F. Classification and assessment of land cover and land use change in southern Ghana using dense stacks of Landsat 7 ETM + imagery. Remote Sens. Environ. 2016, 184, 396–409. [Google Scholar] [CrossRef]
  125. Kafy, A.-A.; Faisal, A.A.; Rahman, M.S.; Islam, M.; Al Rakib, A.; Islam, M.A.; Khan, M.H.H.; Sikdar, M.S.; Sarker, M.H.S.; Mawa, J.; et al. Prediction of seasonal urban thermal field variance index using machine learning algorithms in Cumilla, Bangladesh. Sustain. Cities Soc. 2021, 64, 102542. [Google Scholar] [CrossRef]
  126. Nguyen, B.; Tran, T.; Grodzka-Lukaszewska, M.; Sinicyn, G.; Lakshmi, V. Assessment of Urbanization-Induced Land-Use Change and Its Impact on Temperature, Evaporation, and Humidity in Central Vietnam. Water 2022, 14, 3367. [Google Scholar] [CrossRef]
  127. Koko, A.; Yue, W.; Abubakar, G.; Alabsi, A.; Hamed, R. Spatiotemporal Influence of Land Use/Land Cover Change Dynamics on Surface Urban Heat Island: A Case Study of Abuja Metropolis, Nigeria. ISPRS Int. J. Geo-Inf. 2021, 10, 272. [Google Scholar] [CrossRef]
  128. Zhang, J.; Jia, L.; Menenti, M.; Hu, G. Glacier Facies Mapping Using a Machine-Learning Algorithm: The Parlung Zangbo Basin Case Study. Remote Sens. 2019, 11, 452. [Google Scholar] [CrossRef]
  129. Gavade, A.B.; Gavade, P.A. Explainable AI in Transforming Land Use Land Cover Classification. In Mitigation and Adaptation Strategies Against Climate Change in Natural Systems; Srivastava, R.K., Chakraborty, A., Eds.; Springer Nature: Cham, Switzerland, 2025; pp. 343–356. [Google Scholar] [CrossRef]
  130. Gasirabo, A.; Xi, C.; Hamad, B.R.; Edovia, U.D. A CA–Markov-Based Simulation and Prediction of LULC Changes over the Nyabarongo River Basin, Rwanda. Land 2023, 12, 1788. [Google Scholar] [CrossRef]
  131. Balha, A.; Vishwakarma, B.; Pandey, S.; Singh, C. Predicting impact of urbanization on water resources in megacity Delhi. Remote Sens. Appl.-Soc. Environ. 2020, 20, 100361. [Google Scholar] [CrossRef]
  132. Tao, H.; Hashim, B.; Heddam, S.; Goliatt, L.; Tan, M.; Sa’adi, Z.; Ahmadianfar, I.; Falah, M.; Halder, B.; Yaseen, Z. Megacities’ environmental assessment for Iraq region using satellite image and geo-spatial tools. Environ. Sci. Pollut. Res. 2023, 30, 30984–31034. [Google Scholar] [CrossRef]
  133. Ahmed, S. Assessment of urban heat islands and impact of climate change on socioeconomic over Suez Governorate using remote sensing and GIS techniques. Egypt. J. Remote Sens. Space Sci. 2018, 21, 15–25. [Google Scholar] [CrossRef]
  134. Choudhury, U.; Singh, S.; Kumar, A.; Meraj, G.; Kumar, P.; Kanga, S. Assessing Land Use/Land Cover Changes and Urban Heat Island Intensification: A Case Study of Kamrup Metropolitan District, Northeast India (2000–2032). Earth 2023, 4, 503–521. [Google Scholar] [CrossRef]
  135. Kafy, A.-A.; Rahman, M.S.; Faisal, A.-A.-; Hasan, M.M.; Islam, M. Modelling future land use land cover changes and their impacts on land surface temperatures in Rajshahi, Bangladesh. Remote Sens. Appl. Soc. Environ. 2020, 18, 100314. [Google Scholar] [CrossRef]
  136. Faisal, A.-A.; Kafy, A.-A.; Al Rakib, A.; Akter, K.S.; Jahir, D.M.A.; Sikdar, M.S.; Ashrafi, T.J.; Mallik, S.; Rahman, M.M. Assessing and predicting land use/land cover, land surface temperature and urban thermal field variance index using Landsat imagery for Dhaka Metropolitan area. Environ. Chall. 2021, 4, 100192. [Google Scholar] [CrossRef]
  137. Ge, Q.; Hao, M.; Ding, F.; Jiang, D.; Scheffran, J.; Helman, D.; Ide, T. Modelling armed conflict risk under climate change with machine learning and time-series data. Nat. Commun. 2022, 13, 2839. [Google Scholar] [CrossRef] [PubMed]
  138. Komeh, Z.; Hamzeh, S.; Memarian, H.; Attarchi, S.; Alavipanah, S.K. A Remote Sensing Approach to Spatiotemporal Analysis of Land Surface Temperature in Response to Land Use/Land Cover Change via Cloud Base and Machine Learning Methods, Case Study: Sari Metropolis, Iran. Int. J. Environ. Res. 2025, 19, 98. [Google Scholar] [CrossRef]
  139. Ahmed, B.; Kamruzzaman, M.; Zhu, X.; Rahman, M.; Choi, K. Simulating Land Cover Changes and Their Impacts on Land Surface Temperature in Dhaka, Bangladesh. Remote Sens. 2013, 5, 5969–5998. [Google Scholar] [CrossRef]
  140. Wang, A.; Zhang, M.; Abdulla-Al Kafy; Tong, B.; Hao, D.; Feng, Y. Predicting the impacts of urban land change on LST and carbon storage using InVEST, CA-ANN and WOA-LSTM models in Guangzhou, China. Earth Sci. Inform. 2022, 16, 437–454. [Google Scholar] [CrossRef]
  141. Ahmad, M.; Shao, Z.; Yaseen, A.; Khalid, M.; Javed, A. The Simulation and Prediction of Land Surface Temperature Based on SCP and CA-ANN Models Using Remote Sensing Data: A Case Study of Lahore. Photogramm. Eng. Remote Sens. 2022, 88, 783–790. [Google Scholar] [CrossRef]
  142. Sumangala, N.; Kini, S. A Systematic Review of Machine Learning Applications in Land Use Land Cover Change Detection using Remote Sensing. Int. J. Appl. Eng. Manag. Lett. 2022, 6, 327–350. [Google Scholar] [CrossRef]
  143. Bhungeni, O.; Ramjatan, A.; Gebreslasie, M. Evaluating Machine-Learning Algorithms for Mapping LULC of the uMngeni Catchment Area, KwaZulu-Natal. Remote Sens. 2024, 16, 2219. [Google Scholar] [CrossRef]
  144. Ashwini, K.; Sil, B.S.; Kafy, A.A.; Altuwaijri, H.A.; Nath, H.; Rahaman, Z.A. Harnessing Machine Learning Algorithms to Model the Association between Land Use/Land Cover Change and Heatwave Dynamics for Enhanced Environmental Management. Land 2024, 13, 1273. [Google Scholar] [CrossRef]
Figure 1. PRISMA 2020 flow diagram for the systematic review of the impact of LULC change on LST using ML techniques [45]. (* Consider reporting the number of records identified from each database or register searched and ** Indicate how many records were excluded by a human and how many were excluded by automation tools).
Urbansci 09 00234 g001
Figure 2. Trend of publication percentage by year.
Urbansci 09 00234 g002
Figure 3. Regional representation of articles included in the systematic review.
Urbansci 09 00234 g003
Figure 4. Various remotely sensed data sources used in the selected studies.
Urbansci 09 00234 g004
Figure 5. Usage count and average spatial resolution (m) used in the selected studies.
Urbansci 09 00234 g005
Figure 6. Distribution of LULC classes in the selected studies.
Urbansci 09 00234 g006
Figure 7. Distribution of different types of ML techniques used in the selected publications for estimating LST.
Urbansci 09 00234 g007
Figure 8. Distribution of land cover indices in the selected studies.
Urbansci 09 00234 g008
Table 1. ML techniques used in the selected papers.
Machine Learning TechniqueApplicationReference
Multi-Layer Perceptron–Markov Chain (MLP-MC)LULC Prediction[36]
Support Vector Machine (SVM) + MOLUSCE Plugin + CALULC Prediction[32]
Support Vector Machine (SVM)LULC Prediction[38,39]
Artificial Neural Network (ANN)LULC Prediction[31,40,41,42,43,44,45]
Random Forest (RF)Both (LULC and LST)[2,44,45,46,47,50,51,52,53,54,55,56,57,58,59,60,61,62,63]
CA-MarkovBoth (LULC and LST)[50,64,65,66,67,68,69,70,71,72,73,74,75,76,77,78,79,80,81,82,83,84,85,86,87,88,89,90,91,92]
Artificial Neural Network with Cellular Automata (ANN-CA)Both (LULC and LST)[30,39,40,41,42,45,93,94,95,96,97,98,99,100,101,102,103,104,105]
Extreme Gradient Boosting (GB) RegressionLST Prediction[52,61,105,106,107,108,109,110,111,112,113,114,115,116]
Gene Expression Programming (GEP)LST Prediction[38,105]
Kernel Ridge RegressionLST Prediction[114]
Disclaimer/Publisher’s Note: The statements, opinions and data contained in all publications are solely those of the individual author(s) and contributor(s) and not of MDPI and/or the editor(s). MDPI and/or the editor(s) disclaim responsibility for any injury to people or property resulting from any ideas, methods, instructions or products referred to in the content.

