Article

Contamination, Ecotoxicological Risks, and Sources of Potentially Toxic Elements in Roadside Dust Along Lahore–Islamabad Motorway (M-2), Pakistan

1
National Centre of Excellence in Geology, University of Peshawar, Peshawar 25130, Pakistan
2
Department of Environmental Sciences, University of Peshawar, Peshawar 25120, Pakistan
3
Department of Geography, Islamia College University, Peshawar 25120, Pakistan
4
Department of Geology, University of Malakand, Chakdara 18800, Pakistan
5
Directorate of Advance Studies, University of Peshawar, Pakistan 25120, Pakistan
*
Author to whom correspondence should be addressed.
Urban Sci. 2025, 9(6), 225; https://doi.org/10.3390/urbansci9060225
Submission received: 1 May 2025 / Revised: 4 June 2025 / Accepted: 10 June 2025 / Published: 13 June 2025

Abstract

The Lahore–Islamabad Motorway (M-2) is a critical transportation corridor in Pakistan, where contamination in roadside dust by potentially toxic elements (PTEs) presents potential environmental and health concerns. This study evaluates the concentration, spatial distribution, and ecological risks of PTEs (Mn, Ni, Cr, Cu, Pb, Zn, Cd, Ag, Fe) in road dust along the M-2. PTE concentrations were determined using standard protocols and by analysis using an atomic absorption spectrometer. The findings indicate substantial variability in metal concentrations, with Fe (CV% = 9.35%) and Pb (CV% = 7.06%) displaying the highest consistency, whereas Ni exhibited the greatest fluctuation (CV% = 168.80%). Contamination factor analysis revealed low to moderate contamination for Ni and Fe, while Zn contamination was significant in 60% of samples. Cr and Cd exhibited persistently high contamination, and Pb was uniformly elevated across all locations. Ecological risk assessment categorized Ni, Zn, and Cu as low-risk elements, while Pb posed a substantial risk. Cd concentrations indicated high to extreme ecological hazards, emphasizing the necessity for urgent mitigation measures. Factor analysis suggested an interaction of various sources, including industrial, vehicular emissions, and construction materials. Strengthened pollution control strategies and systematic monitoring are essential for mitigating contamination and ensuring environmental sustainability along the motorway.

1. Introduction

Potentially toxic elements (PTEs) are elements with a specific gravity exceeding 5.0 g/cm3, and they are ubiquitous in environmental components [1]. Their presence in the environment results from natural processes such as weathering, erosion, volcanic activity, and atmospheric deposition, as well as anthropogenic sources, including fossil fuel combustion, industrial emissions, and metallurgical processes [2,3]. In recent years, a growing body of research has documented widespread contamination of soils and sediments by PTEs such as lead, cadmium, zinc, and copper. Surveys conducted across diverse environments, ranging from agricultural fields and roadside verges to riverine and coastal deposits, have repeatedly demonstrated PTE concentrations exceeding both natural background levels and established guideline values [4,5,6].
Among the significant contributors to PTE pollution is vehicular traffic, which releases contaminants through tire wear, brake lining abrasion, and road surface degradation [7,8]. Common PTEs detected in roadside dust include lead (Pb), cadmium (Cd), copper (Cu), and zinc (Zn). Pb contamination primarily originates from leaded gasoline and paint residues, while Zn, Cu, and Cd are linked to tire wear, lubrication, and mechanical components. Nickel (Ni) and chromium (Cr) are commonly associated with vehicle corrosion [9,10].
Geogenic contributions to roadside dust contamination originate from the mechanical and chemical weathering of local lithologies, encompassing the breakdown of parent rock formations and the entrainment of soil and aeolian particles. Differentiating these natural inputs from anthropogenic emissions is critical for accurate source apportionment. In Tehran, rare earth element (REE) geochemistry and chemical indices of alteration to street-deposited dust were applied to reveal a dominant derivation from intermediate–mafic igneous rocks of the Archean greenstone belt and secondary mixing with Alborz carbonate formations [11]. In Baoji, China, principal component analysis (PCA) on concentrations of eight PTEs against regional upper-crust and local soil background values suggested that As and vanadium (V) loadings clustered with parent-rock signatures accounting for 55–70% of the variance, whereas lead (Pb), zinc (Zn), and copper (Cu) exhibited mixed lithogenic–anthropogenic origins [12]. Further, a study conducted in Moscow used size-fractionation (PM1, PM1–10, PM10–50), coupled with a source apportionment model, to demonstrate that resuspension of local soil and rock contributes 34% of total PTE mass in bulk dust and up to 64% in the PM10 fraction [13]. A subsequent study further quantified that geogenic sources account for 60–70% of PTE content in coarser (PM10–50) fractions, whereas fine particles (<10 µm) bear a larger anthropogenic signature [14]. Climatic and geomorphological factors also modulate geogenic dust loads: a study from Bangladesh reported that monsoon-driven soil erosion markedly elevates geogenic Zn, Cu, Pb, Ni, Cr, Mn, and Co in street dust, producing spatial and seasonal heterogeneity in elemental distributions [15].
Recent advancements in environmental pollution studies have introduced innovative methodologies for apportioning the sources of heavy metals. Machine learning techniques, such as self-organizing maps (SOMs) and positive matrix factorization (PMF), among others, have been employed to identify and quantify pollution sources with increased accuracy and efficiency [16,17]. Geostatistical methods have also been integrated into source apportionment studies to enhance spatial resolution and identify pollution hotspots [18]. While these advanced techniques offer promising avenues for source apportionment, traditional methods such as correlation, factor, and cluster analysis remain widely used due to their simplicity and effectiveness in certain contexts.
Potentially toxic elements pose a significant environmental and public health risk due to their persistence, bioaccumulative nature, and toxicity [19,20]. Roadside dust contaminated with PTEs can affect human health through inhalation, ingestion, and dermal exposure, potentially leading to severe health complications and ecosystem disruption [21,22,23]. The assessment of PTE contamination in road dust is often conducted using ecotoxicological risk factors, including pollution indices and assessments of ecological and human health risks [24,25]. These risk assessment models provide quantitative data that aid in decision-making for environmental conservation and pollution control [20,26]. Recent studies have reported PTE contamination in roadside dust in various regions, including China [27] and Egypt [22]. Recent research in South Asia has increasingly focused on heavy metal contamination in urban dust, particularly in areas of high traffic density. Studies from Bangladesh [28] and India [29] have reported elevated levels of Pb, Zn, and Cd in street dust, linking them to vehicular and industrial sources. In Pakistan, limited but emerging work has identified similar patterns, with research reporting significant PTE concentrations in roadside dust from Abbottabad [30]. These studies highlight the need for further investigation along major transportation corridors.
However, limited research has been conducted on the extent of PTE contamination and associated risks along major transportation routes in Pakistan. The Lahore–Islamabad Motorway (M-2) is one of the country’s busiest highways, serving as a vital transportation corridor. Despite its significance, no comprehensive study has been conducted to evaluate the contamination levels and potential risks of PTEs in roadside dust along the M-2.
This study aimed to assess PTE contamination, potential risks, and spatial distribution in roadside dust along the M-2 motorway by determining the concentration of PTEs, evaluating pollution quantification factors, and analyzing ecological and human health risks. The study was guided by the following implicit questions: (1) what are the concentrations of PTEs in roadside dust along the M-2 motorway? (2) What is the level of ecological and human health risk associated with these contaminants? (3) How are these risks spatially distributed? The novelty of this research lies in its first-time assessment of PTE contamination along this major route, integrating pollution indices and risk evaluations with spatial distribution mapping. The significance of this study extends beyond environmental assessment, as its findings will aid in the development of mitigation strategies, inform policymakers, and contribute to public health risk management. By providing a comprehensive dataset on PTE pollution along the M-2, this research will help bridge the knowledge gap in Pakistan’s roadside contamination studies and support future regulatory interventions.

2. Materials and Methods

2.1. Study Area

The Lahore–Islamabad Motorway (M-2) serves as a critical transportation corridor in Pakistan linking two major urban centers, Lahore and Islamabad. Spanning approximately 375 km, this six-lane controlled-access highway traverses diverse geographical landscapes, including agricultural fields, industrial zones, and urban peripheries (Figure 1). Given its high traffic volume and extensive vehicular activity, the M-2 significantly contributes to environmental pollution, particularly PTE deposition from vehicular emissions, tire wear, and road dust accumulation. The motorway’s strategic importance and role in regional connectivity make it a suitable study area for assessing pollution levels and their potential ecological and human health impacts. Additionally, the surrounding land use patterns, which include residential settlements, farmlands, and industrial sites, further emphasize the necessity of evaluating contamination levels along this route. Along this route, the geology shifts from the fluvio-lacustrine deposits of the Murree Formation—interbedded purple-grey to greenish-grey sandstones, shales, and intraformational conglomerates—through the Lockhart Limestone and Patala Formation carbonates of the Paleocene to Eocene age in the Potwar foothills [31]. Transitioning northward, the motorway cuts across the Salt Range, where thick evaporitic sequences of the Precambrian Salt Range Formation, hosting extensive halite diapirs and red siliciclastic marls, form prominent escarpments and serve as basal décollement zones facilitating Himalayan thrust sheet propagation [32]. In the southern extents near the Lahore plains, the motorway overlies Quaternary alluvial fan and fluvial deposits, i.e., unconsolidated silts, sands, and gravels [33,34].

2.2. Sample Collection

Sampling locations were selected based on land-use characteristics, including high-traffic zones, industrial areas, residential districts, and mixed-use regions, to capture a comprehensive representation of potential contamination sources. The sampling density was designed to ensure adequate spatial resolution along the entire stretch of the M-2 Motorway, with 30 sampling points positioned in a manner to reflect variations in land use and environmental exposure [35,36] At each site, a composite sampling approach was employed, wherein road dust was collected from multiple points within a 1 m2 area using a clean nylon brush and a plastic dustpan. A minimum of 500 g of road dust was obtained per location to ensure a sufficient quantity for analysis [37,38]
To minimize cross-contamination, collected samples were immediately transferred into airtight, pre-labeled polyethylene bags. Each label included essential details such as sample ID and GPS coordinates. The samples were then transported to the laboratory in insulated containers to prevent exposure to external contaminants. Upon arrival, they were air-dried (45 °C) for two weeks [39]. The dried samples were subsequently sieved through a 200-size stainless-steel mesh to eliminate large particles and organic debris. The sieved samples were then dried at 105–110 °C to remove moisture.

2.3. Sample Preparation and Analysis

The digestion method employed in this study was selected to ensure comprehensive dissolution of a wide range of potentially toxic elements (PTEs) commonly bound to both organic matter and mineral matrices in road dust. The tri-acid digestion approaches are widely recognized for their ability to extract total metal concentrations from complex environmental matrices [40]. An accurately weighed 1.00 ± 0.01 g aliquot of sieved road dust was transferred into a clean 100 mL PTFE digestion vessel. To initiate digestion, 10 mL of concentrated nitric acid (HNO3, 69%) was added, and the mixture was left to stand at room temperature for 30 min. The vessel was then placed on a hot plate and heated gently at 95 °C for 1 h. Following this, 5 mL of concentrated hydrochloric acid (HCl, 37%) was introduced to enhance the dissolution of carbonate and exchangeable metal fractions. The mixture was further heated for 30 min.
Subsequently, 3 mL of hydrofluoric acid (HF, 48%) was cautiously added to facilitate the decomposition of silicate-bound metals. The sample was heated at 120–130 °C for an additional 60 min, taking care to avoid complete dryness. After cooling to room temperature, the residue was reconstituted with 10 mL of 1:1 HCl and transferred quantitatively to a 50 mL acid-washed volumetric flask. The solution was brought to volume with deionized water and passed through a 0.45 µm PTFE membrane filter to remove any insoluble particulates. The resulting solution was stored in acid-washed polypropylene bottles until PTE analysis was performed using an atomic absorption spectrometer. All reagents used were of analytical grade, and deionized water was used for all dilutions.

2.4. Quality Assurance and Control

All glassware and PTFE digestion vessels were acid-washed in 10% HNO3 and thoroughly rinsed with deionized water prior to use to minimize contamination. Procedural blanks and duplicate samples were analyzed to ensure accuracy and precision. Instrument calibration was performed using standard solutions prepared from high-purity single-element stock solutions (≥99.9%). All sample measurements were conducted in triplicate, with relative standard deviations (RSDs) maintained below 10% to ensure reproducibility. Contamination control, blank corrections, and spike recovery tests were implemented throughout the analytical process to uphold data quality and integrity. Recovery rates fell within the acceptable range of 85–110%, indicating the suitability of the analytical procedures for quantifying PTEs. The limits of detection (LODs) for the analyzed potentially toxic elements (PTEs) using atomic absorption spectrophotometry were as follows: Ni (0.01 mg/kg), Fe (0.05 mg/kg), Zn (0.005 mg/kg), Cu (0.005 mg/kg), Pb (0.01 mg/kg), Cr (0.01 mg/kg), Mn (0.005 mg/kg), and Cd (0.001 mg/kg).

2.5. Environmental and Ecological Risks

The contamination factor (Cf) was used for the evaluation of environmental risks. Cf can be estimated using Equation (1) [37]:
Cf = Ca/Cb
In the abovementioned equation, Ca is the concentration of the PTE road dust mg/kg, and Cb is the average shale values in mg/kg for each PTE adopted as background values in this study [40].
Further to envisage the cumulative effects of PTE concentration on environmental health, the pollution load index (PLI) was calculated for each sample. The PLI can be calculated using Equation (2) [41]:
P L I = C f 1 × C f 2 × × C f n 1 / n
In Equation (2), Cf is the contamination factor estimated earlier for each element.
Moreover, the geoaccumulation index (Igeo) is a useful tool to provide insights regarding the contamination caused by a PTE. It can be used to compare the levels with pre-industrial times. The Igeo was estimated using Equation (3) [42]:
I g e o = l o g 2 C a 1.5 B a
where Ca is the concentration of an element in the sample, Ba is the background of the particular element, and 1.5 is the background correction factor.
In order to assess the ecological risks posed by the PTEs in roadside dust, the potential ecological risk index was adopted [42]. The PERI index is calculated in two steps: in the first step, the risk index (RI) is calculated for each PTE. The RI is a useful indicator of the sensitivity of biological components to a particular PTE, while the potential ecological risk index (PERI) presents the cumulative effect of all elements on ecotoxicity. The equations used for the calculations of the indices are provided in Equations (4) and (5) [43]:
R I = C F h × T r h
P E R I = h = 1 n R I
where CFh and T r h represent the contamination factor and toxicity response factor of each element h. The toxicity response factor for each PTE was adopted from a previous study [44].

2.6. Human Health Risks

PTE may pose health risks to humans through multiple routes. In this study, the potential health risks posed by PTE concentrations in roadside dust to adults and children were investigated by assessing three exposure routes, i.e., ingestion, inhalation, and dermal contact. The estimations were performed by adopting a widely used methodology developed by USEPA [43,45].
The method involves the estimation of chronic daily intake for each PTE in mg/kg/d:
C D I i n g = C × i n g R × E F × E D B W × A T × 10 6
C D I i n h = C × I n h R × E F × E D P E F × B W × A T
C D I d e r m a l = C × S L × S A × A B S × E F × E D B W × A T × 10 6
where C represents the concentration of PTEs in roadside dust samples. InhR and IngR denote the inhalation and ingestion rates, respectively, EF refers to the exposure frequency (days per year), and ED signifies the duration of exposure (years). CR corresponds to the contact or adsorption rate, BW represents the body weight of the exposed individual (kg), and PEF is the particle emission factor (m3/kg). The details of the metrics and explanations of the methods are provided in [20,25]. Further, the hazard quotient (HQ) and hazard index were calculated as follows [41]:
H Q = C D I n i t h R f D n i t h
H I = i n H Q i n g R + i n H Q i n h R + i n H Q d e r m a l
In the above-mentioned equations, HQ is the hazard quotient estimated for each PTE via a specific exposure route. CDI is the chronic daily intake for the ith PTE via the nth exposure route, and RfD is the reference dose of the PTE via the nth route. HI is the hazard index, which signifies the combined effect of exposure to all routes on human health. HQ and HI, if >1, would suggest a significant health hazard to individuals in the study area [25].

2.7. Statistical and Spatial Analysis

All multivariate and correlation analyses were conducted in SPSS v.24 (IBM Corp., Armonk, NY, USA). In other cases, such as the creation of a corplot, relevant packages in the R programme 4.2.1 were used. Before analysis, PTE concentrations were tested for normality using the Shapiro–Wilk test; non-normal variables were log-transformed where appropriate. Spearman’s rank correlation coefficients were calculated to assess monotonic relationships among all pairs of PTEs in the road dust samples. To identify potential contamination sources, we performed exploratory factor analysis (EFA) using the principal component extraction method. Factors with eigenvalues >1.0 were retained, and factor loadings were rotated using the varimax method to maximize interpretability. PTEs with absolute loadings ≥0.50 on a given factor were considered characteristic of that source. Prior to EFA, the Kaiser–Meyer–Olkin measure of sampling adequacy (MSA = 0.57) was calculated, and Bartlett’s test of sphericity (112.4, p < 0.001) indicated sufficient inter-item correlations for factor analysis. Communalities for most PTE variables exceeded 0.50, indicating that a substantial proportion of variance was captured by the extracted components. Spatial and chemical similarity among sampling sites was explored via agglomerative hierarchical clustering. Squared Euclidean distance was used as the proximity measure, with Ward’s linkage method to minimize within-cluster variance. The optimal number of clusters was determined by using the majority rule by employing the NbClust package in R (version 4.2.1). ArcGIS 10.5 and QGIS 3.40.1 were used to map the geographic distribution of the PTE and indexical measures using a continuous graduated color symbology for concentrations.

3. Results

3.1. General Description

The summary statistics for PTE analyzed in this study are presented in Table 1. The raw data of the analysis are provided in Table S1 (Supplementary Materials). The spatial distribution of PTE concentrations is shown in Figure 2. Ni exhibited substantial variability, ranging from 1.4 to 263 mg/kg (41.49 ± 70.04 mg/kg, CV% = 168.80%), while Fe showed more consistency, with concentrations between 33,600 and 68,800 mg/kg (62,646.67 ± 5854.84 mg/kg, CV% = 9.35%). Zn and Cu displayed moderate to high variability, with Zn ranging from 203 to 402 mg/kg (295.06 ± 45.38 mg/kg, CV% = 15.38%) and Cu spanning 28 to 180 mg/kg (72.61 ± 34.34 mg/kg, CV% = 47.30%). Pb and Cr exhibited relatively stable concentrations, with Pb ranging from 227 to 289 mg/kg (255.48 ± 18.03 mg/kg, CV% = 7.06%) and Cr from 137 to 415.6 mg/kg (301.02 ± 59.25 mg/kg, CV% = 19.68%). Mn and Cd showed moderate variability, with Mn concentrations between 1199 and 2765.5 (mean = 1826.42 ± 373.83 mg/kg, CV% = 20.47%) and Cd ranging from 5 to 12 (mean = 8.26 ± 2.05 mg/kg, CV% = 24.80%). Overall, most PTEs demonstrated significant variability, with higher CV% values likely influenced by localized environmental conditions.

3.2. Contamination and Geoaccumulation

The contamination factor (Cf) results, summarized in Table 2, indicate considerable variability across different metals. Ni exhibited a wide range of values, with the majority of samples falling below the contamination threshold, except for a few that displayed moderate contamination (S29) and others showing considerable contamination (S14, S24, S28). Fe remained relatively stable, with most samples classified within the moderate contamination category, aside from a single instance of lower contamination (S9). Zn and Cu demonstrated broader distributions, with Zn exhibiting predominantly considerable contamination in 60% of samples and moderate levels in 40%, while Cu showed moderate contamination in most cases (74%), with a smaller proportion classified as either low (16%) or considerable (10%). Pb consistently displayed elevated contamination levels across all samples, maintaining values significantly above the contamination threshold. Cr and Mn exhibited distinct contamination patterns, with Cr showing a tendency toward considerable contamination in most cases (84%), whereas Mn was largely categorized within the moderate range, with only one sample suggesting a higher contamination level. In contrast, Cd consistently recorded the highest contamination levels among all elements, indicating a severe and widespread impact across all samples.
The geoaccumulation index (Igeo) results, as shown in Table 3, provide further insight into contamination intensity relative to baseline levels. Ni demonstrated substantial variability, with only a few samples exhibiting moderate contamination (S14, S24, S28), while the majority remained at lower contamination levels. Fe presented a narrow range, indicating persistently low contamination with minimal fluctuation. Zn and Cu followed distinct trends, with Zn predominantly falling within the moderate contamination category (60%) and low contamination (40%), whereas Cu was largely characterized by low contamination, apart from a few samples (S2, S22, S27) displaying moderate contamination. Pb exhibited consistently strong contamination across most samples, with the majority (77%) classified within the high-contamination category and a smaller proportion (23%) falling into the moderate range. Cr reflected moderate contamination in the vast majority of cases (84%), while Mn remained predominantly low (98%), with only a minimal number of samples indicating moderate contamination. Cd, on the other hand, displayed persistently strong contamination across all samples, reinforcing its role as a primary contributor to overall pollution levels. These findings highlight the variability in contamination patterns among metals, with certain elements exhibiting more widespread and severe contamination, while others demonstrate localized or lower levels of accumulation.

3.3. Pollution Load and Ecological Risks

The pollution load index (PLI) serves as a composite measure reflecting the cumulative impact of PTE on pollution levels. As depicted in Figure 3a, the PLI values in this study ranged from 1.95 to 3.98 (2.87 ± 0.48), exhibiting minimal variation across the study area. Based on these values, 33% of samples fell into the highly contaminated category (3 < PLI < 4), while only one sample (S8) indicated mild pollution, with PLI falling between 1 and 2. A major proportion of samples (66%) were classified as moderately polluted, reflecting the composite PTE loads.
Table A1 (Appendix A) presents the ecological risk (RI) assessment results for each PTE. RI values for Ni, Zn, and Cu ranged from 0.10 to 19.34 (3.16 ± 5.15), 2.14 to 4.23 (3.14 ± 0.48), and 3.11 to 20.03 (7.78 ± 3.82), respectively, exhibiting considerable variability. However, all samples for these elements remained within the low-risk category. Pb ranged from 56.75 to 72.23 (mean = 64.30 ± 4.51), indicating moderate risk throughout. Cr and Mn showed values of 3.04–9.24 (mean = 6.92 ± 1.32) and 1.41–3.25 (mean = 2.15 ± 0.44), respectively. All samples in the case of Cr and Mn did not pose any ecological risks. In contrast, Cd exhibited values between 500 and 1175 (mean = 846.43 ± 204.86), posing high to very high risk, which may have severe implications. The potential ecological risk index (PERI) assesses the combined impact of all PTE on ecological integrity. As illustrated in Figure 3b, PERI values ranged from 587 to 1270 (933 ± 206). While only one sample (S2, 2%) fell within the considerable risk category (500 < PERI < 600), the remaining samples were classified as very high risk (PERI > 600), indicating severe ecological consequences.

3.4. Health Risk Assessment

3.4.1. Age-Wise Daily Intake of Potentially Toxic Elements

The results showed the chronic daily intake (CDI) of PTE for children and adults through oral, inhalation, and dermal exposure routes. In oral exposure (Table A2), the CDI for lead (Pb) was relatively low and stable for adults but higher in children, suggesting greater susceptibility. Mn, Ni, Cu, Cr, Zn, and Fe exhibited more variability, with children having higher levels of intake across these metals. Cu had the highest CDI for both groups, indicating significant exposure, while cadmium (Cd) consistently showed the lowest intake, reflecting minimal exposure risk for both age groups. Similarly, inhalation exposure (Table A3) showed generally low CDI values for all PTE, but children still had higher exposure than adults. The highest inhaled CDI was seen for Cu, indicating its prominence in airborne particles, while Cd remained the least absorbed metal via this route. Further, the dermal route (Table A4) followed a similar trend, with children having considerably higher CDI across all metals than adults. Cu again showed the highest intake levels, while Cd had the lowest, indicating minimal absorption through the skin. Children are more vulnerable to PTE exposure across all routes, with Cu posing the highest risk and Cd the least across both groups.

3.4.2. Age-Wise Health Hazards Posed by Potentially Toxic Elements

The hazard quotient (HQ) values for metal ingestion across both age groups are summarized in Table A5. Among adults, Pb ranged from 0.0927 to 0.118 (mean: 0.104), Mn from 0.0372 to 0.0859 (mean: 0.0567), and Ni from 0.0001 to 1.88 (mean: 0.065), with sample S24 exceeding HQ > 1 for Ni, indicating potential health risks. Cu exhibited a wide range from 0.00108 to 19.7 (mean: 0.658), with sample S26 surpassing HQ > 1. Children showed consistently higher HQ values, with Pb ranging from 0.185 to 0.236 (mean: 0.209), Mn from 0.0745 to 0.1718 (mean: 0.113), and Ni from 0.0002 to 3.76 (mean: 0.130). Notably, both S24 and S26 exceeded HQ > 1 for Ni and Cu, respectively, highlighting a greater exposure risk for children.
The hazard quotient (HQ) values for inhalation exposure varied between adults and children, as shown in Table A6. Among adults, Mn exhibited the highest HQ values, ranging from 0.0132 to 0.0305 (mean: 0.0201 ± 0.0041), while Cd had the lowest (7.88 × 10⁻⁷–1.85 × 10⁻⁶, mean: 1.30× 10⁻⁶ ± 3.23× 10⁻⁷). Children showed generally higher HQ values, with Mn again being the highest (0.0243–0.0561, mean: 0.0371 ± 0.0076), whereas Cd remained the lowest (1.45 × 10⁻⁶–3.41 × 10⁻⁶, mean: 2.40 × 10⁻⁶ ± 5.95 × 10⁻⁷). Despite these differences, all HQ values for both age groups were below 1, indicating no significant health risks from inhalation exposure to PTE.
Similarly, for dermal exposure, HQ values indicate higher risks compared to inhalation (Table A7). For adults, the highest HQ is observed for Fe (0.00588–0.012, mean: 0.011 ± 0.00102), while Cd records the lowest HQ (3.50 × 10⁻⁵–8.23 × 10⁻⁵, mean: 5.78 × 10⁻⁵ ± 1.43 × 10⁻⁵). For children, HQ values are significantly elevated, with Cu showing the highest HQ (4.34 ×10⁻⁴–7.90, mean: 0.264 ± 1.44), followed by Fe (0.495–1.01, mean: 0.923 ± 0.086). Notably, HQ values exceed 1 for Cu and Fe in children (samples S15 and S26, respectively), indicating potential health risks through dermal exposure. In contrast, Cd remains the lowest (2.95 × 10⁻³–6.93 × 10⁻³, mean: 4.87 × 10⁻³ ± 0.00121).

3.4.3. Cumulative Health Risks from Exposure Routes

The hazard index (HI) values associated with metal exposure through ingestion, inhalation, and dermal absorption exhibit notable differences between adults and children, as detailed in Table A8. For the adult population, Pb demonstrates an HI spanning approximately 0.09–0.12 (mean = 0.10) and a small degree of variability. Mn falls within a range of 0.05–0.12, (mean = 0.08). Ni presents a broader distribution, extending from 0.001 to 1.88, with an average of 0.07, though exhibiting considerable variability. Similarly, HI values for Cu ranged from 0.001 to 19.76, (mean = 0.7), and Cr ranged from 0.04 to 0.12, with a mean of 0.09. Zn values ranged from 0.01 to 0.02 (mean = 0.014). Similarly, Fe HI values spanned from 0.07 to 0.15 (mean = 0.14), while Cd levels remained within 0.007 to 0.017 (mean = 0.012).
For children, Pb demonstrates an HI spanning approximately 0.19–0.25 (mean = 0.22) with comparable fluctuations. Mn falls within a range of 0.118–0.27 (mean = 0.179), exhibiting moderate variation. Ni presents a broader distribution, extending from 0.0002 to 4.5, with an average of 0.16 and substantial variability. Similarly, HI values for Cu range from 0.002 to 47 (mean = 1.6), while Cr spans 0.09–0.29, with a mean of 0.21. Zn values fall within 0.002–0.004 (mean = 0.0029). Likewise, Fe HI values range from 0.63 to 1.2 (mean = 1.18), while Cd levels remain within 0.017 to 0.04 (mean = 0.0291).

3.4.4. Statistical Analysis

The outcomes of the Spearman rank correlation analysis, as illustrated in Figure 4, revealed several significant associations among the analyzed PTEs (Mn, Ni, Cr, Cu, Pb, Zn, Cd, Ag, Fe). A notable positive correlation was identified between Ni and Cd (rho = 0.495, p = 0.005), suggesting a strong linkage between these elements, potentially due to shared anthropogenic sources. In contrast, Cu exhibited significant negative correlations with both Ni (rho = −0.397, p = 0.030) and Fe (rho = −0.393, p = 0.032), indicating an inverse relationship that may be attributed to differing geochemical behaviors or source variations. No statistically significant correlations were observed for other metal pairs, including those involving Mn and Cr or Zn and other PTEs, suggesting that these elements may originate from distinct sources or be influenced by independent environmental factors.
Factor analysis of road dust samples identified four principal components, each representing a distinct contamination source (Table 4). The selected components, based on eigenvalues greater than 1, accounted for 66.02% of the total variance. RC1 (18.53%) exhibited a strong correlation with Cr and a moderate association with Zn, suggesting contamination linked to industrial activities, particularly metal processing. RC2 (17.74%), characterized by high loadings of Cu and Cd, likely originates from vehicular emissions and industrial processes involving these metals. RC3 (15.82%), with strong associations with Mn and Pb, points to contributions from road construction materials and metal wear from vehicles. Finally, RC4 (13.92%), showing significant correlations with Fe and Ni, indicates a source related to industrial emissions and metalworking activities.
The hierarchical agglomerative cluster analysis was conducted to classify the sampling locations based on their chemical characteristics. This approach identified four distinct clusters (Figure 5), arranged from the top to the highest level: Cluster I (CI), Cluster II (CII), Cluster III (CIII), and Cluster IV (CIV). Cluster I (CI) comprises 20% of the total samples, predominantly situated along the motorway near Lahore. Cluster II (CII) includes 26% of the samples, while Cluster III (CIII) represents the smallest grouping, accounting for only 10% of the dataset. In contrast, Cluster IV (CIV) constitutes the largest proportion, encompassing 44% of the total samples, suggesting a more extensive spatial distribution of sampling points within this category.
Moreover, the distribution of PTEs across the four clusters exhibits distinct patterns, with statistically significant variations for several elements. CIII registers the highest mean concentrations of Ni (99.983 mg/kg, F = 1.282, not significant), Cu (90.533 mg/kg, F = 0.598, not significant), and Cd (9.067 mg/kg, F = 3.484, p < 0.05, significant). Meanwhile, CII shows the greatest levels of Cr (336.456 mg/kg, F = 4.704, p < 0.001) and Pb (274.719 mg/kg, F = 8.189, p < 0.001), both of which demonstrate strong statistical significance. In contrast, CI consistently records the lowest concentrations for Ni (15.208 mg/kg), Zn (255.458 mg/kg), Pb (240.65 mg/kg), Cr (236.367 mg/kg), and Cd (6.142 mg/kg), with differences in Pb and Cr reaching statistical significance. CIV contains the highest Fe concentration (63,792.308 mg/kg, F = 2.636, p < 0.05), while Cluster III has the lowest (54,333.333 mg/kg). The Mn distribution follows a distinct trend, with CI exhibiting the highest mean value (2162.583 mg/kg) and Cluster IV the lowest (1624.346 mg/kg, F = 4.364, p < 0.01), indicating a statistically significant difference. Among the clusters, CIII tends to contain elevated levels of toxic metals such as Ni, Cu, and Cd, whereas CI generally exhibits lower concentrations, with notable statistical differences observed for Pb, Cr, Mn, Fe, and Cd.

4. Discussion

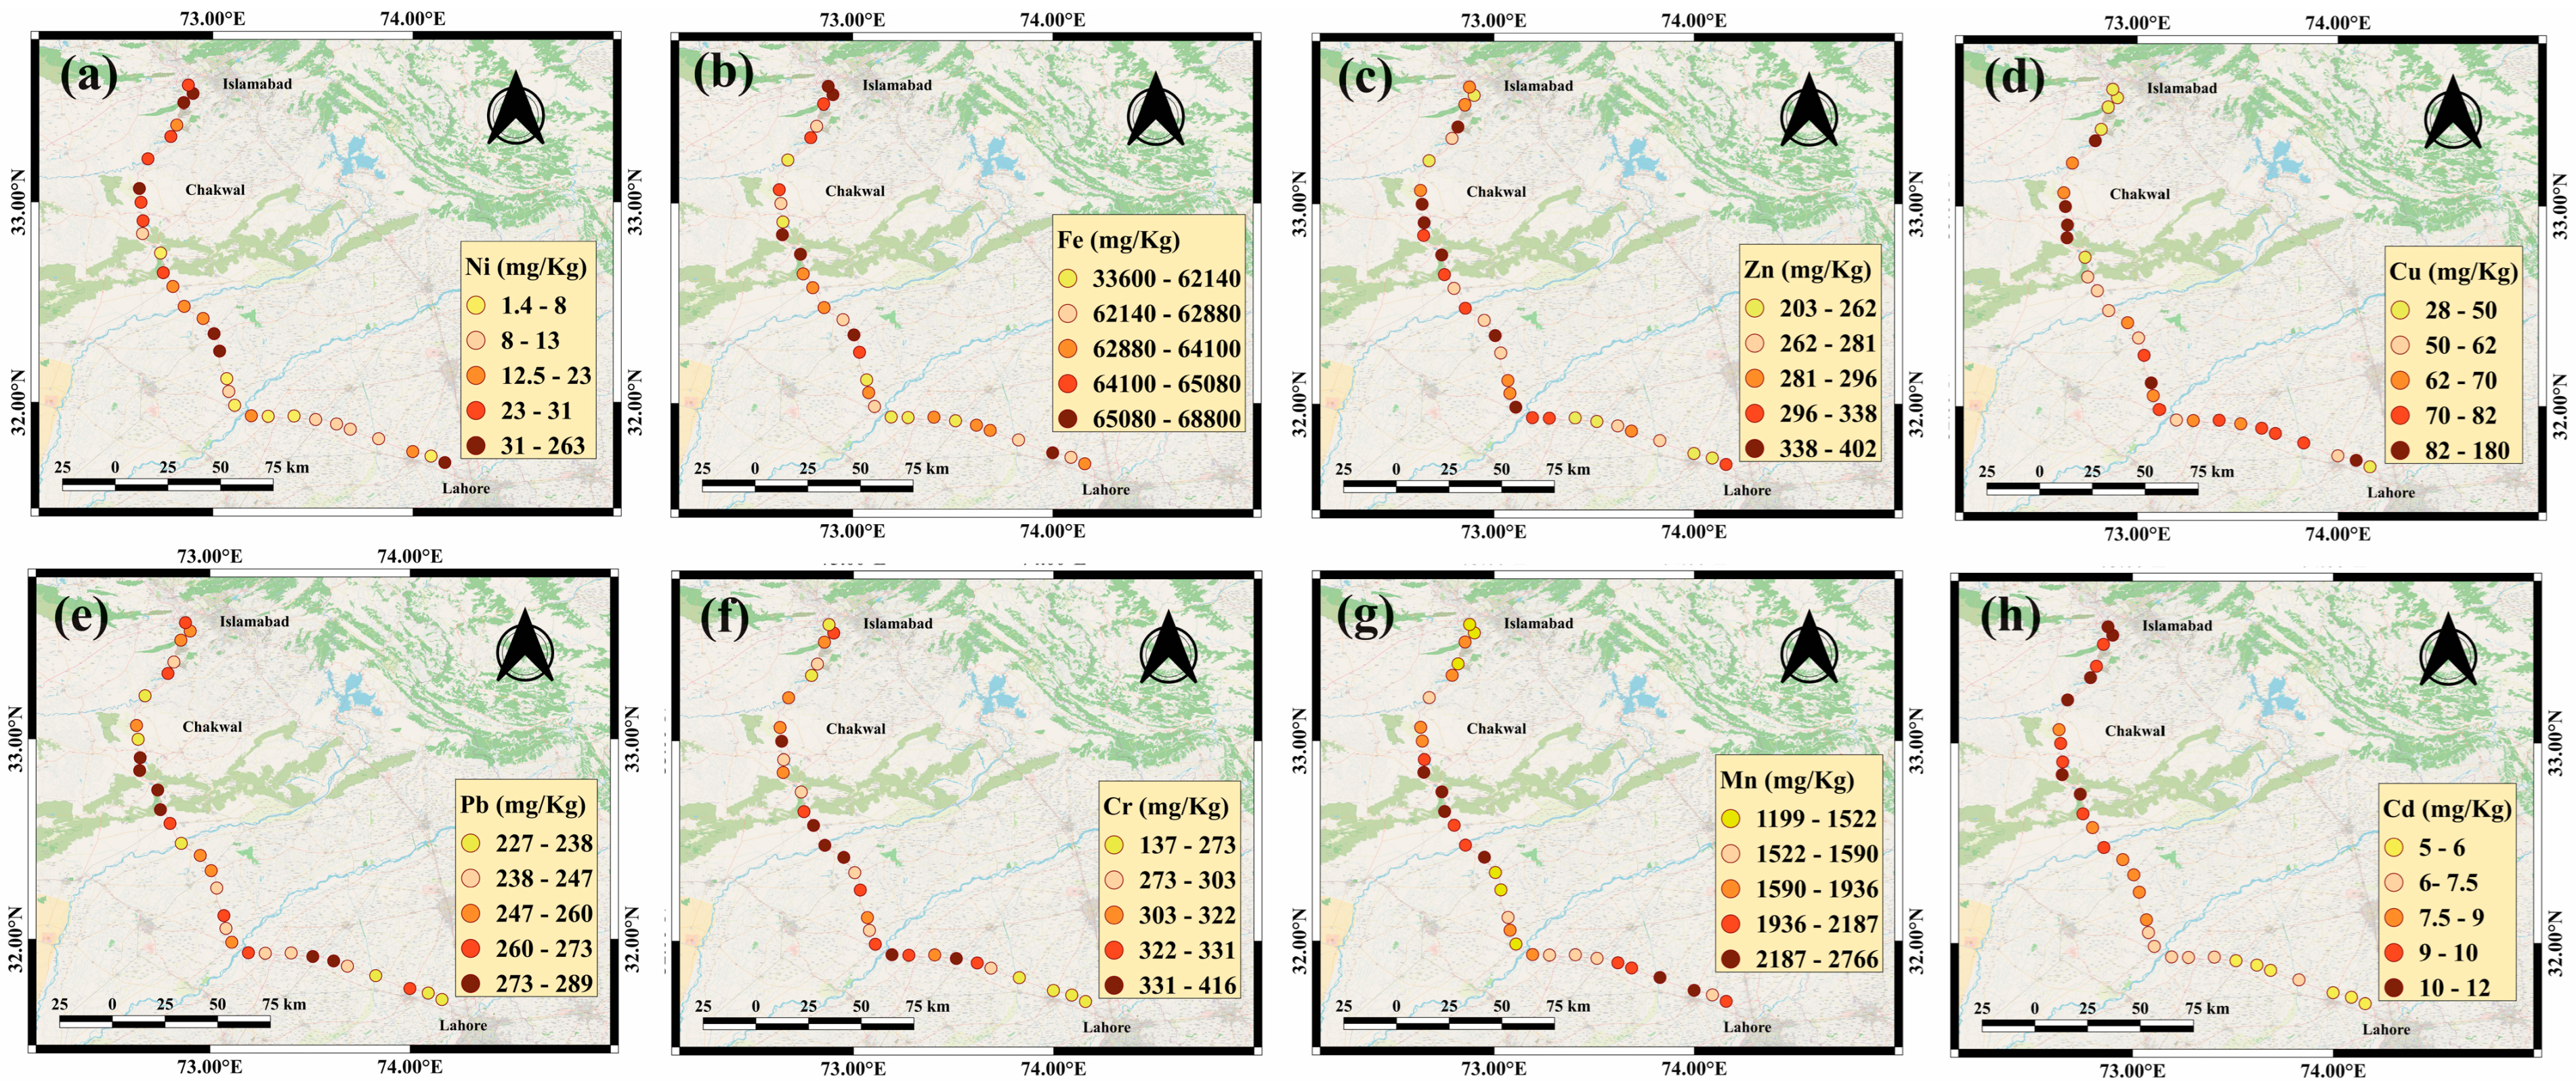
Concentrations of potentially toxic elements in road dust are influenced by both geogenic and anthropogenic sources, with traffic playing a great role in their variation. The high coefficient of variation (CV%) for Ni suggested that its presence in road dust could be attributed to anthropogenic activities. Contrarily, the relatively low variability in Fe (CV% = 9.35%) suggested its natural lithogenic origin, as Fe is a common crustal element [46]. Further, the moderate CV% values for Zn and Cr were interpreted as mixed sources, potentially from both natural and anthropogenic origins, including tire wear, metal corrosion, and industrial discharges. High CV% values for Cu and Cd imply significant anthropogenic influence, possibly from vehicle emissions, brake wear, and industrial sources. Pb, despite its known association with vehicular pollution, shows relatively low variability (CV% = 7.06%), suggesting that its concentration may be influenced by historical contamination rather than ongoing emissions, as Pb-based fuels have been phased out in many regions; however, road paints and certain vehicle parts, such as leaded wheel weights and brake pads, might legally contain Pb and contaminate road dust [47]. Chronic exposure to Pb-laden particulates presents a clear risk to neurodevelopment in children, manifesting as reduced IQ, attention deficits, and behavioral disorders even at low blood Pb levels [48,49]; ingestion and inhalation pathways are particularly concerning for young populations exposed near the road. Further, in agricultural settings, Pb deposition on croplands warrants testing of edible produce and may necessitate crop rotation advisories to prevent dietary Pb uptake [50]. The substantial variation in Mn might be associated with geogenic sources and industrial emissions given its use in manufacturing and its presence in road dust from brake wear [41,43].
Road dust samples in similar studies conducted elsewhere had substantially higher concentrations than the current study for PTEs such as Ni, Zn, and Cu, while other studies, in comparison, reported lower mean concentrations for Pb and Cr [51]. Similarly, mean concentrations reported for Ni, Cu, and Zn for Guangzhou, China, were higher than those reported here; however, for Fe, Mn, Pb, and Cd, the concentrations were lower than the current results [52]. Further comparison with studies from Delhi (India), Guilin (China), and Dhaka (Bangladesh) suggested that the mean concentration of Pb, Cr, Mn, and Ni in this study was higher than the reported values. Furthermore, Zn and Cu mean concentration was higher than in Delhi and Dhaka while lower than in Guilin [53,54,55]. Similarly, the mean concentrations of Pb, Cd, Cu, Ni, and Zn in this study were higher than those reported for a section of the M-4 motorway in Faisalabad, Pakistan. The variation in the results among different studies could be attributed to differences in traffic density, road age, levels of degradation, construction materials, etc.
The contamination factor (Cf) and geoaccumulation index (Igeo) indicate varying degrees of contamination among different PTEs. Pb and Cd stand out as the most concerning pollutants, with Pb showing very high contamination (Cf > 6 in all samples) and Cd exhibiting extremely high contamination levels across the study area. These results are consistent with findings from previous studies in urban road dust, where Pb and Cd have been reported as priority pollutants due to their persistent nature and high toxicity [56]. Zn and Cr also showed considerable contamination, with Zn exhibiting moderate to considerable contamination (Cf = 2.14–4.23) and Cr showing significant accumulation (Igeo = 0.02–1.62). These findings align with previous research highlighting Zn as a common urban pollutant often originating from tire wear and corrosion of galvanized materials [45,57]. Ni and Cu display more variable contamination patterns, with only specific locations showing significant accumulation. The presence of moderately to highly contaminated samples for these elements suggests localized sources such as industrial discharges or vehicular exhaust [58]. Fe, despite being abundant in the Earth’s crust, shows only moderate contamination, reinforcing its largely geogenic origin. The variation in Igeo and Cf values among different elements emphasizes the need for localized assessments to understand contamination patterns, as PTE pollution is highly dependent on site-specific conditions and anthropogenic activities
The pollution load index (PLI) values indicate that the majority of the samples exhibit moderate pollution (66%), with 33% classified as highly polluted. These findings are comparable to other urban studies where road dust samples frequently show moderate to high pollution levels due to cumulative effects from various sources [41,42,57,58]. The ecological risk assessment highlights Cd as the most hazardous metal, with all samples indicating very high ecological risk (RI > 500). Cd is known for its severe toxicity and persistence in the environment, making it a major ecological concern [59,60]. Pb also presents a moderate ecological risk, consistent with its historical use in gasoline and industrial applications [19,61,62] The other metals, including Ni, Zn, Cu, Cr, and Mn, exhibit low to moderate risks, suggesting that while they contribute to pollution, their ecological impact is relatively lower than Cd and Pb [63] The potential ecological risk index (PERI) classifies nearly all samples as very high risk (PERI > 600), suggesting significant environmental consequences. This aligns with findings from other urban environments where industrialization and traffic emissions contribute heavily to PTE accumulation in road dust [23,64,65].
The chronic daily intake (CDI) values indicated that children have higher exposure to PTEs across all routes (ingestion, inhalation, and dermal contact), a finding consistent with previous research indicating children’s greater vulnerability due to hand-to-mouth behavior, lower body weights, low organ development, and higher absorption rates [41,66,67,68]. The chronic daily intake (CDI) values for PTEs varied significantly across different exposure pathways. Among both children and adults, ingestion consistently accounted for the highest CDI values for the majority of metals. Specifically, Ni, Cu, and Pb exhibited elevated CDI values through ingestion, signifying substantial metal intake. This pattern was particularly evident in children, who displayed considerably higher CDI values through ingestion compared to other exposure routes.
Conversely, inhalation contributed the least to overall exposure, as its intake was lower than those recorded for both ingestion and dermal contact. The lowest CDI values were observed for elements such as Cu and Pb. In contrast, dermal absorption resulted in significant exposure, especially in children, due to Cu and Ni absorption through skin contact. Among adults, CDI values from dermal exposure remained between those of ingestion and inhalation yet remained relatively high for certain metals. Generally, the main exposure pathway for PTE exposure was ingestion, with children displaying the highest vulnerability, owing to most elements. Dermal contact also contributed notably to PTE intake, particularly for specific elements, whereas inhalation consistently posed the lowest CDI values.
The hazard quotient (HQ) values revealed that most metals remain below the risk threshold (HQ < 1) for both adults and children, except for Ni and Cu in specific samples (S24 and S26). This suggested localized health risks necessitating targeted interventions. Similar findings have been reported in previous studies where Ni and Cu exceeded safe limits in certain urban hotspots [35]. The hazard index (HI) values indicated minimal overall non-carcinogenic risks, except for Ni and Cu in select locations. This aligns with studies suggesting that while road dust exposure generally poses limited health risks, specific high-pollution areas can present significant concerns [36]. The heightened vulnerability of children emphasizes the necessity of implementing protective strategies such as minimizing contact with contaminated dust.
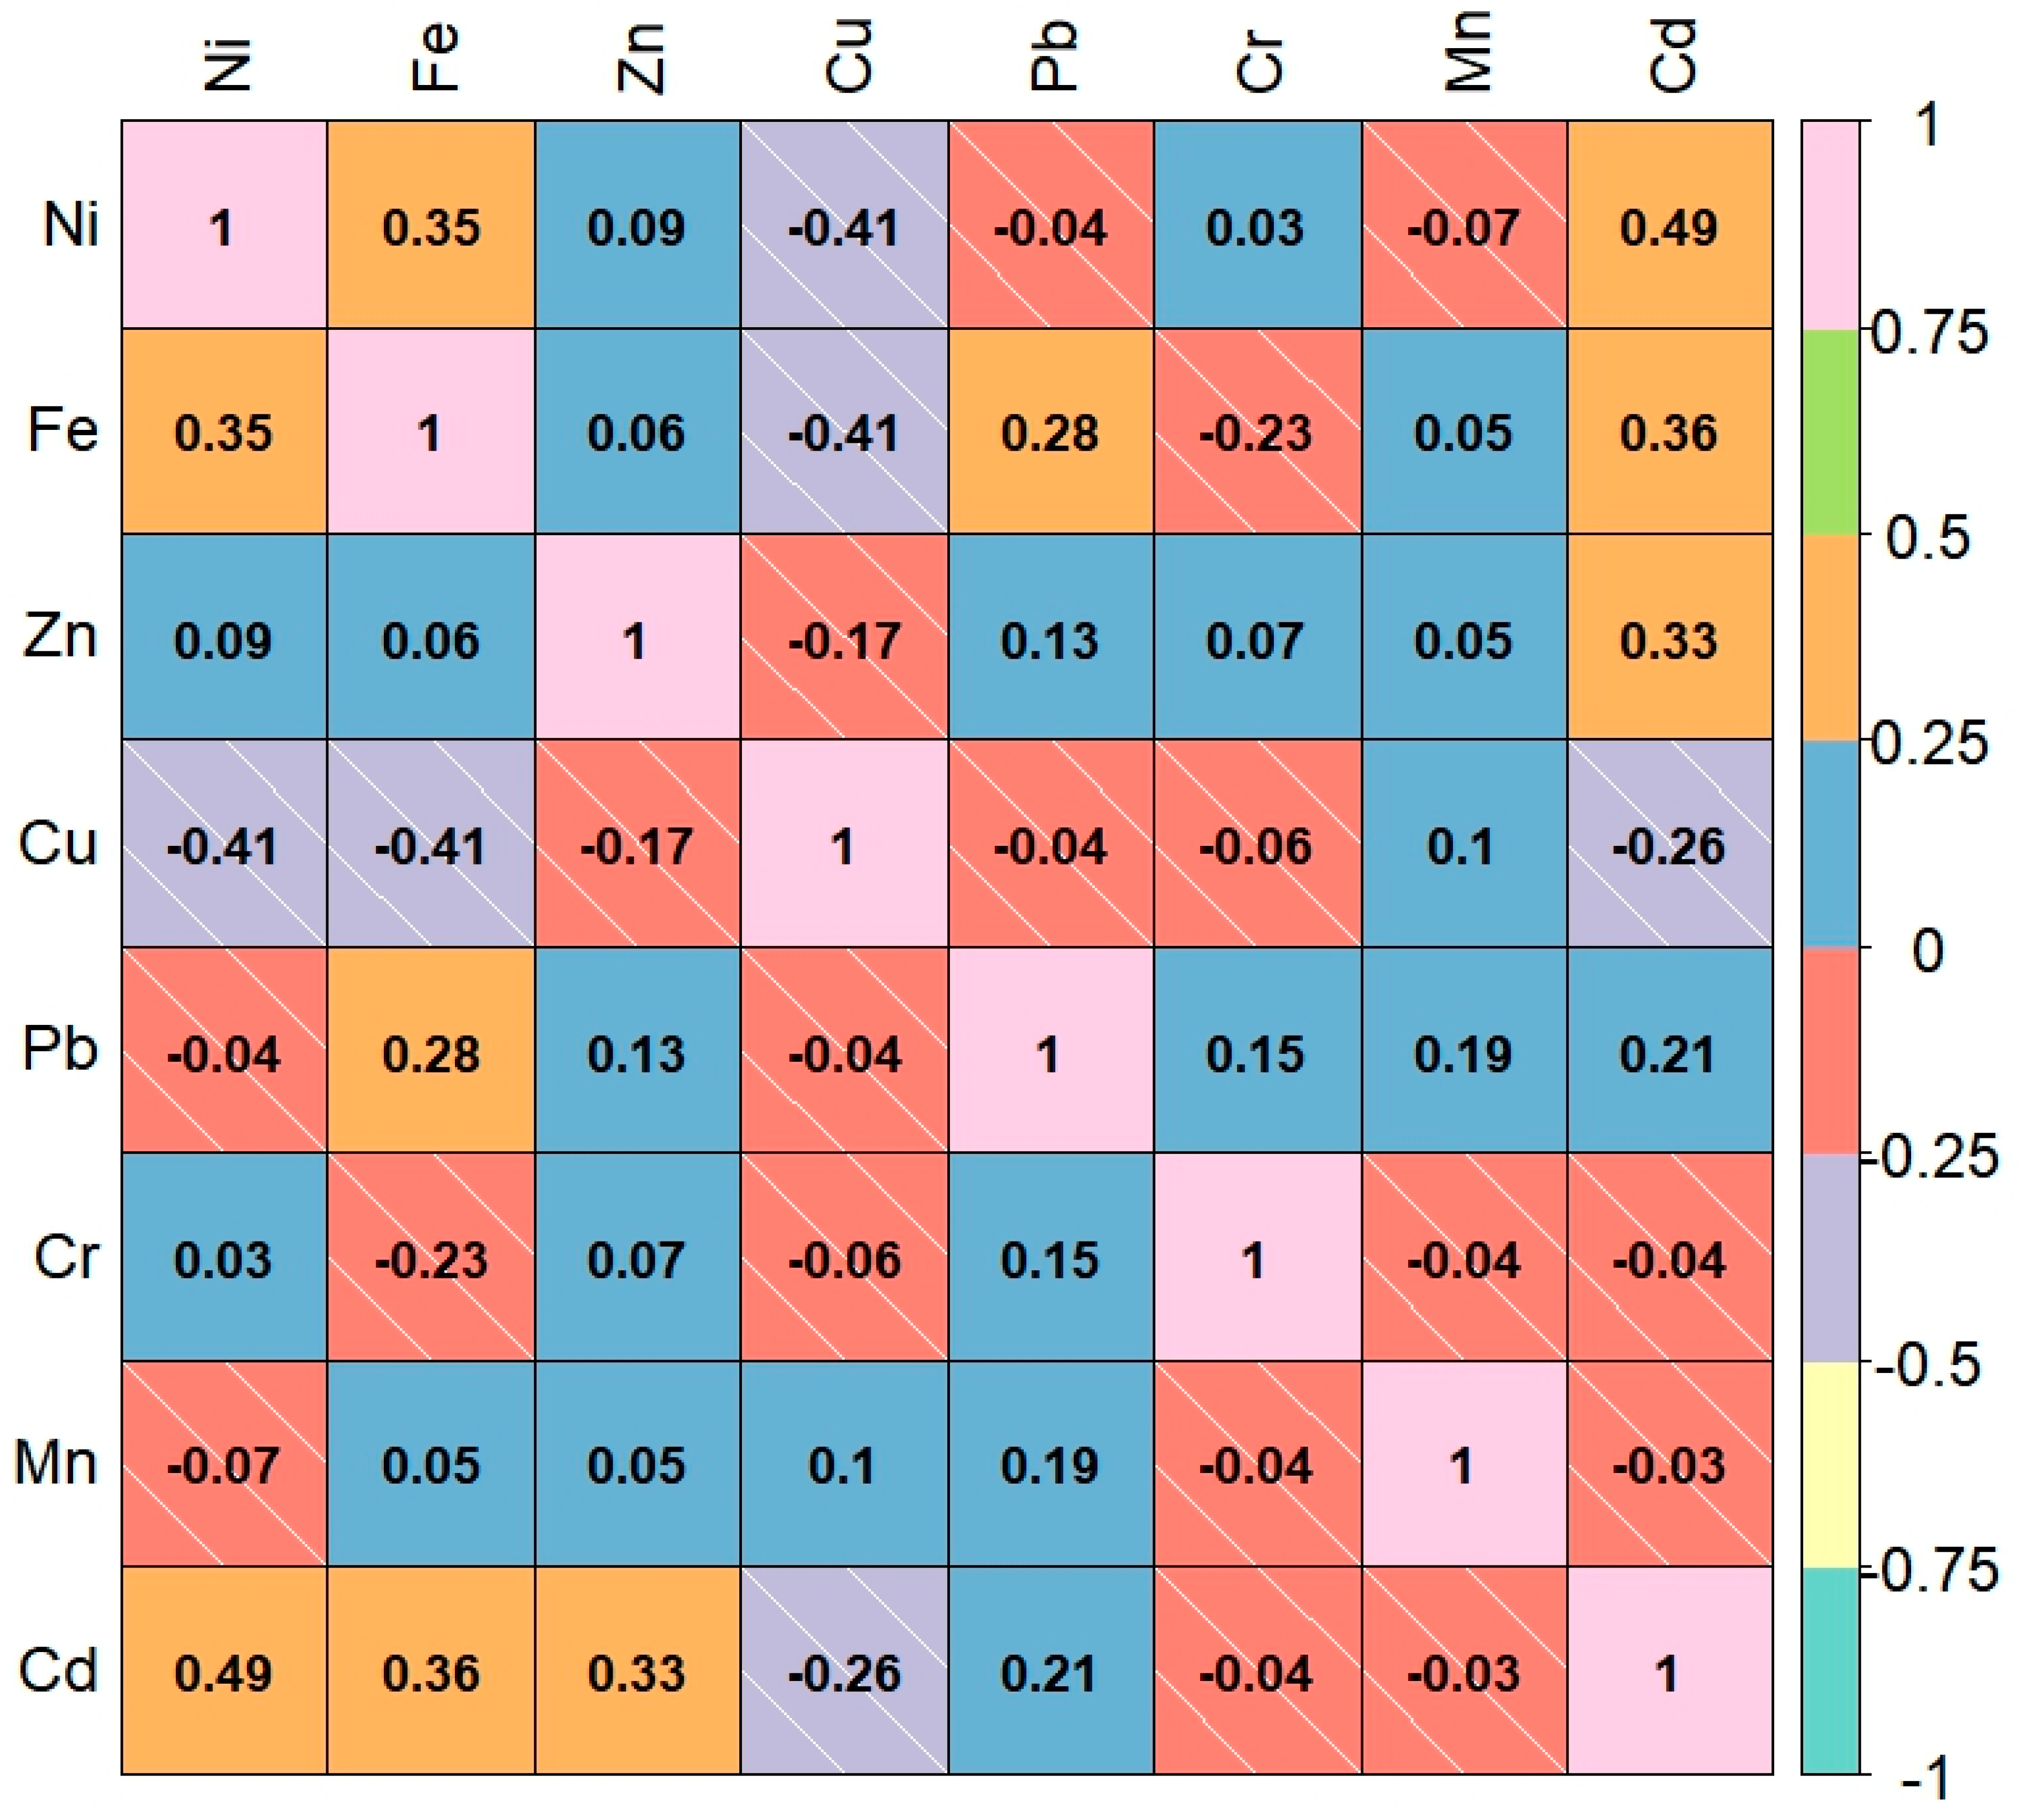
The presence of Cr and Zn in RC1 was consistent with findings from previous studies, which identified these metals as emissions originating from metal plating and steel production processes, as both metals are extensively used in galvanizing and plating operations. Especially in highway environments, guardrails, bolts, signposts, and other steel fixtures are often coated with a zinc layer to prevent corrosion. Abrasion of these coatings under traffic and weathering releases Zn into adjacent dust deposits. Cr is a byproduct of stainless-steel fabrication, electroplating baths, and surface treatments applied to vehicle undercarriages and roadside hardware [69]. The elevated loadings of Cu and Cd in RC2 further indicated traffic-related sources, as these elements have been attributed to brake pad wear and fuel combustion residues. Modern brake pads contain up to 20–30% Cu as a friction modifier; constant braking abrades these pads, liberating Cu-rich particulates that accumulate in road dust. Cd, often present at low levels in tire rubber stabilizers and as an impurity in certain lubricating oils and fuel additives, also becomes airborne through vehicle exhaust and mechanical wear [70]. The composition of RC3, characterized by high concentrations of Mn and Pb, suggested an association with road construction materials and the degradation of vehicle components described earlier and legacy contamination. Mn is incorporated into steel alloys used in reinforcing bars, guardrail posts, and welding rods; weathering of these structures may release Mn-rich particulates. Pb remains in many soils and dust layers from decades of leaded gasoline use, tire weights, and degradation of painted road markings. In addition, wear of older vehicle components (e.g., bearings, battery casings) releases both Mn and Pb. The co-occurrence of these elements, therefore, signals both new inputs from construction materials and old reservoirs of legacy Pb in the roadside environment [71]. Meanwhile, RC4, marked by strong correlations with Fe and Ni, pointed to industrial emissions and vehicular engine wear as significant contributors. Fe concentration may be amplified by steel structures (bridges, sign supports), road-building machinery, and abrasive wear of vehicle chassis and brake discs. Nickel is abundant in stainless-steel components, in certain fuel oil catalysts, and in engine-bearing alloys; frictional wear of these parts ejects ultrafine Fe–Ni particles into the air [72].
The land-use/land-cover (LULC) distribution along the motorway is shown in Figure 1b LULC class was extracted for each sample point. A one-way ANOVA (Table S2) was conducted on road dust PTE concentrations across five LULC categories (bare/sparse vegetation, built-up, cropland, permanent water bodies, shrubland) that revealed no statistically significant differences for Fe, Mn, Cd, Cr, Cu, Ni, or Pb (all F-values ≤ 1.508, p > 0.10). Only Zn exhibited a marginal effect (F = 2.484, p < 0.10), suggesting slightly higher variability between land uses for this element. The same is true for cumulative risk indices such PLI and PERI. The absence of significant F-tests for the majority of metals indicates a relatively uniform distribution of contamination levels regardless of local land-use type, supporting the premise of widespread anthropogenic inputs that overshadow LULC-specific variations. This uniformity across diverse land covers indicated the pervasive nature of PTE deposition along the motorway.
Therefore, an interaction between industrial operations, vehicular activity, and infrastructure collectively shapes the distribution of the majority of the PTE in road dust. A comprehensive understanding of these contamination pathways remains essential for developing targeted pollution mitigation strategies and minimizing environmental and public health risks. Expanding monitoring initiatives is crucial to gaining deeper insights into the spatial distribution and fluctuations in PTE concentrations across various locations. Special attention should be directed toward regions that consistently exhibit elevated contamination levels, necessitating focused remediation efforts and the enforcement of stringent regulatory frameworks. Enhancing pollution control mechanisms will aid in reducing contamination and optimizing pollution management strategies. The high-risk levels emphasize the urgent need for mitigation strategies to minimize environmental and health impacts, particularly in high-traffic areas. Establishing metal-tolerant vegetation buffer strips (green belts) from the road edge may prove effective in trapping resuspended particulates and facilitating root-zone sequestration [73,74]. Regular mechanical removal of deposited dust prevents long-term accumulation and consequent ecological exposure. Similarly, the use of chemical dust suppressants could be a useful way of preventing dust resuspension and reducing exposure [74]. Agricultural soils and crops in the vicinity of roads form an indirect route of exposure to PTEs and may pose a potential health risk [75]. In situ stabilization techniques for PTEs in exposed agricultural soils, such as the amendment of phosphate fertilizers to precipitate metals, incorporation of biochar to provide high-affinity sorption sites, and the addition of lime, may help in a substantial reduction in PTE mobility and bioavailability [73,76,77,78,79,80]. When combined with vegetative buffer strips of metal-tolerant species to intercept windblown particulates, regular mechanical removal, and chemical suppression of surface dust, these approaches may form an integrated, cost-effective strategy for long-term immobilization of a wide suite of PTEs in agricultural landscapes. Moreover, issuing public health advisories in regions with elevated PTE concentrations would offer essential guidance for minimizing potential health risks to local communities. This study provides valuable insights into the spatial patterns, ecological risks, and health implications of PTE contamination along a major transportation corridor in Pakistan. However, certain methodological limitations must be acknowledged. First, the analysis focused solely on total metal concentrations without assessing chemical speciation or bioavailability, which may overestimate the actual risk posed by the PTEs. Additionally, the use of a single-season sampling campaign may not capture temporal variability in PTE deposition. However, the findings have clear implications for environmental management and policy. In the Pakistani context, the results support the need for stronger enforcement of the Pakistan Environmental Protection Act, particularly in regulating vehicular emissions. Integrating the findings into National Environmental Quality Standards (NEQS) updates could help establish acceptable thresholds for roadside dust pollutants. At the international level, the outcomes align with the UN SDGs—particularly, Goal 3 (Good Health and Well-being), Goal 11 (Sustainable Cities and Communities), and Goal 15 (Life on Land)—and emphasize the urgency of monitoring urban pollution in developing regions. Future research should focus on assessing the chemical speciation and bioavailability of PTEs in roadside dust to better understand their environmental and human health implications.

Supplementary Materials

The following supporting information can be downloaded at: https://www.mdpi.com/article/10.3390/urbansci9060225/s1, Table S1. PTE concentration (mg/kg) for each sample in the study. Table S2. Comparison of mean concentration of PTE in different LULC zones, SD not reported for single samples falling within a zone.

Author Contributions

Conceptualization, W.A. and S.M.; methodology, W.A. and S.M.; software, I.H. and S.I.; validation, S.M., M.N., and W.A.; formal analysis, I.H.; investigation, I.H.; resources, S.M.; data curation, I.H.; writing—original draft preparation, I.H.; writing—review and editing, I.U.D.; J.K.; A.R., and S.I.; visualization, I.H.; supervision, W.A. All authors have read and agreed to the published version of the manuscript.

Funding

This research received no external funding.

Data Availability Statement

Data could be obtained from the corresponding author via a reasonable request.

Acknowledgments

The Higher Education Commission of Pakistan is greatly acknowledged for the the provision of access to the published literature.

Conflicts of Interest

The authors declare no conflicts of interest.

Abbreviations

The following abbreviations are used in this manuscript:
HQHazard quotient
HIHazard index
CDIChronic daily intake
SDStandard deviation
CfContamination factor
PERIPotential ecological risk index
CVCoefficient of variation
RCRotated components
PLIPollution load index
IgeoGeoaccumulation index

Appendix A

Results of Ecological Risks and the Human Health Risk Assessment

Table A1. Descriptive statistics of ecological risk factor (RI) for each potentially toxic element.
NiZnCuPbCrMnCdPERI
Min0.1022.133.156.753.041.41500587.05
Max19.334.2220.0372.229.233.2511751270.19
Mean3.1643.137.7764.36.922.14846.426933.87
SD5.1490.4773.814.501.310.439204.85206.97
Table A2. Chronic daily intake (mg/kg/day) for both age groups via the ingestion route.
PbMnNiCuCrZnFeCd
Adults
Min3.24 × 10−41.71 × 10−32.00 × 10−63.99 × 10−51.96 × 10−42.90 × 10−44.80 × 10−27.14 × 10−6
Max4.13 × 10−43.95 × 10−33.76 × 10−27.28 × 10−15.94 × 10−45.74 × 10−49.83 × 10−21.68 × 10⁻⁵
Mean3.65 × 10−42.61 × 10−31.30 × 10−32.44 × 10−24.30 × 10−44.22 × 10−48.95 × 10−21.18 × 10⁻⁵
SD2.57 × 10−50.0005340.0068510.132838.46 × 10−56.48 × 10−50.0083642.92 × 10−6
Children
Min6.49 × 10−43.43 × 10−34.00 × 10−67.99 × 10−53.91 × 10−45.80 × 10−49.60 × 10−21.43 × 10−5
Max8.25 × 10−47.90 × 10−37.51 × 10−21.46 × 10+001.19 × 10−31.15 × 10−31.97 × 10−13.36 × 10−5
Mean7.30 × 10−45.22 × 10−32.60 × 10−34.87 × 10−28.60 × 10−48.43 × 10−41.79 × 10−12.36 × 10⁻⁵
SD5.15 × 10−50.0010680.0137020.2656610.0001690.000130.0167285.85 × 10−6
Table A3. Chronic daily intake (mg/kg/day) for both the age groups via the inhalation route.
PbMnNiCuCrZnFeCd
Adults
Min3.58 × 10−81.89 × 10−72.21 × 10−104.40 × 10−92.16 × 10−83.2 × 10−85.29 × 10−67.88 × 10−10
Max4.55 × 10−84.36 × 10−74.14 × 10−68.03 × 10−56.55 × 10−86.33 × 10−81.08 × 10−51.85 × 10⁻⁹
Mean4.03 × 10−82.88 × 10−71.43 × 10−72.69 × 10−64.74 × 10−84.65 × 10−89.87 × 10−61.30 × 10⁻⁹
SD2.84 × 10−95.89 × 10−87.56 × 10−71.47 × 10−59.34 × 10−97.15 × 10−99.23 × 10−73.23 × 10⁻¹⁰
Children
Min6.58 × 10−83.48 × 10−74.06 × 10−108.11 × 10−93.97 × 10−85.89 × 10−89.75 × 10−61.45 × 10−9
Max8.38 × 10−88.03 × 10−77.63 × 10−60.0001481.21 × 10−71.17 × 10−72 × 10−53.41 × 10⁻⁹
Mean7.41 × 10−85.3 × 10−72.64 × 10−74.95 × 10−68.74 × 10−88.56 × 10−81.82 × 10−52.4 × 10⁻⁹
SD5.23 × 10−91.09 × 10−71.39 × 10−62.7 × 10−51.72 × 10−81.32 × 10−81.7 × 10−65.95 × 10⁻¹⁰
Table A4. Chronic daily intake (mg/kg/day) for both the age groups via the dermal route.
PbMnNiCuCrZnFeCd
Adults
Min7.95 × 10−84.2 × 10−74.9 × 10−109.78 × 10−94.79 × 10−87.11 × 10−81.18 × 10−51.75 × 10−9
Max1.01 × 10−79.68 × 10−79.21 × 10−61.78 × 10−41.45 × 10−71.41 × 10−72.41 × 10−54.11 × 10⁻⁹
Mean8.94 × 10−86.39 × 10−73.18 × 10−75.97 × 10−61.05 × 10−71.03 × 10−72.19 × 10−52.89 × 10⁻⁹
SD6.31 × 10−91.31 × 10−71.68 × 10−63.25 × 10−52.07 × 10−81.59 × 10−82.05 × 10−67.17 × 10⁻¹⁰
Children
Min6.69 × 10−63.53 × 10−54.13 × 10−88.24 × 10−74.03 × 10−65.98 × 10−69.9 × 10−41.47 × 10−7
Max8.51 × 10−68.15 × 10−57.75 × 10−41.50 × 10−21.22 × 10−51.18 × 10−52.03 × 10−33.46 × 10⁻⁷
Mean7.53 × 10−65.38 × 10−52.68 × 10−55.02 × 10−48.87 × 10−68.70 × 10−61.85 × 10−32.43 × 10⁻⁷
SD5.31 × 10−71.1 × 10−50.0001410.0027411.75 × 10−61.34 × 10−60.0001736.04 × 10−8
Table A5. HQ values of potentially toxic elements through the ingestion route.
PbMnNiCuCrZnFeCd
Adults
Min9.27 × 10−23.72 × 10−21.00 × 10−41.08 × 10−33.91 × 10−29.67 × 10−36.86 × 10−27.14 × 10−3
Max1.18 × 10−18.59 × 10−21.88 × 10+001.97 × 10+11.19 × 10−11.91 × 10−21.40 × 10−11.68 × 10−2
Mean1.04 × 10−15.67 × 10−26.50 × 10−26.58 × 10−18.60 × 10−21.41 × 10−21.28 × 10−11.18 × 10⁻²
SD0.00740.01160.34263.590.01690.00220.01190.0029
Children
Min0.18530.07450.00020.00220.07820.00190.13710.0143
Max0.23580.17183.757139.33200.23750.00380.28080.0336
Mean0.20860.11340.12991.31630.17200.00280.25570.0236
SD0.01470.02320.68517.18000.03390.00040.02390.0059
Table A6. HQ values for each potentially toxic element through the inhalation route.
PbMnNiCuCrZnFeCd
Adults
Min1.02 × 10−51.32 × 10−21.07 × 10−81.10 × 10−77.54 × 10−41.07 × 10−77.56 × 10−47.88 × 10−7
Max1.30 × 10−53.05 × 10−22.01 × 10−42.01 × 10−32.29 × 10−32.11 × 10−71.55 × 10−31.85 × 10⁻⁶
Mean1.15 × 10−52.01 × 10−26.96 × 10−66.71 × 10−51.66 × 10−31.55 × 10−71.41 × 10−31.30 × 10⁻⁶
SD8.11 × 10−70.0041193.66 × 10−50.00036620.0003262.38 × 10−80.000133.22 × 10−7
Children
Min1.88 × 10−50.0243361.97 × 10−82.02 × 10−70.0013891.96 × 10−70.00131.45 × 10−6
Max2.39 × 10−50.0561310.0003705590.0036950.0042183.88 × 10−70.00283.41 × 10−6
Mean2.11 × 10−50.0370711.28 × 10−50.0001230.0030552.85 × 10−70.00252.39 × 10−6
SD1.49 × 10−60.0075886.75 × 10−50.0006740.0006014.39 × 10−80.000245.94 × 10−7
Table A7. HQ values for potentially toxic elements through the dermal route.
PbMnNiCuCrZnFeCd
Adults
Min1.51 × 10−42.28 × 10−44.90 × 10−75.15 × 10−61.92 × 10−41.18 × 10−65.88 × 10−33.5 × 10−5
Max1.93 × 10−45.26 × 10−49.21 × 10−39.38 × 10−25.82 × 10−42.34 × 10−61.2 × 10−28.23 × 10⁻⁵
Mean1.7 × 10−43.47 × 10−43.18 × 10−43.14 × 10−34.21 × 10−41.72 × 10−61.1 × 10−25.78 × 10⁻⁵
SD1.2 × 10−57.11 × 10−50.00160.0178.29 × 10−52.64 × 10−70.0011.43 × 10−5
Children
Min1.27 × 10−21.92 × 10−24.13 × 10−54.34 × 10−41.61 × 10−29.97 × 10−54.95 × 10−12.95 × 10−3
Max1.62 × 10−24.43 × 10−27.75 × 10−17.90 × 10+004.90 × 10−21.97 × 10−41.01 × 10+006.93 × 10⁻³
Mean1.43 × 10−22.93 × 10−22.68 × 10−22.64 × 10−13.55 × 10−21.45 × 10−49.23 × 10−14.87 × 10⁻³
SD0.0010120.00590.141.440.00692.22 × 10−50.0860.00125
Table A8. Hazard index values for both age groups.
PbMnNiCuCrZnFeCd
Adults
Min0.0930.0510.0010.0010.040.0100.0750.007
Max0.1180.121.8819.760.120.0190.1540.017
Mean0.1050.080.0700.7080.090.0140.1400.012
Stdev0.0070.0160.3443.60.010.0020.0130.003
Children
Min0.1980.1180.000240.0020.0950.0020.6330.017
Max0.2520.2724.5347.230.290.0041.2970.0405
Mean0.2240.1790.16767991.690.21791920.00291.1810.0291
Stdev0.0150.0360.82654028.620.04144710.00040.11040.007

References

  1. Arokiasamy, P.; Abdullah, M.M.A.B.; Abd Rahim, S.Z.; Sadique, M.; Ming, L.Y.; Mohd Salleh, M.A.A.; Mohd Arif Zainol, M.R.R.; Ghazali, C.M.R. Diverse Material Based Geopolymer towards Heavy Metals Removal: A Review. J. Mater. Res. Technol. 2023, 22, 126–156. [Google Scholar] [CrossRef]
  2. Goswami, R.; Neog, N. Heavy Metal Pollution in the Environment: Impact on Air Quality and Human Health Implications. In Heavy Metal Toxicity: Environmental Concerns, Remediation and Opportunities; Singh, R.P., Singh, P., Srivastava, A., Eds.; Springer Nature: Singapore, 2023; pp. 75–103. ISBN 978-981-99-0397-9. [Google Scholar]
  3. Mishra, S.; Singh, G.; Gupta, A.; Tiwari, R.K. Heavy Metal/Metalloid Contamination: Their Sources in Environment and Accumulation in Food Chain. In Heavy Metal Toxicity: Environmental Concerns, Remediation and Opportunities; Singh, R.P., Singh, P., Srivastava, A., Eds.; Springer Nature: Singapore, 2023; pp. 19–47. ISBN 978-981-99-0397-9. [Google Scholar]
  4. Nour, H.E.; Aljahdali, M.H. Ecological and Health Risk Assessment of Sharm El-Sheikh Beach Sediments, Red Sea Coast. Mar. Pollut. Bull. 2025, 212, 117577. [Google Scholar] [CrossRef] [PubMed]
  5. Di Bella, G.; El-Sorogy, A.S.; Giacobbe, S.; Nava, V.; Al-Kahtany, K.; Nour, H.E. Risk Assessment of Potentially Toxic Elements in Intermittent Rivers, “Fiumara”, Flowing in the Gulf of Milazzo (Sicily, Italy). Environ. Earth Sci. 2024, 83, 321. [Google Scholar] [CrossRef]
  6. Alharbi, T.; Nour, H.E.; El-Sorogy, A.S.; Al-Kahtany, K.; Giacobbe, S.; Alarifi, S.S. Evaluation of Health Risks and Heavy Metals Toxicity in Agricultural Soils in Central Saudi Arabia. Environ. Monit. Assess. 2025, 197, 419. [Google Scholar] [CrossRef]
  7. Harrison, R.M.; Allan, J.; Carruthers, D.; Heal, M.R.; Lewis, A.C.; Marner, B.; Murrells, T.; Williams, A. Non-Exhaust Vehicle Emissions of Particulate Matter and VOC from Road Traffic: A Review. Atmos. Environ. 2021, 262, 118592. [Google Scholar] [CrossRef]
  8. Beji, A.; Deboudt, K.; Muresan, B.; Khardi, S.; Flament, P.; Fourmentin, M.; Lumiere, L. Physical and Chemical Characteristics of Particles Emitted by a Passenger Vehicle at the Tire-Road Contact. Chemosphere 2023, 340, 139874. [Google Scholar] [CrossRef]
  9. Harada, Y.; Whitlow, T.H.; Russell-Anelli, J.; Walter, M.T.; Bassuk, N.L.; Rutzke, M.A. The Heavy Metal Budget of an Urban Rooftop Farm. Sci. Total Environ. 2019, 660, 115–125. [Google Scholar] [CrossRef]
  10. Gupta, V. Vehicle-Generated Heavy Metal Pollution in an Urban Environment and Its Distribution into Various Environmental Components. In Environmental Concerns and Sustainable Development: Volume 1: Air, Water and Energy Resources; Shukla, V., Kumar, N., Eds.; Springer: Singapore, 2020; pp. 113–127. ISBN 978-981-13-5889-0. [Google Scholar]
  11. Dehghani, S.; Moore, F.; Vasiluk, L.; Hale, B.A. The Geochemical Fingerprinting of Geogenic Particles in Road Deposited Dust from Tehran Metropolis, Iran: Implications for Provenance Tracking. J. Geochem. Explor. 2018, 190, 411–423. [Google Scholar] [CrossRef]
  12. Lu, X.; Wang, L.; Li, L.Y.; Lei, K.; Huang, L.; Kang, D. Multivariate Statistical Analysis of Heavy Metals in Street Dust of Baoji, NW China. J. Hazard. Mater. 2010, 173, 744–749. [Google Scholar] [CrossRef]
  13. Vlasov, D.; Kosheleva, N.; Kasimov, N. Spatial Distribution and Sources of Potentially Toxic Elements in Road Dust and Its PM10 Fraction of Moscow Megacity. Sci. Total Environ. 2021, 761, 143267. [Google Scholar] [CrossRef]
  14. Vlasov, D.V.; Vasil’chuk, J.Y.; Kosheleva, N.E.; Kasimov, N.S. Contamination Levels and Source Apportionment of Potentially Toxic Elements in Size-Fractionated Road Dust of Moscow. Environ. Sci. Pollut. Res. 2022, 30, 38099–38120. [Google Scholar] [CrossRef] [PubMed]
  15. Rana, M.S.; Wang, Q.; Wang, W.; Enyoh, C.E.; Islam, M.R.; Isobe, Y.; Kabir, M.H. Sources, Distribution, and Health Implications of Heavy Metals in Street Dust across Industrial, Capital City, and Peri-Urban Areas of Bangladesh. Atmosphere 2024, 15, 1088. [Google Scholar] [CrossRef]
  16. Ali-Taleshi, M.S.; Feiznia, S.; Masiol, M. Seasonal and Spatial Variations of Atmospheric Depositions-Bound Elements over Tehran Megacity, Iran: Pollution Levels, PMF-Based Source Apportionment and Risks Assessment. Urban Clim. 2022, 42, 101113. [Google Scholar] [CrossRef]
  17. Olawoyin, R.; Nieto, A.; Grayson, R.L.; Hardisty, F.; Oyewole, S. Application of Artificial Neural Network (ANN)-Self-Organizing Map (SOM) for the Categorization of Water, Soil and Sediment Quality in Petrochemical Regions. Expert Syst. Appl. 2013, 40, 3634–3648. [Google Scholar] [CrossRef]
  18. Li, C.; Wang, X.; Xiao, S.; Wang, H. The Source Apportionment of Heavy Metals in Surface Dust in the Main District Bus Stops of Tianshui City Based on the Positive Matrix Factorization Model and Geo-Statistics. Atmosphere 2023, 14, 591. [Google Scholar] [CrossRef]
  19. Bețianu, C.; Cozma, P.; Gavrilescu, M. Human Health Hazards and Risks Generated by the Bioaccumulation of Lead from the Environment in the Food Chain. In Lead Toxicity Mitigation: Sustainable Nexus Approaches; Kumar, N., Jha, A.K., Eds.; Springer Nature: Cham, Switzerland, 2024; pp. 73–123. ISBN 978-3-031-46146-0. [Google Scholar]
  20. Din, I.U.; Muhammad, S.; Faisal, S.; ur Rehman, I.; Ali, W. Heavy Metal(Loid)s Contamination and Ecotoxicological Hazards in Coal, Dust, and Soil Adjacent to Coal Mining Operations, Northwest Pakistan. J. Geochem. Explor. 2024, 256, 107332. [Google Scholar] [CrossRef]
  21. Chakraborty, M.; Rahat, M.M.R.; Choudhury, T.R.; Nigar, R.; Liu, G.; Habib, A. Heavy Metal Contamination and Health Risk Assessment of Road Dust from Landfills in Dhaka-Narayanganj, Bangladesh. Emerg. Contam. 2024, 10, 100278. [Google Scholar] [CrossRef]
  22. Mostafa, M.T.; El-Nady, H.; Gomaa, R.M.; Abdelgawad, H.F.; Abdelhafiz, M.A.; Salman, S.A.E.; Khalifa, I.H. Urban Geochemistry of Heavy Metals in Road Dust from Cairo Megacity, Egypt: Enrichment, Sources, Contamination, and Health Risks. Environ. Earth Sci. 2024, 83, 37. [Google Scholar] [CrossRef]
  23. Nduka, J.K.; Umeh, T.C.; Kelle, H.I.; Mgbemena, M.A.N.; Nnamani, R.A.; Okafor, P.C. Ecological and Health Risk Assessment of Heavy Metals in Roadside Soil, Dust and Water of Three Economic Zone in Enugu, Nigeria. Urban Clim. 2023, 51, 101627. [Google Scholar] [CrossRef]
  24. Huang, C.; Zhang, L.; Meng, J.; Yu, Y.; Qi, J.; Shen, P.; Li, X.; Ding, P.; Chen, M.; Hu, G. Characteristics, Source Apportionment and Health Risk Assessment of Heavy Metals in Urban Road Dust of the Pearl River Delta, South China. Ecotoxicol. Environ. Saf. 2022, 236, 113490. [Google Scholar] [CrossRef]
  25. Din, I.U.; Muhammad, S.; Rehman, I. ur Heavy Metal(Loid)s Contaminations in Soils of Pakistan: A Review for the Evaluation of Human and Ecological Risks Assessment and Spatial Distribution. Environ. Geochem. Health 2023, 45, 1991–2012. [Google Scholar] [CrossRef] [PubMed]
  26. Tokatlı, C.; Varol, M.; Ustaoğlu, F.; Muhammad, S. Pollution Characteristics, Sources and Health Risks Assessment of Potentially Hazardous Elements in Sediments of Ten Ponds in the Saros Bay Region (Türkiye). Chemosphere 2023, 340, 139977. [Google Scholar] [CrossRef] [PubMed]
  27. Liu, Y.; Jin, T.; Yu, S.; Chu, H. Pollution Characteristics and Health Risks of Heavy Metals in Road Dust in Ma’anshan, China. Environ. Sci. Pollut. Res. 2023, 30, 43726–43739. [Google Scholar] [CrossRef] [PubMed]
  28. Mahmud, M.; Hasan, M.M. Assessment of Heavy Metal Contamination on Road Dust: A Case Study of Khulna City. Adv. Environ. Eng. Res. 2025, 6, 8. [Google Scholar] [CrossRef]
  29. Singh, M.P.; Bhattacharyya, S.; Chinu, K.; Akter, R.; Marjo, C.E. Comprehensive Chemical Profiling of Roadside Soil and Road Dust of Delhi, India: Estimation of Health Risk and City Fuel Consumption. J. Hazard. Mater. Adv. 2025, 18, 100668. [Google Scholar] [CrossRef]
  30. Jadoon, W.A.; Khan, Y.A.; Varol, M.; Onjia, A.; Mohany, M. Comprehensive Analysis and Risk Assessment of Fine Road Dust in Abbottabad City (Pakistan) with Heavy Traffic for Potentially Toxic Elements. J. Hazard. Mater. 2025, 486, 136788. [Google Scholar] [CrossRef]
  31. Qayyum, A.; Poessé, J.W.; Kaymakci, N.; Langereis, C.G.; Gülyüz, E.; Ahsan, N. Neogene Kinematics of the Potwar Plateau and the Salt Range, NW Himalayan Front: A Paleostress Inversion and AMS Study. Int. Geol. Rev. 2022, 64, 1311–1329. [Google Scholar] [CrossRef]
  32. Shahid Jamil, S. The Salt Range: Pakistan’s Unique Field Museum of Geology and Paleontology. In PaleoParks: The Protection and Conservation of Fossil Sites Worldwide; University of Western Brittany: Brest, France, 2019. [Google Scholar]
  33. Mahmood, S.; Atique, F.; Rehman, A.; Mayo, S.M.; Ahamad, M.I. Rockfall Susceptibility Assessment along M-2 Motorway in Salt Range, Pakistan. J. Appl. Geophys. 2024, 222, 105312. [Google Scholar] [CrossRef]
  34. Kazmi, A.H.; Jan, M.Q. Geology and Tectonics of Pakistan; Graphic Publishers: Santa Ana, CA, USA, 1997; ISBN 9698375007. [Google Scholar]
  35. Wei, B.; Yang, L. A Review of Heavy Metal Contaminations in Urban Soils, Urban Road Dusts and Agricultural Soils from China. Microchem. J. 2010, 94, 99–107. [Google Scholar] [CrossRef]
  36. Faisal, M.; Wu, Z.; Wang, H.; Hussain, Z.; Shen, C. Geochemical Mapping, Risk Assessment, and Source Identification of Heavy Metals in Road Dust Using Positive Matrix Factorization (PMF). Atmosphere 2021, 12, 614. [Google Scholar] [CrossRef]
  37. Guney, M.; Onay, T.T.; Copty, N.K. Impact of Overland Traffic on Heavy Metal Levels in Highway Dust and Soils of Istanbul, Turkey. Environ. Monit. Assess. 2010, 164, 101–110. [Google Scholar] [CrossRef] [PubMed]
  38. Yang, X.; Eziz, M.; Hayrat, A.; Ma, X.; Yan, W.; Qian, K.; Li, J.; Liu, Y.; Wang, Y. Heavy Metal Pollution and Risk Assessment of Surface Dust in the Arid NW China. Int. J. Environ. Res. Public Health 2022, 19, 13296. [Google Scholar] [CrossRef] [PubMed]
  39. Istanbullu, S.N.; Sevik, H.; Isinkaralar, K.; Isinkaralar, O. Spatial Distribution of Heavy Metal Contamination in Road Dust Samples from an Urban Environment in Samsun, Türkiye. Bull. Environ. Contam. Toxicol. 2023, 110, 78. [Google Scholar] [CrossRef] [PubMed]
  40. Moskovchenko, D.; Pozhitkov, R.; Soromotin, A.; Tyurin, V. The Content and Sources of Potentially Toxic Elements in the Road Dust of Surgut (Russia). Atmosphere 2022, 13, 30. [Google Scholar] [CrossRef]
  41. Turekian, K.K.; Wedepohl, H.K. Distribution of the Elements in Some Major Units of the Earth’s Crust. Geol. Soc. Am. Bull. 1961, 72, 175–192. [Google Scholar] [CrossRef]
  42. Rahman, M.S.; Kumar, P.; Ullah, M.; Jolly, Y.N.; Akhter, S.; Kabir, J.; Begum, B.A.; Salam, A. Elemental Analysis in Surface Soil and Dust of Roadside Academic Institutions in Dhaka City, Bangladesh and Their Impact on Human Health. Environ. Chem. Ecotoxicol. 2021, 3, 197–208. [Google Scholar] [CrossRef]
  43. Dash, S.; Borah, S.S.; Kalamdhad, A.S. Heavy Metal Pollution and Potential Ecological Risk Assessment for Surficial Sediments of Deepor Beel, India. Ecol. Indic. 2021, 122, 107265. [Google Scholar] [CrossRef]
  44. Taye, A.E.; Chandravanshi, B.S. Health and Ecological Risk Assessment of Potentially Toxic Metals in Road Dust at Lalibela and Sekota Towns, Ethiopia. Environ. Monit. Assess. 2023, 195, 765. [Google Scholar] [CrossRef]
  45. Kang, Z.; Wang, S.; Qin, J.; Wu, R.; Li, H. Pollution Characteristics and Ecological Risk Assessment of Heavy Metals in Paddy Fields of Fujian Province, China. Sci. Rep. 2020, 10, 12244. [Google Scholar] [CrossRef]
  46. Díaz Rizo, O.; Casanova Díaz, A.O.; Torres Ramos, A.G.; Ramos López, D. Heavy Metals Concentration, Pollution Indexes, and Health Risk Assessment of Urban Road Dust in the Historical Center of Havana, Cuba. Environ. Monit. Assess. 2023, 195, 349. [Google Scholar] [CrossRef]
  47. Tang, M.; Alderton, D.; Elias, S.A. Composition of the Earth’s Crust. In Encyclopedia of Geology, 2nd ed.; Alderton, D., Elias, S.A., Eds.; Elsevier: Amsterdam, The Netherlands, 2021; pp. 178–186. [Google Scholar]
  48. Levin, R.; Vieira, C.L.Z.; Rosenbaum, M.H.; Bischoff, K.; Mordarski, D.C.; Brown, M.J. The Urban Lead (Pb) Burden in Humans, Animals and the Natural Environment. Environ. Res. 2021, 193, 110377. [Google Scholar] [CrossRef] [PubMed]
  49. Pennington, A.F.; Smith, M.R.; Chuke, S.O.; Cornwell, C.R.; Allwood, P.B.; Courtney, J.G. Effects of Blood Lead Levels <10 Μg/DL in School-Age Children and Adolescents: A Scoping Review. Pediatrics 2024, 154 (Suppl. S2), e2024067808F. [Google Scholar] [CrossRef]
  50. Parithathvi, A.; Choudhari, N.; Dsouza, H.S. Prenatal and Early Life Lead Exposure Induced Neurotoxicity. Hum. Exp. Toxicol. 2024, 43, 09603271241285523. [Google Scholar] [CrossRef] [PubMed]
  51. Liu, G.; Chen, T.; Cui, J.; Zhao, Y.; Li, Z.; Liang, W.; Sun, J.; Liu, Z.; Xiao, T. Trace Metal(Loid) Migration from Road Dust to Local Vegetables and Tree Tissues and the Bioaccessibility-Based Health Risk: Impacts of Vehicle Operation-Associated Emissions. Int. J. Environ. Res. Public Health 2023, 20, 2520. [Google Scholar] [CrossRef]
  52. Fiala, M.; Hwang, H.M. Influence of Highway Pavement on Metals in Road Dust: A Case Study in Houston, Texas. Water Air Soil. Pollut. 2021, 232, 185. [Google Scholar] [CrossRef]
  53. Roy, S.; Gupta, S.K.; Prakash, J.; Habib, G.; Kumar, P. A Global Perspective of the Current State of Heavy Metal Contamination in Road Dust. Environ. Sci. Pollut. Res. 2022, 29, 33230–33251. [Google Scholar] [CrossRef]
  54. Nargis, A.; Habib, A.; Islam, M.N.; Chen, K.; Sarker, M.S.I.; Al-Razee, A.N.M.; Cai, M. Source identification, contamination status and health risk assessment of heavy metals from road dusts in Dhaka, Bangladesh. J. Environ. Sci. 2022, 121, 159–174. [Google Scholar] [CrossRef]
  55. Shahab, A.; Zhang, H.; Ullah, H.; Rashid, A.; Rad, S.; Li, J.; Xiao, H. Pollution Characteristics and Toxicity of Potentially Toxic Elements in Road Dust of a Tourist City, Guilin, China: Ecological and Health Risk Assessment☆. Environ. Pollut. 2020, 266, 115419. [Google Scholar] [CrossRef]
  56. Hama, S.; Kumar, P.; Alam, M.S.; Rooney, D.J.; Bloss, W.J.; Shi, Z.; Harrison, R.M.; Crilley, L.R.; Khare, M.; Gupta, S.K. Chemical Source Profiles of Fine Particles for Five Different Sources in Delhi. Chemosphere 2021, 274, 129913. [Google Scholar] [CrossRef]
  57. Li, J.; Zuo, Q.; Feng, F.; Jia, H.; Ji, Y. Pollution Characteristics, Bioavailability, and Risk Assessment of Heavy Metals in Urban Road Dust from Zhengzhou, China. Environ. Geochem. Health 2024, 46, 476. [Google Scholar] [CrossRef]
  58. Salazar-Rojas, T.; Cejudo-Ruiz, F.R.; Gutiérrez-Soto, M.V.; Calvo-Brenes, G. Assessing Heavy Metal Pollution Load Index (PLI) in Biomonitors and Road Dust from Vehicular Emission by Magnetic Properties Modeling. Environ. Sci. Pollut. Res. 2023, 30, 91248–91261. [Google Scholar] [CrossRef] [PubMed]
  59. Mirzaei Aminiyan, M.; Baalousha, M.; Mousavi, R.; Mirzaei Aminiyan, F.; Hosseini, H.; Heydariyan, A. The Ecological Risk, Source Identification, and Pollution Assessment of Heavy Metals in Road Dust: A Case Study in Rafsanjan, SE Iran. Environ. Sci. Pollut. Res. 2018, 25, 13382–13395. [Google Scholar] [CrossRef] [PubMed]
  60. Charkiewicz, A.E.; Omeljaniuk, W.J.; Nowak, K.; Garley, M.; Nikliński, J. Cadmium toxicity and health effects—A brief summary. Molecules 2023, 28, 6620. [Google Scholar] [CrossRef] [PubMed]
  61. Genchi, G.; Sinicropi, M.S.; Lauria, G.; Carocci, A.; Catalano, A. The Effects of Cadmium Toxicity. Int. J. Environ. Res. Public Health 2020, 17, 3782. [Google Scholar] [CrossRef]
  62. Aydinalp, C.; Marinova, S. Lead in Particulate Deposits and in Leaves of Roadside Plants. Pol. J. Environ. Stud. 2004, 13, 233–235. [Google Scholar]
  63. Lagerwerff, J.V.; Specht, A.W. Contamination of Roadside Soil and Vegetation with Cadmium, Nickel, Lead, and Zinc. Environ. Sci. Technol. 1970, 4, 20705. [Google Scholar] [CrossRef]
  64. Hakanson, L. An Ecological Risk Index for Aquatic Pollution Control.a Sedimentological Approach. Water Res. 1980, 14, 975–1001. [Google Scholar] [CrossRef]
  65. Bakirdere, S.; Yaman, M. Determination of Lead, Cadmium and Copper in Roadside Soil and Plants in Elazig, Turkey. Environ. Monit. Assess. 2008, 136, 401–410. [Google Scholar] [CrossRef]
  66. Majid, H.; Madl, P.; Alam, K. Ambient Air Quality with Emphasis on Roadside Junctions in Metropolitan Cities of Pakistan and Its Potential Health Effects. Health 2012, 3, 79–85. [Google Scholar]
  67. Keshavarzi, B.; Tazarvi, Z.; Rajabzadeh, M.A.; Najmeddin, A. Chemical Speciation, Human Health Risk Assessment and Pollution Level of Selected Heavy Metals in Urban Street Dust of Shiraz, Iran. Atmos. Environ. 2015, 119, 1–10. [Google Scholar] [CrossRef]
  68. Shi, G.; Chen, Z.; Bi, C.; Wang, L.; Teng, J.; Li, Y.; Xu, S. A Comparative Study of Health Risk of Potentially Toxic Metals in Urban and Suburban Road Dust in the Most Populated City of China. Atmos. Environ. 2011, 45, 764–771. [Google Scholar] [CrossRef]
  69. Al-Shidi, H.K.; Al-Reasi, H.A.; Sulaiman, H. Heavy Metals Levels in Road Dust from Muscat, Oman: Relationship with Traffic Volumes, and Ecological and Health Risk Assessments. Int. J. Environ. Health Res. 2022, 32, 264–276. [Google Scholar] [CrossRef] [PubMed]
  70. Bhattacharya, T.; Chakraborty, S.; Tuteja, D.; Patel, M. Zinc and Chromium Load in Road Dust, Suspended Particulate Matter and Foliar Dust Deposits of Anand City, Gujarat. Open J. Met. 2013, 3, 42–50. [Google Scholar] [CrossRef]
  71. Duong, T.T.T.; Lee, B.K. Determining Contamination Level of Heavy Metals in Road Dust from Busy Traffic Areas with Different Characteristics. J. Environ. Manag. 2011, 92, 554–562. [Google Scholar] [CrossRef]
  72. Pagotto, C.; Rémy, N.; Legret, M.; Le Cloirec, P. Heavy Metal Pollution of Road Dust and Roadside Soil near a Major Rural Highway. Environ. Technol. 2001, 22, 307–319. [Google Scholar] [CrossRef]
  73. Sager, M. Urban Soils and Road Dust—Civilization Effects and Metal Pollution—A Review. Environments 2020, 7, 98. [Google Scholar] [CrossRef]
  74. Wang, A.; Guo, Y.; Fang, Y.; Lu, K. Research on the Horizontal Reduction Effect of Urban Roadside Green Belt on Atmospheric Particulate Matter in a Semi-Arid Area. Urban Urban Green 2022, 68, 127449. [Google Scholar] [CrossRef]
  75. Alshetty, D.; Shiva Nagendra, S.M. Urban Characteristics and Its Influence on Resuspension of Road Dust, Air Quality and Exposure. Air Qual. Atmos. Health 2022, 15, 273–287. [Google Scholar] [CrossRef]
  76. Boahen, E. Heavy Metal Contamination in Urban Roadside Vegetables: Origins, Exposure Pathways, and Health Implications. Discov. Environ. 2024, 2, 145. [Google Scholar] [CrossRef]
  77. Boostani, H.R.; Hosseini, S.M.; Hardie, A.G. Mechanisms of Cd Immobilization in Contaminated Calcareous Soils with Different Textural Classes Treated by Acid- and Base-Modified Biochars. Sci. Rep. 2024, 14, 24614. [Google Scholar] [CrossRef]
  78. Hussain, T.; Ahmed, S.R.; Lahori, A.H.; Mierzwa-Hersztek, M.; Vambol, V.; Khan, A.A.; Rafique, L.; Wasia, S.; Shahid, M.F.; Zengqiang, Z. In-Situ Stabilization of Potentially Toxic Elements in Two Industrial Polluted Soils Ameliorated with Rock Phosphate-Modified Biochars. Environ. Pollut. 2022, 309, 119733. [Google Scholar] [CrossRef] [PubMed]
  79. Gao, J.; Han, H.; Gao, C.; Wang, Y.; Dong, B.; Xu, Z. Organic Amendments for in Situ Immobilization of Heavy Metals in Soil: A Review. Chemosphere 2023, 335, 139088. [Google Scholar] [CrossRef] [PubMed]
  80. Barreto, M.S.C.; Gomes, F.P.; de Carvalho, H.W.P.; Alleoni, L.R.F. Desorption Kinetic and Sequential Extraction of Pb and Zn in a Contaminated Soil Amended with Phosphate, Lime, Biochar, and Biosolids. Environ. Sci. Pollut. Res. Int. 2023, 30, 120793–120804. [Google Scholar] [CrossRef] [PubMed]
Figure 1. Location map of the study area showing road dust sample sites portrayed along with the geology of the area (a) and land use/land cover (b) of the study area.
Urbansci 09 00225 g001
Figure 2. Spatial distribution of PTE (mg/Kg) from (ah), Ni, Fe, Zn, Cu, Pb, Cr, Mn, and Cd.
Urbansci 09 00225 g002
Figure 3. (a) Spatial distribution of pollution load index (PLI), and (b) spatial distribution of potential ecological risk index (PERI) in the study area.
Urbansci 09 00225 g003
Figure 4. Correlogram showing the results of Spearman rank correlation analysis.
Urbansci 09 00225 g004
Figure 5. Dendrogram of hierarchical agglomerative cluster analysis (HCA).
Urbansci 09 00225 g005
Table 1. Descriptive statistics of potentially toxic elements in road dust samples.
NiFeZnCuPbCrMnCd
Min1.433,6002032822713711995
Max26368,800402180289415.62765.512
Mean41.4962,646295.0672.6255.48301.021826.418.26
SD70.035854.8345.3734.3418.0359.25373.832.04
CV%168.799.3415.3747.297.05819.6820.4624.8
Table 2. Statistical summary of contamination factors for each potentially toxic element included in the study.
NiFeZnCuPbCrMnCd
Min0.020.712.130.6011.351.521.4116.66
Max3.861.454.224.0014.444.613.2539.16
Mean0.631.323.131.5512.863.462.1428.21
SD1.020.120.470.760.900.660.436.82
Table 3. Statistical summary of geoaccumulation index.
NiFeZnCuPbCrMnCd
Min−6.19−1.080.51−1.272.920.02−0.093.47
Max1.37−0.041.501.423.271.621.124.71
Mean−2.47−0.191.03−0.033.091.120.494.15
SD1.700.170.220.620.100.330.290.36
Table 4. Factor analysis showing loadings of four rotated components (RCs).
RC1RC2RC3RC4
Mn−0.168−0.1150.791−0.086
Ni0.066−0.130−0.1930.808
Cr0.769−0.206−0.006−0.087
Cu−0.1800.806−0.011−0.178
Pb0.4630.1850.627−0.013
Zn0.6590.168−0.0550.077
Cd0.3910.7390.0430.245
Fe−0.1570.2970.4540.589
Eigenvalue2.11.51.11.02
Variance (%)18.5317.7415.8213.92
Cum. variance18.5336.2752.0966.02
Disclaimer/Publisher’s Note: The statements, opinions and data contained in all publications are solely those of the individual author(s) and contributor(s) and not of MDPI and/or the editor(s). MDPI and/or the editor(s) disclaim responsibility for any injury to people or property resulting from any ideas, methods, instructions or products referred to in the content.

