Article

Valorization of Historical Urban Spaces for Managed Aquifer Recharge as a Tool to Support Sustainable Urban Development in Warsaw, Poland

by
Joanna Trzeciak
and
Sebastian Zabłocki
*
Faculty of Geology, University of Warsaw, 02-089 Warszawa, Poland
*
Author to whom correspondence should be addressed.
Urban Sci. 2025, 9(6), 224; https://doi.org/10.3390/urbansci9060224
Submission received: 8 April 2025 / Revised: 28 May 2025 / Accepted: 11 June 2025 / Published: 13 June 2025

Abstract

:
In the context of progressing climate change and the increasing frequency of extreme weather events, there is a growing need for effective strategies to mitigate their impacts. One such strategy involves the implementation of tools aimed at sustainable rainfall management at the site of precipitation. This study focuses on assessing the state of the water environment as a prerequisite for introducing sustainable Managed Aquifer Recharge (MAR) practices in urban areas. The research was conducted in the historic district of Warsaw, Poland. A comprehensive methodological approach was employed, including field and laboratory measurements of soil moisture and electrical conductivity (EC), vadose zone hydraulic conductivity, spring discharge rates, and analytical calculations based on climatic data. These were supplemented by groundwater flow modeling to estimate infiltration rates. The study showed that the infiltration rate in the aquifer is low—only 4.4% of the average annual precipitation. This is primarily due to limited green space coverage and high surface runoff, as well as high potential evaporation rates and low soil permeability in the vadose zone. A positive water balance and infiltration were observed only in December and January, as indicated by increased soil moisture and decreased EC values. A multi-criteria spatial analysis identified priority zones for the installation of retention infrastructure aimed at enhancing effective infiltration and improving the urban water balance. These findings underscore the need for targeted interventions in urban water management to support climate resilience and sustainable development goals.

1. Introduction

Atmospheric precipitation shapes natural water resources. In urban environments, the retention and storage of rainwater can occur in various ways: as atmospheric moisture, on wetted surfaces of landforms and soil, and in underground retention facilities [1,2]. Neglecting actions aimed at increasing retention leads to a gradual reduction in surface and groundwater resources, exacerbating the phenomenon of so-called “urban drought” [3]. As a result, the urban heat island effect intensifies, and the condition of green areas and the quality of life of residents deteriorate [4].
Conversely, during intense rainfall—which is becoming increasingly frequent due to global climate change—the prevailing “gray infrastructure” is often unable to effectively drain stormwater, leading to waterlogging and local flooding [5,6]. Newly developed urban areas often feature well-designed systems for capturing and temporarily storing rainwater [7]. The situation in historic, inner-city areas is also gradually improving, although implementing changes in stormwater management in these zones is complex. The lack of clear legal regulations mandating the implementation of water policy in these areas causes positive changes to occur slowly [8].
To understand the scale of transformation in the natural water cycle in urban environments, it is necessary to first determine the water balance of a given area. This involves quantifying the individual components of inflow and outflow within the water circulation system of a defined catchment. In urban conditions [9], a catchment is defined as a “box” with a unit horizontal surface area, extending from above roof level to a depth below the groundwater table. For the purposes of our research, this area has been extended to include quantitative research on aquifers whose waters participate in the hydrological cycle within the active groundwater exchange zone [10].
The impact of land cover changes on catchment hydrology has been the subject of many scientific studies [11], but the effects of urbanization on the water balance—especially in the context of changes in groundwater balance and evapotranspiration—are less frequently described [12].
Proper recognition of the water balance provides a rational basis for designing hydrotechnical structures that would mitigate the effects of climate change, manifested in the increasing intensity of weather events, and helps prevent the deepening of urban drought. In highly transformed areas, such as the study site, where surface water networks are virtually nonexistent, special attention should be given to groundwater. The impact of urbanization on groundwater systems depends on geological and hydrogeological conditions as well as the adopted stormwater management practices. Therefore, these characteristics must be thoroughly assessed at the catchment scale before developing and implementing any water management strategies [12].
Stormwater management is thus one of the key challenges for most modern cities—including Warsaw—and for the central campus of the University of Warsaw, which is dominated by infrastructure not adapted to modern rainwater management methods. This makes it impossible to implement the principle of “managing precipitation at the point of occurrence”. To assess the potential for implementing this principle, multi-criteria analysis (MCA) proves to be a particularly effective tool. MCA is a method derived from decision theory, used to solve problems with a limited number of decision options, which are evaluated and ranked by experts based on weights assigned to specific evaluation criteria [13,14]. Each criterion is assigned a weight reflecting its importance in the decision-making process—determined by experts or stakeholders. As a tool that allows for the inclusion of many different criteria and factors, MCA is especially useful for identifying optimal locations for stormwater management infrastructure, particularly under conditions of strong anthropogenic pressure [14]. It enables the assessment of an area’s retention potential by considering various aspects: environmental (hydrogeological and hydrological) conditions, nature conservation, biodiversity, the functioning of green areas (including sustainable development criteria), as well as technical, economic, social, and urban aspects—such as impact on the local community, urban esthetics, and compliance with spatial development plans.
The research presented in this study was conducted in the historic downtown area of Warsaw, within the boundaries of the central campus of the University of Warsaw (UW)—an area where the urban heat island effect is particularly pronounced [15]. The terrain morphology and the deep position of the first aquifer level, which continues to decline due to the intensifying urban drought, result in the absence of a surface watercourse network in the study area [16].
An integrated, multi-stage methodology was applied in this study, incorporating comprehensive data on the water environment—including field data, analytical solutions, and groundwater flow modeling. This approach enabled a detailed analysis of the water balance and identification of the disparity between precipitation and infiltration under urban conditions, highlighting the need to adapt water management strategies.
To address this issue, a Managed Aquifer Recharge (MAR) approach was proposed, using multi-criteria analysis to identify zones where the installation of retention infrastructure could most effectively improve the city’s water balance. The analysis considered only environmental factors that determine the feasibility of specific MAR solutions applicable under existing urban conditions, particularly in areas of high historical value. Proposed MAR device locations were identified, and the final step involved incorporating them into a groundwater flow model to estimate their impact on the water balance.

2. Material and Methods
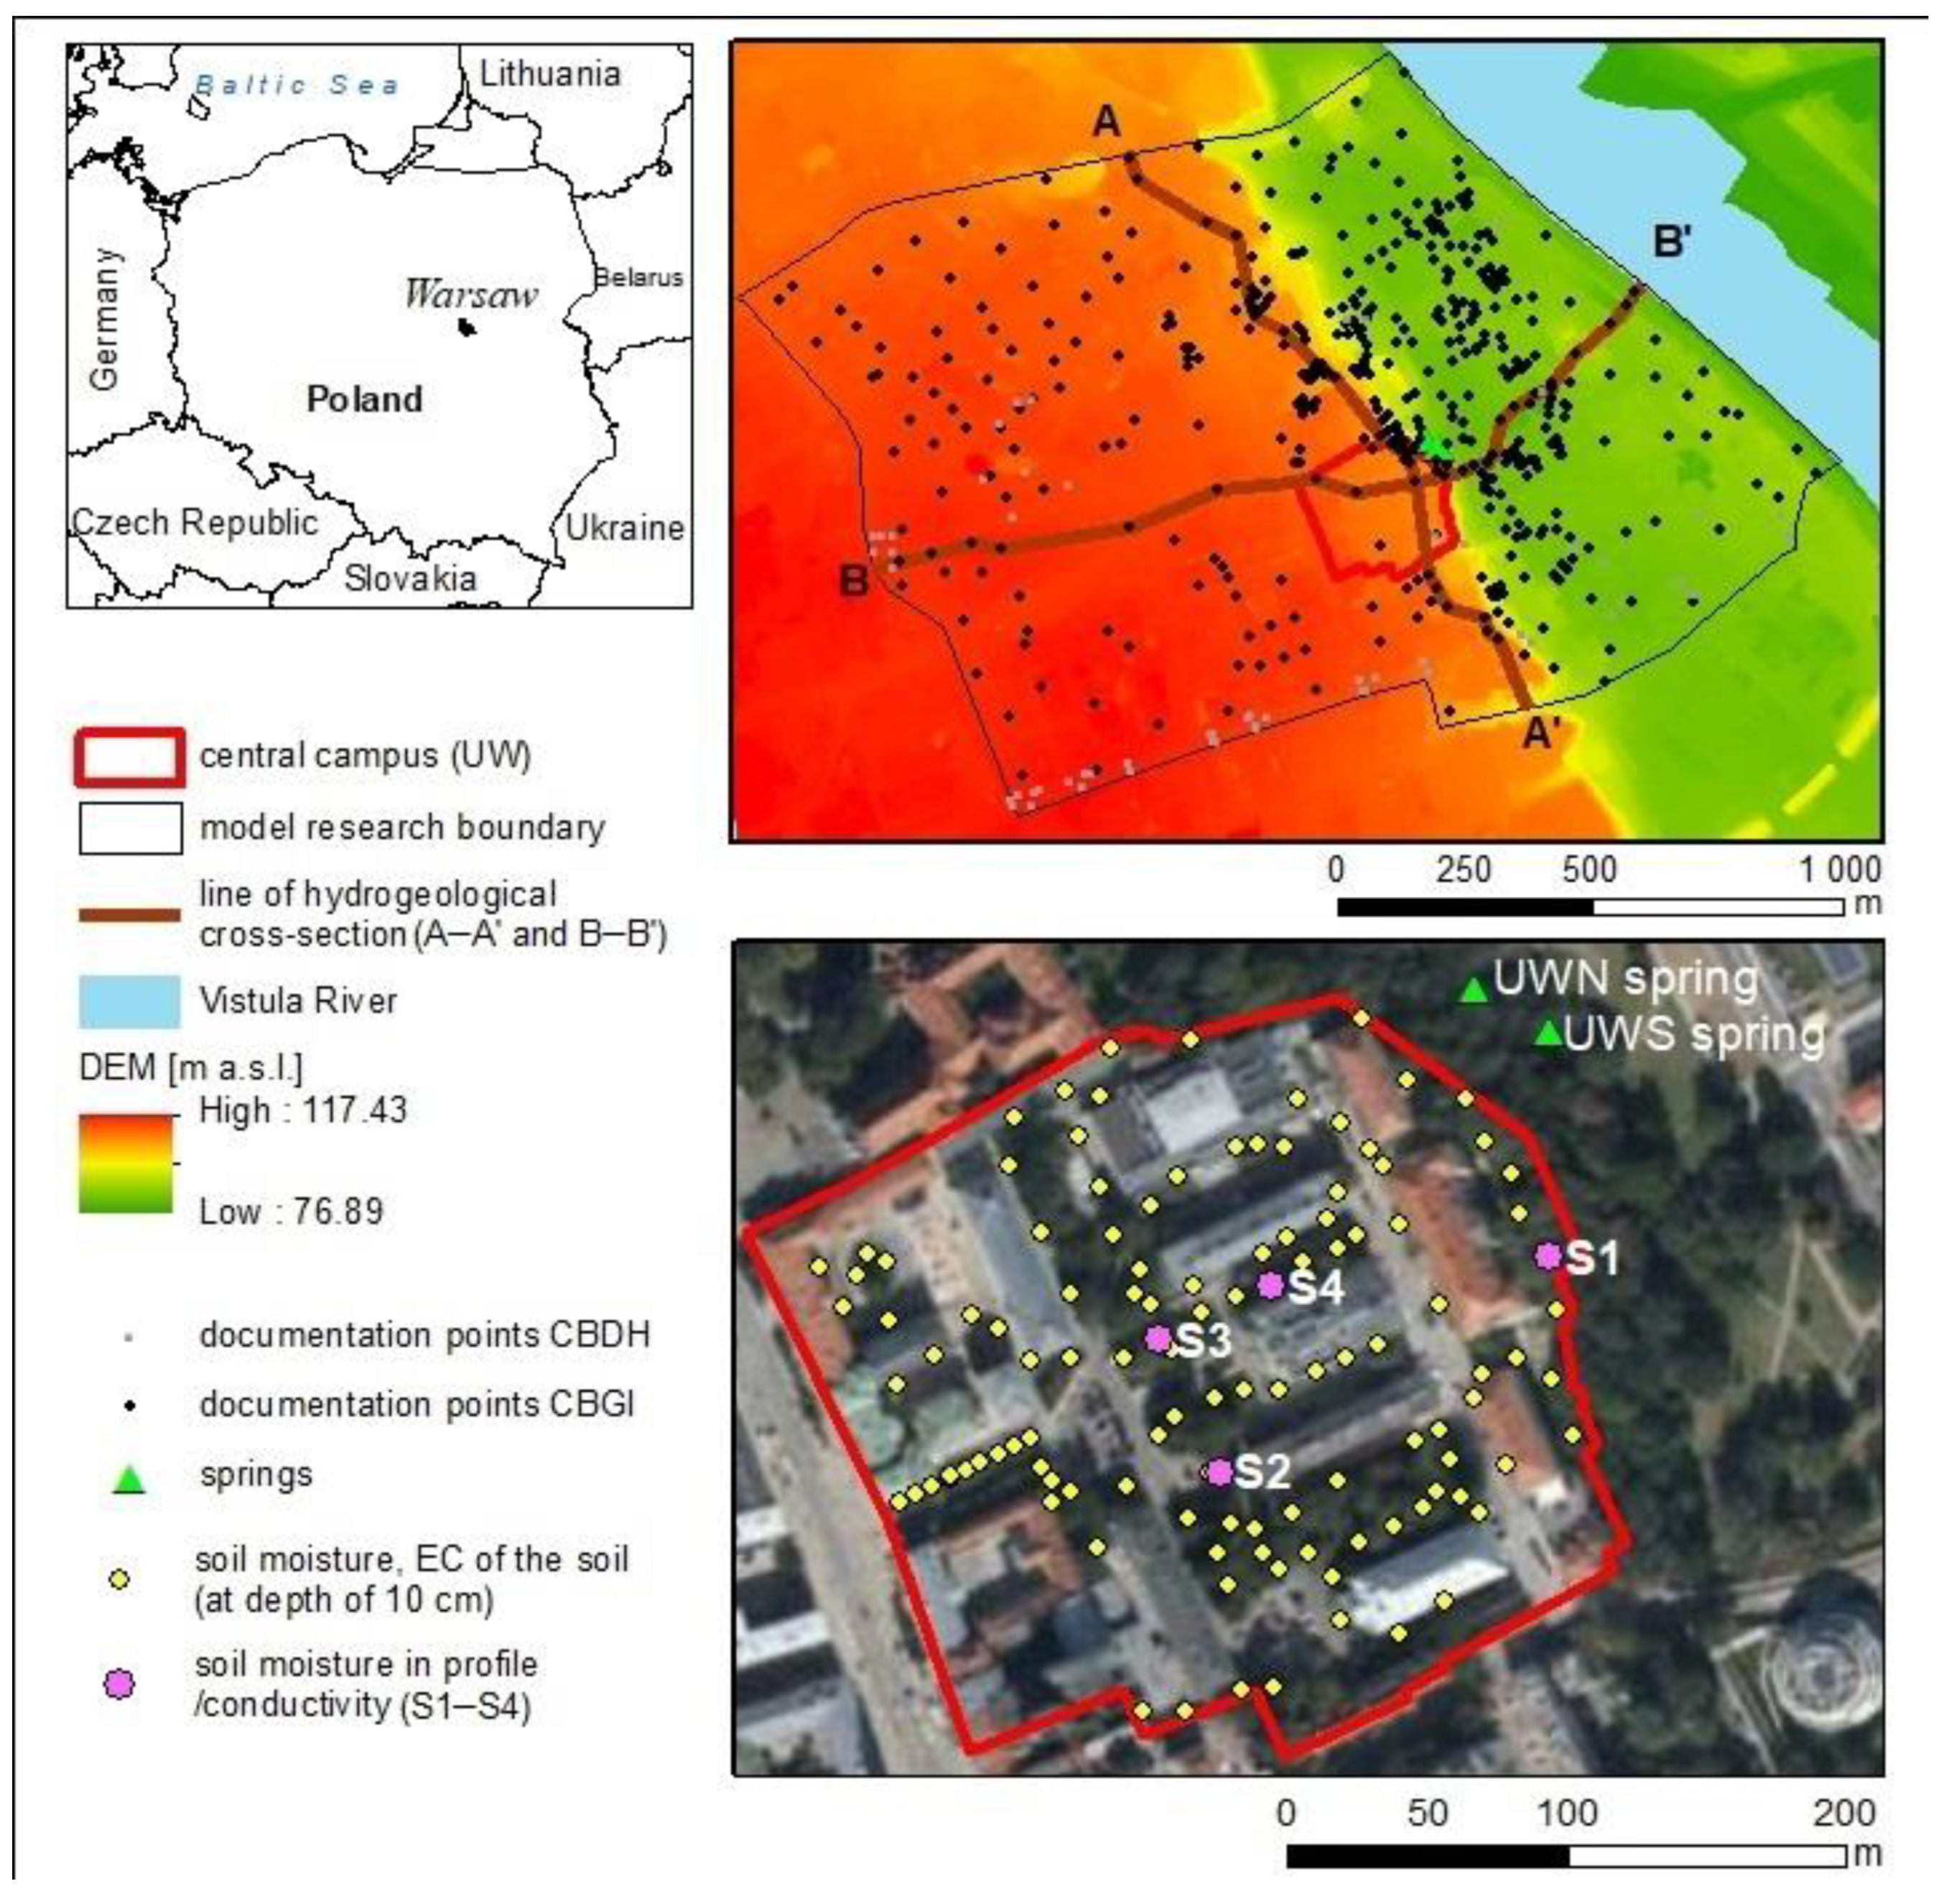
2.1. Study Area

The research was conducted in the city center, in the oldest part of Warsaw, within the area of the central campus of the University of Warsaw, covering 5.88 ha. This area is marked in red in Figure 1. However, groundwater modeling was carried out for a broader area of 191 ha, located west of the Vistula River, which is considered a regional drainage base.
The area is located in the edge zone of the denuded plateau (the Warsaw Plain) and in the middle Vistula valley. The elevation of the terrain in the upland area is usually 110–115 m a.s.l., while in the valley it is usually 84–86 m a.s.l. The erosive boundary of both units is the Warsaw Escarpment. In the study area, the Warsaw Escarpment reaches a relative height of 25 m (the highest in the Warsaw area) and slope of up to 31°, it is the northeastern boundary of the campus and the study area. Although in many places, the slope morphology has been subjected to human activities and modified by earthworks, in the vicinity of the study area, it has a natural character, the study area itself has a generally gentle slope, mostly below two degrees in the upland area and also in the central campus area (Figure 2D). The Warsaw Escarpment, which is the most characteristic element of Warsaw’s geomorphology, shapes not only the landscape but also the spatial structure of the city. The Warsaw Escarpment was one of the factors determining the location of Warsaw. The beginnings of the city date back to the 13th/14th century, but the history of settlement in this part of the city is probably longer [17]. Today, this central area of the capital is densely built-up, consisting mainly of public buildings, including a complex of historic 19th-century buildings of the UW. Squares and urban greenery accompany the building quarters. However, impermeable surfaces predominate, which can be seen in Figure 2A,C. Green areas on the central campus cover only 1.17 ha (approximately 20%), the rest are impermeable surfaces such as asphalt roads, pavements, and rooftops. Rainwater is collected only by a combined sewage system shown in Figure 2B, there is no stormwater drainage, so rainwater flows to a total of 49 sewage manholes from roads, sidewalks, and building roofs [18].

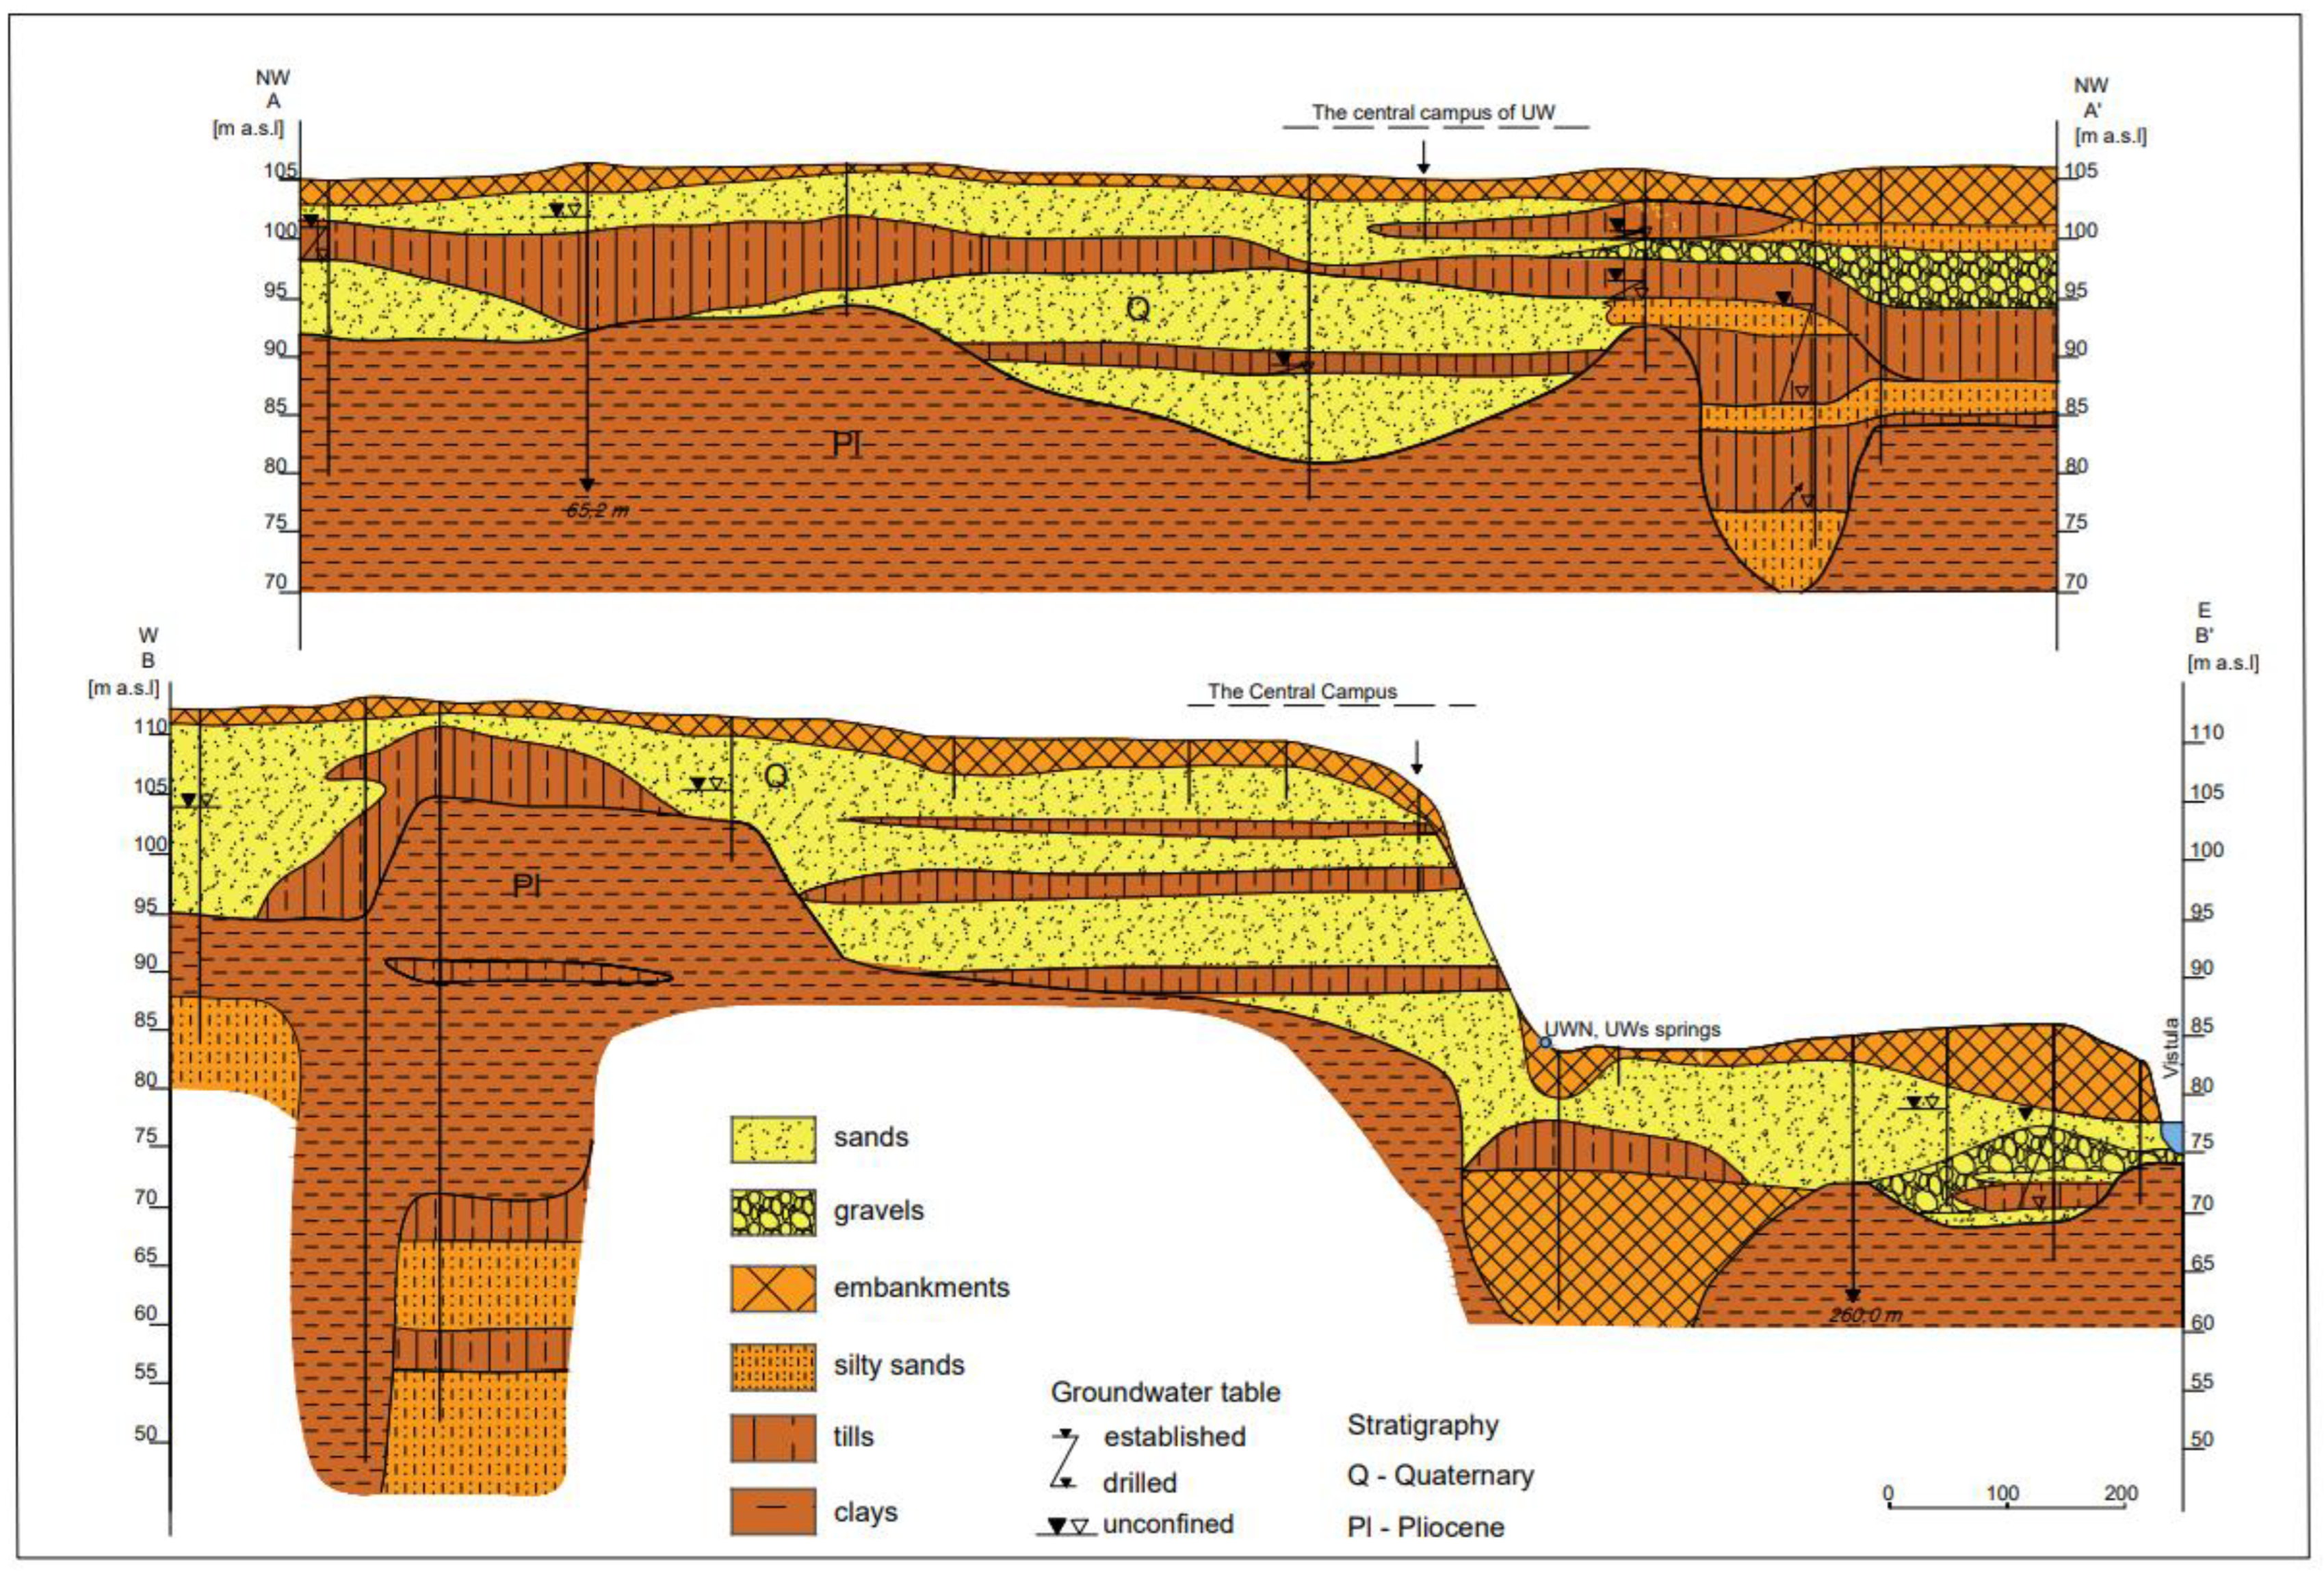
2.1.1. Geological Structure

The surface is covered by anthropogenic embankments of varying structure and thickness, present in both the post-glacial plateau and valley areas [19,20,21]. The plateau is composed of Quaternary glacial and fluvioglacial sediments of varying thickness, due to strong denivelations in the underlying Pliocene clays and silts, which are both sandy and clayey. In the north-western part, Pliocene sediments occur under a thin layer of younger sediments. Deposits of Middle-Polish Glaciations and Vistulian Glaciation are on the surface. The oldest deposits occur at the edge of the plateau; these are glacial tills of the first stadial of Middle-Polish Glaciation and clays and silts of the second stadial. The surface of the plateau is mainly covered with fluvioglacial sands and clays of the second stadial. The clays are strongly sandy, weathered and decalcified at the top, brown to rusty-brown. The Vistula valley is filled with river sands with gravels of the higher floodplain terrace, which was formed during the Vistulian Glaciation, and Holocene alluvial soils of the lower floodplain terrace reach a thickness of about 1 m [19,20].

2.1.2. Hydrogeological Conditions

Within the post-glacial plateau, two aquifers are associated with fluvioglacial sands, separated by a layer of glacial tills observed in Figure 3. The shallow aquifer is associated with the upper fluvioglacial sands of the second stadial of the Middle-Polish glaciations, but also with weathered tills. The thickness of these sediments is usually 5–7 m. The groundwater table is usually at 5 to 10 m b.g.l. or locally deeper. Within the plateau, the deeper Quaternary aquifer with a confined groundwater table stabilizing at a depth of 7–10 m or deeper occurs below the shallow aquifer at depths of 15–20 m. The sandy gravel sediments that form this aquifer are 10–20 m thick. The aquifer is associated with the lower fluvioglacial sands of the second stadial of the Middle-Polish glaciations. The deeper Quaternary aquifer is confined by glacial tills, and the average thickness of the till is 5 to 7 m. Poorly permeable Pliocene deposits occur directly below the deeper aquifer. They include clays with silts and fine sands, reaching up to 160 m in thickness. The hydraulic conductivity of the clays in the vicinity of Warsaw ranges from 10−6 to 10−5 m/d [22]. The top of the Pliocene is strongly undulated due to the presence of numerous forms of erosional and glaciotectonic origin [16]. A shallow aquifer located in the Vistula valley has groundwater table usually at the depth of 3–5 m b.g.l. It has a variable thickness, from several to over 40 m. The hydraulic contact of aquifers in the area of the Warsaw Escarpment is hindered by the presence of formations with low permeability associated with the presence of sediments formed as a result of the denudation of the escarpment but also with Pliocene clays elevation. The aquifer is drained directly by the Vistula River [23].
Within the Vistula valley, a shallow aquifer occurrence was noted at the foot of the Warsaw Escarpment [23]. There are two springs near the central campus of UW (marked as UWN, UWS) (Figure 1). Water from the springs was used in the 19th century to supply the botanical garden at the Medical School, and in the 1920–30s for a botanical garden of the Faculty of Medicine of the University of Warsaw, now there is a large green area for recreation facilities called Kazimierzowski Park, which is important to the local community and students from University of Warsaw.

2.2. Methods

The research was aimed at quantitative determination of individual components of the water balance and included the following: analysis of climatic data, field and laboratory studies of the vadose zone, studies of spring discharge rates, and studies of groundwater flow. The scope of research and sources of data are presented in Table 1.

2.2.1. Climate Data Analysis

Climate data were obtained from the Warsaw synoptic station (Station ID: 352200375) and included monthly values for precipitation, temperature, water vapor pressure, number of days with precipitation, and maximum daily totals. The data covered the period from January 2007 to February 2023 [25]. These data were used to determine the distribution of monthly precipitation totals for the last year (March 2022–February 2023) and for the entire period (January 2007–February 2023). Estimation methods based on relationships between precipitation, temperature, and water vapor pressure were used to calculate potential evaporation [28].
The Konstantinov method is based on the diffusion of turbulent water vapor in the surface layer of the atmosphere. It assumes that the intensity of turbulent heat exchange depends on the vertical differentiation of factors influencing evaporation, and on empirical relationships between vertical gradients of air humidity, wind speed over the active surface, and water vapor pressure in the air. These relationships are presented in the form of nomograms adapted to Polish conditions. The Kuzin method, in turn, was developed for regions with annual precipitation ranging from 400 to 700 mm. It is based on air temperature and has been slightly modified to suit Polish conditions [28].

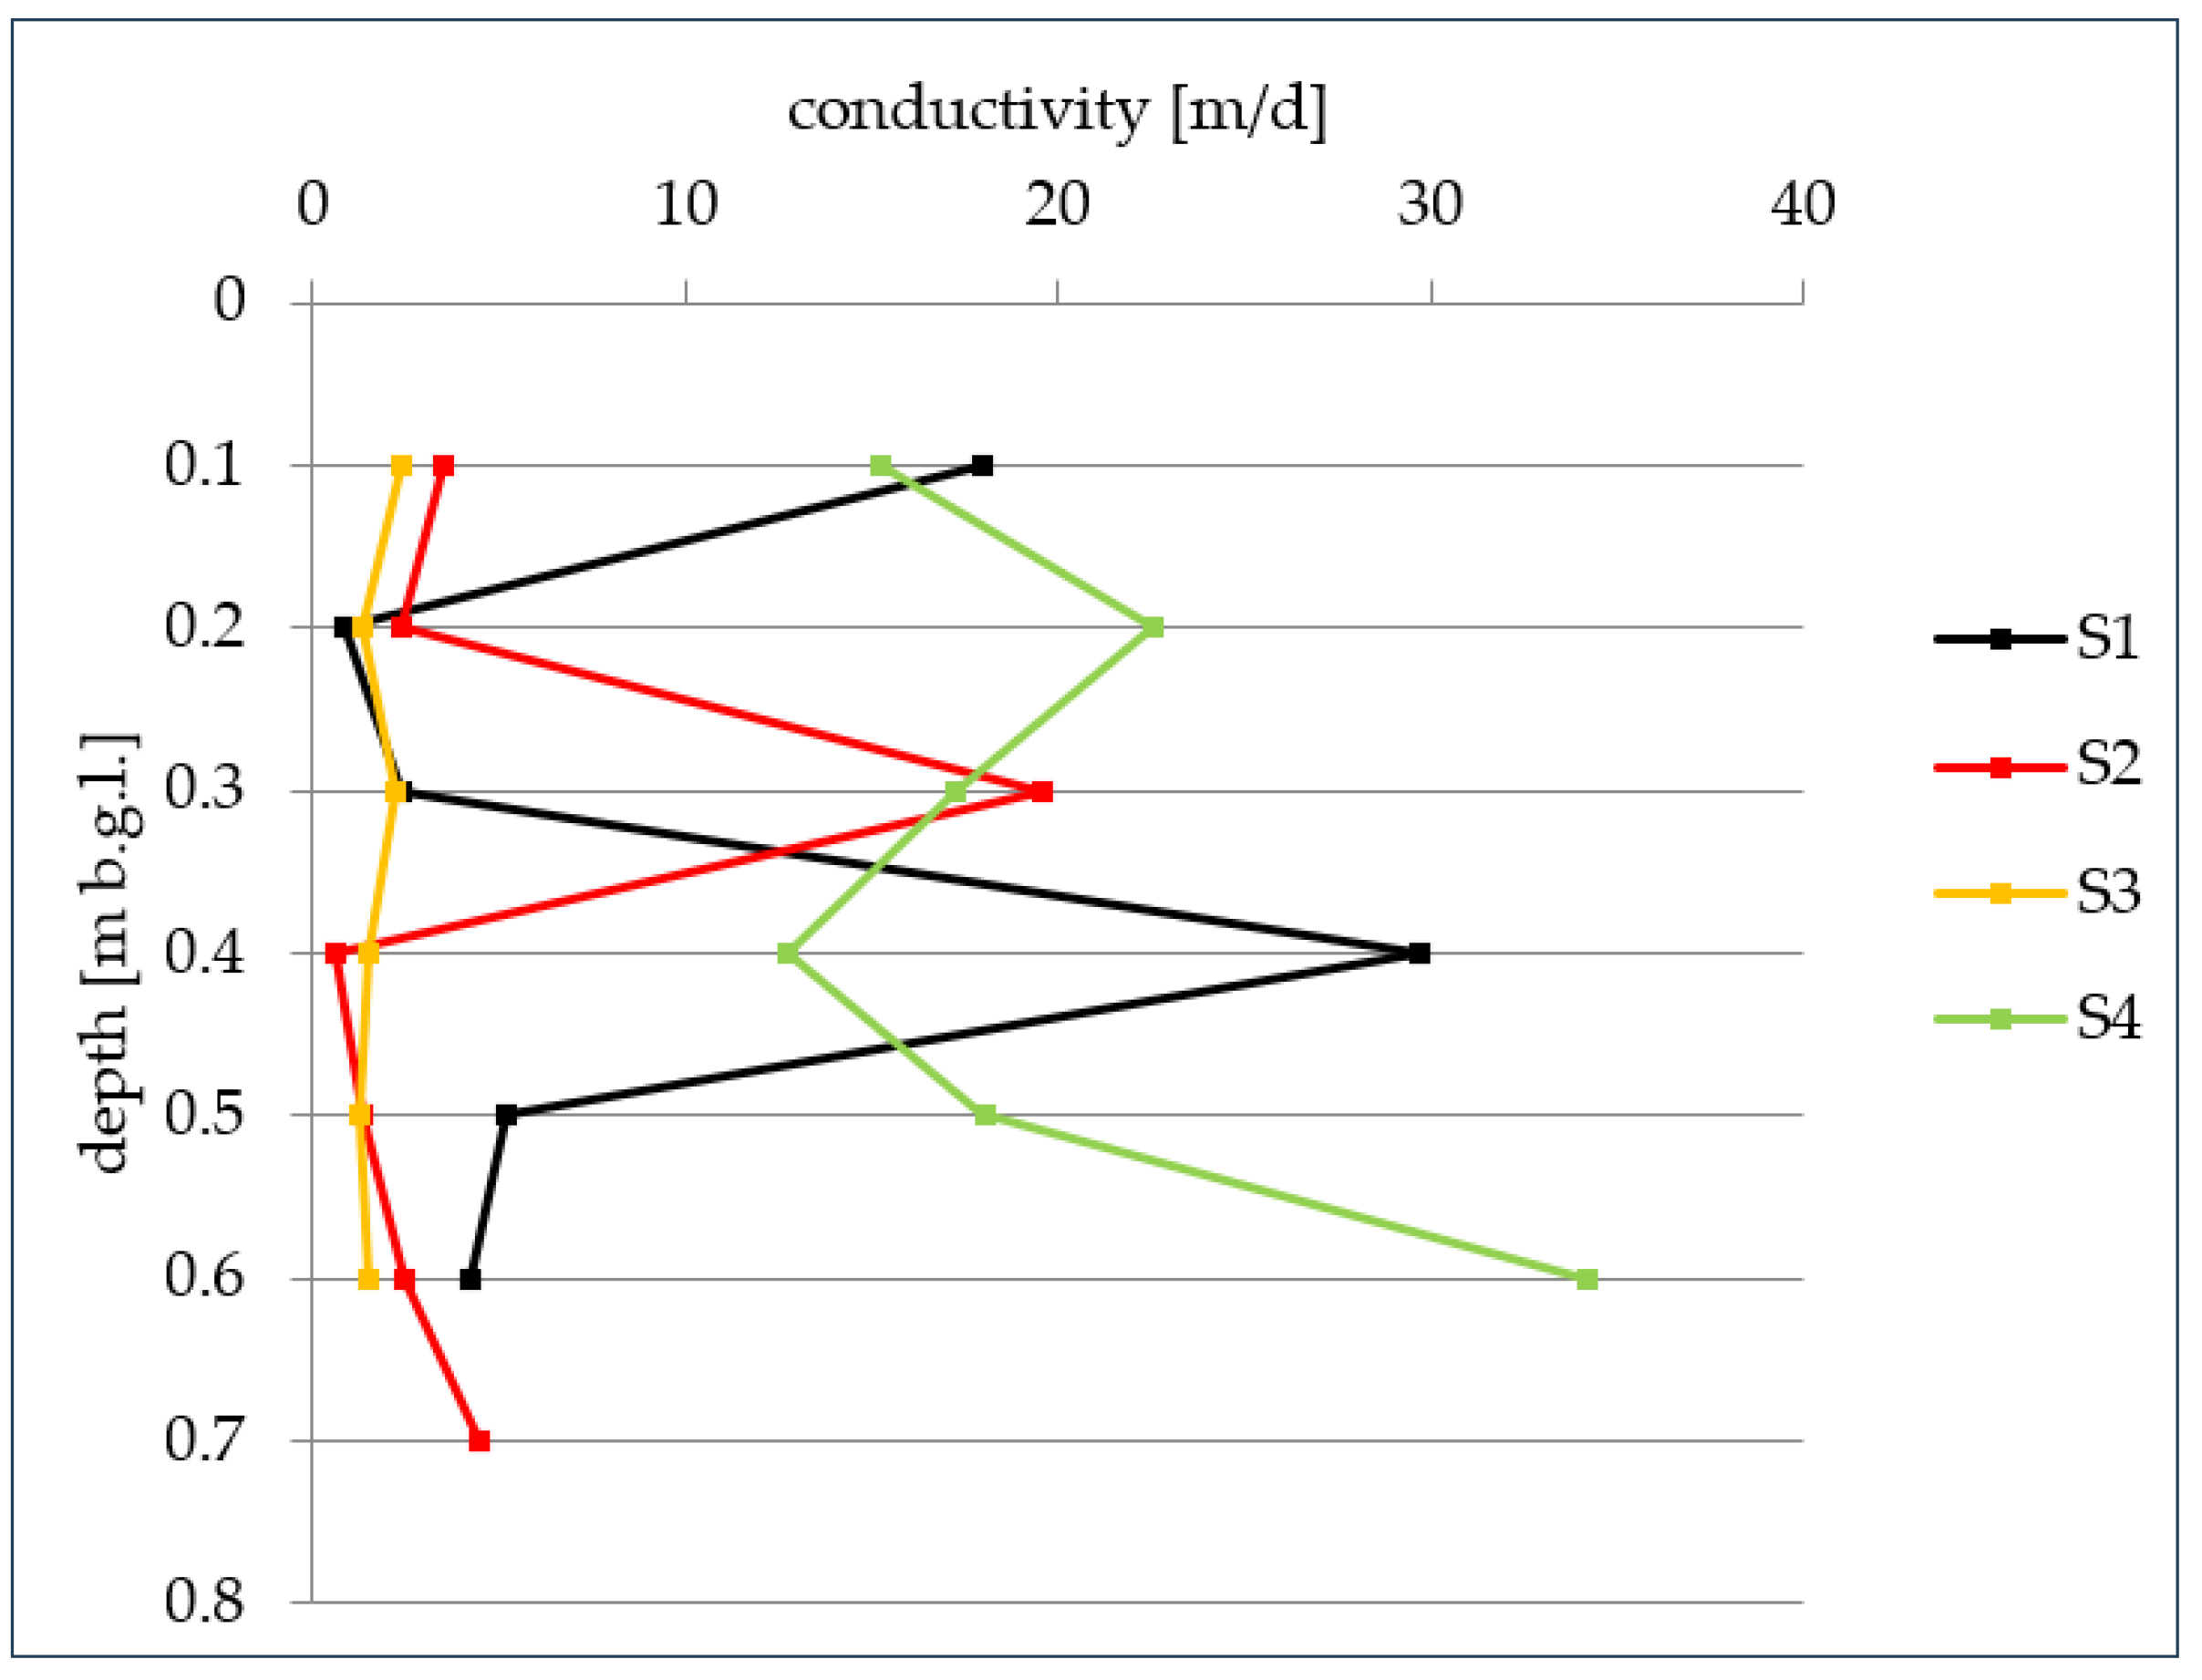
2.2.2. Direct Tests in the Vadose Zone

For laboratory tests, soil samples were taken from four profiles located on the central campus of the University of Warsaw (marked as S1–S4). Samples were taken from a depth of 10 cm to a depth of 60–70 cm in order to determine the soil hydraulic conductivity and its volumetric moisture. The hydraulic conductivity samples were taken using cylinders 40 mm in diameter and 51 mm in length, thus providing samples with a natural structure which were tested with an Eijkelkamp permeability meter. The tests were carried out at a constant gradient of 5.8 to 11.7%. Moisture tests involved collecting a soil sample weighing 200 g and determining the mass of soil with natural humidity and soil dried at 105–110 °C to a constant mass. Laboratory tests were aimed at determining the degree of compliance of the obtained results of moisture tests in the laboratory and in the field, which were carried out in a two-week interval from June 2022 to February 2023.
Field tests consisted in measuring soil parameters with the Wet-150 probe with a handheld reader for spot measurements of soil moisture, temperature, and electric conductivity (EC), at especially prepared measurement points (S1–S4)—a PVC pipe with a diameter of 110 mm and a length of 500 mm with perforations in the walls at a distance of 10 cm. The availability of green areas concerning the presence of underground infrastructure, insolation, distance from the building, lithology, and the location of automatic irrigation systems determined the selection of measurement locations. Spatial changes in the humidity of the near-surface part of the soil at a depth of 10 cm were carried out in 3 sessions, regarding the current meteorological situation, in 116 points located on the central campus of the University of Warsaw. The tests were carried out on 14 July 2022, during the period of high precipitation sums caused by torrential rainfall (storm fronts), on 8 September 2022 after about a month of rainless period, and on 29 December 2022, 10 days after the start of the snowmelt period.

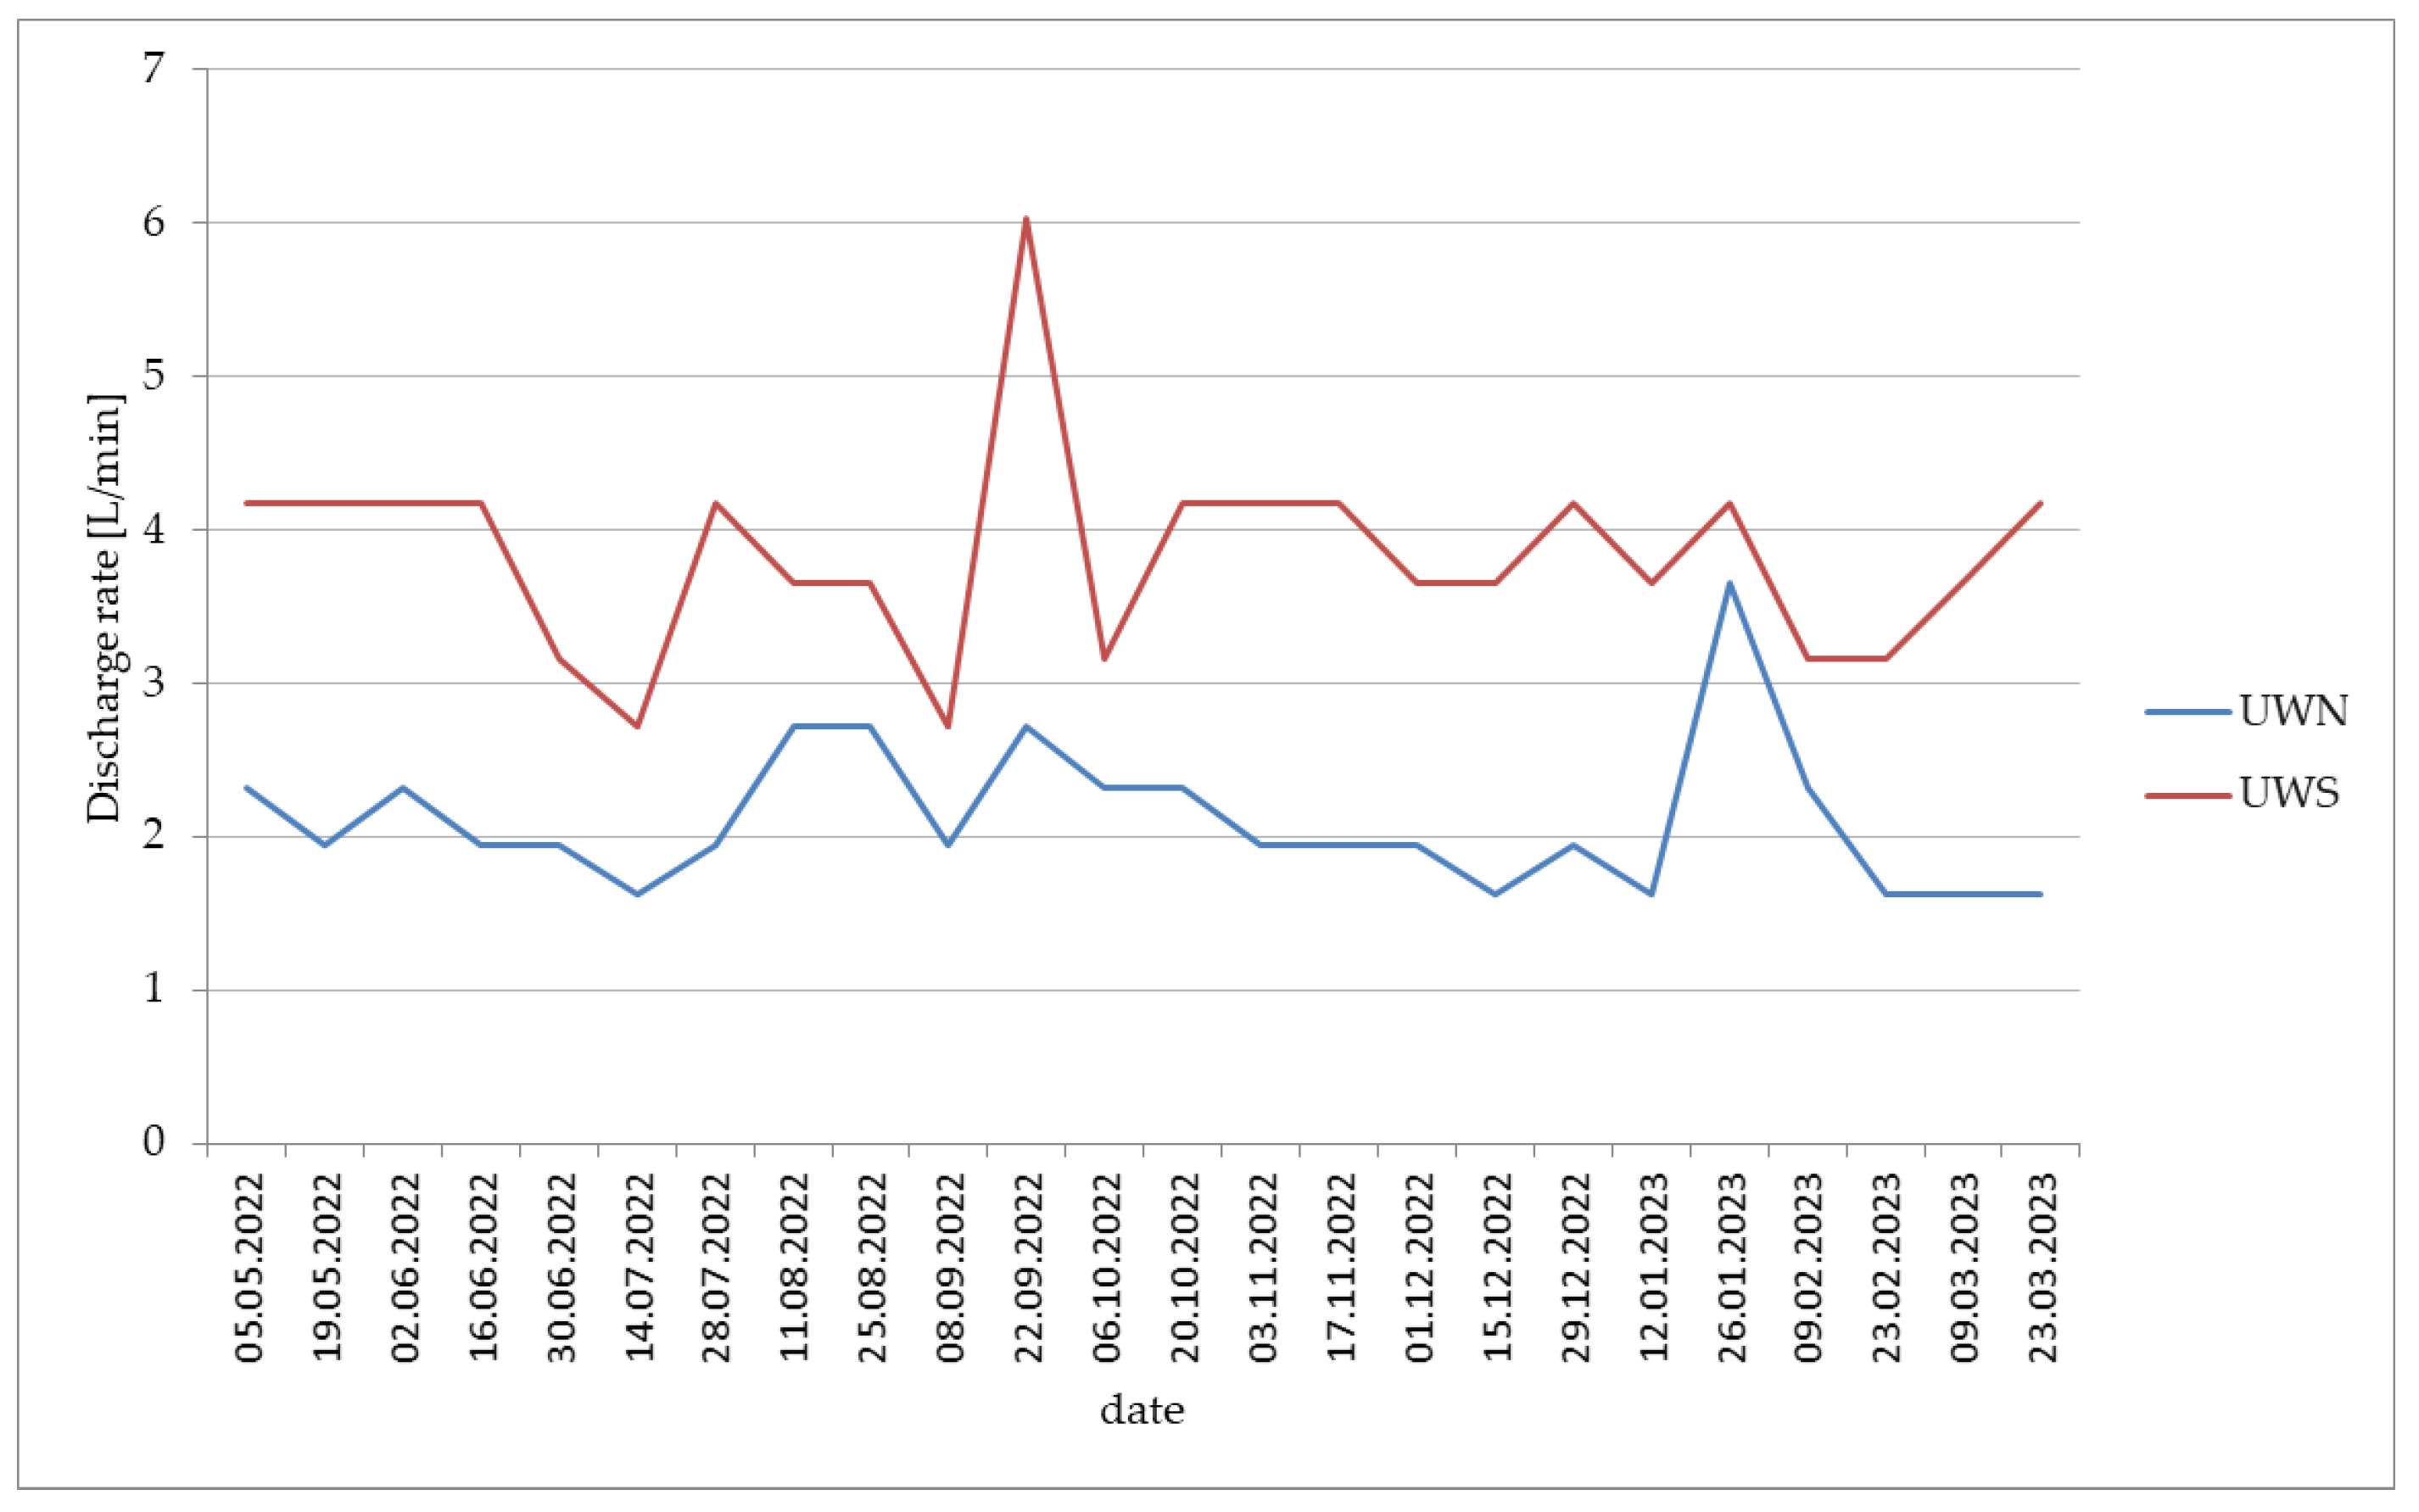
2.2.3. Spring Research

Simultaneously to the research in the vadose zone, in a two-week interval from May 2022 to February 2023, research was conducted on the discharge rate of springs located below the escarpment (marked as UWN—North Spring of University of Warsaw, UWS—South Spring of University of Warsaw). The measurements were carried out using the Poncelat method. Due to the low rate of both springs, the verification was carried out using the volumetric method. Cyclic studies of spring discharge were used to determine the alimentation area, which indicates the spatial extent of the aquifer after determining the recession coefficient according to Maillet’s formula [29]:
q = q0e−αt
where q0—initial discharge of the spring at starting time t0; t—time duration, in days, since the time t0; q—water discharge of the spring at time t; e—base of the Napierian logarithm; α—recession coefficient.
Defining the alimentation zone for springs is important in the context of MAR deployments to ascertain their effectiveness. At this stage, it is important to recognize the baseline condition. The results of direct spring surveys were used in the construction of the groundwater model as part of the model verification, with the aim of mapping flow conditions as close to real conditions as possible [30].

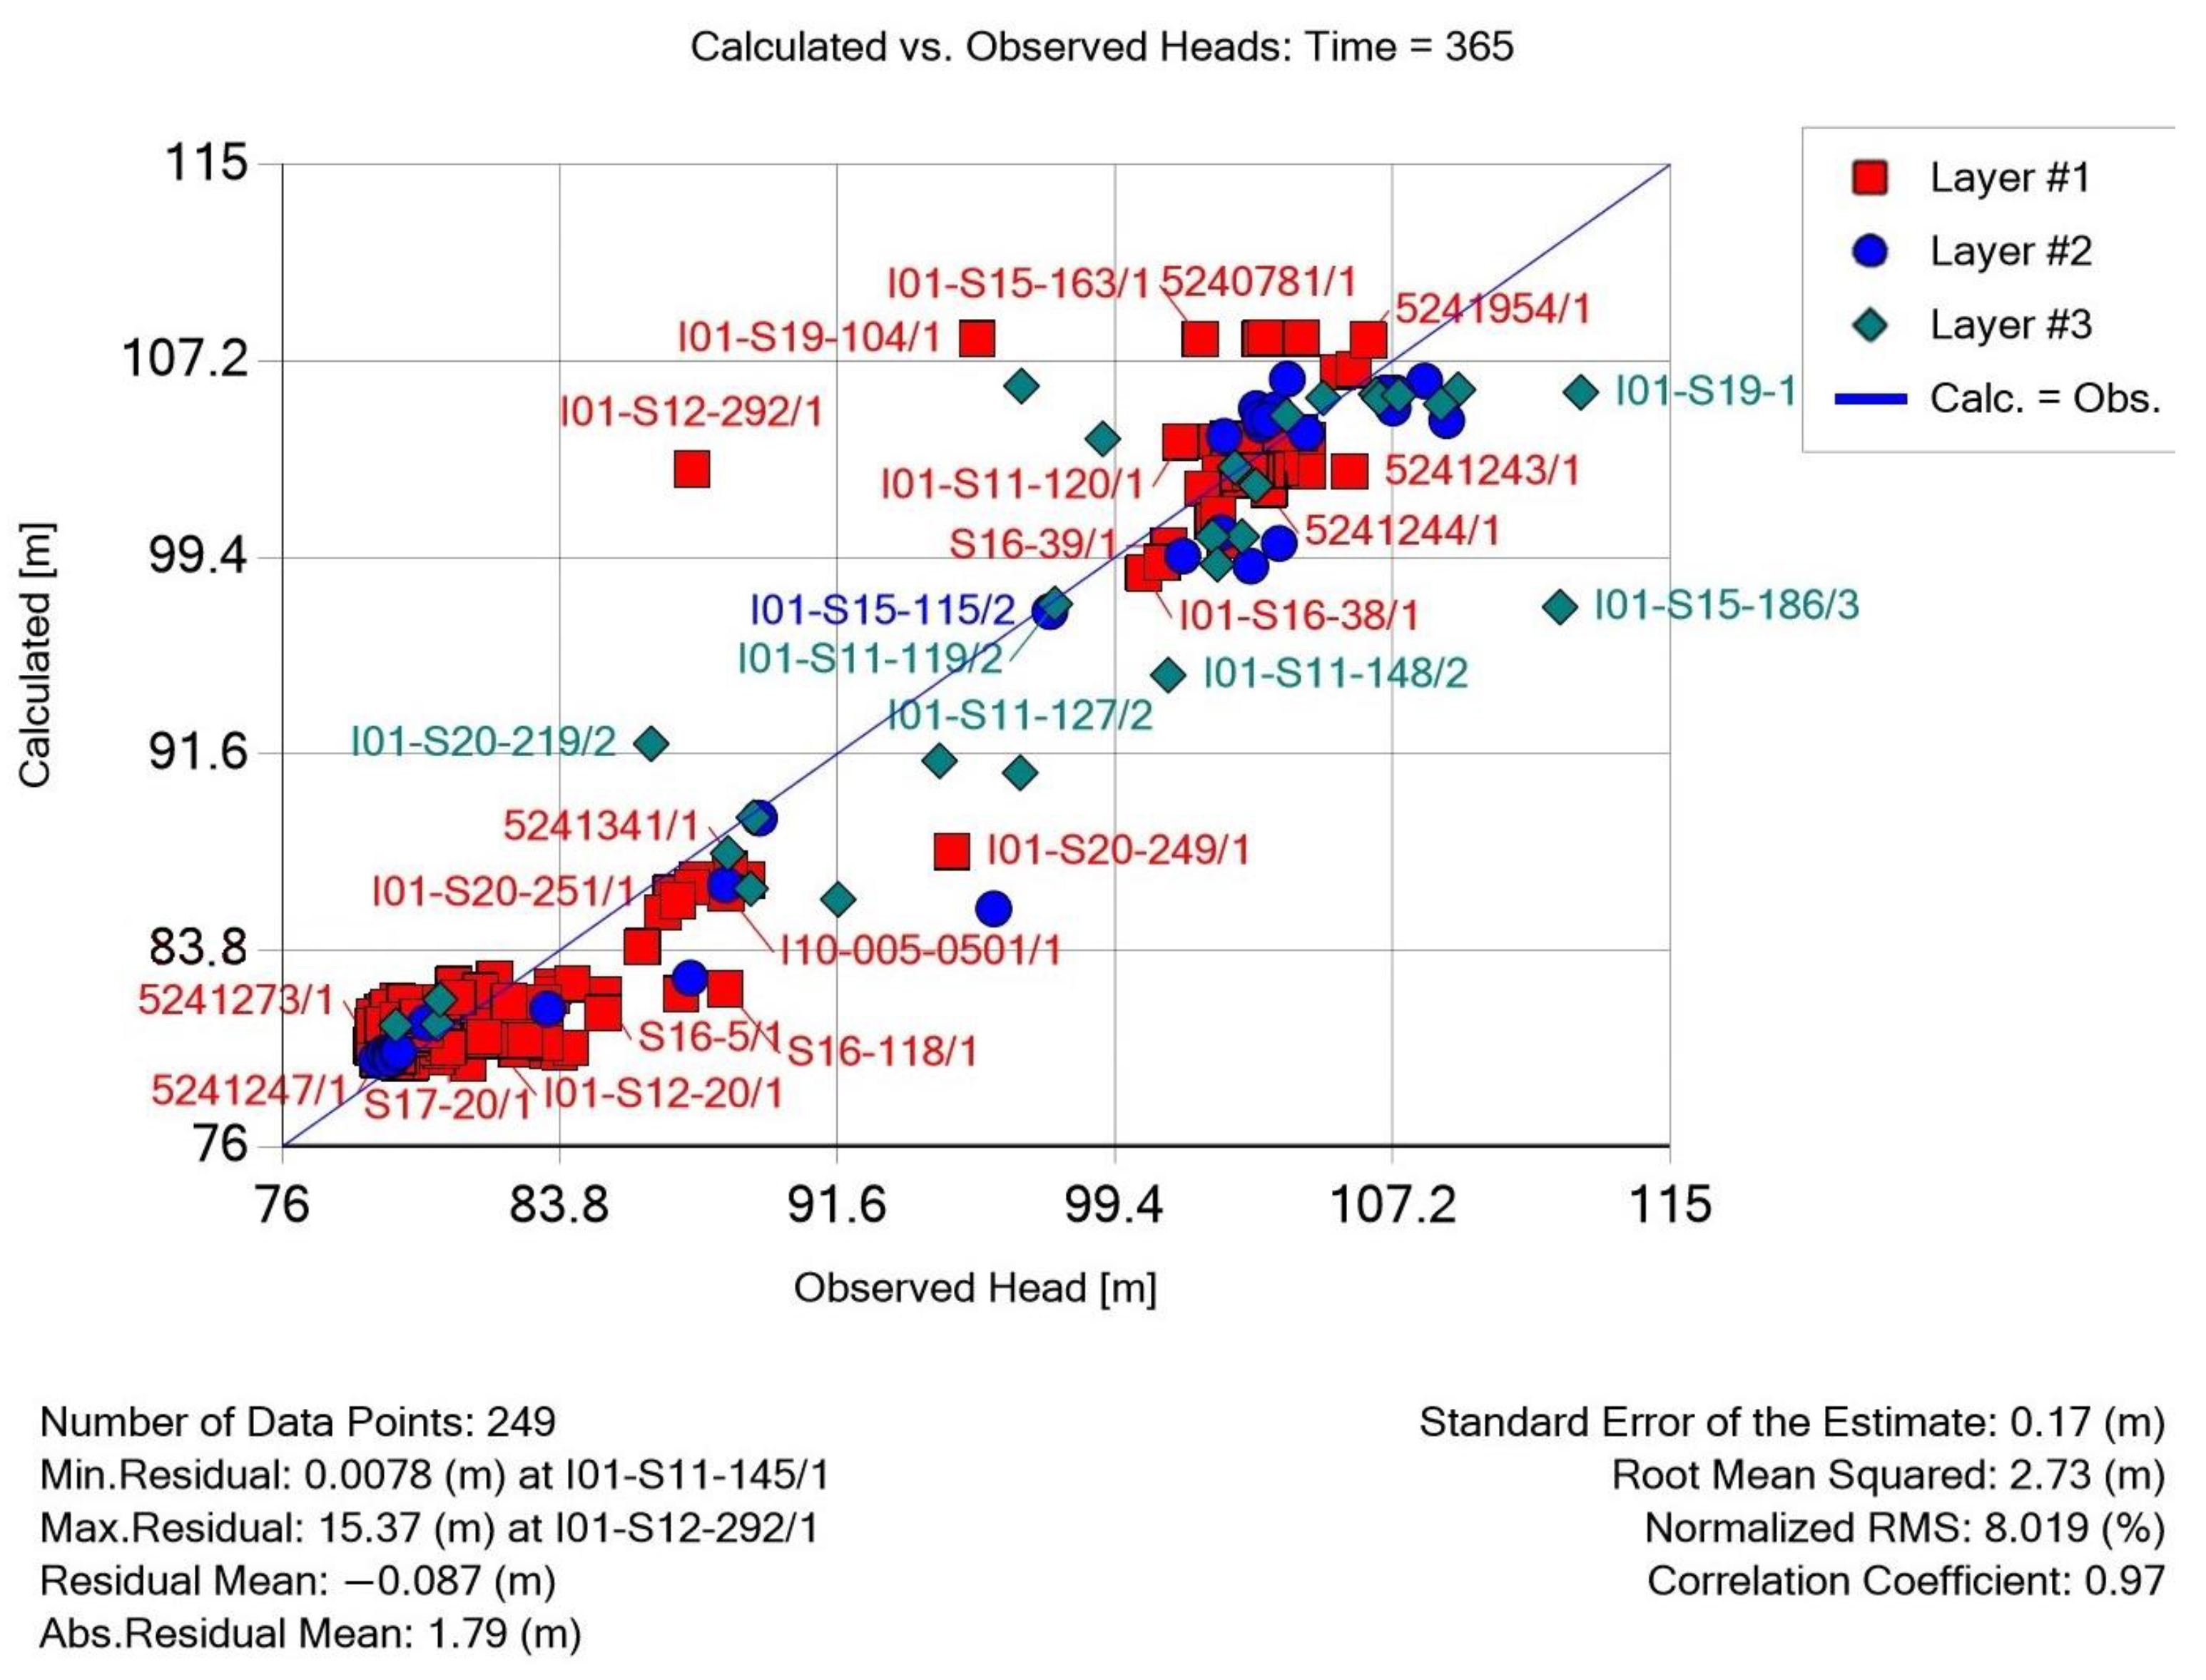
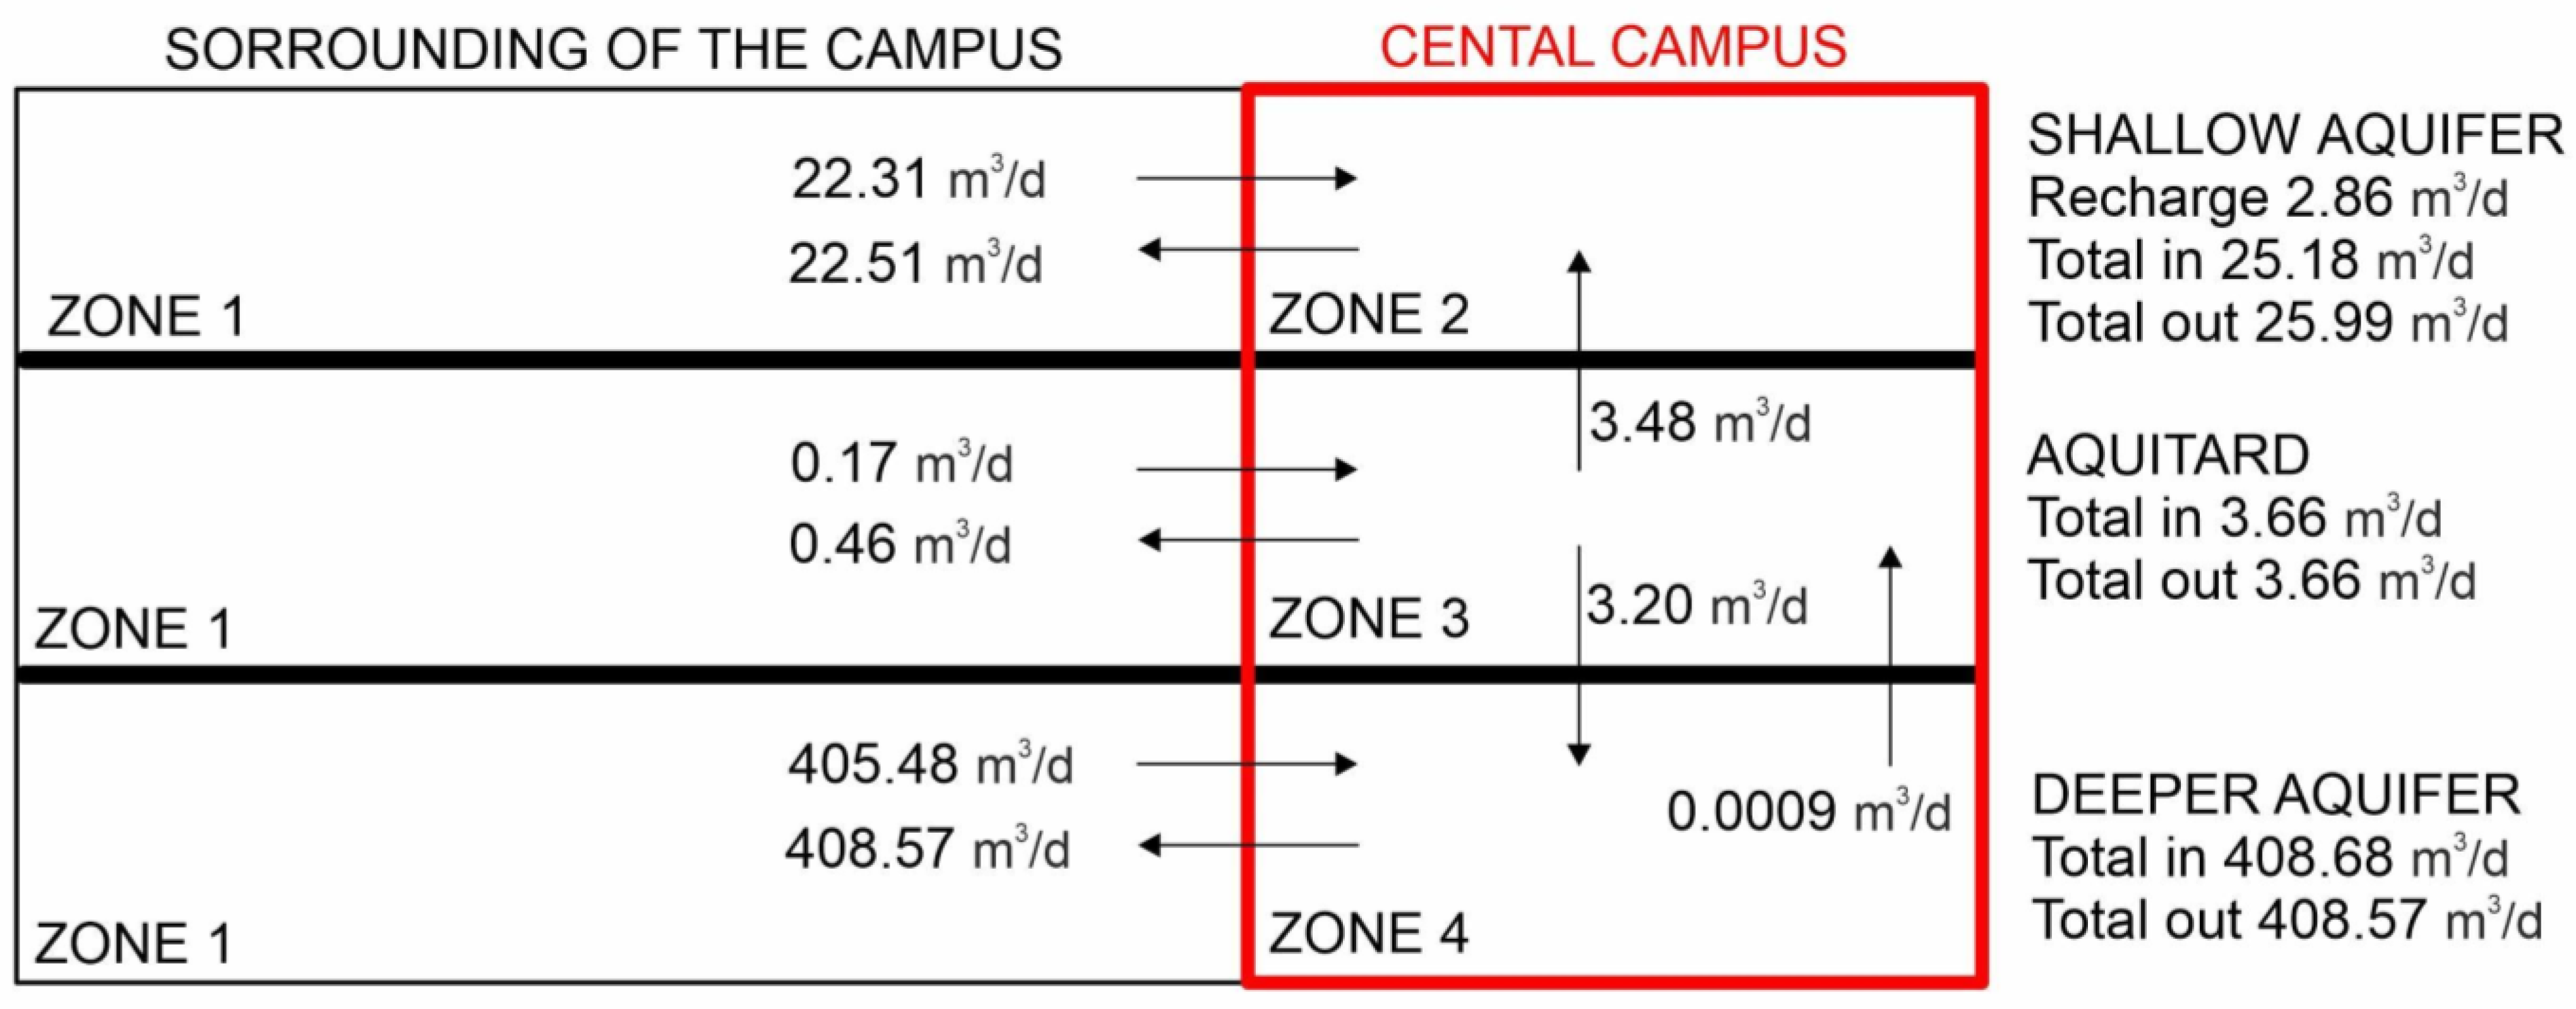
2.2.4. Groundwater Modeling

Model tests were carried out in the Visual ModFlow Flex 7.0 program, based on the finite difference algorithm [31]. The model was developed under steady-state conditions, defined as the average annual state. The objective was to estimate rainwater infiltration in the urban environment, particularly within the boundaries of the University of Warsaw’s central campus.
The conceptual model was developed based on hydrogeological data, which enabled the identification of a segment of the groundwater circulation system in downtown Warsaw. Groundwater circulation took place in the shallow Quaternary sediments, locally in Neogene and in the deeper aquifer, which was defined as a minor usable aquifer on the Hydrogeological Map of Poland at a scale of 1:50,000 [23]. The lateral boundaries of the model were defined as follows:
  • east: along the Vistula,
  • north, west, south: artificial boundaries along major streets.
The upper surface of the model research object is the groundwater table of the shallow aquifer, which is unconfined in most of the area. The lower boundary surface of the model was adopted as the floor of the second aquifer. This surface is characterized by significant denivelations of 66 m from 28 to 94 m a.s.l., which correspond to depths from 18 to 65 m b.g.l., and IS inclined towards the north-east.
The exchange of water with the surroundings of the system takes place as a result of the following:
  • recharge and evaporation rate from the groundwater table in places where it is shallow,
  • groundwater inflow from the south and through the boundary (lateral inflow to aquifers),
  • direct drainage by the Vistula river,
  • lateral outflow of groundwater to the north.
The area was divided into square calculation blocks with the size of Δx = Δy = 5 m, 303 rows and 437 columns, and the number of active calculation blocks was 76,440. The discretization of the area in the vertical direction included 3 layers, including both aquifers described in the cartographic materials of the area [23], noting that the shallow aquifer may be locally discontinuous, which is mapped by a lower value of the hydraulic conductivity. Vertically, the model included three layers:
  • first: shallow aquifer,
  • second: glacial tills, clays, and silts as an aquitard layer, in the Vistula valley this level disappears, and the shallow and deeper aquifer are merged,
  • third: Quaternary, deeper aquifer.
Layer thicknesses were based on borehole data from the Central Geological and Engineering Database (CBGI) and the Central Hydrogeological Data Bank (CBDH) [24].
Due to limited data on hydraulic conductivity, the following initial values were assumed: 1 m/d for the shallow aquifer, 10 m/d for the deeper aquifer, 0.001 m/d for the aquitards, with isotropy in the x and y direction, for z-direction assumed values were one order lower.
The rate of the infiltration recharge was mapped using the II type boundary condition (Q = const.). The amount of recharge was assumed to be in the range from 0 to 130 mm/year, taking into account the amount of average annual precipitation from the period of January 2007–February 2023, the infiltration rate depending on the lithology of subsurface formations, and the surface runoff coefficient depending on the type of surface and the degree of its sealing.
In the study area, there is no groundwater intake from wells, but there are two springs in the vicinity of the central campus of the University of Warsaw, which were mapped as the II type of boundary condition with a known discharge rate, calculated as average from own measurements.
The boundary condition of the III type was the drainage through watercourses and the lateral inflow through the boundaries of the model. The condition of the third type of the RIVER type was set for the model cells simulating the Vistula River as the lateral boundary. The condition of the III type—General Head Boundary (GHB)—was used to map the vertical boundaries of the model along a separate fragment of the groundwater circulation system. After the hydrogeological analysis, it was found that the boundaries of the modeled area are open to water exchange with the surroundings from all sides for both aquifers.

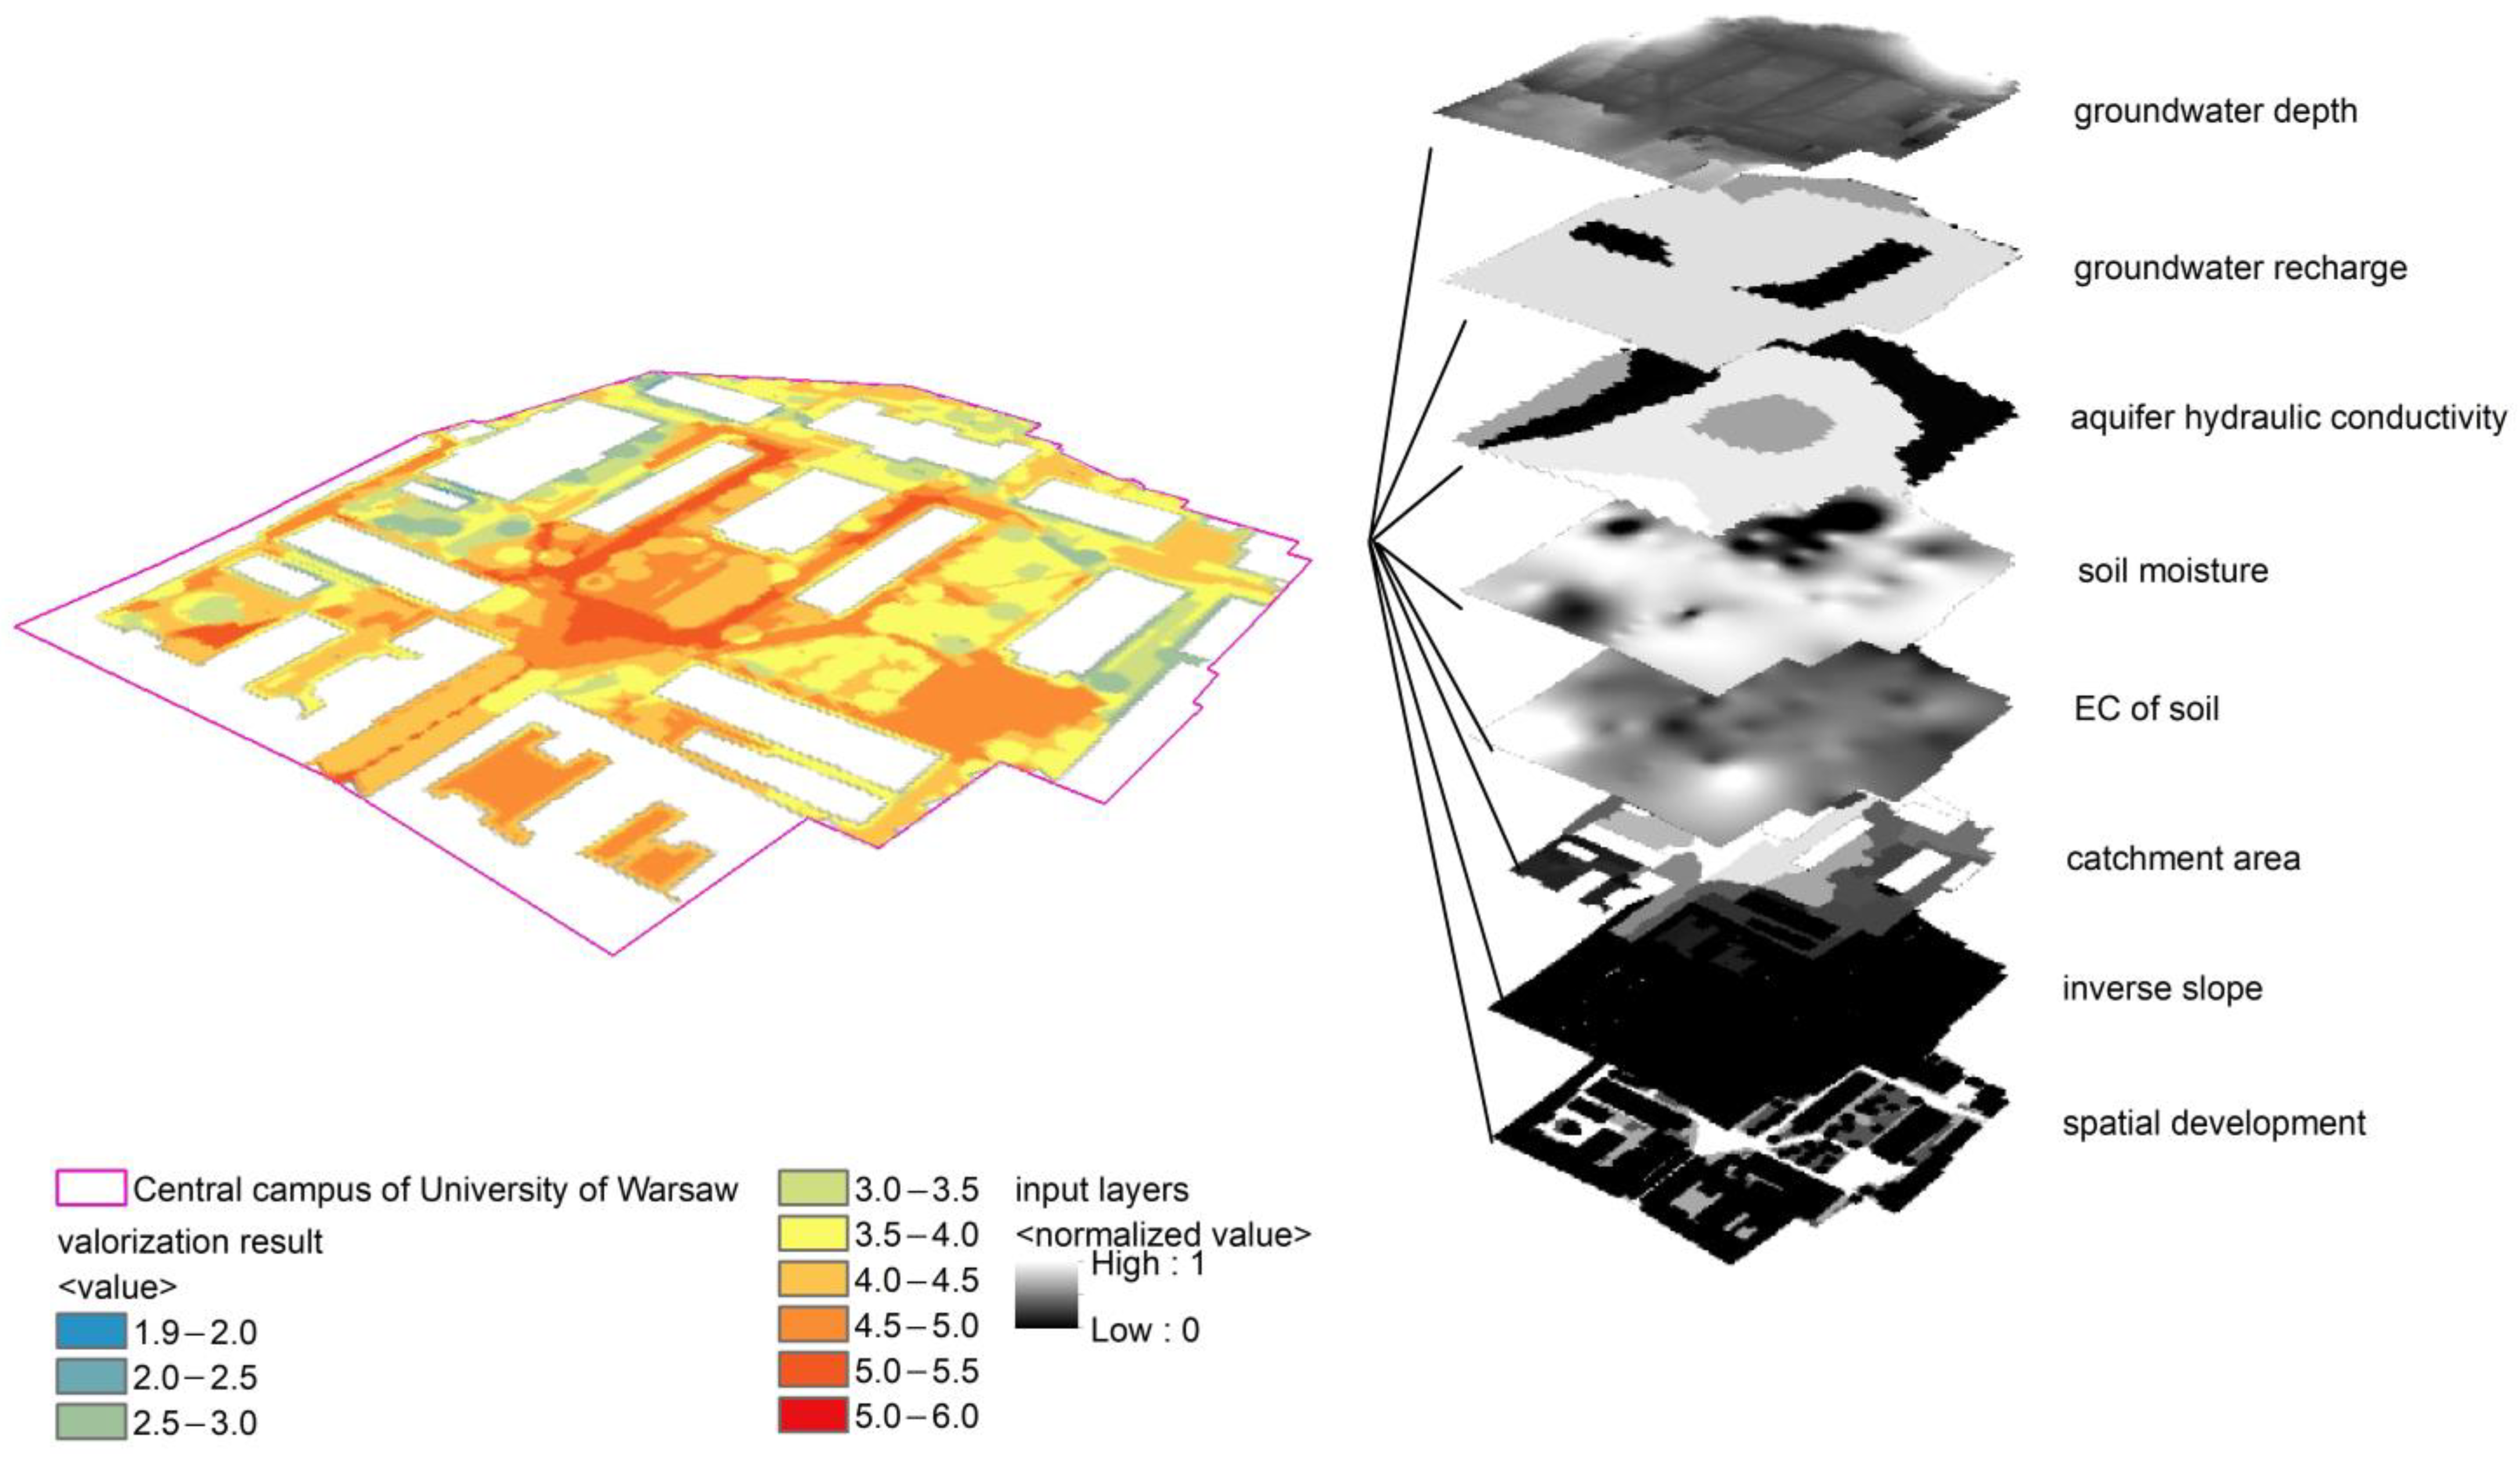
2.2.5. A Valorization of the Study Area for Temporary Retention of Rainwater in the Vadose Zone

A valorization of the study area was conducted using multi-criteria analysis (MCA) to identify locations suitable for the installation of facilities for temporary rainwater retention in the vadose zone. The collected data were used to prepare eight computational layers, each expressed numerically to minimize subjectivity in assigning values to qualitative features. From the perspective of hydrogeological characteristics relevant to planning and enhancing water retention, the following factors were considered:
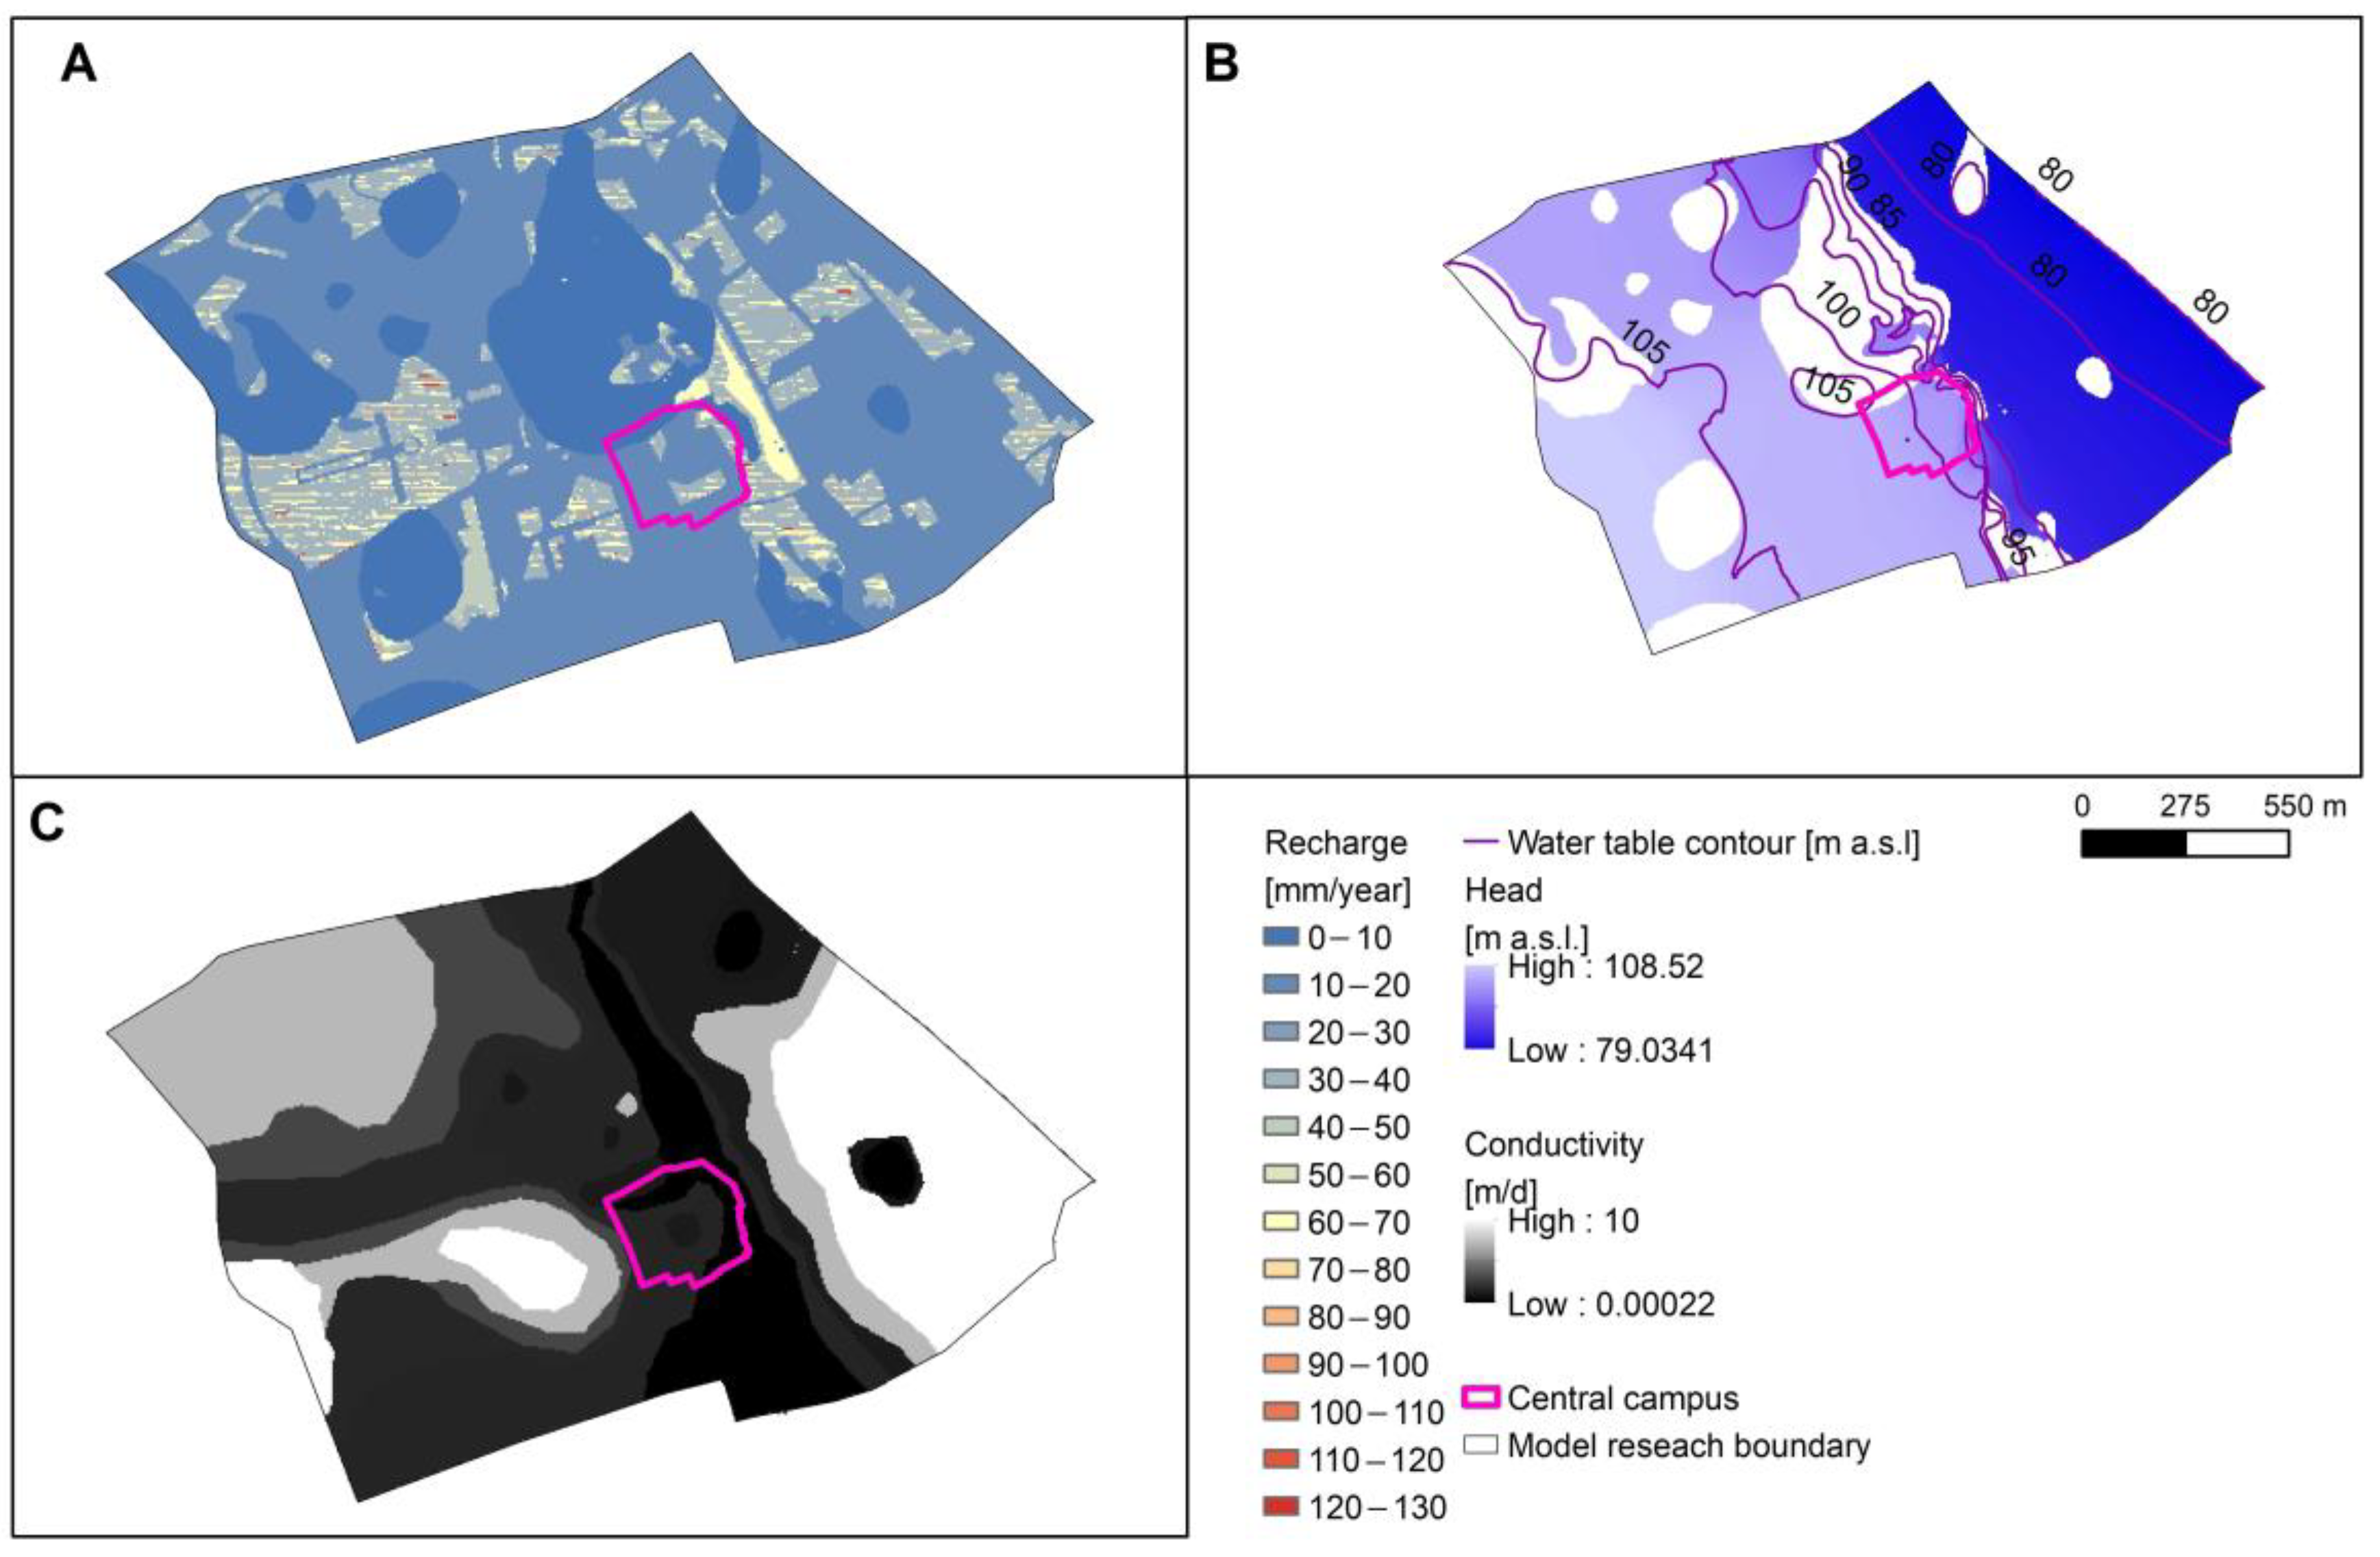
  • Data from the numerical flow model: depth of groundwater occurrence in the first aquifer, where the greater thickness of the vadose zone allows underground retention facilities to be sited without the risk of overflowing due to lack of drainage into the ground; magnitude of infiltration recharge—where the occurrence of areas of low recharge allows additional water to be introduced; hydraulic conductivity—where the occurrence of areas of high permeability also allows rapid infiltration into the water table;
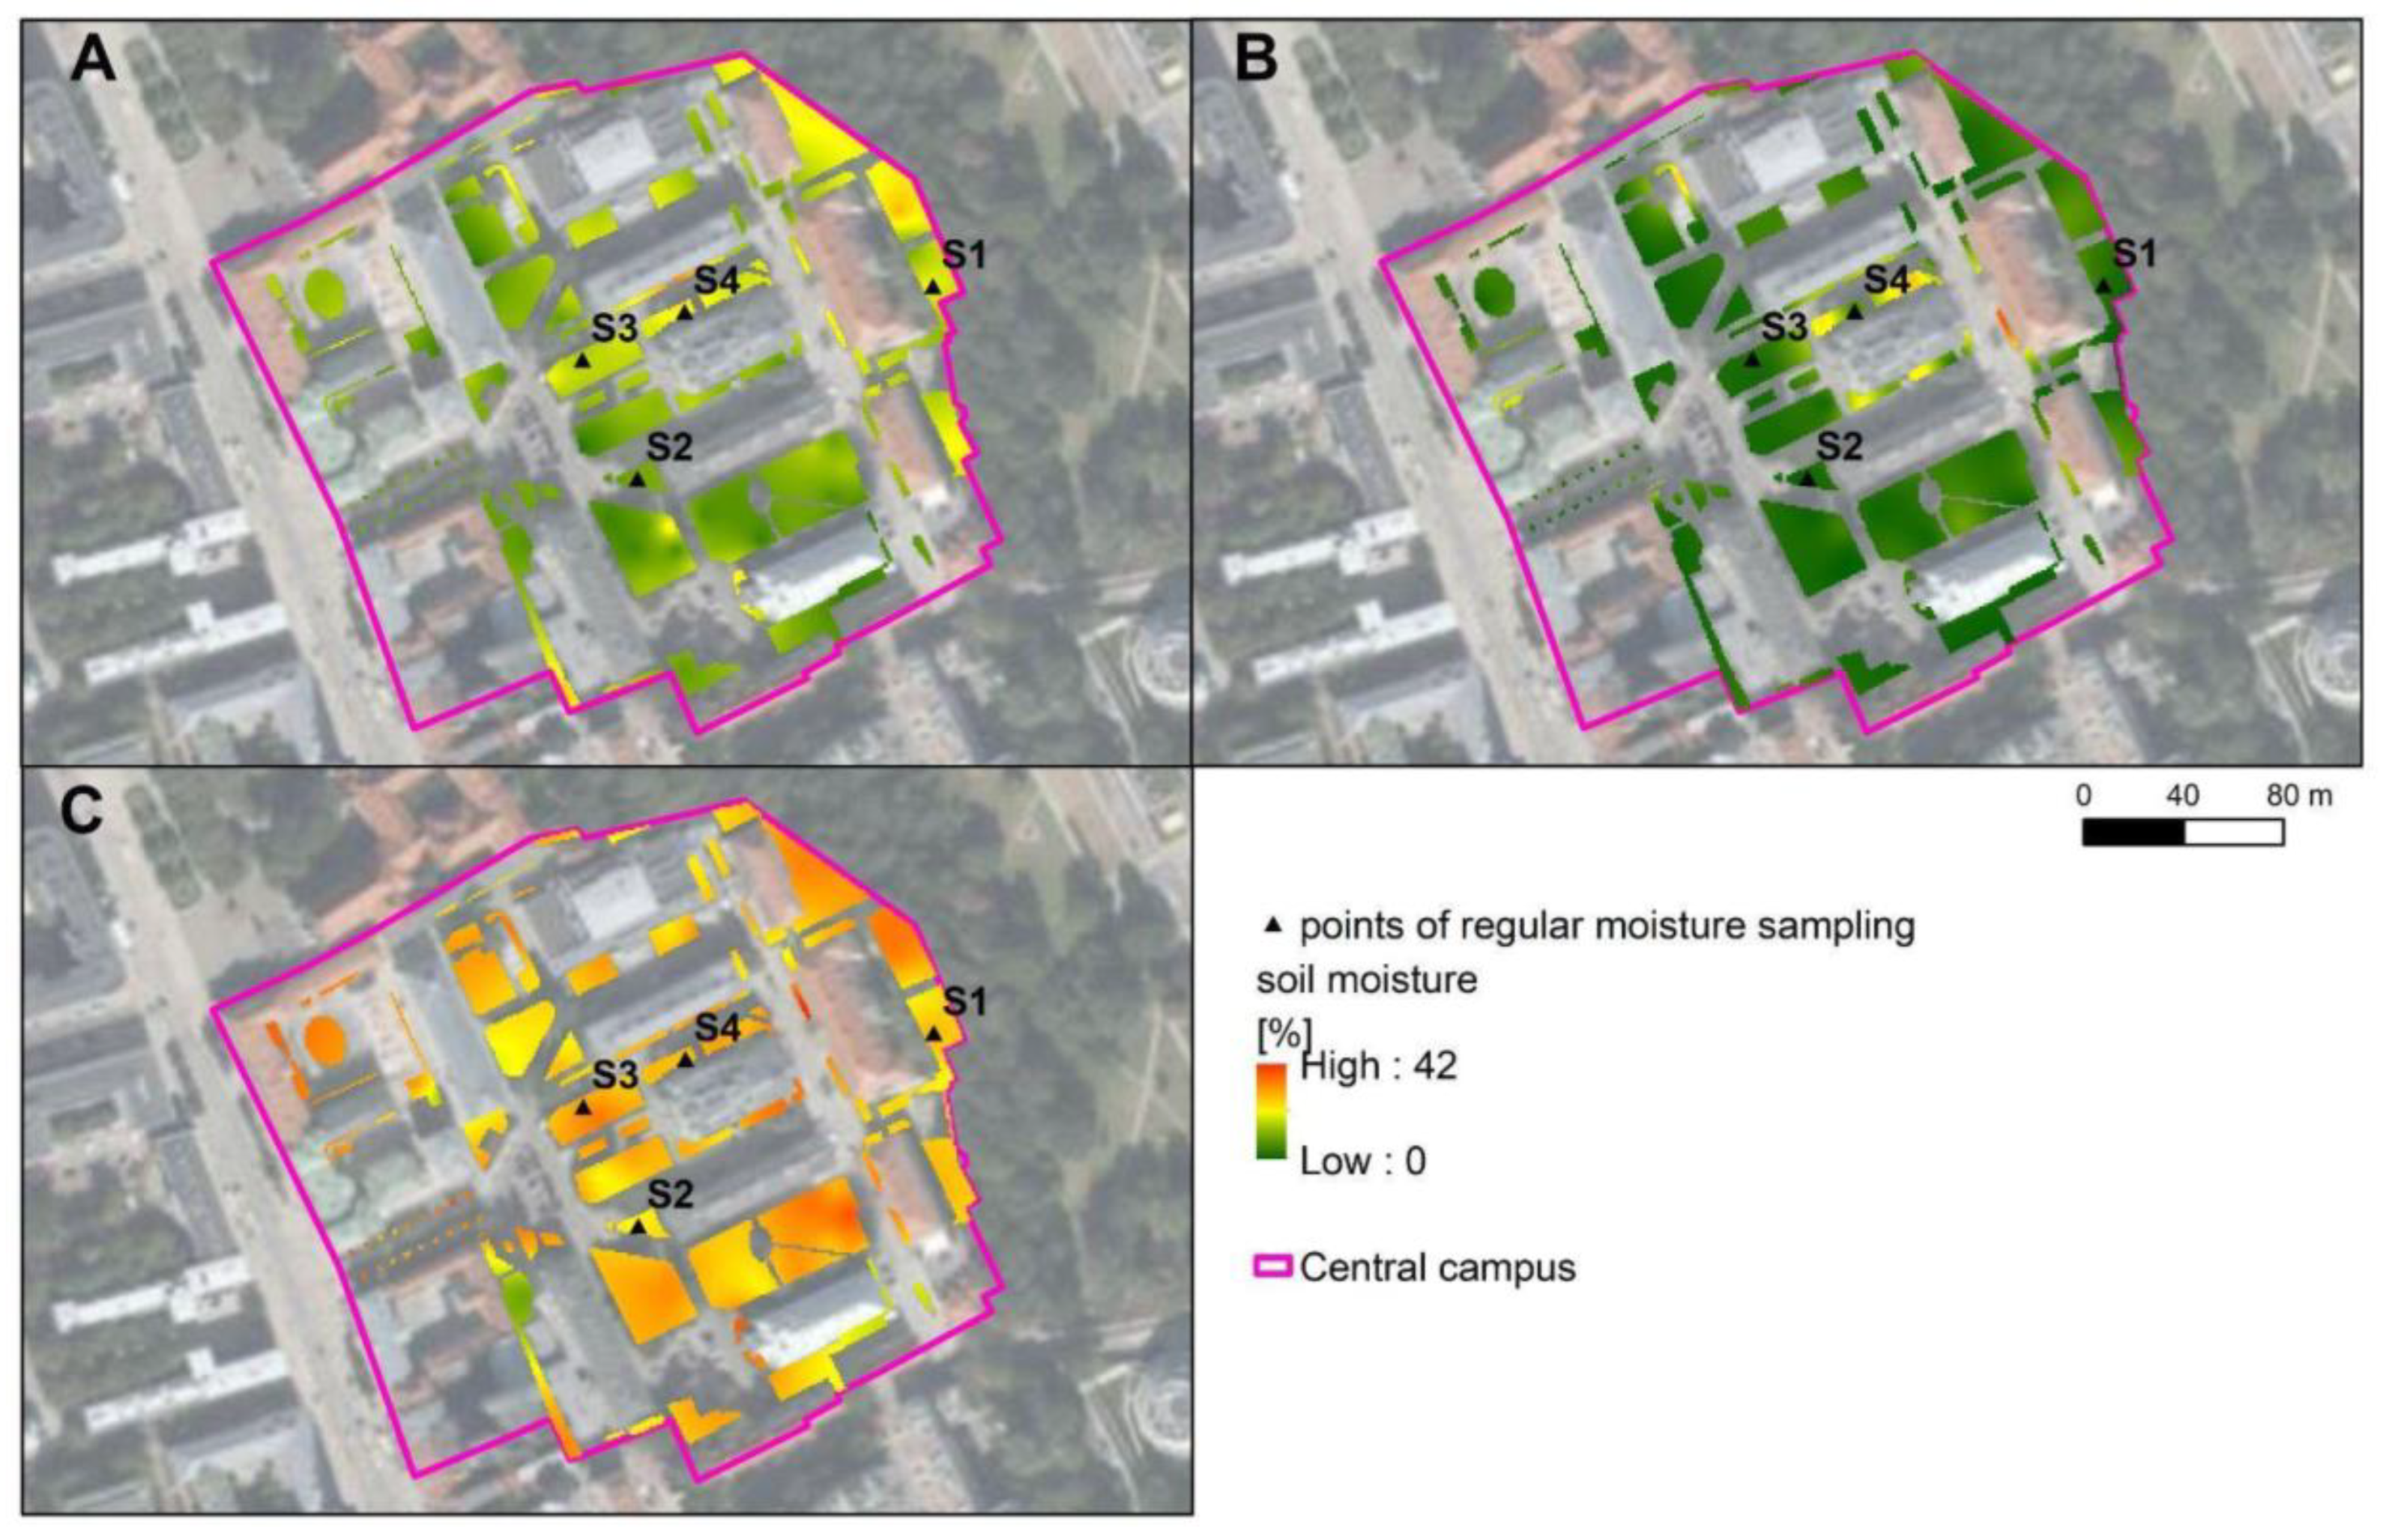
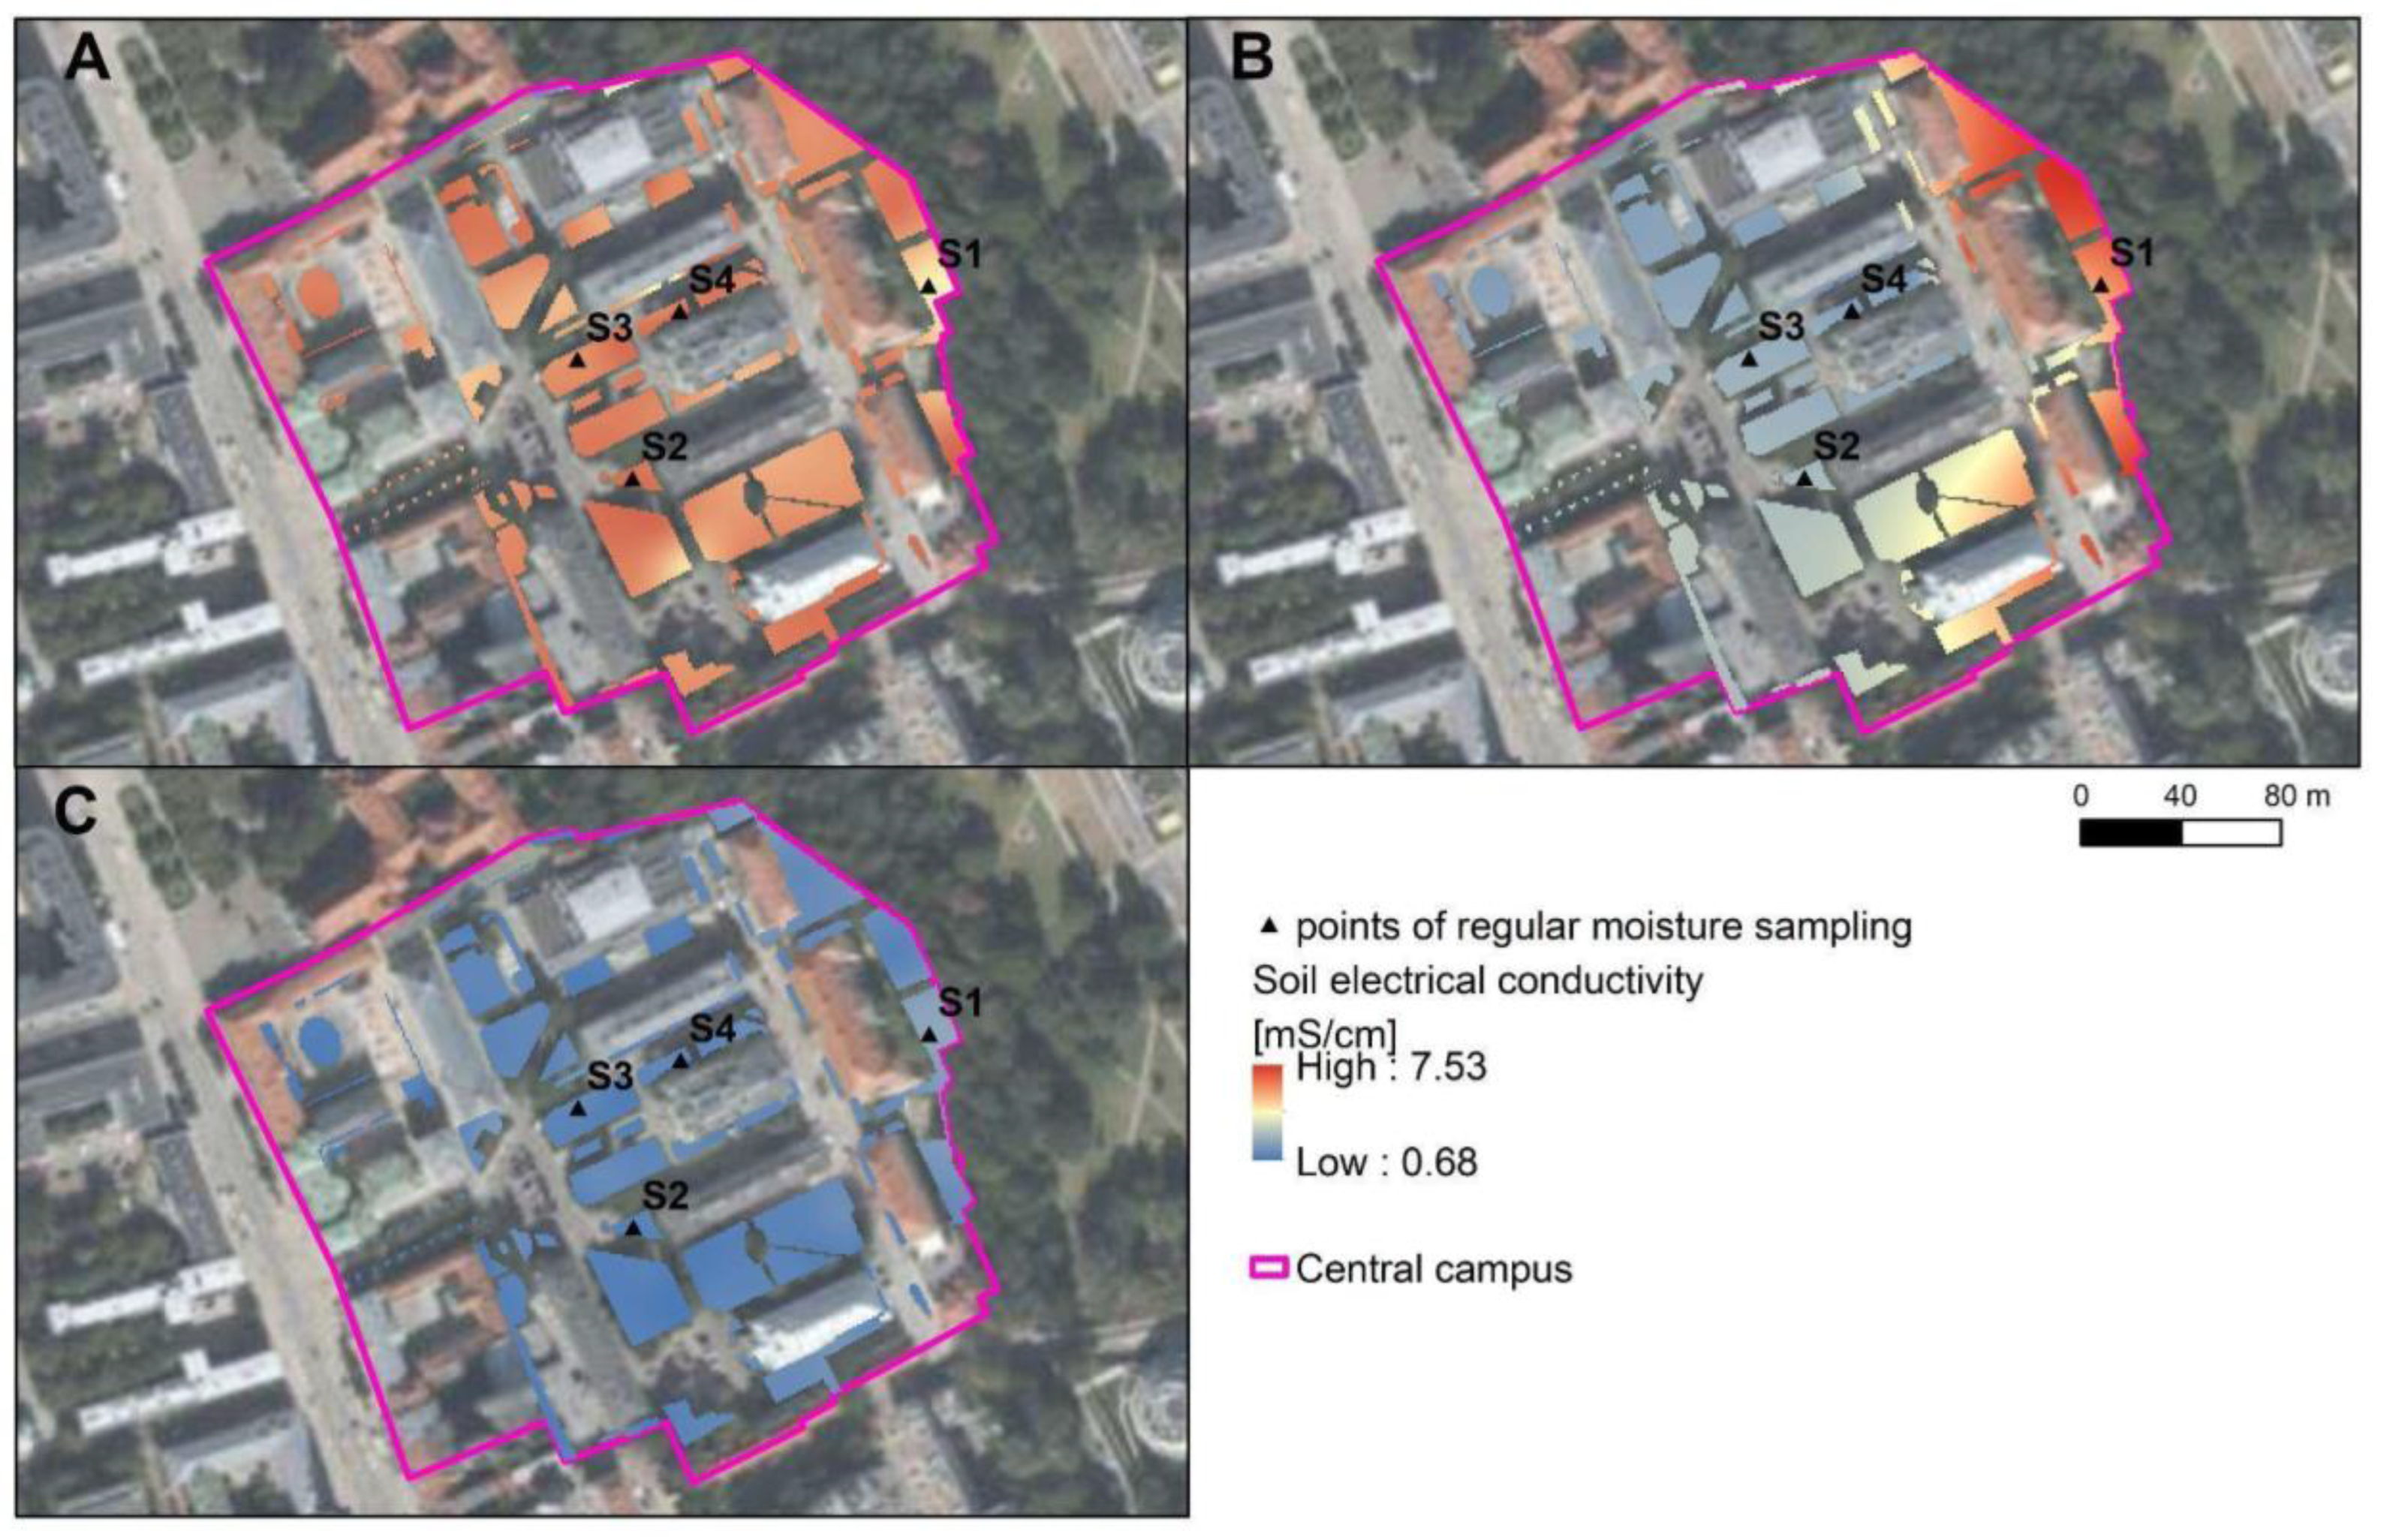
  • Field observations in the vadose zone: vadose zone moisture content—preferred areas for the location of retention facilities where moisture content during the rain-free period was lowest; soil electrical conductivity—preferred areas where the EC of the soil solution was lowest immediately after snowmelt, meaning that conditions in the soil profile were favorable for infiltration;
  • Data from the DEM [26]: artificial catchment area—based on the location of combined sewer manholes, larger catchments were prioritized to maximize runoff reduction; slope—an inverse slope procedure was used to identify the areas with the least slope that would be preferred for the location of retention facilities;
  • Land use data from satellite imagery and field observations (Airbus, CNES/Airbus, MGGP Aero, Maxar Technologies (Westminster, CO, USA), Data Maps, Google, 2023): land use—the procedure for preparing the layer consisted in identifying the areas where retention facilities cannot be located, so buildings were excluded from the analysis, their immediate vicinity up to 3 m and areas up to 5 m from trees were considered the least desirable, while the remaining green areas were considered less preferable for location than pavements and asphalt surfaces, under which the provision of an adequate foundation depth guarantees the protection of the facilities from the impact of static and dynamic stresses on the ground surface.
All numerical values in the layers were normalized, assuming that their weights are equal. The final index was calculated as the sum of normalized values, ranging from 0 to 8, where 8 indicates the most favorable area for retention facility placement.
Σ i = 1 8   x N = Σ i = 1 8   ( x x m i n x m a x x m i n ) ,
where xN—normalized value of parameter; x—value before normalization; x m i n —minimal value; x m a x —maximal value.

2.2.6. Soakaway Crates

Soakaway crates were selected as the recommended solution for the study area. These devices were chosen for their general advantages: ease of installation, moderate purchase and installation costs, considerable capacity (single up to 400 L) and, above all, the possibility of installing them in areas of high housing density without having to exclude the area from other forms of use, as well as the possibility of installing them in conservation zones. The required rainwater storage volume was calculated based on the design rainfall intensity, which considers both duration and frequency. The formula used is
q = A t 0.667
where q—intensity of rain [dm3/(s·ha)]; t—duration of rain [s]; A—coefficient depending on the probability of rainfall and the average annual rainfall amount. A rainfall probability of 5% was assumed, meaning that rainfall of this intensity or greater occurs once every 20 years and lasts at least 20 min. These assumptions are based on Polish legal standards [29].

3. Results

3.1. Climate Data Analysis

The analysis of precipitation data and calculations of potential evaporation were carried out in order to indicate the periods in which the effective infiltration of water through the soil profile would be possible. It is also important to refer to the average values of climate data over a longer period to determine whether the year in which the observations were made was too specific to draw general conclusions from climate data. For the period from March 2022 to February 2023, the total precipitation amounted to 458 mm, which is lower than the average from the period of January 2007–February 2023, set at 506 mm/year. Anomalously low monthly rainfall totals occurred in March, August, and November 2022–they were lower by approximate −50% than the average monthly rainfall. Higher monthly precipitation totals were recorded only in July, December, January, and February (higher than average by 2 to 11 mm). The maximum daily sum of precipitation in the summer months indicates a significant share of heavy precipitation in the month—in June and July 22–23% and in August as much as 43%. The second climatic component directly determining the amount of recharge is evapotranspiration, which was determined as potential by the method of Konstantinow and Kuzin, and the average monthly value was used for the analysis. The analysis of data for this period presented in Figure 4 shows that in March, May, June, August, and October, potential evaporation exceeded the sum of monthly precipitation—the largest difference concerned June and August, when the deficit was 81 and 86 mm. December and January were the most favorable months for water infiltration, when a positive balance of 38 and 22 mm, respectively, was recorded.

3.2. Direct Tests in the Vadose Zone

The assessment of the soil permeability was performed in order to determine the retention capacity, and the potential for infiltration of the shallow aquifer. Macroscopic analysis revealed that up to a depth of 0.7 m, there are anthropogenic soils of various granulations, mostly clay sands with fragments of rubble and bricks. Laboratory tests of hydraulic conductivity indicate a relatively low permeability of the soil. The lowest values and small vertical variation in hydraulic conductivity are shown by the S3 profile (average 1.71 m/d), in S1 and S2, values are slightly higher, usually ranging from 0.88 to 5.16 m/d, average 2.35 m/d. Much higher values occur at points in S1 at a depth of 0.1 and 0.4 m, in S2 at a depth of 0.3 m, ranging from 17.93 to 29.75 m/d. Significantly higher permeability occurs in the entire S4 profile from 12.74 to 34.18 m/d, on average 19.98 m/d. All results from laboratory tests are presented in Figure 5. The relatively low permeability of the soil and, at the same time, the high variability of hydraulic conductivity values in such a small area should be associated with the fact that all geological studies indicate the presence of embankments, which can reach a thickness of up to 4 m [24] and their structure or even density can significantly change the conditions for infiltration of rainwater.
The results of cyclic soil moisture tests in the vertical profile in the S1–S4 profiles presented in Figure 6 indicate a strong vertical and time differentiation. The S1–S3 profiles are characterized by a similar distribution of moisture. The highest soil moisture of 5–20% occurs at a depth of 0.1 m, it decreases to a depth of 0.3 m, while narrowing the range of results from 0.1 to 12%, then from a depth of 0.4 to 0.6 m it increases to the range of 0.2–27%. The S4 profile is characterized by smaller moisture ranges with a similar vertical arrangement. The biggest difference concerns the highest humidity in the range of 11–28%, which occurs at a depth of 0.5 m.
The analysis of changes over time indicates two characteristic periods. The first is related to the summer and autumn seasons, when the soil moisture is low and ranges on average from 3% (28 August 2022) to 8.34% (28 July 2022). The second period starts from December, immediately after the melting of snow cover, and the average values increase to 10.67% (12 January 2023), and to a maximum of 12.01% (26 January 2023).
The spatial distribution of soil moisture within the central campus of the University of Warsaw was determined for green areas in the subsurface soil zone by interpolating between 116 point values, and the results are presented in Figure 7. Measurements made on 14 July 2022 are characterized by a variation in the range from 1.83 to 33.81%, on average 13.34%. The highest values occur in the central part, in the area of S3 and S4 profiles, and in the north-western part. On 8 September 2022, the range of moisture values was from 0 to 37.64%, an average of 3.99%. Values higher than 10% occur only in the central part of the campus. The third series of measurements made on 29 December 2022 has much higher values ranging from 9.77 to 41.68%, with an average of 27.96%. Values below 20% occur only locally in the south-western part. In Figure 7, it is seen that during summer, higher values are observed along the slope, which is related to the shading of the area by buildings and tall trees. In September, maximum values are observed at profile S4 in the central part, where drip irrigation of the green area is carried out. On the other hand, during December, the spatial pattern has low variation throughout the area, indicating similar snow melting conditions.
Spatial EC tests of the soil were carried out simultaneously with moisture, and then spatial distributions presented in Figure 8 were made based on point values. In July 2022, the range of EC variability was 1.08–6.66 mS/cm, with an average of 2.14 mS/cm. Values above 3 mS/cm occur in the central part and near the S1 profile in the eastern part. In September, the EC values were spatially more varied, changing evenly from the lowest 1.47 mS/cm in the west, to the highest 7.53 mS/cm in the east at the edge of the escarpment, averaging 3.61 mS/cm. In December, the lowest EC values were recorded, varying in the range of 0.68–2.09 mS/cm, with an average of 1.17 mS/cm, as in September they were higher in the eastern part.

3.3. Spring Research

The spring variability index, defined as the Qmax/Qmin ratio according to Maillet [29] is 2.21 for UWS, 2.26 for UWN spring. These values indicate that both springs exhibit low variability and respond only slightly to changing weather conditions. A minor decrease in discharge was observed during the dry period (August 2022), and a slight increase followed snowmelt (December 2022), as shown in Figure 9.
The recession coefficient (α), which is characteristic for each spring, was calculated only for UWN spring, due to the possibility of separation on the hydrograph period with a decreased discharge rate. The value of α estimated at 0.004 depends on aquifer permeability, storage coefficient S, and size of the aquifer. It provides a basis to estimate aquifer volume (523,791 m3), discharge area (2.33 km2), and spring capacity coefficient (0.13), which can be interpreted as an eight-year total water exchange in the aquifer. The obtained values of the characteristics of both springs were verified using model tests. The alimentation zone of springs occurs throughout the central campus, which means that it is an important area in terms of providing adequate aquifer resources, especially during dry years. Historical data indicated periodic disappearance of water flowing from the springs, leading to degradation of green areas below the escarpment, important for their ecological and social role [32]. The application of MAR solutions is expected to counter such situations, and in the future, the monitoring of springs (or wetlands) can be an integral part of management of MAR implementations, as said by [33].

3.4. Groundwater Model

The process of calibrating the groundwater flow model consisted in finding a solution to the inverse task using successive approximations, mainly by modifying input values of hydraulic conductivity but also by correcting recharge values to prevent situations where the initial high recharge occurred in an area of low flow conditioned by low hydraulic conductivity. During calibration, the initial hydraulic conductivity values were mostly reduced, reflecting generally poor conditions for filtration within the shallow aquifer. The solution found for the condition of the aquifer system was confirmed by calibrating the head at 265 head observations in 248 points (wells). As a result of the calibration, errors characterizing the compliance of the calculated heads with observed heads were determined and presented in Figure 10. The maximum residual was −14.2 m, and the absolute residual mean was 1.84 m. The standard error of the estimation of 0.16 m and the root mean squared of 2.58 m were considered low enough to complete the calibration process and to recognize the high reliability of the obtained model.
After the calibration process, the obtained range of hydraulic conductivity values for the shallow aquifer is from 0.08 to 9 m/d, for the aquitards from 0.00022 to 0.00008 m/d, and for the deeper aquifer from 0.08 m/d near escarpment to 5 m/d in the Vistula valley which can be seen in Figure 11C. These values seem to be very low, but after taking into account the geological structure and the presence of numerous clay and silt overlays, they indicate that flow conditions are hindered, especially within the upland.
The infiltration rate values presented in Figure 11A are also very low and vary from 0 to 130 mm/year. The highest values occur in some green areas, but they are mostly in a range from 0 to 30 mm/year due to large built-up areas. Average value for the entire model area is 17 mm/year, which is a very low value, especially if it is assumed that in Poland the average infiltration rate is about 108 mm/year.
The campus area is characterized by infiltration in the range of 0 to 72 mm/year, 18 mm/year on average. The characteristics of the shallow aquifer are determined by the values of the hydraulic conductivity on the campus of the University of Warsaw from 0.08 to 1.4 m/d, and a head from 95 to 104.7 m a.s.l. with the slope of the groundwater table towards the east, which corresponds to a depth of 2.96 m in the southern part of the campus to 10.30 m in the eastern part near the edge of the plateau, on average 4.81 m. The blanks on Figure 11B indicate dry cells—no groundwater table in the shallow aquifer (first layer of the model) and the water table contours refer to groundwater occurrence in the second layer of the model.
The ModFlow program made it possible to determine the components of the groundwater balance on the campus of the University of Warsaw presented in Figure 12. The infiltration rate of the shallow aquifer was determined at 2.86 m3/d, which is 11% of the renewable resources in this area, the rest belongs to the lateral inflow. In this area, there is a component of runoff indicating strong seepage through the aquitard layer to the deeper aquifer (3.20 m3/d), greater than the infiltration rate.

3.5. Space Valorization Results

All of the previously described results were compiled into thematic layers to form the basis of urban space valorization in terms of identifying the most preferred locations for the installation of retention facilities. After normalization, the layers were combined to produce the final valorization map (Figure 13). Higher index values indicate more favorable locations. At low values (1.9–3.0 in Figure 13), it should be considered that the quality of the studied environmental components is insufficient to locate devices there, because this may result in emergency situations associated with increased infiltration time from the devices into the ground, stagnation of water in the devices, and overflowing of the devices. These problems are a direct result of the structure of the vadose zone, its low thickness in some areas and lower hydraulic conductivity. In turn, the areas of high index values (over 4.0 in Figure 13) are dominated by greater depths to the water table, high hydraulic conductivity and lowest soil moisture values, which, combined with a safe distance from buildings, ensures the safe operation of infiltration devices. Due to the small size of the area, it is assumed that the EC soil values can also be an indicator of the variability of the vadose zone, mainly in the context of the possibility of infiltration of a significant amount of water from snowmelt. Low EC values were an indicator of places where this infiltration occurred rapidly causing a decrease in EC values observed in the vertical profile and spatially.
The values obtained ranged from 1.9 to 5.6. The most common range was w 4.0–4.5 (29.2%), the second group being values between 3.5 and 4.0–28.1%. The maximal value between 5.5 and 6.0 is represented by only one calculation block. The areas with values between 3.0 and 3.5 and 4.5–5.0 are 11.8 and 19.5%, respectively, the remainder being a share of less than 10%. Values of 4–4.5 occur mainly in the central part and form two compact areas with a large surface area, as do values of 4.5–5.0. The eastern part of the area on the side of the Warsaw escarpment has relatively low index values rarely exceeding 4.0. In accordance with the concept, a buffer with the lowest values below 2.5 has been created next to the buildings.

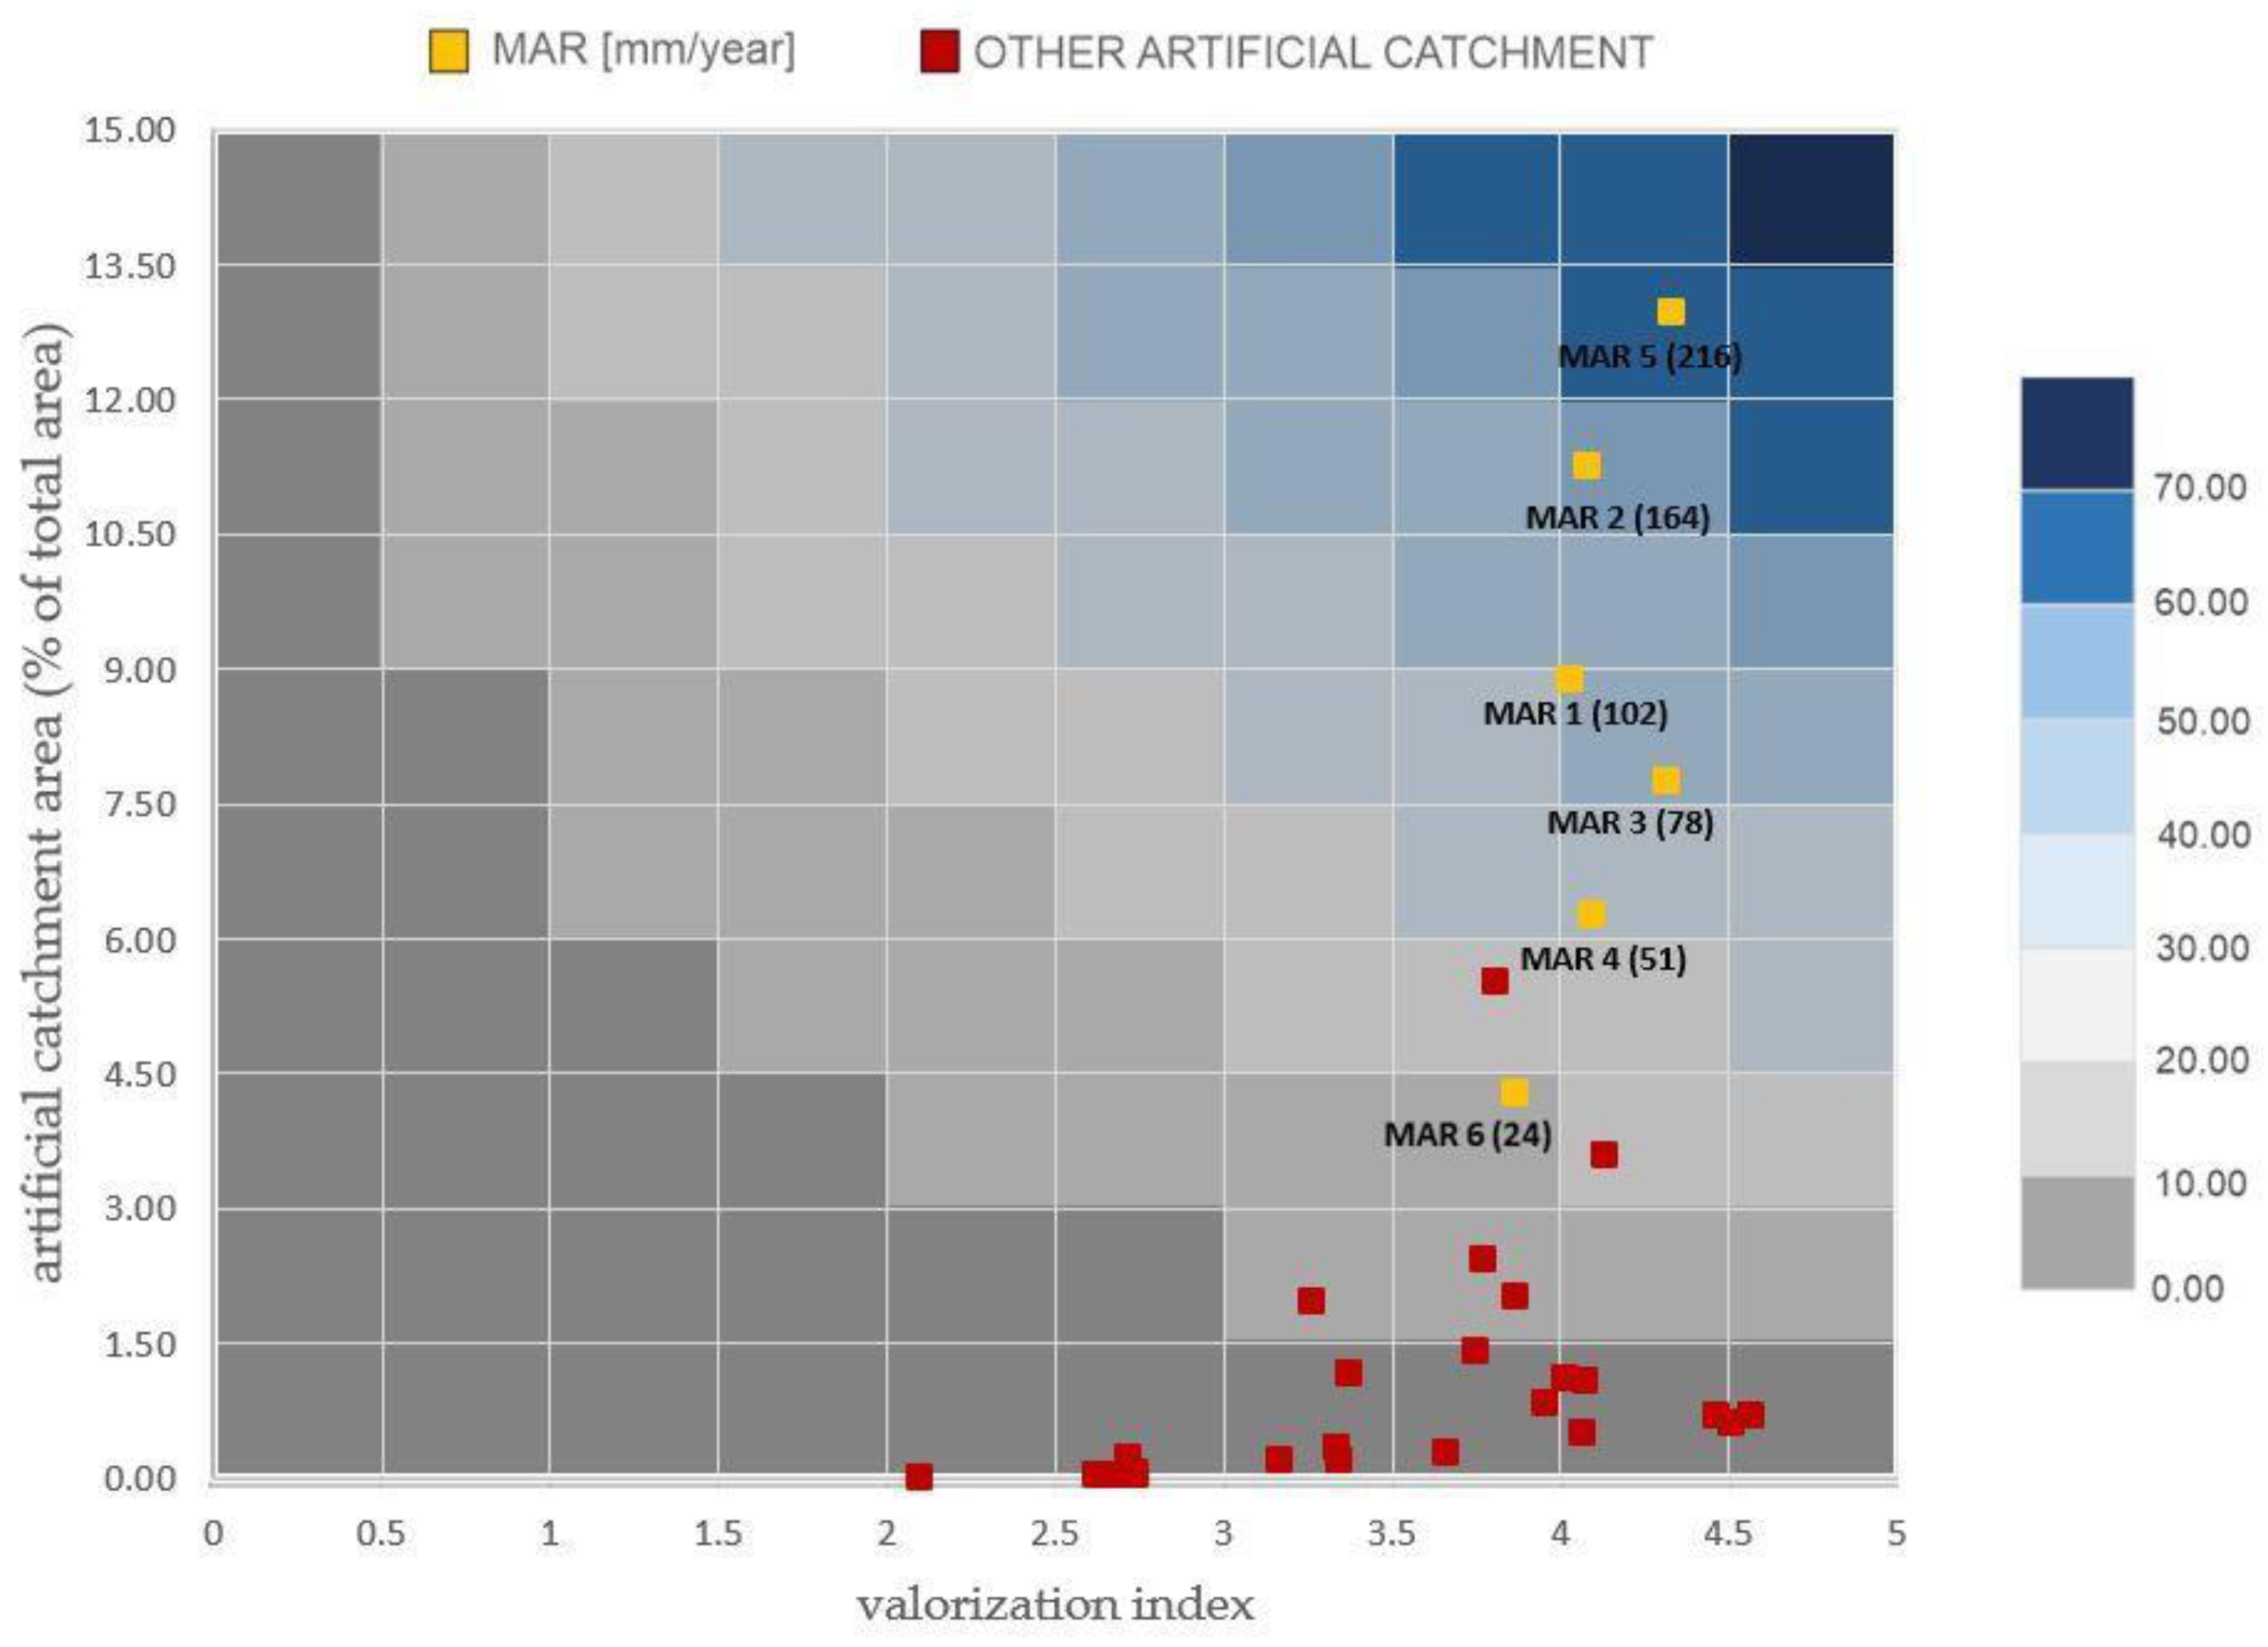
3.6. Location of Retention Facilities

The selection of locations for retention facilities was based on the results of spatial valorization. The location of the points was favored where the index values were highest. The areas with the highest index value of 5.5–6.0 in the northern part allowed the location of one retention facility, the index in the range 5.0–5.5—four facilities, and in the range 4.5–5.0—one facility. For technical reasons, the selection of a particular site was also related to the current surface configuration, which conditioned the amount of water flowing from a given artificial catchment into the final receiver, in this case, the retention facility. The characteristics of the facilities are shown in Table 2.

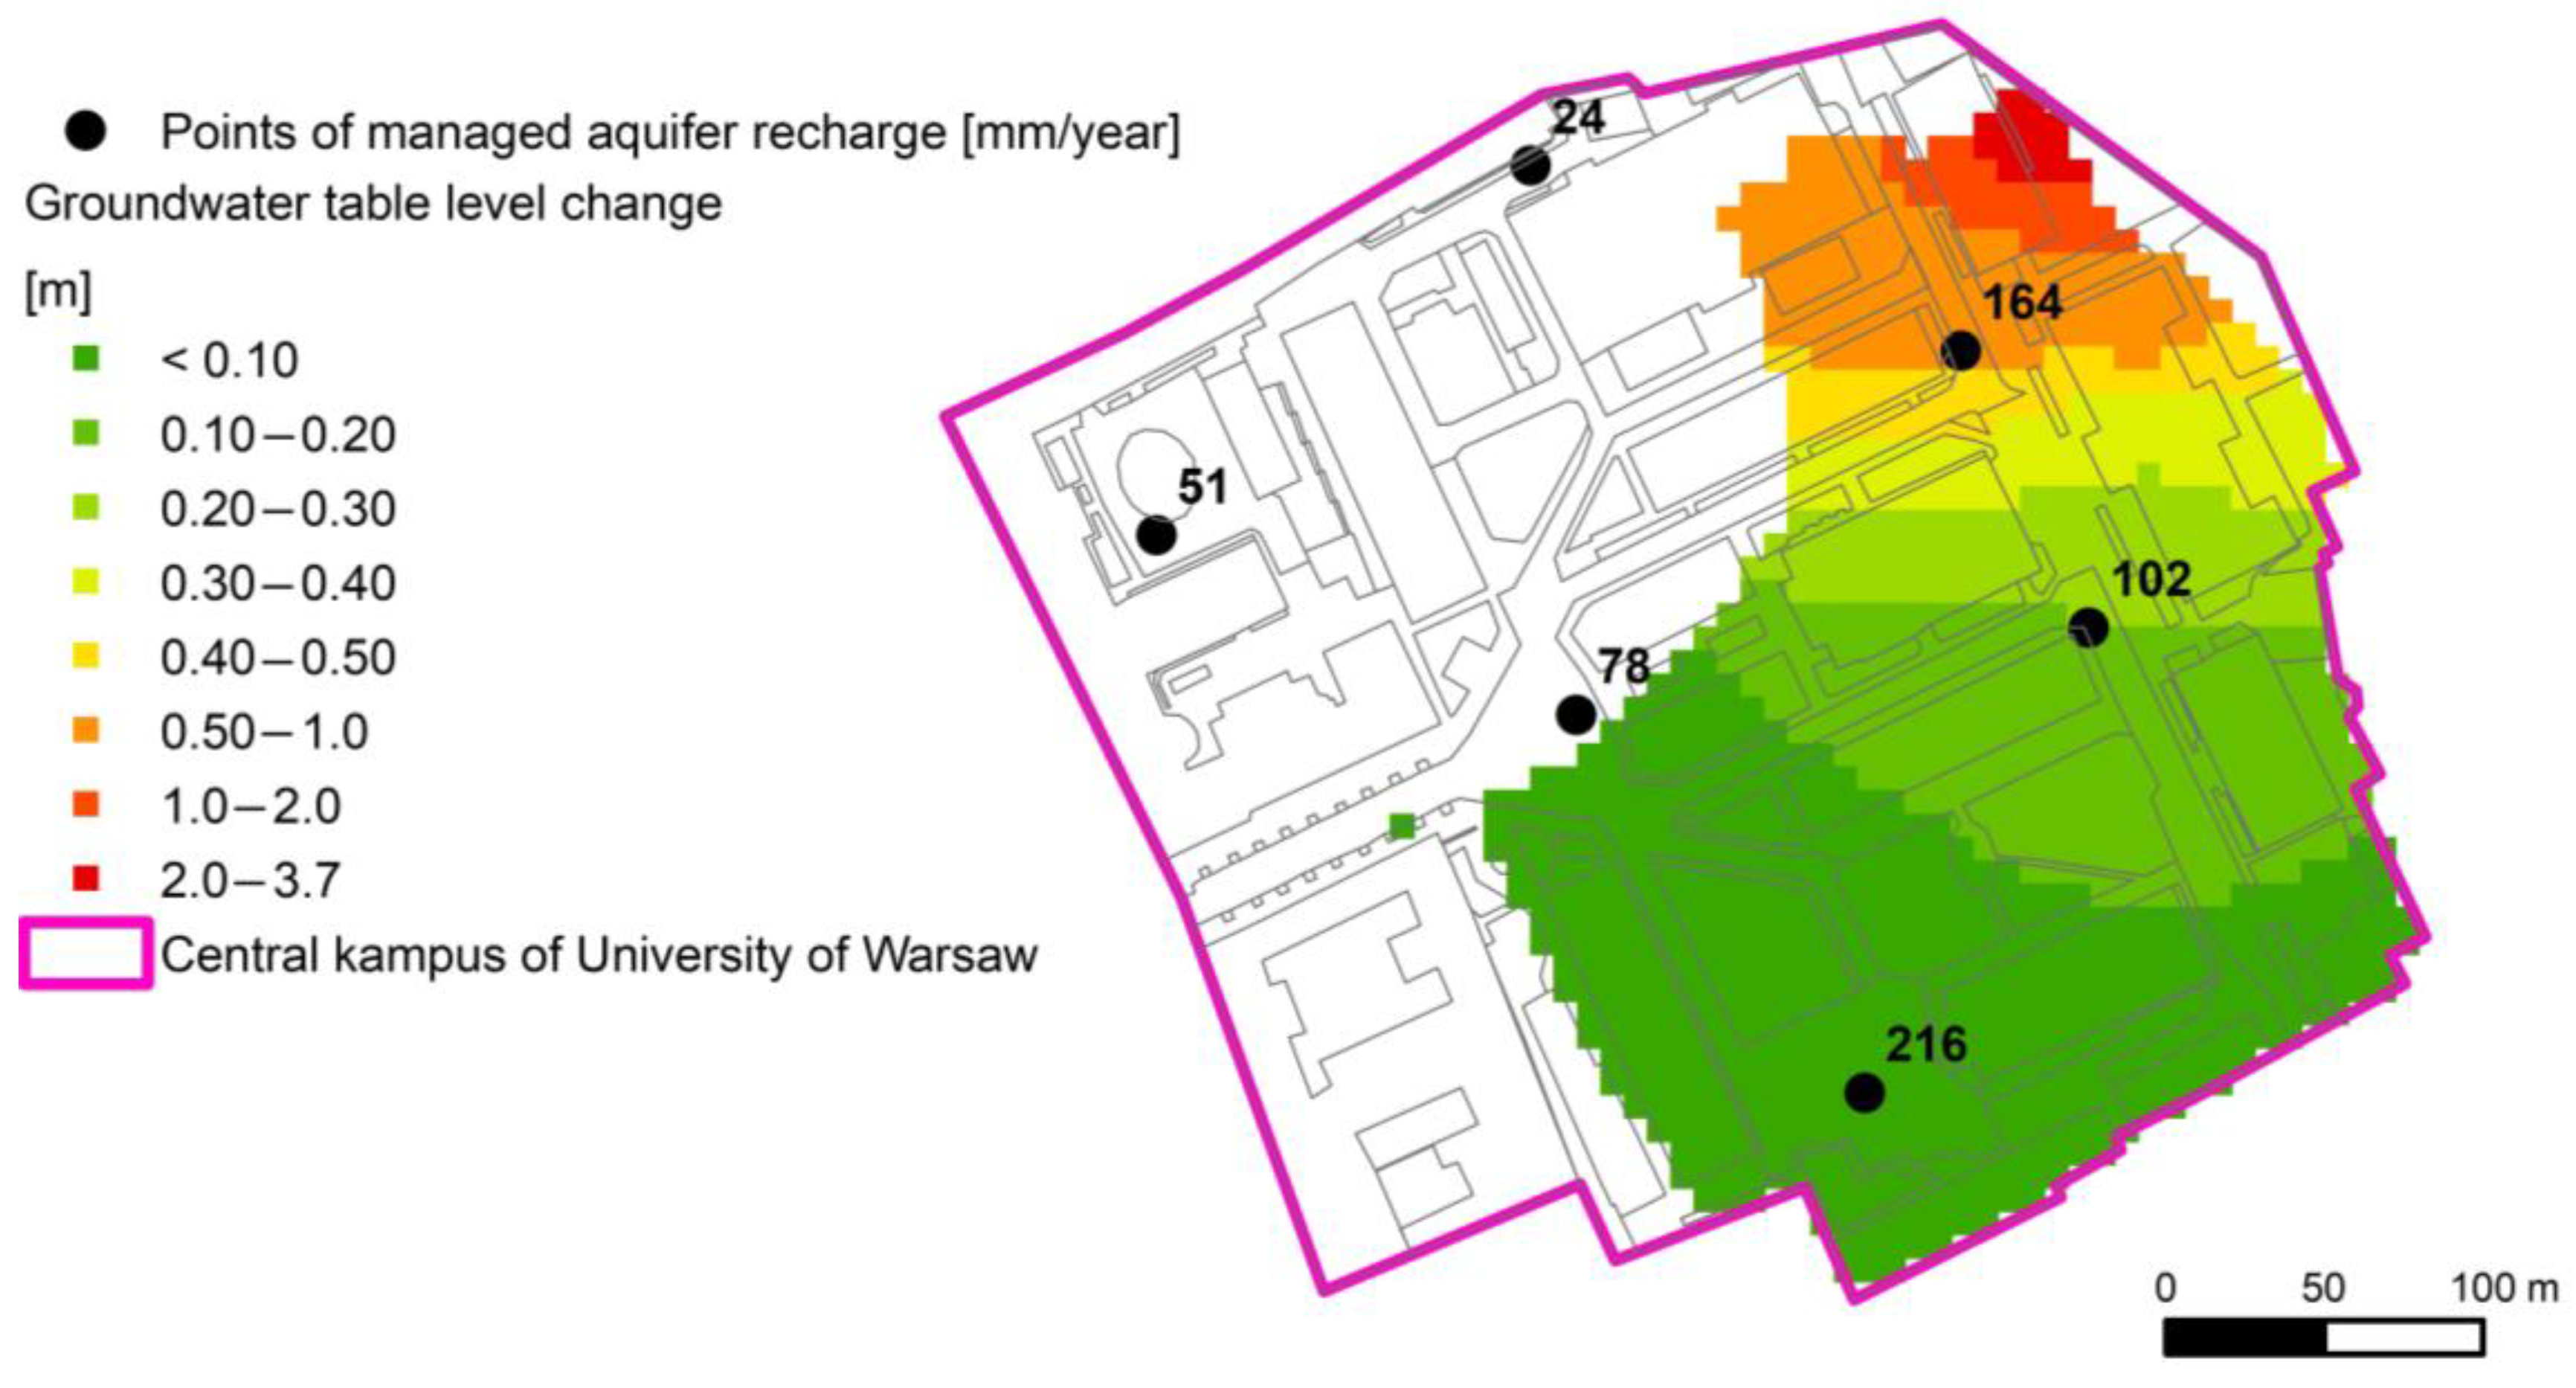
3.7. Mapping Managed Aquifer Recharge on a Groundwater Model

In order to convert the volume of water retained in the soakaway crates to a recharge type boundary condition on the model, it was necessary to determine the area of each facility at a given location and relate this to the area of a single cell in the model. The volume of water indicated in Table 2 for a rainfall duration of 20 min converted into annual recharge values was from 24 mm/year at location no. 6 to 216 mm/year at location no. 5. No additional changes were made in the model, except for a change in the recharge value of the particular cells.
The change in groundwater levels caused by the additional recharge occurred in an area of 3.07 ha, which represents 52% of the area. The average change is 0.25 m with respect to the annual mean values. The cumulative effect of groundwater level changes due to the direction of groundwater flow in the aquifer is evident. In the south-western part, there is no change, while towards the north there is an increase up to 3.7 m. The cumulative effect of the changes is due to the significantly lower hydraulic conductivity and transmissivity of the aquifer at the slope itself. However, this does not mean that higher levels will pose a threat to existing infrastructure and buildings—the depth to the water table will be approximately 5 m after the rise. In the northern part, the cells still remain dry, meaning that there is no change in retention after additional infiltration. This may be influenced by the low recharge values assumed by the model, which is due to the layout of the catchments to which the recharge facilities are connected. The extent of the impact of managed aquifer recharge is shown in Figure 14 in relation to the campus boundary, but it should be noted that this is greater and extends primarily beyond the southern boundary.

4. Discussion

Climatic data and direct research indicate that the most critical period from the point of view of the possibility of infiltration to the shallow aquifer for the last year (research period of March 2022–February 2023) was the period from December to February when a positive climate balance was found due to precipitation totals exceeding long-term averages and higher values of potential evaporation. The inflow of meltwater with low mineralization is confirmed by soil EC measurements, where in December, the values were much lower than in July and September.
The volume of the recharge determined by groundwater flow model tests was determined to be 18 mm/year on average. Three green areas on the campus are most important for recharge: a small one in the northern part, in the southern part (for both values of approximately 34 mm/year), and along the escarpment, where the infiltration rate may exceed 70 mm/year at some points of the recharge net. These values should be related to the long-term period. In conjunction with climatic data, it can be indicated that the recharge is, on average, 3.5% of the annual precipitation for the entire campus area and from 6.7 to 14.2% for green areas. The favorable period for infiltration occurs from September to February, with the greatest positive differences between precipitation and potential evaporation occurring in December and January.
The phenomenon of surface runoff is also a factor limiting the recharge. Assuming that 68.8% of the central campus area is covered with sealed surfaces, the average annual amount of rainwater discharged from the area may be as much as 23,800 m3, with the annual infiltration in this area defined as 1044 m3.
Spatial soil moisture distribution in July revealed two areas with elevated values. The first concerns the central part, where the effect of artificial irrigation of green areas was observed in the summer, while in the eastern part there is no irrigation system, hence, higher moisture values should be associated with shading of the area resulting from the presence of buildings located along the escarpment. In September, after a period of atmospheric drought (August rainfall of 29.6 mm), the moisture decreased in the whole area except for the central area, where intensive irrigation continued. The impact of providing additional water to the soil is noticeable only in the S4 profile even with considerably higher soil permeability, the other profiles were out of the impact of irrigation.
In the S4 profile, changes in soil moisture over time are the smallest, which may be due to higher hydraulic conductivity than in other points and locations within the irrigation system. In addition, the S4 profile is characterized by noticeably higher moisture values at a depth of 0.5 m, which may indicate the presence of underground infrastructure running in this place.
By analyzing the point data of moisture in the profiles, it can be concluded that the recharge associated with individual, short precipitation impulses does not cause saturation of the entire tested zone of the profile. The moisture content increases to a depth of 10 cm, and then it is lower. It can be said that the effect of evaporation diminishes at a depth of 0.4–0.5 m, where moisture is higher again. Even in summer, it shows an increasing tendency with increasing depth.
Complementary studies involving direct spring discharge measurements were used in the groundwater model to delineate the spring alimentation zone, which is partly related to the campus area, so any changes in the increase in groundwater retention will preserve the water supply in springs from drying out during low levels.
The procedure made it possible to differentiate the area in the context of urban space valorization results by analyzing data describing the water environment. A similar procedure was implemented by Seif at al. [34], who identified suitable potential areas for MAR solutions based on criteria like vertical permeability, vadose zone thickness, surface slope, precipitation, the first two of which cannot be ignored, as well as surface hydrology, in their case it was drainage density, in our artificial catchments closed by particular sewage manholes. They found that MAR sites can only be located in 18.86%, and 81.14% was deemed unsuitable. In our case, definitively unsuitable is 5.7% (valorization index lower than 3.0) and 54% is suitable (valorization index over 4.0), although the maximum value (8.0) was not obtained in any location. So generally, the spatial valorization showed that the analyzed environmental components indicate that the area has significant potential for the implementation of managed aquifer recharge solutions. In an urban space under the care of the conservation authority, underground facilities that will not alter the landscape are possible, hence the choice of soakaway crates seems to be optimal. For this solution, the location of the retention facilities was designed, and the volume of water to be managed was estimated. Modeling studies indicate that, for this option, the additional aquifer supply will result in a change in recharge per year from 1044 m3 to 11,966 m3 and in reduction in water run-off into the sewer system from 18,561 m3 to 7639 m3.
In the context of technical solutions, it is important to cite the findings of Kinic and Ostrysz [35], who identified 19 different Blue and Green Infrastructure (BGI) solutions that can support urban stormwater management. They evaluated these solutions based on three aspects: spatial–functional, environmental, and social. The results of the valorization obtained here directly address the environmental criterion, i.e., the impact on climate change mitigation and rainwater management. In our case, the spatial–functional criterion was defined as an initial assumption, i.e., the selected technical solution. Soakaway crates must be “invisible” in the existing urban space, which is under conservation protection, even though Kinic and Ostrysz [35] qualified this type of device with low value rating (14 out of 40 points), recognizing the superiority of vegetated swales, rain gardens and bioretention basins, among others.
The results of the multi-criteria analysis presented in Figure 15 were related to the share of artificial catchment areas in the urban space. This comparison confirmed the selection of optimal MAR (Managed Aquifer Recharge) locations under diverse spatial conditions. The background of the chart, presented as a heatmap, indicates levels of retention potential (0.75–75.00). The MAR locations make the most effective use of the environmental analysis results in areas that combine a high valorization index with a significant share of artificial catchments, underscoring the comprehensiveness of the assessment.
Dillon et al. [36] points out that MAR is an economically competitive solution, lowering the costs associated with water harvesting and reducing losses in water supply systems. In the case of the study area, rainwater is discharged into the combined sewer system, which means that the direct cost of this solution can be calculated as a cost of treating mixed wastewater with rainwater, and the indirect cost is the same as the necessity to adjust the sewer infrastructure to prevent hydraulic overloading. The impact of the application of MAR in this area in economic terms is therefore wider, also in social terms, as the discharge from aquifer occurs in springs located within the boundaries of green areas used for recreation.
In the current legal framework in Poland, the implementation of MAR technology is described in The Water Law of 2017 [37] and involves obtaining a water law permit for the injection of rainwater into the ground. Obtaining the permit involves only the execution of a water law operative defining the research facility and presenting its characteristics. Thus, it does not constitute an obstacle to implementation. What is essential, however, is cooperation between the property managers, the University of Warsaw and the Municipal Water Supply and Sewerage Company, which manages the sewerage network in Warsaw.
Stormwater management policy requirements apply to newly constructed buildings, both in areas with existing development and in those currently undergoing urbanization. For new developments, even in densely built-up zones, investors cannot expect favorable decisions permitting the complete discharge of stormwater into the sewerage system. For existing, long-standing buildings, there is currently no legal obligation to implement on-site stormwater management solutions—such measures remain voluntary under the current legislative framework. Particular challenges arise in the case of historic buildings (architectural complexes), where any intervention must be coordinated with heritage conservation authorities. This results in a time-consuming and complex administrative process, although not necessarily a technically demanding one. In practice, this means that property managers are unlikely to undertake such initiatives unless explicitly required to do so. At present, the only broadly available mechanism supporting the implementation of such solutions is the promotion of public awareness.

5. Conclusions

The conducted research provides a comprehensive basis for diagnosing the water environment and proposing MAR (Managed Aquifer Recharge) solutions, along with simulating their implementation. Through climate analysis, a detailed water balance was established: annual precipitation reached 29,752 m3, groundwater infiltration amounted to 1044 m3, and surface runoff totaled 18,561 m3, while actual evaporation was calculated at 10,148 m3. These values highlight the significant potential for improving retention in urban areas because there is a large disparity between the precipitation and infiltration in urban areas—only 4.4% of the precipitation successfully infiltrates under current climatic and spatial conditions, as confirmed by groundwater modeling.
Our research has shown that soil solution electrical conductivity (EC) proved to be a reliable indicator of infiltration periods, especially during snowmelt, when mineralization is low. The spatial distribution of EC allowed the identification of areas with favorable infiltration conditions. Complementing these findings and other hydrogeological and hydrological environment elements, the study integrated key insights from stormwater management by formulating eight informational layers. Using a relatively simple variant of multi-criteria analysis, based on the assumption of equivalence among these layers, the precise determination of optimal locations for retention facilities as a MAR solution was made.
The research further reveals that in urban settings with historical architecture, the conventional approach to selecting specific retention facilities may be inadequate due to the stringent oversight imposed by heritage conservation authorities. In light of the cultural significance of such monuments and the imperative to ensure their comprehensive protection, it is essential to prioritize an extensive assessment and quantitative characterization of local water circulation conditions. These parameters should serve as the primary criteria for the siting of MAR facilities.
Although the technical aspects of MAR implementation in Poland are straightforward, legal regulations may pose challenges to its practical realization. The existing legal framework provides a relatively uncomplicated administrative procedure, but it does not impose a binding obligation on property managers to adopt or implement new solutions.
Finally, while the study was limited to the area of the University of Warsaw’s central campus, its findings are representative of the downtown district and a part of the city characterized by historic buildings. Therefore, it can offer guidance for future developments in other areas with a similar urban fabric.
The conclusions highlight the need for targeted stormwater management actions and the importance of a comprehensive approach to designing groundwater management systems, incorporating field reconnaissance, groundwater flow modeling, and multi-criteria analysis. The proposed approach supports climate resilience and the goals of sustainable development in urban space.

Author Contributions

Conceptualization, J.T.; methodology, J.T. and S.Z.; software, S.Z.; validation, J.T. and S.Z.; formal analysis, S.Z.; investigation, J.T. and S.Z.; resources, J.T. and S.Z.; data curation, J.T.; writing—original draft preparation, J.T. and S.Z.; writing—review and editing, J.T. and S.Z.; visualization, S.Z.; supervision, J.T.; project administration, J.T.; funding acquisition, J.T. All authors have read and agreed to the published version of the manuscript.

Funding

This work was financed by Activity IV.3.1. Internal grants of the University of Warsaw for the employees’ research potential increase—Green University of Warsaw, IDUB Programme, no. BOB-661-129/2022.

Data Availability Statement

The data concerning field studies and groundwater modeling that support the findings of this study are available from the corresponding author upon reasonable request. Data obtained from publicly available sources are cited in the References Section.

Acknowledgments

The authors would like to thank the anonymous reviewers for their constructive comments and insightful suggestions, which have helped improve the quality of the manuscript.

Conflicts of Interest

The authors declare no conflicts of interest.

References

  1. Kleerekoper, L.; van Esch, M.; Salcedo, T.B. How to Make a City Climate-Proof, Addressing the Urban Heat Island Effect. Resour. Conserv. Recycl. 2012, 64, 30–38. [Google Scholar] [CrossRef]
  2. Kuehler, E.; Hathaway, J.; Tirpak, A. Quantifying the Benefits of Urban Forest Systems as a Component of the Green Infrastructure Stormwater Treatment Network. Ecohydrology 2017, 10, e1813. [Google Scholar] [CrossRef]
  3. Ardalan, A.; Khaleghy Rad, M.; Hadi, M. Urban Water Issues in the Megacity of Tehran. In Urban Drought; Springer: Berlin/Heidelberg, Germany, 2019; pp. 263–288. [Google Scholar]
  4. Karimi, A.; Mohammad, P.; García-Martínez, A.; Moreno-Rangel, D.; Gachkar, D.; Gachkar, S. New Developments and Future Challenges in Reducing and Controlling Heat Island Effect in Urban Areas. Environ. Dev. Sustain. 2022, 25, 10485–10531. [Google Scholar] [CrossRef]
  5. Dąbrowski, S.; Przybyłek, J. Methodology of Test Pumping in Documenting Groundwater Resources. In Methodological Guide; Ministerstwo Środowiska: Warsaw, Poland, 2005. (In Polish) [Google Scholar]
  6. Jiang, C.; Li, J.; Gao, J.; Lv, P.; Zhang, Y. Quantitative Calculation of Stormwater Regulation Capacity and Collaborative Configuration of Sponge Facilities in Urban High-Density Built-up Areas. Environ. Sci. Pollut. Res. 2022, 30, 13571–13581. [Google Scholar] [CrossRef] [PubMed]
  7. Ahammed, F. A Review of Water-Sensitive Urban Design Technologies and Practices for Sustainable Stormwater Management. Sustain. Water Resour. Manag. 2017, 3, 269–282. [Google Scholar] [CrossRef]
  8. White, D.; Windsor, D. Reinvesting in History and Place to Build Resiliency and Community. In Proceedings of the Water Environment Federation, Quincy, MA, USA, 8–12 October 2022. [Google Scholar]
  9. Mitchell, V.G.; McMahon, T.A.; Mein, R.G. Components of the Total Water Balance of an Urban Catchment. Environ. Manag. 2003, 32, 735–746. [Google Scholar] [CrossRef] [PubMed]
  10. Wakode, H.B.; Baier, K.; Jha, R.; Azzam, R. Impact of Urbanization on Groundwater Recharge and Urban Water Balance for the City of Hyderabad, India. Int. Soil. Water Conserv. Res. 2018, 6, 51–62. [Google Scholar] [CrossRef]
  11. Brown, A.E.; Zhang, L.; McMahon, T.A.; Western, A.W.; Vertessy, R.A. A Review of Paired Catchment Studies for Determining Changes in Water Yield Resulting from Alterations in Vegetation. J. Hydrol. 2005, 310, 28–61. [Google Scholar] [CrossRef]
  12. Barron, O.V.; Donn, M.J.; Barr, A.D. Urbanisation and Shallow Groundwater: Predicting Changes in Catchment Hydrological Responses. Water Resour. Manag. 2013, 27, 95–115. [Google Scholar] [CrossRef]
  13. Martin, C.; Ruperd, Y.; Legret, M. Urban Stormwater Drainage Management: The Development of a Multicriteria Decision Aid Approach for Best Management Practices. Eur. J. Oper. Res. 2007, 181, 338–349. [Google Scholar] [CrossRef]
  14. Bajić, D.; Polomčić, D.; Ratković, J. Multi-Criteria Decision Analysis for the Purposes of Groundwater Control System Design. Water Resour. Manag. 2017, 31, 4759–4784. [Google Scholar] [CrossRef]
  15. Błażejczyk, K.; Kuchcik, M.; Milewski, P.; Szmyd, J.; Dudek, W.; Błażejczyk, A.; Kręcisz, B. Miejska Wyspa Ciepła w Warszawie; Informator: Warsaw, Poland, 2014. (In Polish) [Google Scholar]
  16. Sawicka, K.; Krogulec, E.; Gruszczyński, T.; Kowalczyk, S.; Małecki, J.J.; Mieszkowski, R.; Porowska, D.; Trzeciak, J.; Wojdalska, A.; Zabłocki, S.; et al. Causes of Groundwater Level and Chemistry Changes in an Urban Area; a Case Study of Warsaw, Poland. Acta Geol. Pol. 2022, 72, 495–517. [Google Scholar] [CrossRef]
  17. Rutkowski, H. The Beginnings of Warsaw. A Look After 700 Years; Wydawnictwo DiG: Warsaw, Poland, 2015. [Google Scholar]
  18. Available online: https://blizej-mieszkanca.mpwik.com.pl/#/App/Map (accessed on 23 March 2023).
  19. Sarnacka, Z. Detailed Geological Map of Poland in the Scale 1:50,000, Warsaw-East, Sheet No. 524; Państwowy Instytut Geologiczny: Warsaw, Poland, 1979. [Google Scholar]
  20. Sarnacka, Z. Explanations to Detailed Geological Map of Poland in the Scale 1:50,000, Warsaw-East, Sheet No. 524; Państwowy Instytut Geologiczny: Warsaw, Poland, 1980. [Google Scholar]
  21. Physiographic Atlas of the Capital City of Warsaw; Urząd m.st. Warszawy: Warsaw, Poland, 2018; Available online: https://architektura.um.warszawa.pl/-/atlas-ekofizjograficzny-warszawy (accessed on 12 September 2022).
  22. Kaczyński, R. Engineering-Geological Evaluation of Mio-Pliocene Clays in the Warsaw Area, Central Poland. Acta Geol. Pol. 2002, 52, 437–448. [Google Scholar]
  23. Cygański, K. Hydrogeological Map of Poland in the Scale 1:50,000, The Main Useful Aquifer, Warsaw-West, Sheet No. 523 with Explanations; Państwowy Instytut Geologiczny: Warsaw, Poland, 1997. [Google Scholar]
  24. PIG-PIB. Available online: https://baza.pgi.gov.pl/Geoportal/Geologia (accessed on 21 June 2022).
  25. Available online: https://danepubliczne.Imgw.pl/ (accessed on 31 March 2023).
  26. Available online: https://www.gov.pl/Web/Gugik (accessed on 22 August 2022).
  27. Available online: Https://www.geoportal.gov.pl/pl/Dane/Baza-danych-obiektow-topograficznych-bdot10k/ (accessed on 17 July 2022).
  28. Dębski, K. Adaptation of Konstantinov’s Nomogram to Calculations of Terrain Evaporation in Poland. In Prace i Studia Kom. Inż. I Gosp. Wodnej; Polis Academy of Science: Warsaw, Poland, 1963; Volume 6. [Google Scholar]
  29. Maillet, E.T. Essais d’hydraulique Souterraine & Fluviale; Librairie Scientifique, A. Hermann: Paris, France, 1905. [Google Scholar]
  30. Xiao, H.; Yang, Y.; Liu, Q.; Zang, Y.; Lian, X.; Xia, F.; Jiang, Y. Numerical Modeling the Impacts of Increasing Groundwater Pumping upon Discharge Decline of the BL Spring Located in Xilin Gol League in East Inner Mongolia, China. Front. Environ. Sci. 2024, 12, 1400569. [Google Scholar] [CrossRef]
  31. McDonald, M.; Harbaugh, A.W. A Modular Three-Dimensional Finite Difference Ground-Water Flow Model. In Techniques of Water-Resources Investigations, Book 6; U.S. Geological Survey: Washington, DC, USA, 1988; p. 588. [Google Scholar]
  32. Dziedziczak, R. Antropomineral Water from Warsaw Springs. Przegl. Geol. 2006, 54, 982–986. [Google Scholar]
  33. Maliva, R. Economics of Managed Aquifer Recharge. Water 2014, 6, 1257–1279. [Google Scholar] [CrossRef]
  34. Seif, A.K.; Masria, A.; Ghareeb, M.; Saleh, A.A.; Soliman, K.; Ammar, A.I. Identifying Managed Aquifer Recharge and Rain Water Harvesting Sites and Structures for Storing Non-Conventional Water Using GIS-Based Multi-Criteria Decision Analysis Approach. Appl. Water Sci. 2024, 14, 181. [Google Scholar] [CrossRef]
  35. Kimic, K.; Ostrysz, K. Assessment of Blue and Green Infrastructure Solutions in Shaping Urban Public Spaces—Spatial and Functional, Environmental, and Social Aspects. Sustainability 2021, 13, 11041. [Google Scholar] [CrossRef]
  36. Dillon, P.; Alley, W.; Zheng, Y.; Vanderzalm, J. (Eds.) Managed Aquifer Recharge: Overview and Governance; IAH Special Publication: Utrecht, The Netherlands, 2022. [Google Scholar]
  37. The Water Law of 2017 (Journal of Law 2017, Item 1566) in Polish. Available online: https://isap.sejm.gov.pl/ (accessed on 24 May 2025).
Figure 1. Location of the research area with the DEM and documentation points.
Urbansci 09 00224 g001
Figure 2. Spatial development: land use (A) and water supply and sewage network (B) of the study area, spatial distribution of runoff coefficient and slope direction (C), slope degree (D).
Urbansci 09 00224 g002
Figure 3. Hydrogeological cross-section (line of cross-sections shown in Figure 1, based on borehole data of Polish Geological Institute National Research Institute (PGI) database [24]).
Urbansci 09 00224 g003
Figure 4. Evaporation and precipitation for the period from March 2022 to February 2023 in the research area.
Urbansci 09 00224 g004
Figure 5. Hydraulic conductivity changes in S1–S4 profiles.
Urbansci 09 00224 g005
Figure 6. Vertical soil moisture variation in boreholes S1–S4.
Urbansci 09 00224 g006
Figure 7. Spatial distribution of the soil moisture in: (A)—14 July 2022; (B)—8 September 2022; (C)—29 December 2022.
Urbansci 09 00224 g007
Figure 8. Spatial distribution of the soil electrical conductivity in: (A)—14 July 2022; (B)—8 September 2022; (C)—29 December 2022.
Urbansci 09 00224 g008
Figure 9. Discharge rate of UWN and UWS spring.
Urbansci 09 00224 g009
Figure 10. Calibration chart.
Urbansci 09 00224 g010
Figure 11. Characteristics of shallow aquifer: (A)—recharge; (B)—head; (C)—hydraulic conductivity.
Urbansci 09 00224 g011
Figure 12. Groundwater balance in the central campus area with groundwater flow directions.
Urbansci 09 00224 g012
Figure 13. Valorization result and input data layers.
Urbansci 09 00224 g013
Figure 14. Result of managed aquifer recharge in groundwater table level change.
Urbansci 09 00224 g014
Figure 15. Plot of space valorization index and artificial catchments with proposed MAR sites.
Urbansci 09 00224 g015
Table 1. Scope of research and its data source.
Type of ResearchScope of ResearchFrequencyPeriodData Source
Analysis of climatic dataData from the synoptic station of Warsaw (Station ID 352200375)
Precipitation, temperature, water vapor pressure, number of days with precipitation
Monthly sums and averagesJanuary 2007–February 2023danepubliczne.imgw.pl/[25]
Field studies of the vadose zoneInterval soil moisture measurements and EC of soil by probe Wet-150 at a depth of 10–60 cmFour profiles in the interval of 2 weeks, 25 measurements each time, 20 of total observation dateJune 2022–February 2023Own studies
Field studies of the vadose zoneSoil moisture measurements and EC of soil by probe Wet-150 at a depth of 10 cm116 measurements each timeTests on 14 July 2022, 8 September 2022, 29 December 2022Own studies
Laboratory studies of the vadose zoneSoil samples with natural structure from four profiles, from a depth of 10 cm to a depth of 60–70 cm
testing the hydraulic conductivity of samples with an Eijkelkamp permeability meter
Soil volumetric moisture test—the difference in the mass of soil with natural moisture and dried soil 105–110 °C
25 samples, one-time test June 2022Own studies
Studies of spring discharge ratesCyclical tests in 2 springs, using the Poncelat method, with verification using the volumetric method2-week intervalMay 2022–February 2023Own studies
Studies of groundwater flowModel with an area of 1.91 km2, 2 aquifers, reverse task to determine the components of the groundwater balance and rainwater infiltration, including the central campus area-Steady-state representing average annual groundwater stateBorehole data from databases: CBDH (293 objects), CBGI (444 objects) [24]
DEM 1 × 1 m [26]
General Geographical Database BDOT 10k [27]
Table 2. Characteristics of retention facilities.
Retention Facility No.Valorization ResultRun-Off Receiving Area [ha]Volume of Water to be Managed [m3]
15.120.525.04
25.450.666.40
35.180.464.41
45.170.373.56
54.800.767.36
65.840.252.43
Disclaimer/Publisher’s Note: The statements, opinions and data contained in all publications are solely those of the individual author(s) and contributor(s) and not of MDPI and/or the editor(s). MDPI and/or the editor(s) disclaim responsibility for any injury to people or property resulting from any ideas, methods, instructions or products referred to in the content.

