Article

A GIS-Based Multi-Tier Framework for Assessing the Ecological Potential of Urban Vacant Land

by
Izyan Ayuni Mohamad Selamat
1,2,*,
Sreetheran Maruthaveeran
2,*,
Mohd Johari Mohd Yusof
2 and
Mohd Fairuz Shahidan
2
1
Faculty of Sustainable Agriculture, Universiti Malaysia Sabah, Sandakan 90509, Malaysia
2
Faculty of Design and Architecture, Universiti Putra Malaysia, Serdang 43400, Malaysia
*
Authors to whom correspondence should be addressed.
Urban Sci. 2025, 9(6), 218; https://doi.org/10.3390/urbansci9060218
Submission received: 14 March 2025 / Revised: 17 May 2025 / Accepted: 21 May 2025 / Published: 12 June 2025
(This article belongs to the Special Issue Assessing Urban Ecological Environment Protection)

Abstract

:
Urban vacant land possesses significant yet untapped ecological potential (capacity to support biodiversity, ecological processes, and ecosystem functions) for enhancing urban sustainability and resilience. However, the absence of structured and adaptable frameworks for ecological assessment limits its effective integration into urban planning. This study introduces a novel multi-tier ecological assessment framework, combining expert-driven criteria established through the Fuzzy Delphi Method with GIS-based spatial analysis. The framework ensures flexibility and scalability, enabling planners to perform rapid preliminary assessments and progressively detailed evaluations depending on available resources and specific planning objectives. A case study in Sentul-Manjalara, Kuala Lumpur, demonstrates the framework’s practical application, resulting in an ecological potential map categorising vacant parcels into high, medium, and low revitalisation priorities. This approach effectively connects theoretical ecological insights and actionable urban planning, providing policymakers and planners with an evidence-based decision-making tool for strategically prioritising vacant land revitalisation efforts. The outcome enhances urban biodiversity, ecological connectivity, and long-term urban resilience.

1. Introduction

1.1. Research Context and Ecological Potential of Urban Vacant Land

Urban vacant land presents unique opportunities for ecological conservation and sustainable urban development. These underutilised parcels, shaped by a complex interplay of social and ecological factors, have considerable potential to enhance biodiversity, mitigate climate impacts, and support critical ecosystem functions. Recent studies emphasise the ecological significance of urban vacant land, highlighting its capacity to host diverse habitats, sustain wildlife, and develop dense vegetation cover through spontaneous vegetation growth [1,2]. This vegetation contributes substantially to biodiversity conservation, carbon sequestration, microclimate regulation, and urban cooling—functions increasingly vital in mitigating climate change and urban heat stress [3,4,5].
Despite such ecological potential, urban vacant land often remains underexplored in urban planning frameworks, overshadowed by economic and developmental priorities [6,7]. Existing research indicates that these sites typically host a mosaic of ruderal vegetation and urban wilderness, shaped through natural succession with minimal human intervention [8]. Kim et al. [9] classified urban vacant land into vegetation-based categories, including parcels dominated by ruderal vegetation and those constrained by natural features, each uniquely contributing to urban ecological networks. Additionally, urban vacant land provides ecosystem functions such as rainfall interception, groundwater recharge, and soil stabilisation, helping mitigate urban flooding [10,11]. However, these functions are rarely integrated into urban land use strategies, underscoring the need for structured assessment methods to prioritise ecologically valuable vacant parcels.

1.2. Current Assessment Approaches and Limitations

GIS-based approaches have been widely applied to assess urban vacant land, with many studies relying on broad-scale remote sensing techniques such as the Normalised Difference Vegetation Index (NDVI). Although GIS-based analyses support general classification and prioritisation, they frequently overlook the nuanced site-level conditions that influence ecological potential. To address this, many researchers recommend combining GIS with field-based validation, which allows for the direct observation of site conditions, habitat features, and human impacts [12]. In addition, involving local communities in data collection can enhance spatial accuracy and promote stewardship by integrating experiential knowledge and increasing public engagement in urban greening efforts [13,14].
Suitability mapping techniques have shown promise in identifying vacant parcels for conservation or restoration. For example, Pearsall [15] used GIS to map urban heat inequities and identify opportunities for green space interventions. Other studies have integrated ecological, social, and economic criteria to guide sustainable land use planning [16,17]. However, these methods tend to apply uniform approaches, often lacking a tiered or modular structure that would allow for varying data availability, resource constraints, or spatial scales.
This absence of a flexible, multi-level assessment framework presents a critical gap—particularly for cities with diverse ecological conditions and limited institutional capacity. Addressing this issue requires the development of a structured yet adaptable approach that enables progressive assessment, from desktop-level analysis to expert-informed evaluations. Such a framework is especially needed in rapidly urbanising cities like Kuala Lumpur, where vacant land’s ecological potential is acknowledged in planning documents but remains underutilised due to the lack of practical prioritisation tools [18]. For instance, the Kuala Lumpur Structure Plan 2040 recognises the value of vacant land for ecological revitalisation, but implementation is constrained by the absence of integrated assessment methodologies [18].

1.3. Research Gap, Innovation, and Study Objectives

To address this implementation gap, this study introduces a novel multi-tier ecological assessment framework, combining expert-driven ecological indicators validated through the Fuzzy Delphi Method with GIS-based spatial analysis. Unlike previous frameworks, this multi-tier approach provides scalability and flexibility, facilitating rapid preliminary assessments through desktop analyses (Level 1), detailed ecological evaluations via field surveys (Level 2), and, when resources permit, expert-driven assessments (Level 3). This study applies the proposed framework to a case study in Kuala Lumpur, specifically the Sentul-Manjalara strategic development zone. This practical application demonstrates the framework’s utility by systematically categorising vacant parcels into high, medium, and low ecological revitalisation priorities. The resulting ecological potential map provides urban planners with a robust evidence-based tool for decision-making, directly informing targeted ecological interventions and sustainable revitalisation strategies.
This research significantly advances existing ecological assessments of urban vacant land through the integration of structured expert validation and scalable GIS-based spatial analyses. The approach bridges theoretical ecological insights with actionable planning frameworks, thereby supporting informed decision-making processes and enhancing urban biodiversity, ecological connectivity, and overall resilience.

2. Materials and Methods

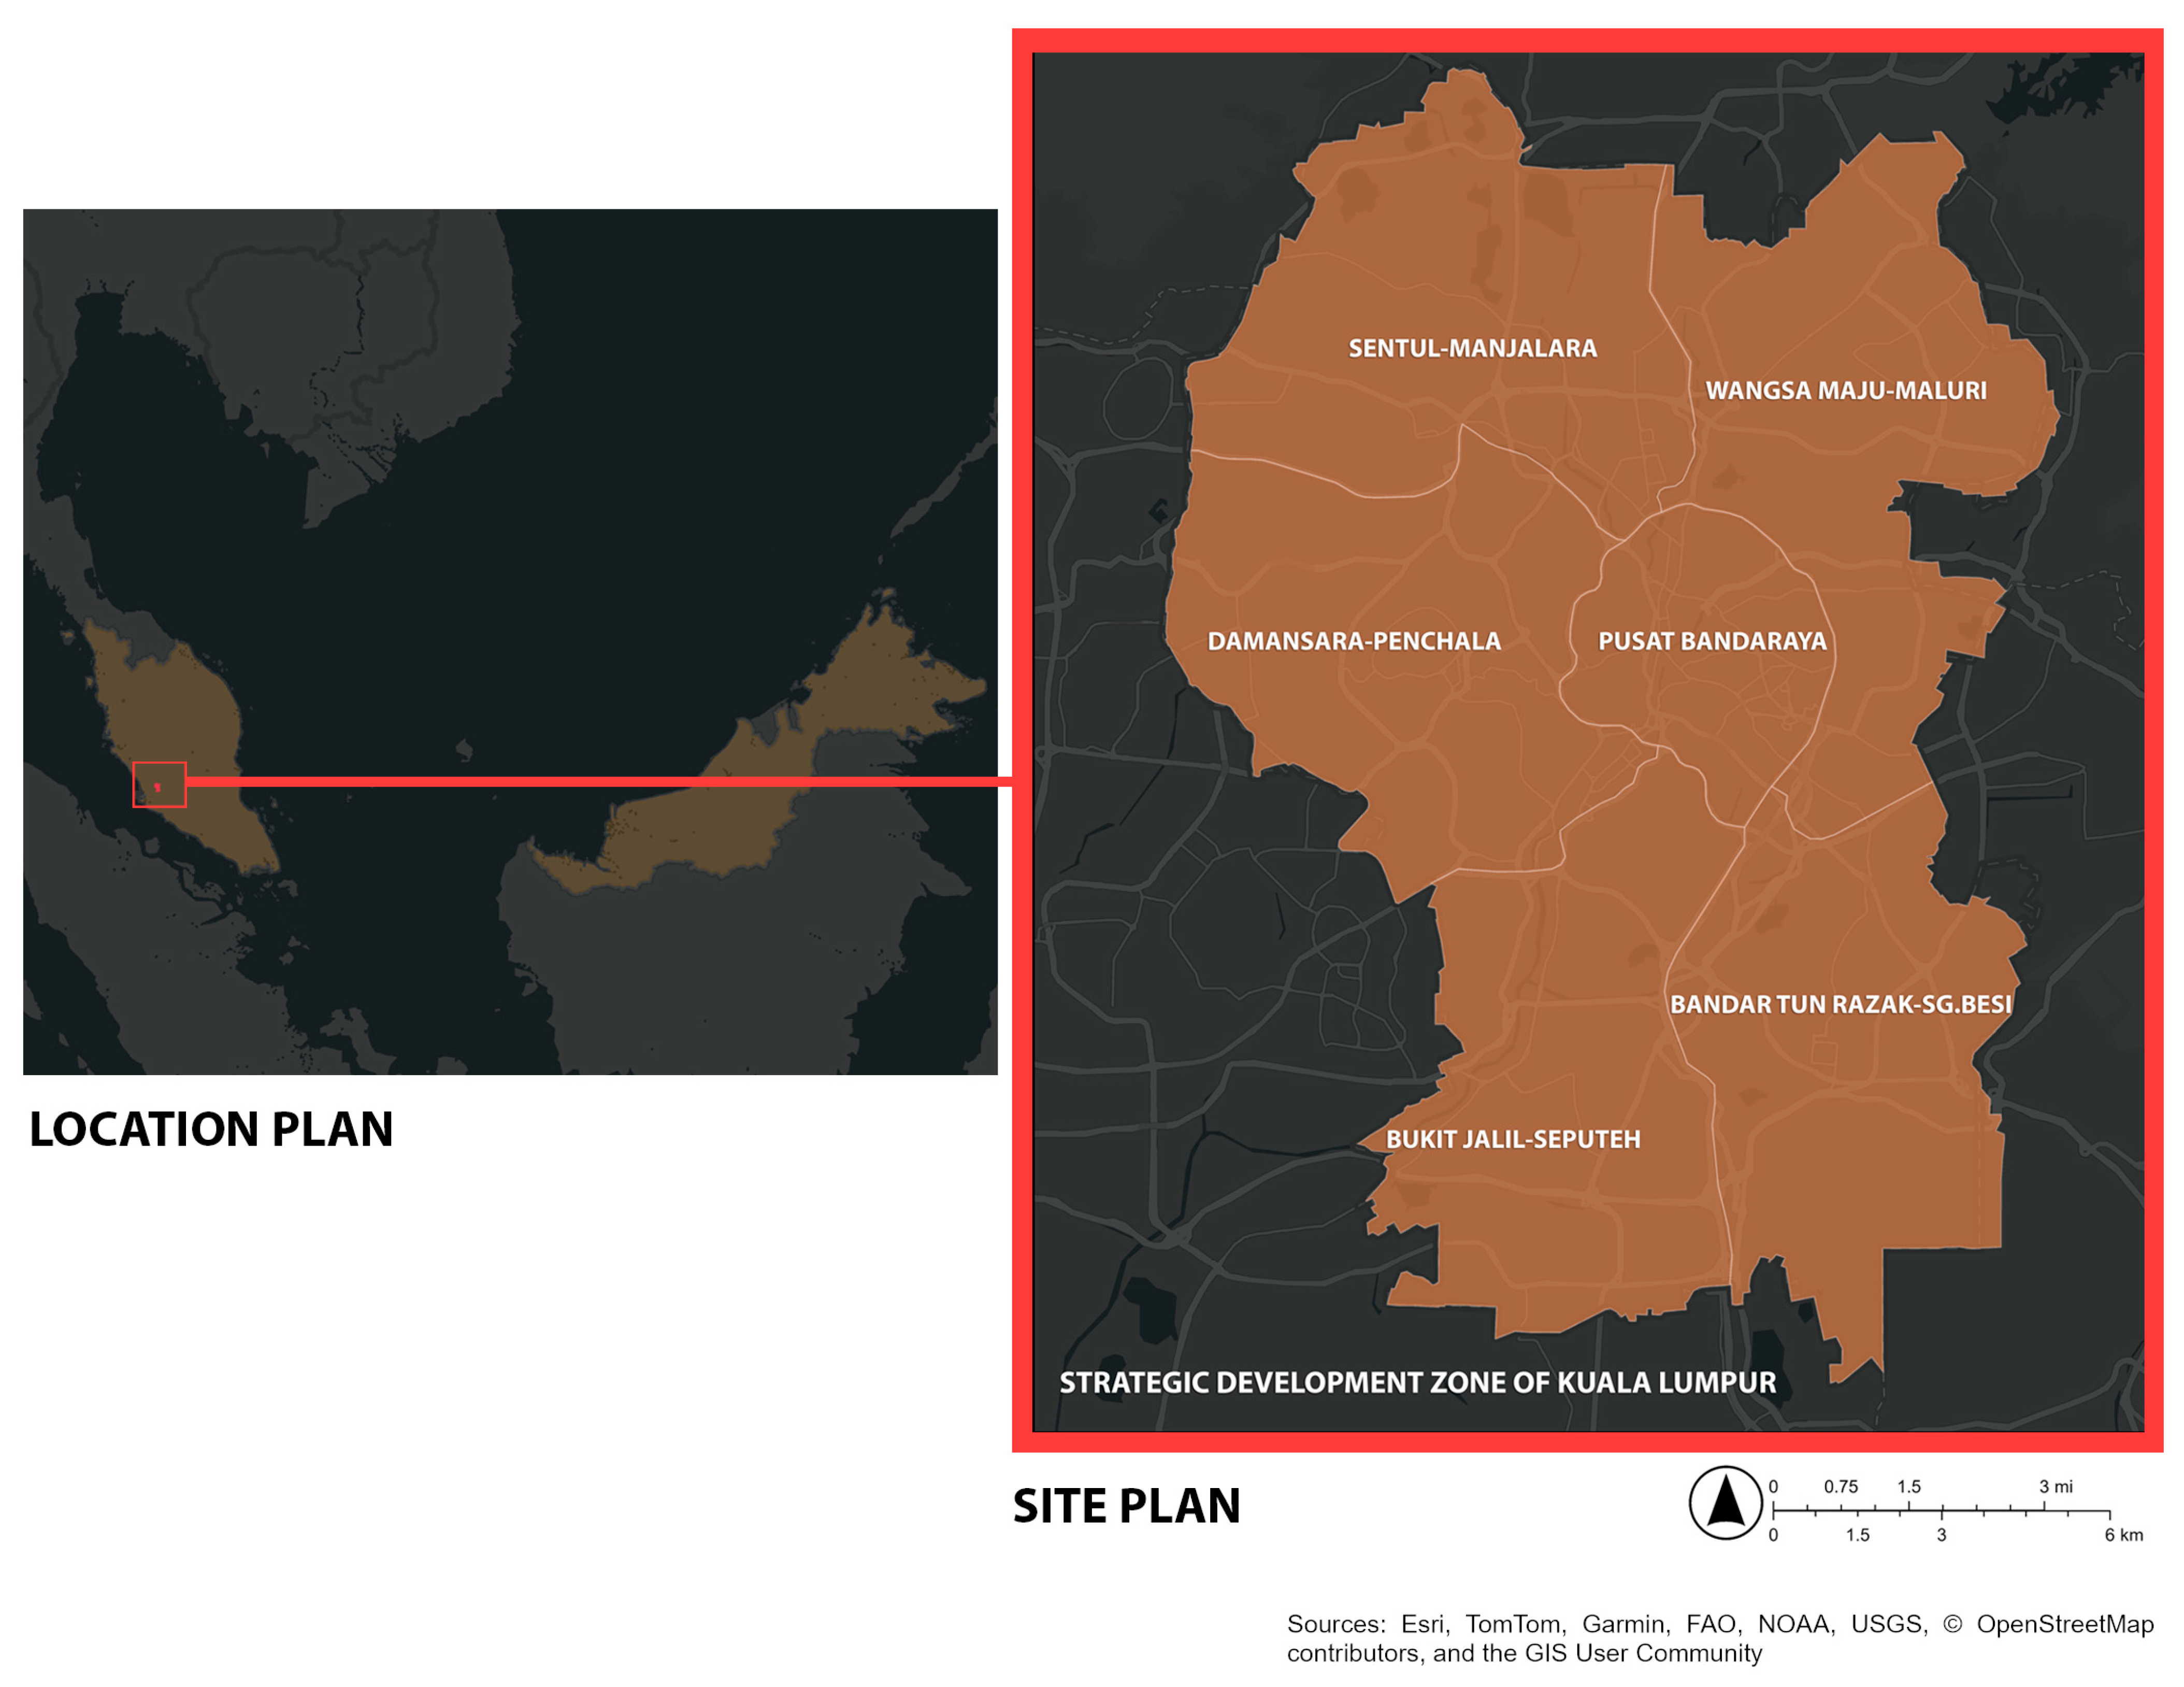
2.1. Study Area and Context

Kuala Lumpur exemplifies rapid urbanisation accompanied by significant ecological challenges, making it an ideal context for assessing the potential of urban vacant land revitalisation. Covering approximately 24,221 ha, the city illustrates the complexities of sustainable urban development in Southeast Asia, where land scarcity frequently conflicts with ecological conservation. In 2021, Kuala Lumpur comprised 78.8% built-up areas and 21.2% non-built-up areas, including approximately 2121.14 ha of undeveloped vacant land [18]. This figure represents a substantial reduction of 35.82% compared to 2018 [19], underscoring the city’s intensifying pressure on available space and highlighting the need for innovative ecological revitalisation approaches.
This study adopts Kuala Lumpur City Hall (KLCH)’s classification of vacant land, defined as parcels without substantial activity for at least six months, to maintain terminological consistency [19]. The city is divided into six strategic development zones: Sentul-Manjalara, Wangsa Maju-Maluri, Pusat Bandaraya, Damansara-Penchala, Bukit Jalil-Seputeh, and Bandar Tun Razak-Sg.Besi (Figure 1). Sentul-Manjalara, identified in the preliminary study for its ecological significance, serves as the selected case study area. Additionally, Kuala Lumpur’s comprehensive geodatabase of vacant land, managed by KLCH, enabled detailed spatial analysis, supporting this study’s aim of bridging the gap between urban planning and ecological sustainability. The rapidly evolving urban context of Kuala Lumpur offers a significant opportunity to explore innovative approaches to vacant land revitalisation, contributing valuable insights for urban sustainability and ecological conservation practices.

2.2. Development of Ecological Indicators Using Fuzzy Delphi Method

A preliminary list of indicators was developed based on the existing literature assessing the ecological value of urban vacant land. Given the multifunctional nature of vacant land—comprising vegetated areas, bare soil, and built surfaces—a thorough characterisation of ecological components was necessary to ensure the assessment was comprehensive. To address this, the identified criteria and indicators were refined through literature synthesis, eliminating redundancy before expert validation.

2.2.1. Content Validity Study

This study conducted a content validity assessment to evaluate the relevance and representativeness of the proposed indicators. Content validity ensures that an instrument effectively captures the concept it aims to measure [20]. The Content Validity Index (CVI) was applied, following a three-step validation process that involved form development, expert selection, and CVI calculation [21]. The Typeform-hosted validation form outlined the study overview, assessment criteria, indicator descriptions, and references. Experts were invited to rate indicator relevance and offer qualitative feedback.
Three experts in landscape and built environments reviewed the questionnaire items independently. Their ratings were converted into a binary scale (Table A1), where scores of 3 or 4 on a 4-point scale were considered valid. The Item-Level Content Validity Index (I-CVI) was used to assess individual indicators, while the Scale-Level Content Validity Index (S-CVI) determined the overall relevance of the questionnaire (Table A2). Following the validation process, one indicator (soil colour) was removed due to low expert agreement. The finalised instrument included 6 ecological criteria and 28 indicators. Further validation and refinement were conducted through the Fuzzy Delphi Method.

2.2.2. Expert Selection and Sampling Design

To ensure diverse perspectives and minimise bias, a heterogeneous panel of experts was selected following the method of Mukherjee et al. [22]. Experts were drawn from fields of urban ecology, urban planning, arboriculture, landscape architecture, urban wildlife ecology, soil science, and hydrology, ensuring a well-rounded evaluation. Selection prioritised individuals with both academic and practical backgrounds, balancing theoretical insights and field expertise.
A purposive sampling approach was used, as it is well-suited for complex environmental assessments, focusing on expertise rather than random selection [23]. Experts were identified via institutional websites, ResearchGate, and Google Scholar, ensuring alignment with the study’s thematic focus. Email invitations were sent to 47 potential panellists, with an expected response rate of 35–75% [24].
The final panel consisted of experts from KLCH, PLANMalaysia, the Forest Research Institute Malaysia (FRIM), and leading Malaysian universities, including Universiti Putra Malaysia, and Universiti Teknologi Malaysia. The Delphi Method’s anonymity encouraged unbiased responses, fostering objective expert judgement. Unlike traditional Delphi studies, the Fuzzy Delphi Method does not require multiple rounds, making it more efficient while maintaining expert consensus.

2.2.3. Phase I—Criteria Development

In Phase I, experts evaluated the relevance of criteria for assessing urban vacant land through an online questionnaire survey conducted via Typeform (Figure 2). The questionnaire, derived from literature reviews, focused on key ecological aspects of vacant land. Experts rated the suitability of each criterion using a seven-point Likert scale, while open-ended response fields allowed them to suggest additional criteria. The online format facilitated efficient data collection and ensured accessibility for all participants. The responses were analysed, and the criteria were refined accordingly.

2.2.4. Phase II—Indicator Development

In Phase II, experts reached a consensus on indicators for the validated criteria using the same online Typeform survey method. The structured questionnaire followed the methodology from Phase I, incorporating a seven-point Likert scale alongside open-ended sections for expert suggestions. This approach enabled systematic data collection and streamlined expert feedback. Indicator selection was guided by quantitative agreement thresholds and qualitative insights, ensuring a rigorous validation process.

2.2.5. Fuzzy Delphi Analysis

This study uses the Fuzzy Delphi Method to validate indicators by incorporating expert consensus while addressing uncertainty. This method uses Triangular Fuzzy Numbers to quantify expert judgement, improving precision over conventional Likert-scale evaluations [26]. The fuzzy scale translates linguistic ratings into numerical values, ensuring interval representation (Table A3).
The analysis followed three key criteria. First, each item had to meet a consensus threshold of d ≤ 0.2, indicating alignment among experts. Second, an item was accepted if at least 75% of experts agreed, ensuring reliable consensus. Finally, the defuzzification process confirmed the final selection, requiring scores to meet or exceed the median threshold. This structured validation process ensured that the final criteria and indicators were scientifically robust, integrating expert insights to enhance the reliability of the ecological assessment framework. The complete computational formulas and conversion scales are provided in the Appendix A.2 for reference.

2.3. Multi-Tier Ecological Assessment Framework

Following the Delphi survey, the criteria and indicators for assessing the ecological potential of urban vacant land were finalised. To ensure an effective validation process, it was necessary to first determine the appropriate level of assessment for each indicator. A multi-tier framework was adopted, providing a structured and scalable approach that allows progressive evaluations tailored to different urban contexts. This study employs a three-level assessment framework. However, due to practical constraints, the focus remains on Level 1 (desktop study) and Level 2 (field survey).
The Level 1 assessment (desktop study) serves as a cost-effective preliminary evaluation, utilising GIS and remote sensing to analyse spatial patterns, vegetation cover, and proximity to ecological features. This broad-scale approach enables the efficient screening of vacant land parcels, helping to prioritise sites for further investigation based on their conservation potential. The Level 2 assessment (field survey) builds upon these findings by conducting on-site validation, capturing real-time ecological conditions that cannot be fully assessed through remote sensing. This stage involves visual assessments of vegetation types, soil conditions, and habitat characteristics, ensuring more comprehensive ecological evaluation.
Although Level 3 (expert evaluation) is essential for a deeper ecological assessment, it was not included in this study due to resource limitations. Typically, this level involves advanced methodologies such as field sampling, laboratory analysis, and statistical modelling, requiring specialised expertise, additional time, and greater financial investment. Given these constraints, prioritising Levels 1 and 2 allowed for a practical yet scientifically robust assessment. However, incorporating Level 3 assessments in future research or urban planning initiatives could enhance the precision and depth of vacant land evaluations.
Once the assessment levels were determined, data collection was conducted to validate the indicators. Indicators that could be evaluated through spatial analysis and remote sensing were assessed using GIS-based methods (Level 1), while indicators requiring direct field observation were examined through on-site surveys (Level 2). This structured, multi-tiered approach ensures comprehensive and resource-efficient ecological assessment, supporting data-driven conservation strategies and optimising the integration of vacant land into sustainable urban planning.

2.4. Data Collection and Analysis

2.4.1. Study Area Selection and Preliminary Assessment

To optimise time and resources, this study focused on a single strategic development zone in Kuala Lumpur. Selecting the most suitable zone was crucial to ensuring the maximum representation of vacant land near key ecological features. Hot spot analysis was conducted in a separate study to identify vacant land concentrated near green spaces and water bodies. The zone with the highest ecological proximity was selected for field surveys, ensuring that data collection targeted environmentally valuable areas. This strategic approach provided a representative sample in terms of integrating vacant land into Kuala Lumpur’s green infrastructure and enhancing its urban ecological network.
Since this study relied on the 2018 Kuala Lumpur land use map, some vacant land parcels may have been developed or altered. A preliminary GIS-based assessment was conducted to update the vacant land feature layer, ensuring accurate site selection. Similarly to Kremer et al. [12], Google Earth and Google Street View were used to verify current land use conditions. Given the large number of vacant parcels, surveying every site was impractical. A systematic prioritisation approach was adopted, integrating GIS-based ancillary data and visual verification techniques to refine the selection process.
A scoring system was developed to optimise resource allocation and effectively prioritise parcels with the highest ecological potential for field surveys. The scoring criteria included two primary considerations: visual accessibility (clear visibility of the site from public roads or streets) and physical classification (dominance of vegetation cover). Each criterion was scored separately, assigning 1 point for clear visibility and 1 point for parcels predominantly covered by vegetation (see Table 1). Thus, the cumulative score for each parcel ranged from 0 (no visibility, no significant vegetation) to 2 (clearly visible and predominantly vegetated). Parcels scoring 2 points—indicating clear visibility and significant vegetation coverage—were prioritised for field surveys, as these parcels were considered the most ecologically relevant and feasible for detailed site assessment. Parcels scoring 1 point or below were excluded to ensure the efficient use of resources by focusing on sites most likely to yield meaningful ecological insights.

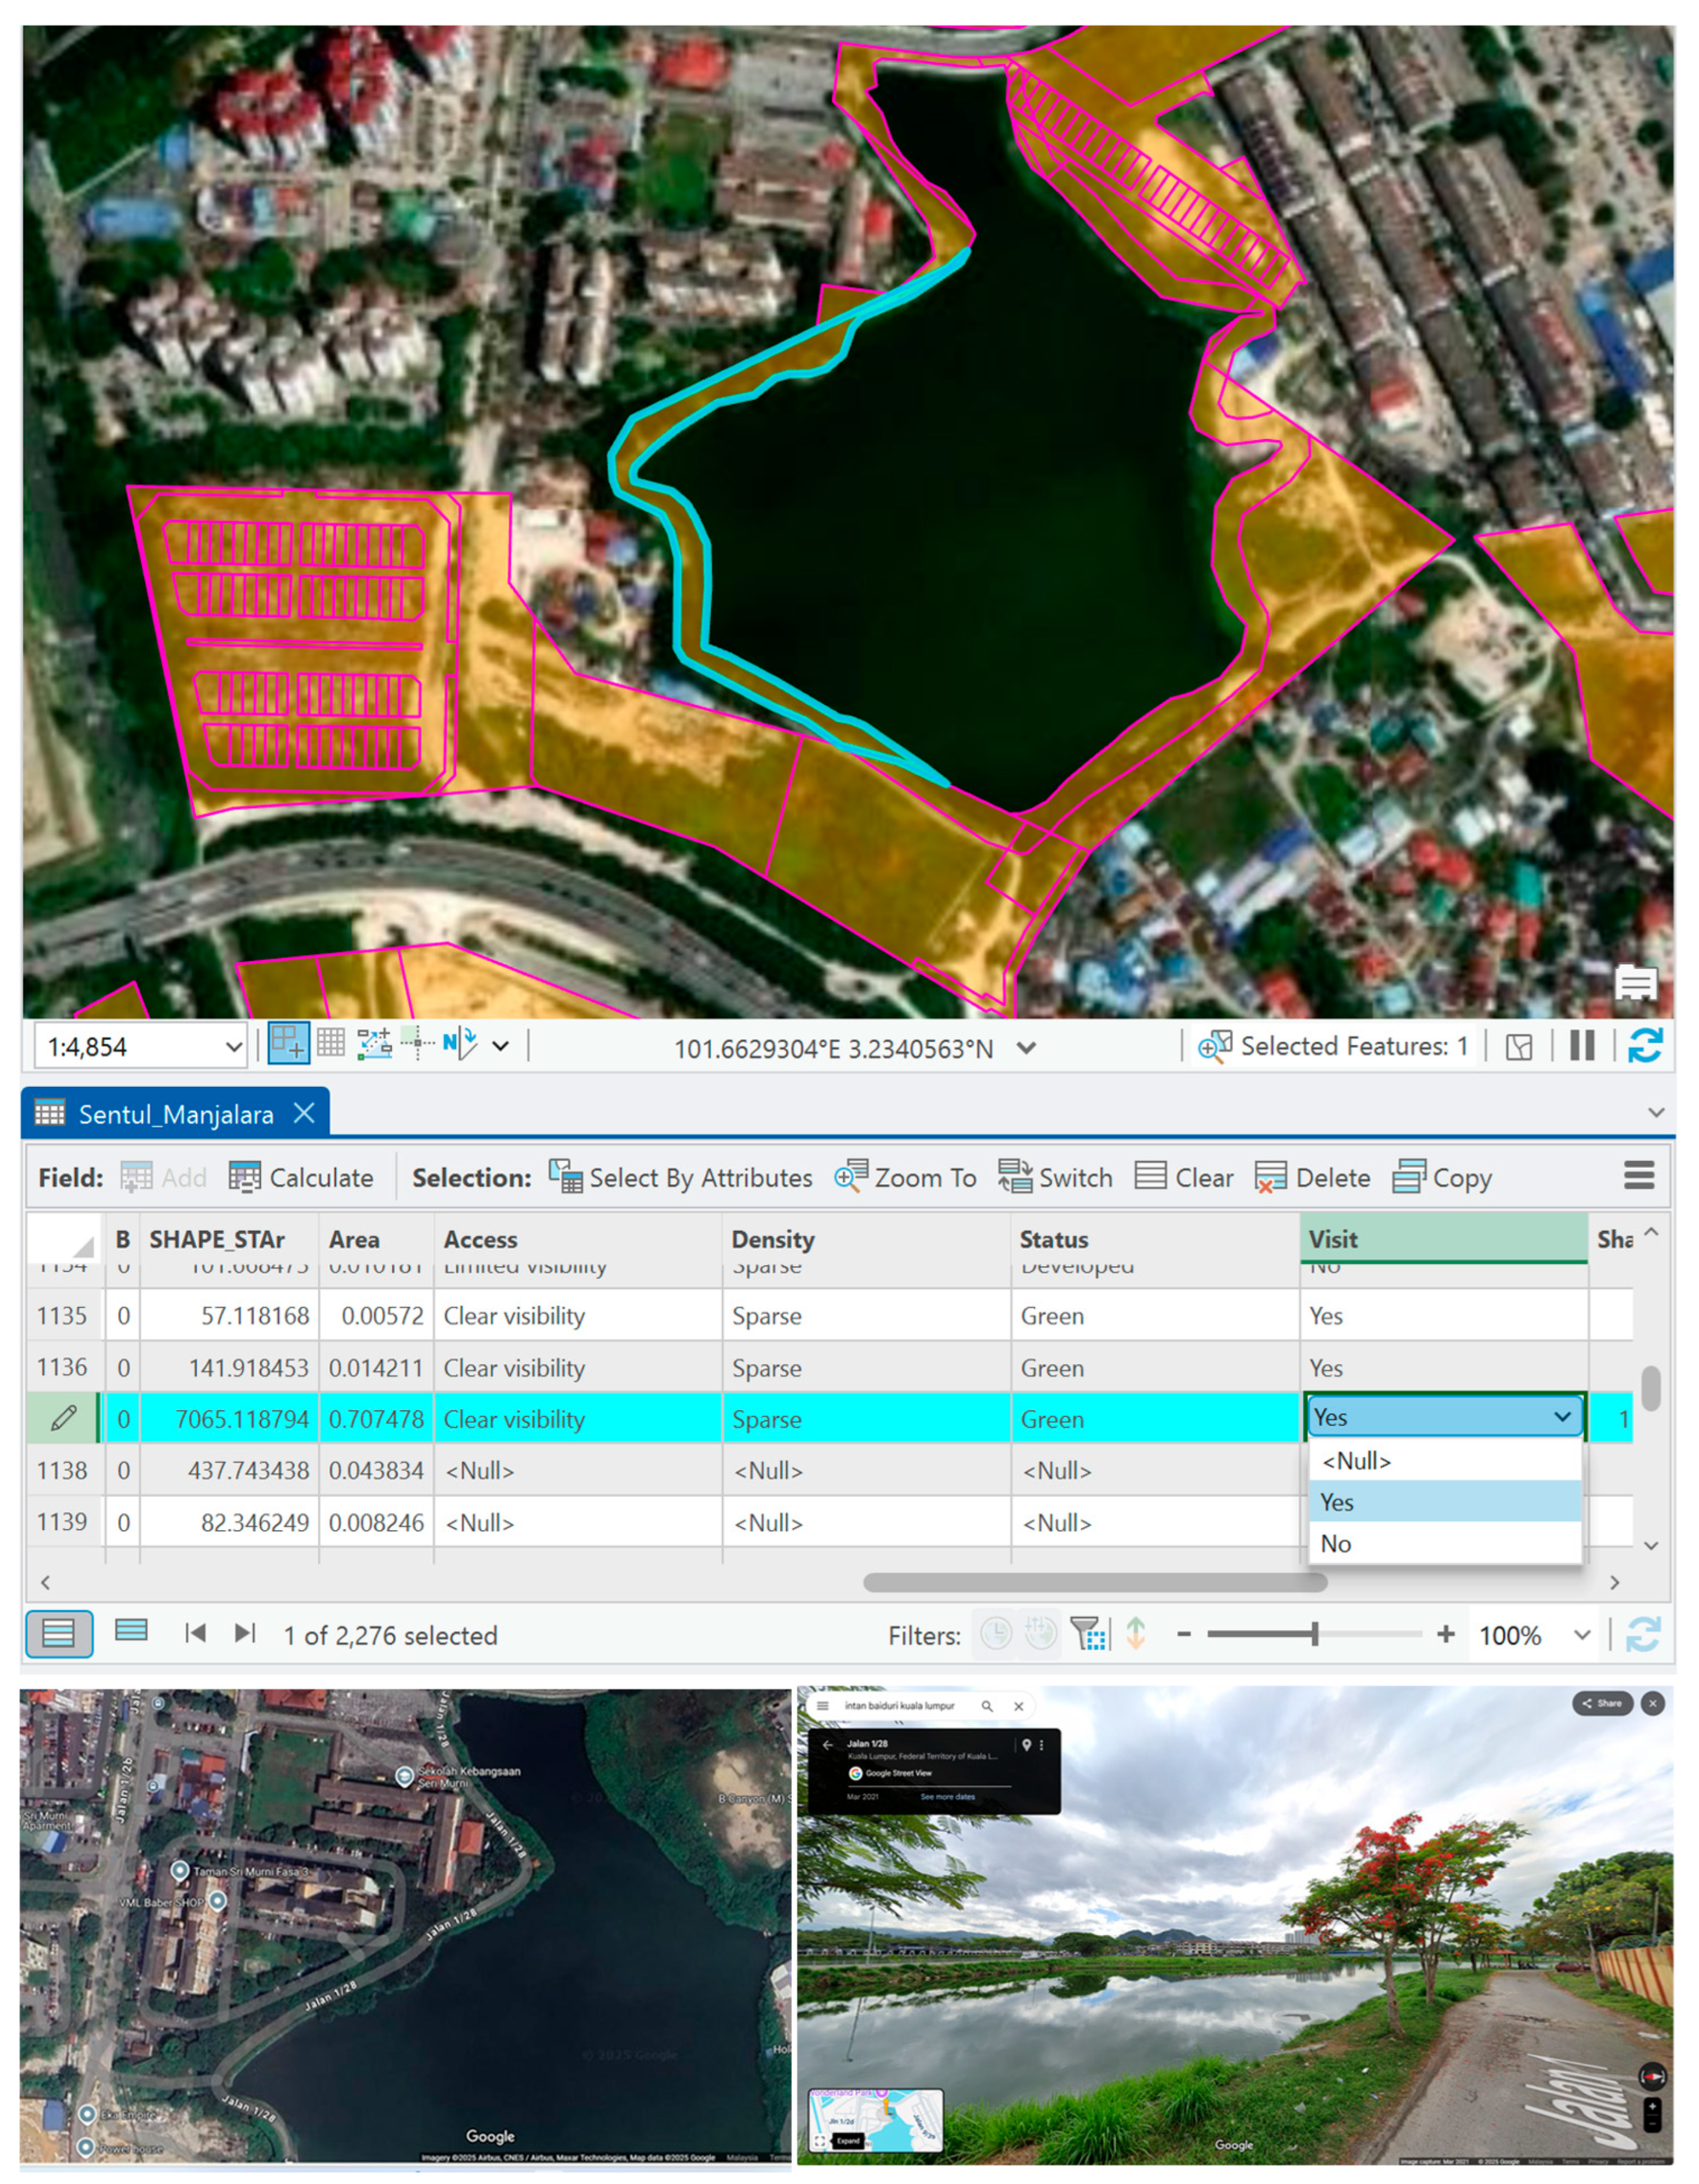
2.4.2. Web Map Creation

Finalised vacant land parcels that met the selection criteria were uploaded into ArcGIS Online and integrated into a web map (Figure 3). The validated assessment indicators were then incorporated into the feature layer, ensuring a structured evaluation framework. To facilitate real-time data collection, the feature layer was synchronised with ArcGIS Field Maps (June 2022 release)., a mobile application enabling field observations and georeferenced data capture.

2.4.3. Data Collection for Level 1

The Level 1 assessment was conducted using GIS-based analysis to evaluate indicators that could be assessed remotely. The same web map (Section 2.4.2) was integrated with key spatial layers such as the 2018 Kuala Lumpur land use map (green spaces, water bodies, vacant land) and satellite imagery. Indicators were scored directly within the GIS platform, enabling a systematic, cost-effective assessment to identify priority sites for further field validation.

2.4.4. Data Collection for Level 2

The Level 2 assessment involved field surveys to evaluate indicators requiring direct on-site observation. Ecological attributes such as vegetation type, soil conditions, and habitat features were documented, with georeferenced data collected using ArcGIS Field Maps (June 2022 release). This mobile application was selected for its offline data collection capabilities, user-friendly interface, and seamless GIS integration, ensuring efficient and structured data acquisition for vacant land evaluation.

2.4.5. Overlay Analysis

Overlay analysis in GIS is a spatial analysis technique used to identify relationships between multiple layers of spatial data. This method is particularly effective in environmental and urban planning where various spatial factors need to be evaluated simultaneously [27]. Functions of overlay analysis include combining diverse datasets to reveal new insights, identifying spatial patterns, and supporting decision-making processes by integrating various criteria. Overlay analysis merges datasets and creates composite maps that highlight areas of interest or concern. In ArcGIS Pro 3.0.3, the weighted sum tool is located within the Overlay toolbox. It was used in this study to integrate ecological indicators from Level 1 and Level 2 assessments. In the context of mapping vacant land with potential ecological values, the tool was employed to combine input rasters representing different indicators. Although the tool allows for the assignment of different weights, all indicators in this study were treated as equally important. No differential weighting was applied in order to maintain transparency and avoid subjectivity in the absence of empirically established weight criteria.
The process of conducting an overlay analysis in ArcGIS Pro, integrating data from Level 1 and Level 2 assessments, involved several steps to ensure accurate and meaningful results. Initially, the Level 1 assessment was conducted to score indicators using various datasets that were relevant to the criteria being assessed. Subsequently, the Level 2 assessment involved conducting detailed field surveys to collect specific data on each parcel, as well as ranking each parcel based on the specified indicators.
Once the ranking was completed for Level 1 and Level 2 assessments, the feature class for Sentul-Manjalara vacant land was downloaded from ArcGIS Online into the desktop version. The next step was converting each indicator into raster format. This was achieved using the ‘Polygon to Raster’ tool in ArcGIS Pro 3.0.3, ensuring that the data was in a format suitable for raster analysis. This conversion was critical for the subsequent steps of the overlay analysis. The input rasters were then prepared, ensuring that all rasters representing each indicator were converted from the polygon format. Once the input rasters were ready, the weighted sum tool was utilised. Within the Overlay tool, the prepared input rasters were added, each representing a specific criterion from the Level 1 and Level 2 assessments. Running this tool combined the rasters into a single, integrative output raster that reflected the combined significance of all input criteria.
Post-analysis, the output raster was interpreted to identify areas with varying levels of conservation potential. Higher values in the output raster indicated parcels with higher conservation potential based on the integrated criteria at both assessment levels. To further facilitate urban planning, the results were classified into categories of high, medium, and low potential for urban vacant land conservation. This classification was based on predetermined threshold values, ensuring that the conservation potential of each parcel was clearly delineated. The final step involved generating a conservation potential map from the results of the overlay analysis. This map highlighted areas of vacant land with high, medium, and low conservation potential, providing a valuable tool for urban planners. Offering a clear visual representation of conservation priorities significantly enhances the planners’ ability to make informed, strategic decisions that align with ecological and urban development goals.

3. Results and Discussion

3.1. Finalisation of Ecological Indicators and Level of Assessment

This study aimed to establish a structured set of criteria and indicators for assessing the ecological potential of urban vacant land. Using the Fuzzy Delphi Method, expert validation was conducted through two phases of online surveys. A content validity study initially assessed the 49-item questionnaire, which included 42 Likert-scale questions and 7 open-ended responses (Table S1). The Item-Level Content Validity Index (I-CVI) confirmed that 48 items scored 1.00, while 1 item (soil colour) scored 0.33 and was removed. The Scale-Level Content Validity Index (S-CVI) Universal Agreement (UA) method further validated the instrument, finalising 6 criteria and 28 indicators for Delphi evaluation.

3.1.1. Phase I Fuzzy Delphi

In Phase I, sixteen experts participated in evaluating the relevance of criteria for assessing the ecological value of vacant land. The Fuzzy Delphi analysis involved multiple validation steps, detailed in Tables S2–S6, including the conversion of Likert-scale responses into fuzzy scores (Table S2), the calculation of average fuzzy scores (Table S3), the determination of threshold values (Table S4), the compilation of expert consensus results (Table S5), and the defuzzification process (Table S6). As shown in Table 2, five of the six proposed criteria were accepted, having met all three Fuzzy Delphi validation conditions.
In contrast, the criterion structure was rejected due to its failure to meet the consensus threshold. The criterion achieved only 56.25% expert agreement, with a d-value of 0.353, indicating significant variability in expert opinions regarding its relevance. The exclusion of structure underscores the experts’ view that natural ecological attributes, such as vegetation and soil conditions, are more critical in conservation assessments than built environment features. This finding reinforces the study’s focus on ecological sustainability and aligns with urban greening initiatives aimed at prioritising vacant land based on ecological value.
Experts also proposed three additional criteria—human disturbance, distance to roads, and the presence of forest patches—that had already been incorporated as indicators in Phase II. While criteria such as land use, zoning, ownership, and accessibility were not deemed directly relevant to this study’s ecological focus, they remain significant for broader urban planning considerations and could be explored in future studies on vacant land management.

3.1.2. Phase II Fuzzy Delphi

In Phase II, seventeen experts participated in the finalisation of indicators for the five criteria validated in Phase I. The assessment followed the seven-point Likert scale, refining indicators based on expert consensus. The Supplementary Data provides detailed information on the fuzzy scale conversion (Table S7), fuzzy score calculations (Table S8), threshold values (Table S9), expert agreement (Table S10), and the defuzzification process (Table S11) for vegetation-related indicators. Table 3 summarises the results for each criterion presented in Phase II of the Delphi survey.
The finalised framework consists of 5 criteria and 23 validated indicators, forming a structured tool for assessing the ecological value of urban vacant land (Figure 4). The Delphi method effectively facilitated the development of expert consensus, ensuring the practical applicability of the proposed indicators. Its reliability in urban ecological planning is supported by previous studies, including those conducted by de Hierro et al. [28] and Gavrilidis et al. [17], which highlight the effectiveness of expert-driven methodologies in refining ecological assessment frameworks. These findings confirm that structured expert engagement strengthens decision-making in urban management, enabling the integration of vacant land into sustainable urban planning strategies.

3.2. Integration of Level 1 and 2 Assessment

Validating criteria and indicators is crucial for assessing the conservation potential of vacant land. Building on previous research by Sanches and Pellegrino [16] and Gavrilidis et al. [17], this study uses field surveys to comprehensively validate the proposed criteria and indicators. The following section details how this study categorises the identified indicators into level of assessments and explains the selection of field survey sites. This strategic selection enables thorough and context-specific validation, ensuring that the criteria and indicators are both practical and effective in real-world scenarios.

3.2.1. Level of Assessments

The findings underscore the value of a tiered assessment framework in evaluating the ecological potential of urban vacant land. Differences in data collection requirements across the validated indicators highlight the need for a structured, multi-level approach to ensure both efficiency and ecological rigour. Level 1 (desktop study) efficiently identified broad-scale ecological characteristics, such as proximity to green spaces and land use patterns, through GIS-based spatial analysis. However, certain indicators, such as soil condition and habitat structure, required on-site verification, making Level 2 (field survey) essential for real-time data collection. For indicators requiring in-depth ecological analysis, Level 3 (expert evaluation) was recognised as necessary. However, this was beyond this study’s scope due to resource constraints. Indicators such as biochemical oxygen demand (BOD) and species diversity assessment would require laboratory testing or taxonomic expertise, suggesting potential future applications of Level 3 assessments. Table 4 presents the categorisation of indicators based on assessment levels, illustrating which criteria could be assessed using remote sensing and GIS (Level 1), direct observation (Level 2), or expert analysis (Level 3). The framework ensures a systematic and scalable approach, optimising resource allocation while maintaining scientific robustness.

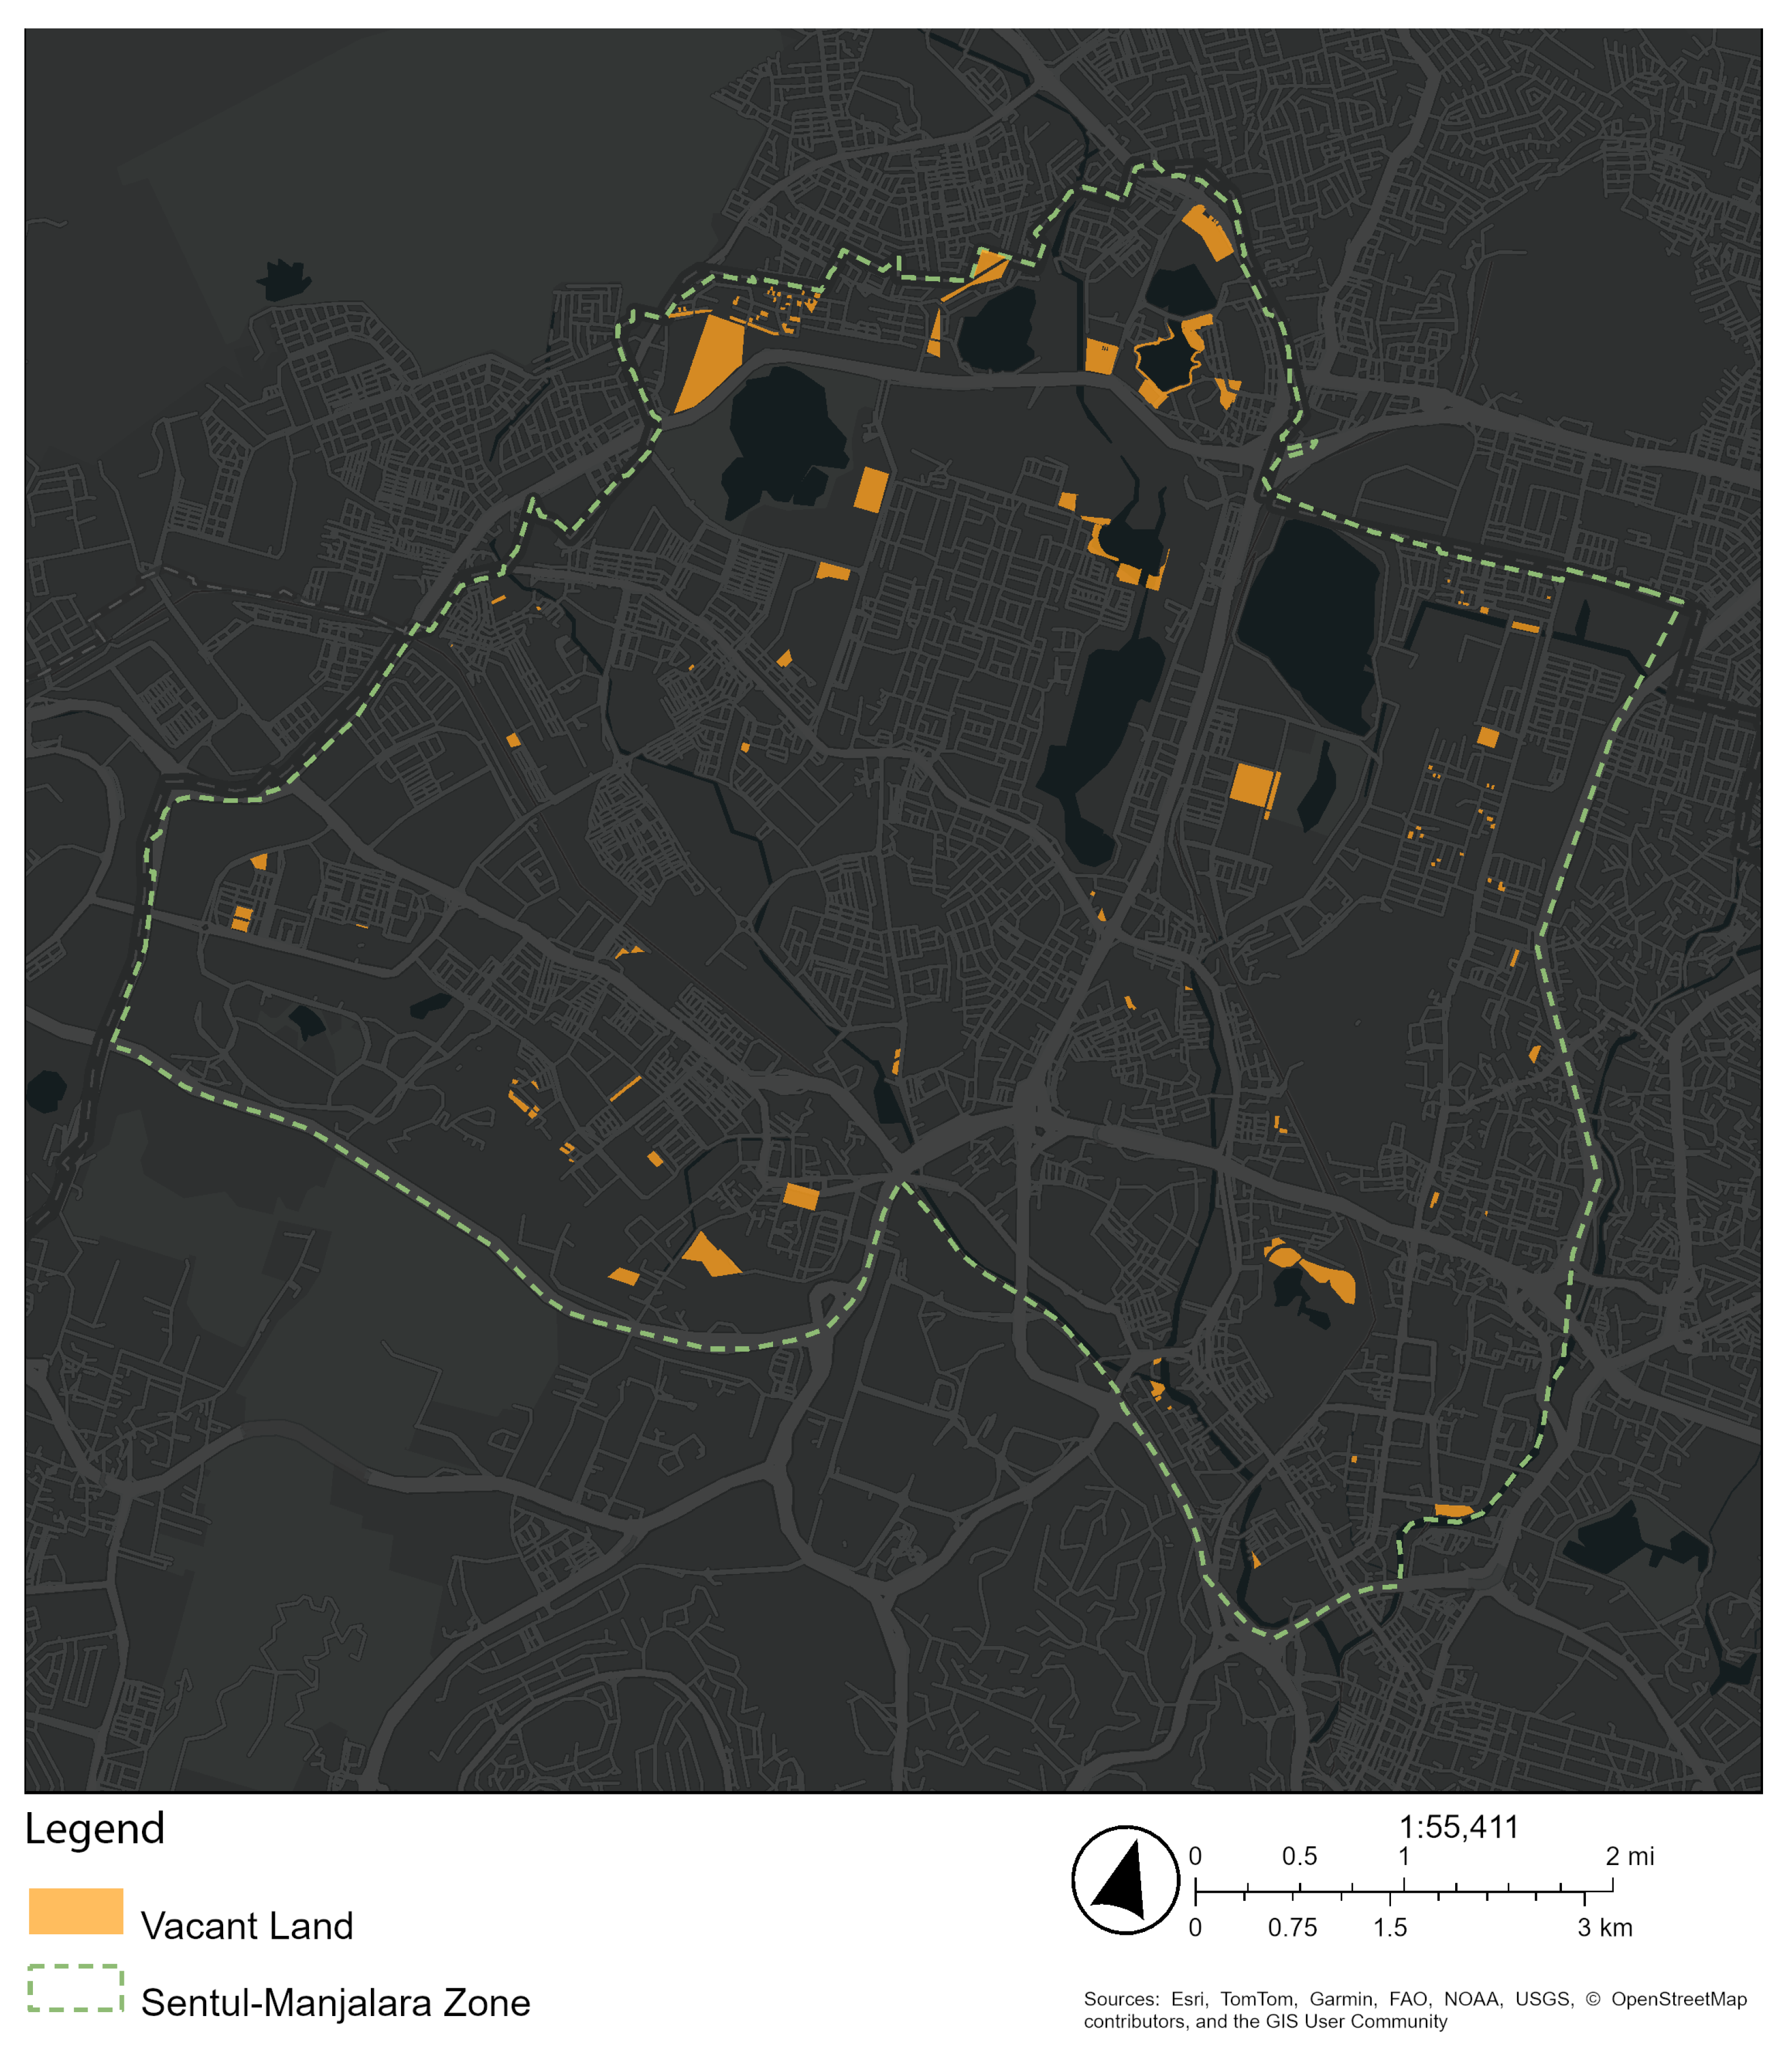
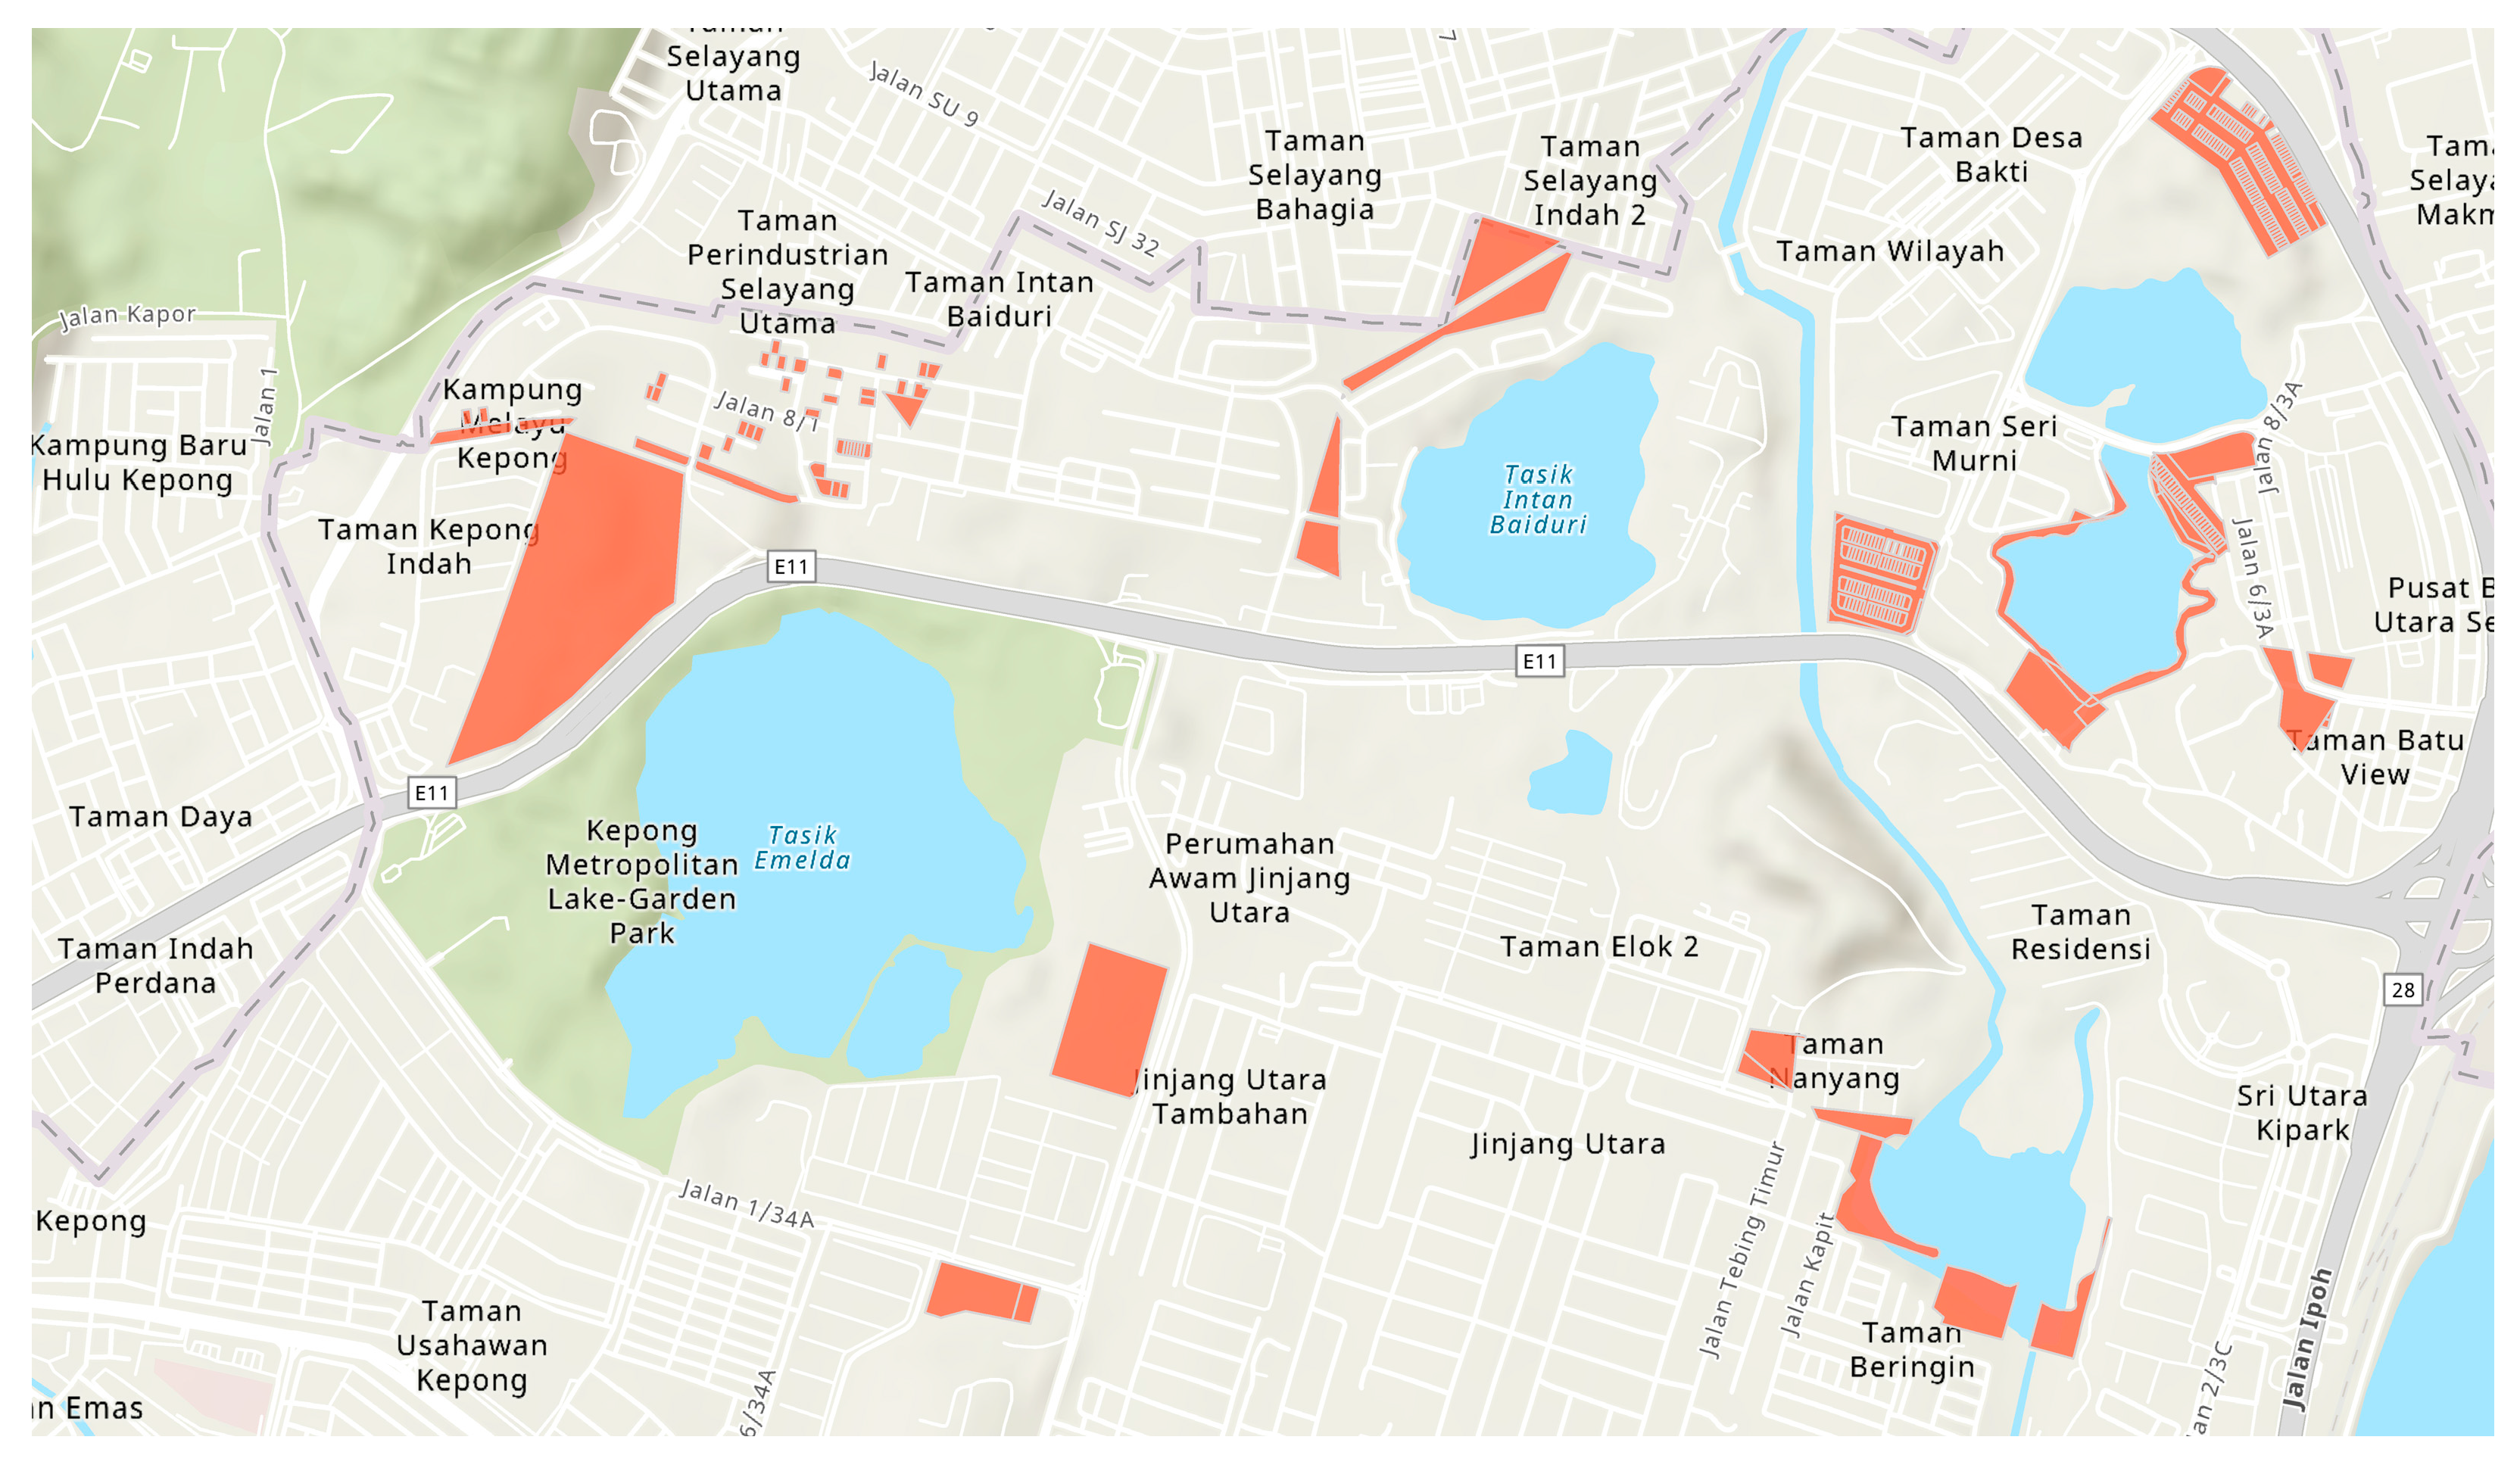
3.2.2. Sentul-Manjalara as Field Survey Site

Among the six strategic zones in Kuala Lumpur, Sentul-Manjalara was purposively selected for the field survey (Figure 5). This choice was informed by hot spot analysis results, which indicated its proximity to green spaces and water bodies (Figures S1 and S2 and Table S12). Notably, the zone possesses a significant concentration of green spaces and water bodies adjacent to vacant land parcels, making it a prime location for potential ecological enhancement within the urban landscape. Considering the confluence of vacant land, green spaces, and water bodies (cold spots), it is believed that Sentul-Manjalara exhibits the most pronounced ecological value among Kuala Lumpur’s urban areas. This strategic zone will serve as a focal point for ecological assessment and planning, thus advancing the understanding of ecological value inherent in such urban landscapes.
The assessment of vacant land parcels in Sentul-Manjalara was carried out, using the criteria listed in Table 1, to identify the most suitable sites for field surveys. The selection process prioritised visual accessibility and vegetation cover to ensure efficient resource allocation. A total of 2276 vacant land parcels were evaluated and updated within the feature class in ArcGIS Pro 3.0.3. Two attribute fields—visual accessibility and physical classification—were created to facilitate the systematic scoring of each parcel based on visibility and vegetation dominance. This assessment was further supported by remote verification using Google Earth and Google Street View (Figure 6), which helped to reduce unnecessary field visits and optimise resource use.
Following this assessment, the site selection was refined using the ‘Select by Attributes’ tool to isolate parcels with clear visibility and substantial vegetation cover. Based on these criteria, 469 vacant land parcels were selected for field surveys. The integration of updated spatial data within GIS strengthened the accuracy of the assessment and reinforced its applicability for conservation planning in Kuala Lumpur.

3.2.3. Level 1 Assessment of Sentul-Manjalara Vacant Land Parcels

Following the selection of vacant land parcels for the validation of the identified indicators, the next stage of this study focused on evaluating Level 1 indicators to determine the conservation potential of vacant land within the Sentul-Manjalara zone. This assessment utilised ArcGIS Online, with satellite imagery from the year 2021 as the basemap. The selected indicators, outlined in Table 5, included vegetation cover, the presence of water bodies, and various site context elements such as connectivity with green spaces, matrix contrast, and a surrounding built-up area. Each vacant land parcel was scored based on its condition and relationship with its site context according to these indicators.
The assessment began by analysing the percentage of vegetated area (Figure 7) and the presence of water bodies (Figure 8). As shown in Table 5, vegetation cover was scored on a scale from 0 to 4, with higher scores indicating greater percentages of vegetated area. Similarly, the presence of water bodies was a binary indicator, where vacant land parcels adjoining water bodies were assigned a score of 1, and those without were assigned a score of 0. These indicators were crucial in establishing the ecological value of each parcel, with higher scores indicating higher potential for conservation.
The site context indicators assessed connectivity with other green spaces and matrix contrast, respectively. Figure 9 illustrates the use of buffers at 100 m, 500 m, and 1000 m distances to evaluate connectivity with other green spaces. Parcels within proximity of existing green spaces scored higher, reflecting their greater ecological integration. Similarly, matrix contrast was assessed by examining tree cover within a 500 m radius, with higher percentages of tree cover receiving higher scores. These spatial analyses were pivotal in identifying parcels that contribute significantly to the ecological network of the area. Another important indicator was the surrounding built-up area, which considered the extent of urban development around each parcel. As indicated in Figure 10, buffers were again utilised to measure the built-up area within a 500 m radius. Parcels surrounded by less urban development scored higher, suggesting a lower level of ecological disturbance and greater potential for conservation.
The desktop-level assessment, facilitated by ArcGIS Online, provided several advantages for urban planners. This method allowed for the comprehensive and systematic evaluation of multiple spatial factors without the need for extensive fieldwork, thus saving time and resources. The integration of various data layers and the application of buffers enabled the detailed analysis of the spatial relationships and ecological context of each parcel. However, several challenges may arise during this assessment process. The accuracy of the analysis heavily depends on the quality and resolution of the satellite imagery used. Any discrepancies or outdated imagery could lead to inaccurate assessments.
The Level 1 assessment using ArcGIS Online and 2021 satellite imagery successfully identified vacant land parcels with high conservation potential in the Sentul-Manjalara zone. By scoring each parcel based on vegetation cover, the presence of water bodies, connectivity with other green spaces, matrix contrast, and the surrounding built-up area, a comprehensive understanding of the ecological value of each parcel was achieved. Desktop-level assessment is a valuable tool for urban planners, offering a strategic approach to identifying potential green spaces, though it should ideally be complemented by field surveys for more detailed evaluation.

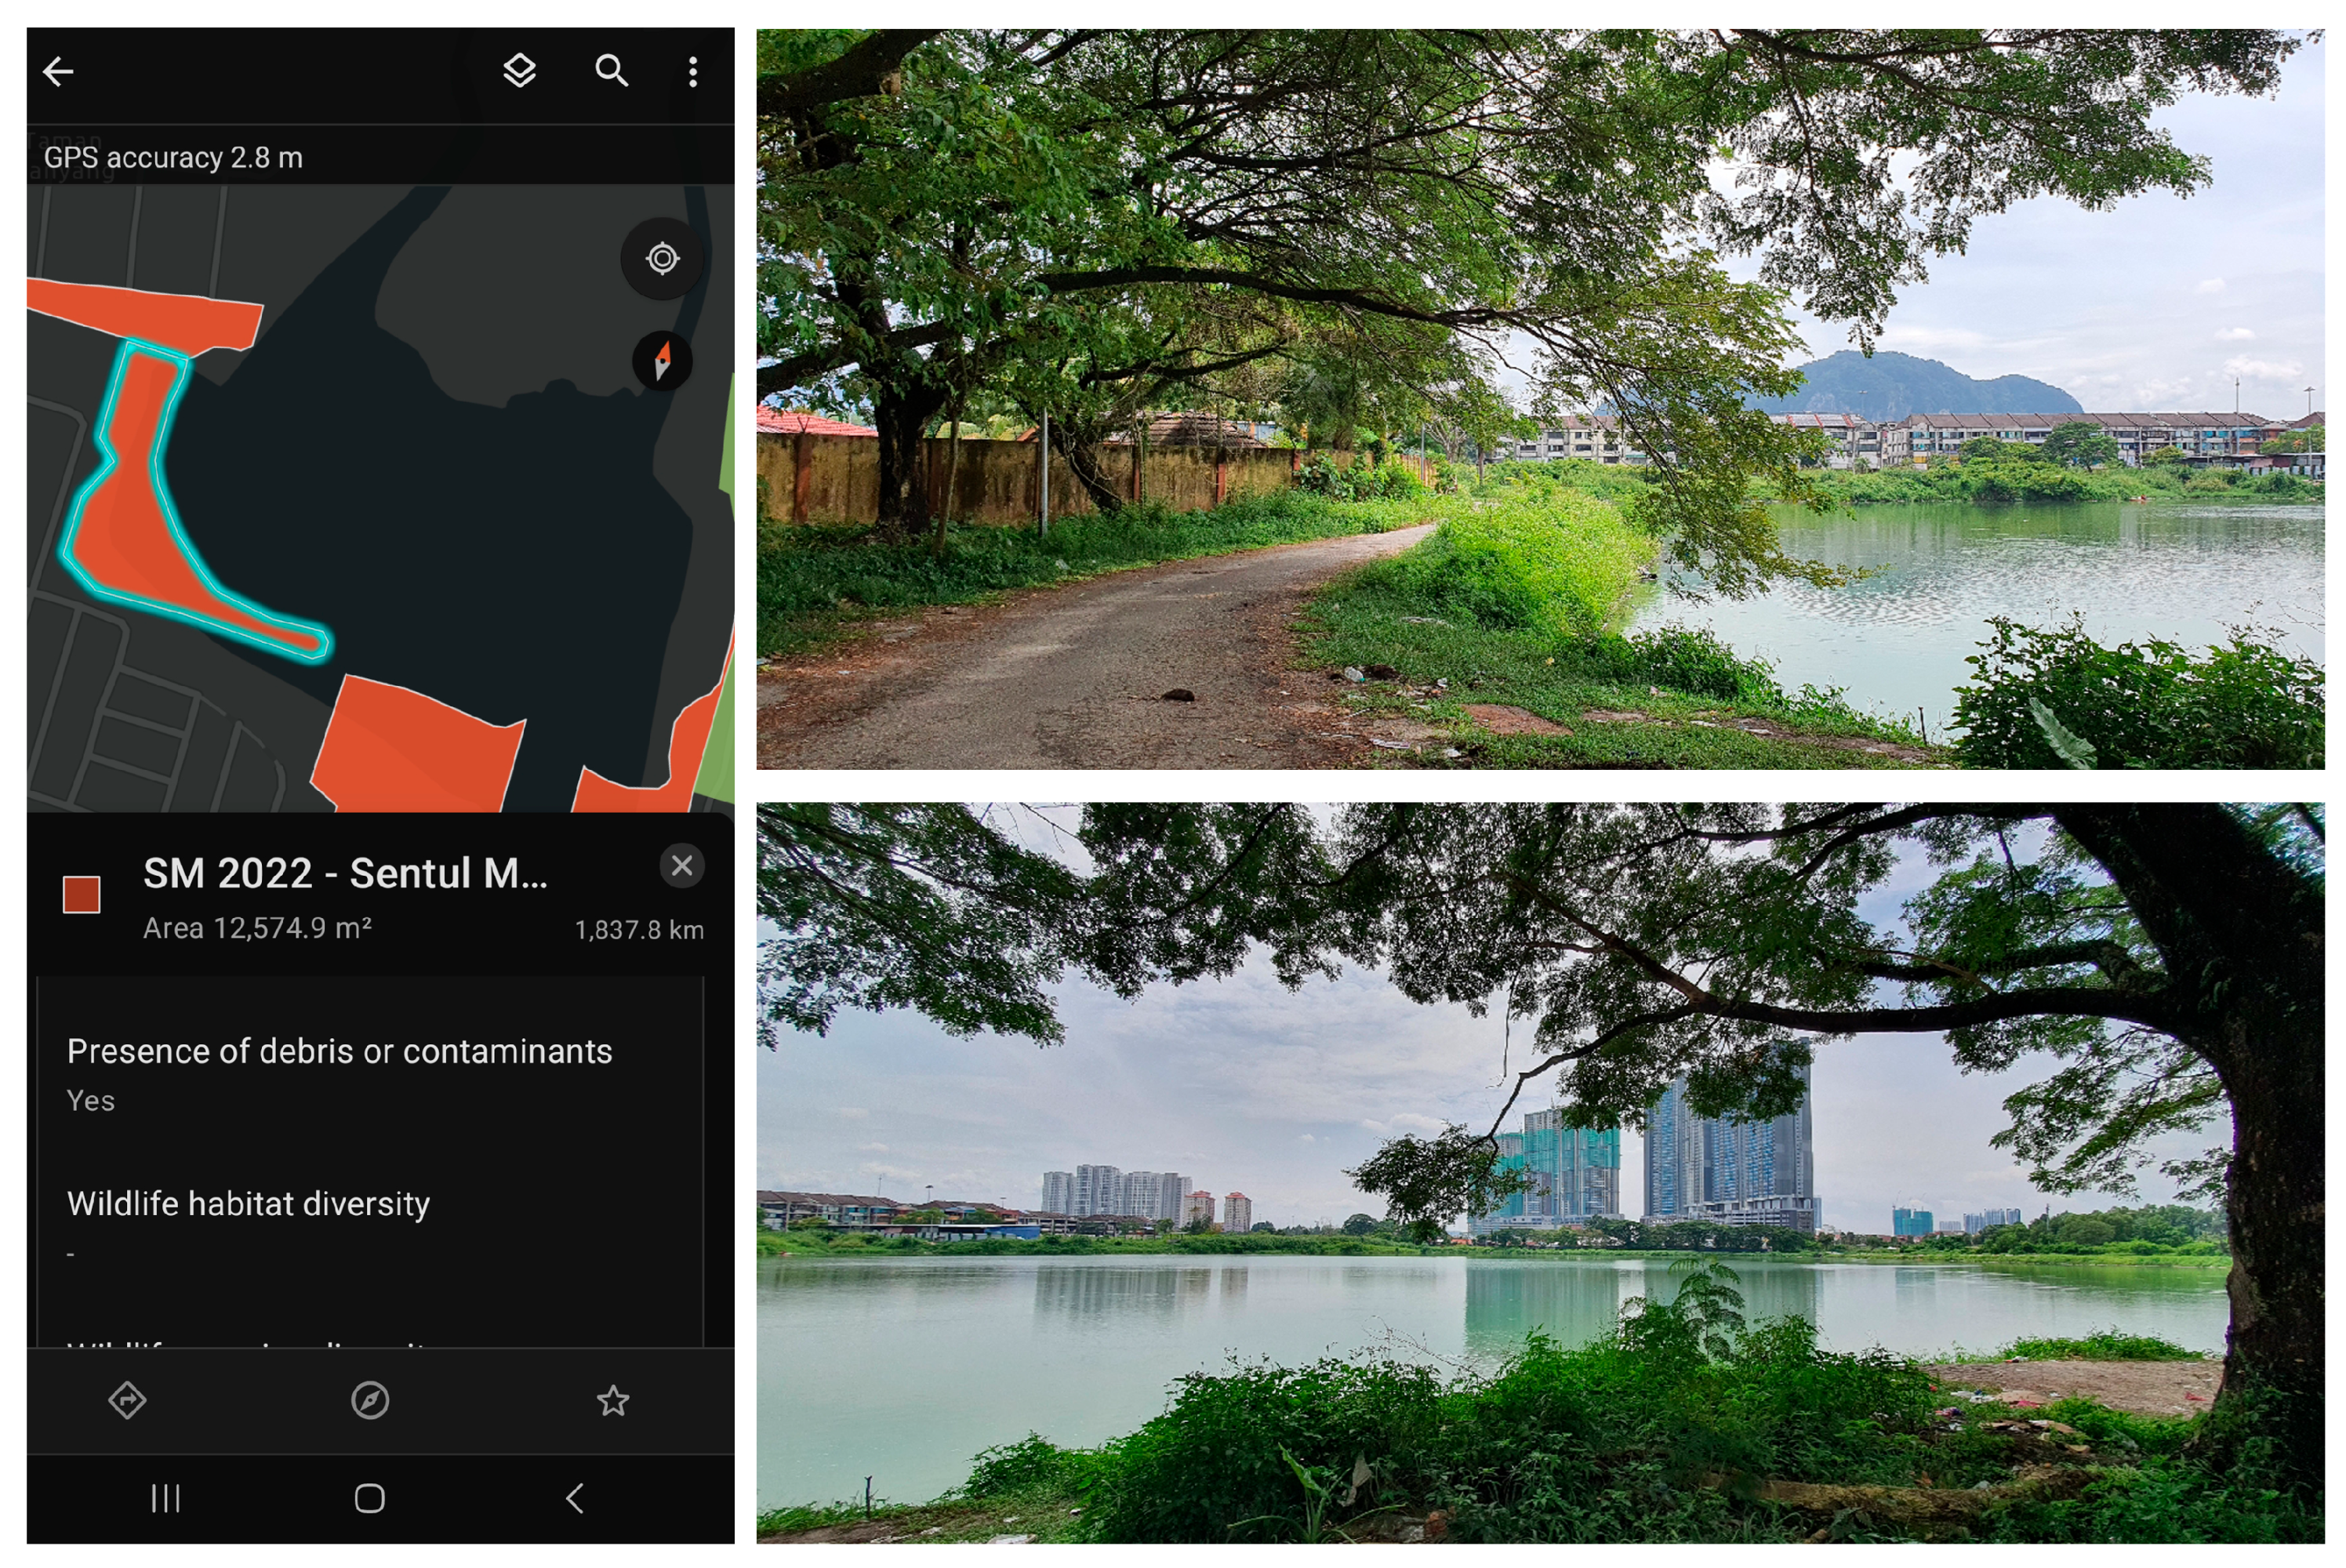
3.2.4. Level 2 Assessment of Sentul-Manjalara Vacant Land Parcels

The Level 2 assessment involved performing field surveys to evaluate vacant land parcels based on key indicators outlined in Table 6, including nutrient enrichment, the presence of debris or contaminants, and habitat naturalness. A pilot study in the Pusat Bandaraya zone, Kuala Lumpur, tested Field Maps’ functionality to confirm its suitability for data collection. This trial phase allowed for familiarisation with the application’s features and the refinement of data collection protocols. The actual field survey was carried out in Sentul-Manjalara, where vacant land parcels were systematically assessed using Field Maps, a mobile application by ESRI. All field data, including georeferenced observations, were directly recorded within the Field Maps, ensuring seamless integration with GIS for further analysis.
Figure 11 provides an example of detailed ranking scores for the indicators used in the Level 2 assessment. For instance, parcels were scored based on the presence of nutrient enrichment, the presence of debris or contaminants, and habitat naturalness. Each indicator had specific scoring criteria to quantify the conditions observed on the site. During the field survey, a total of 469 vacant land parcels were observed, which were either individual or clustered with other parcels.

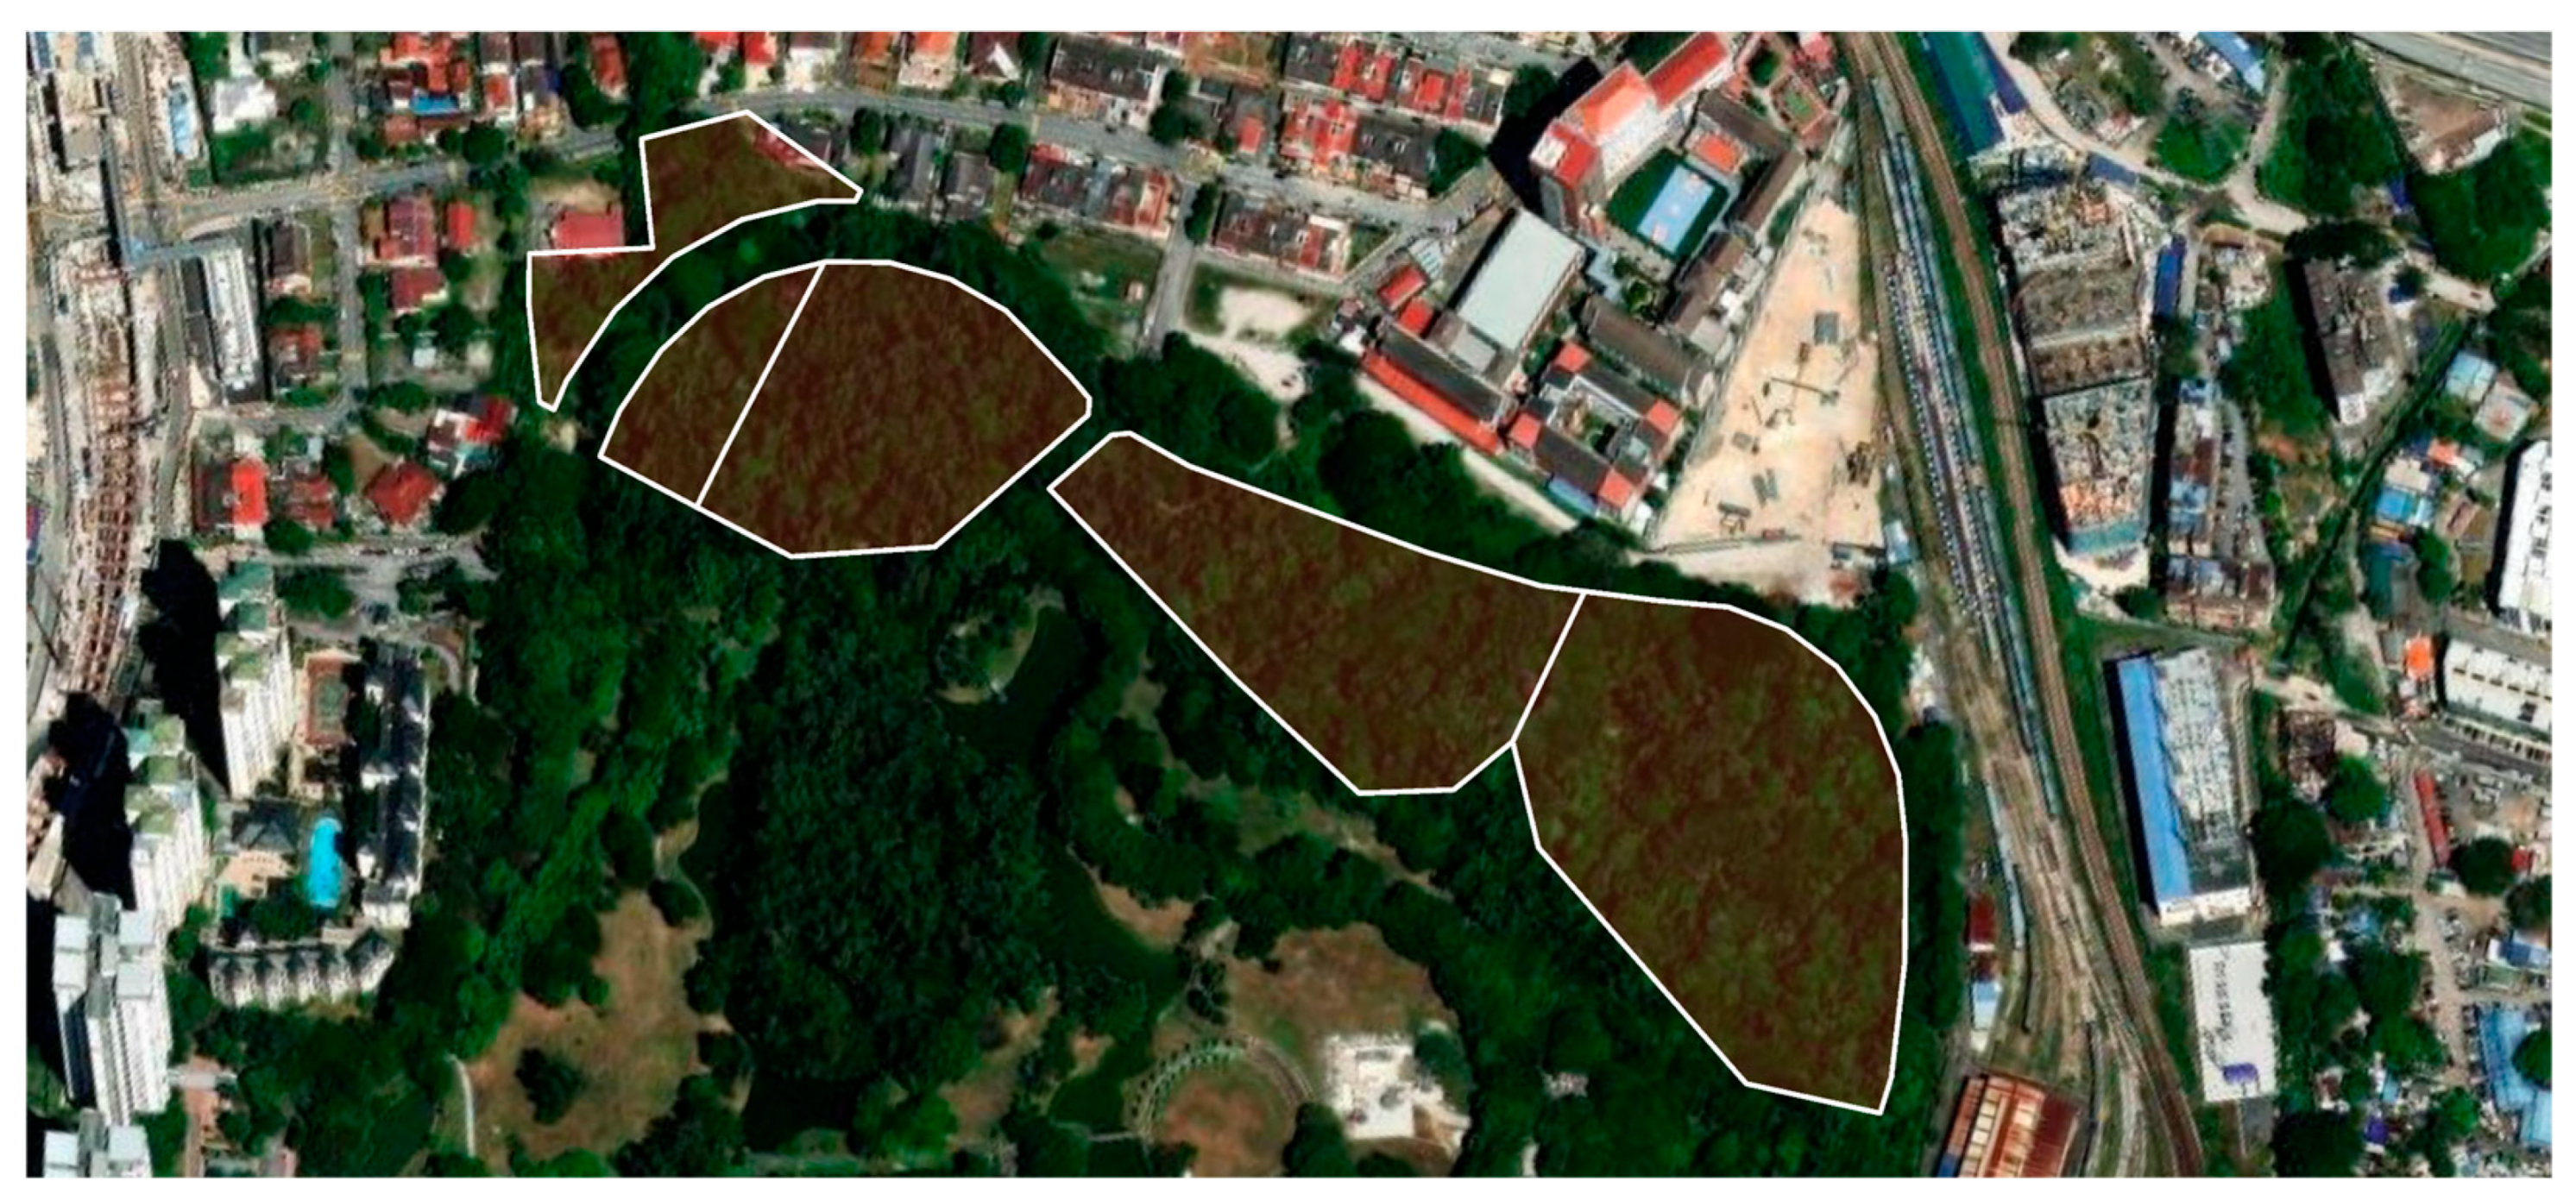
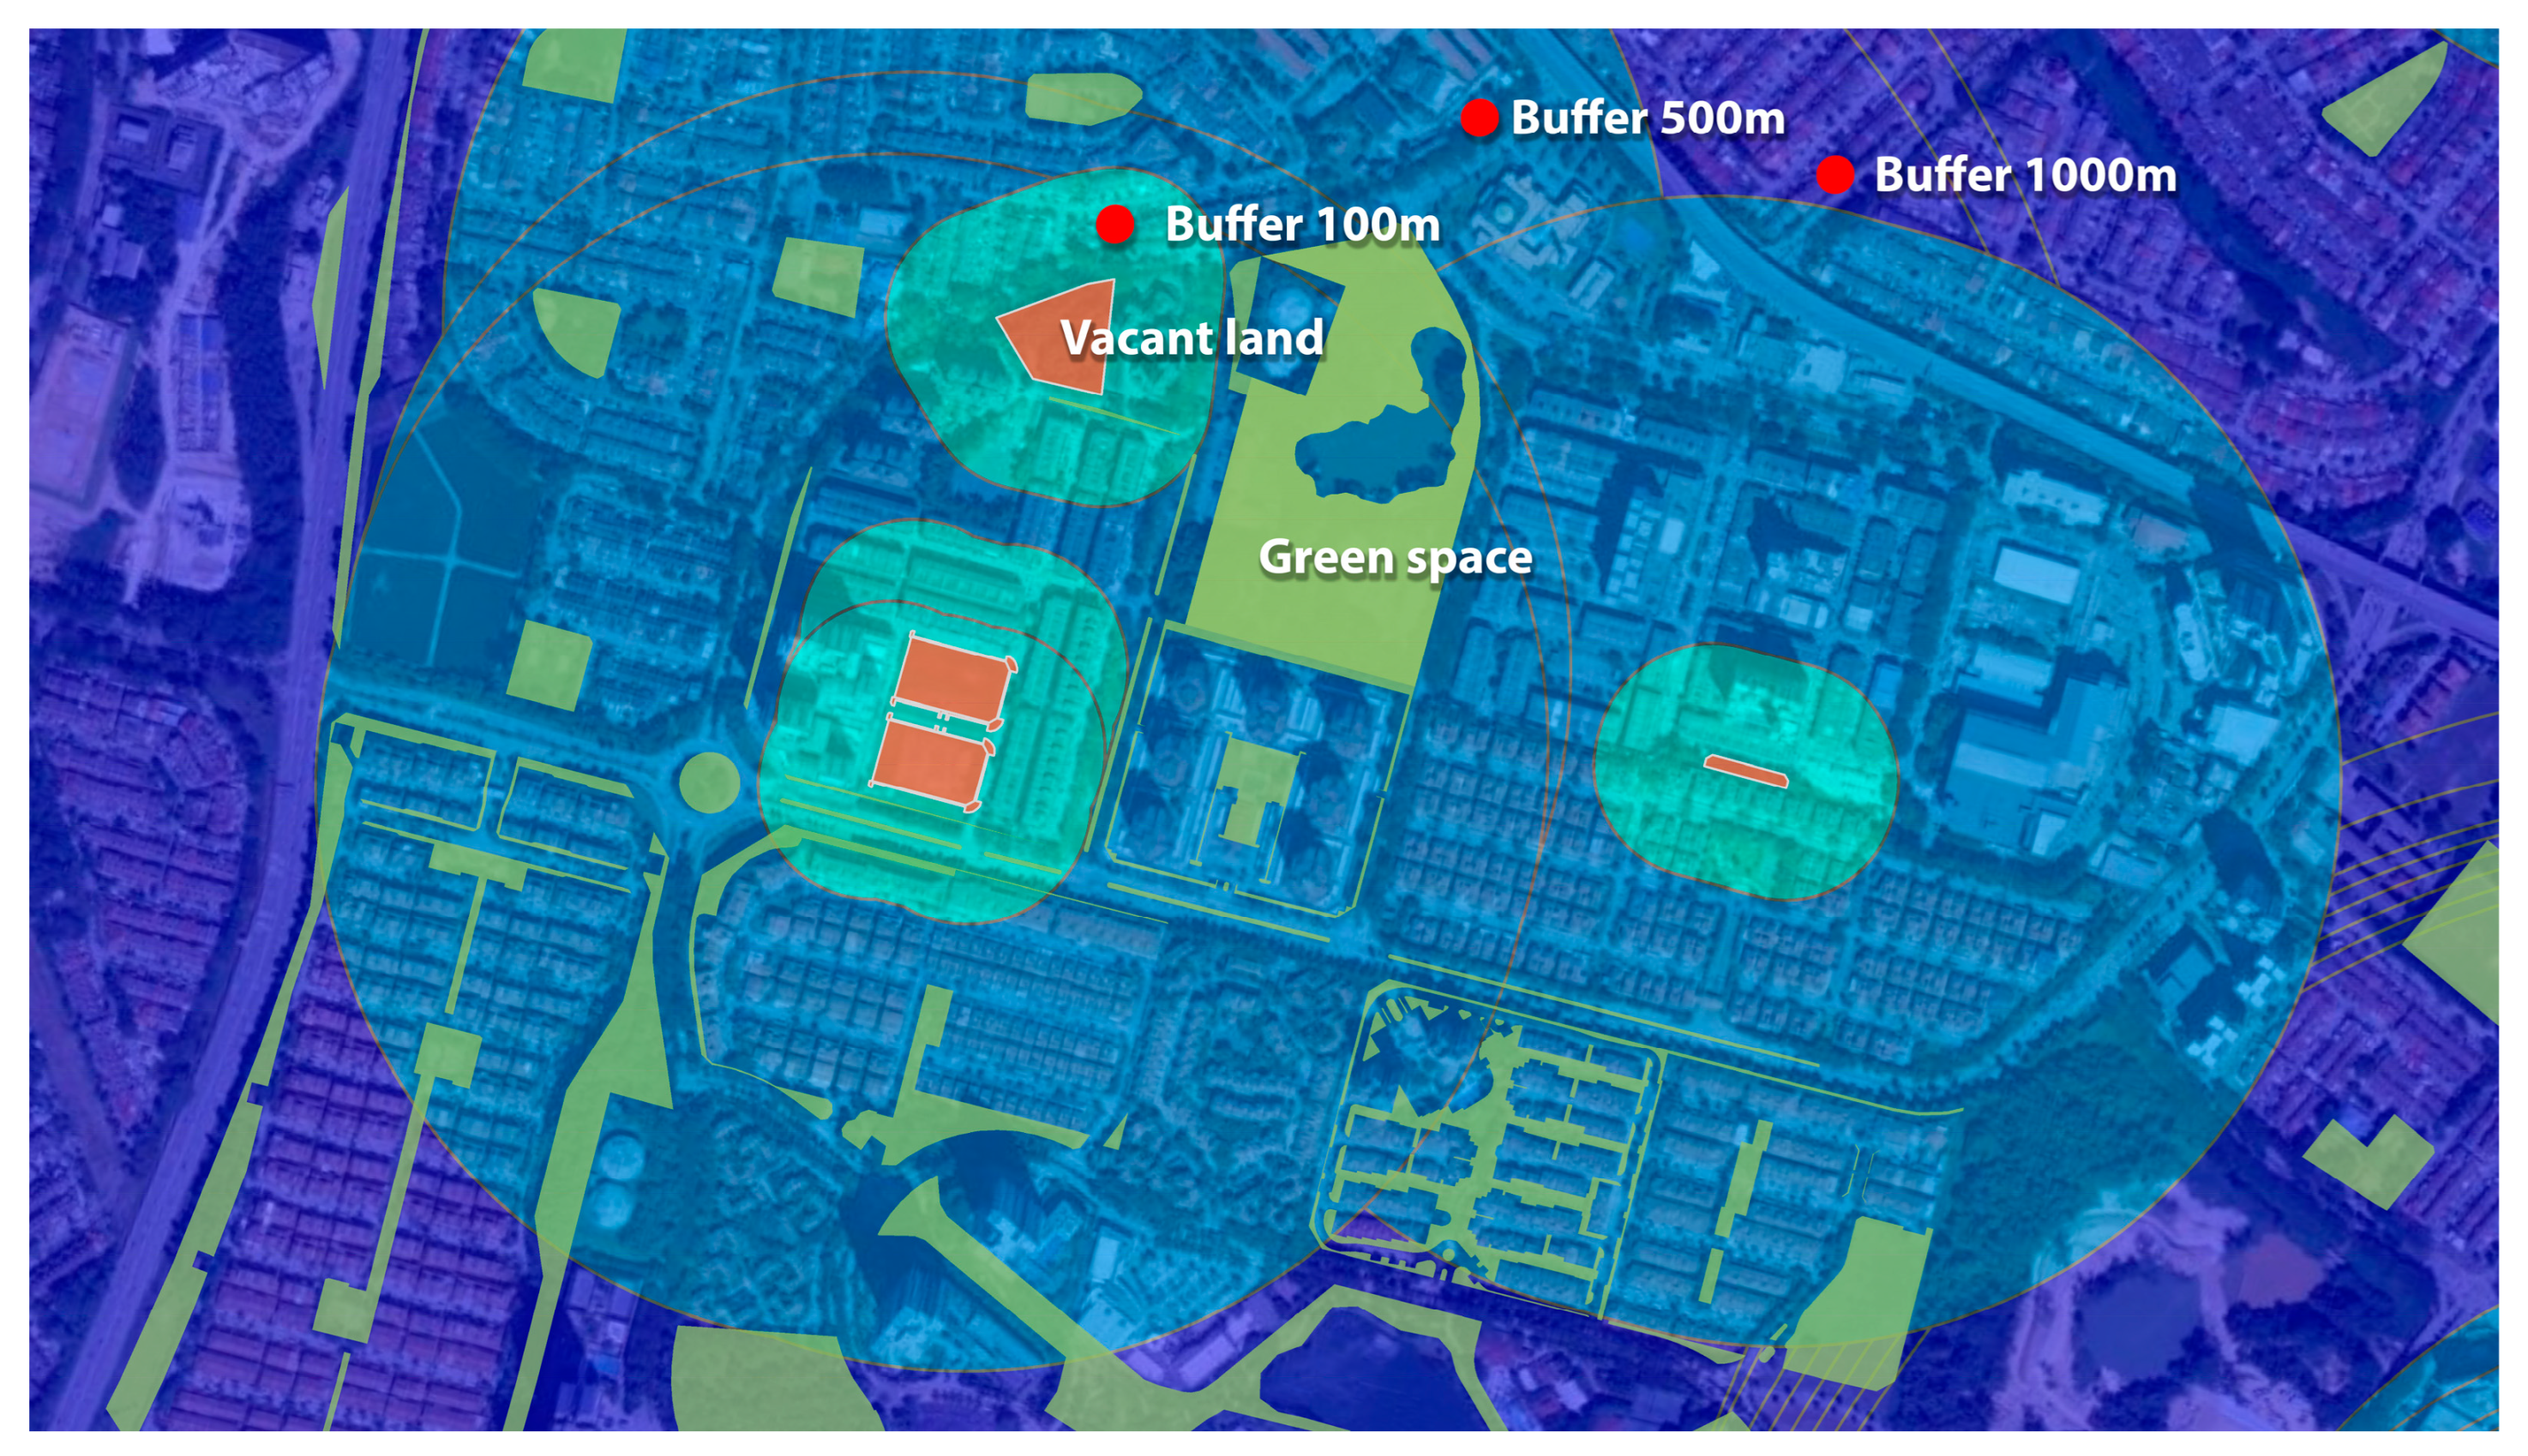
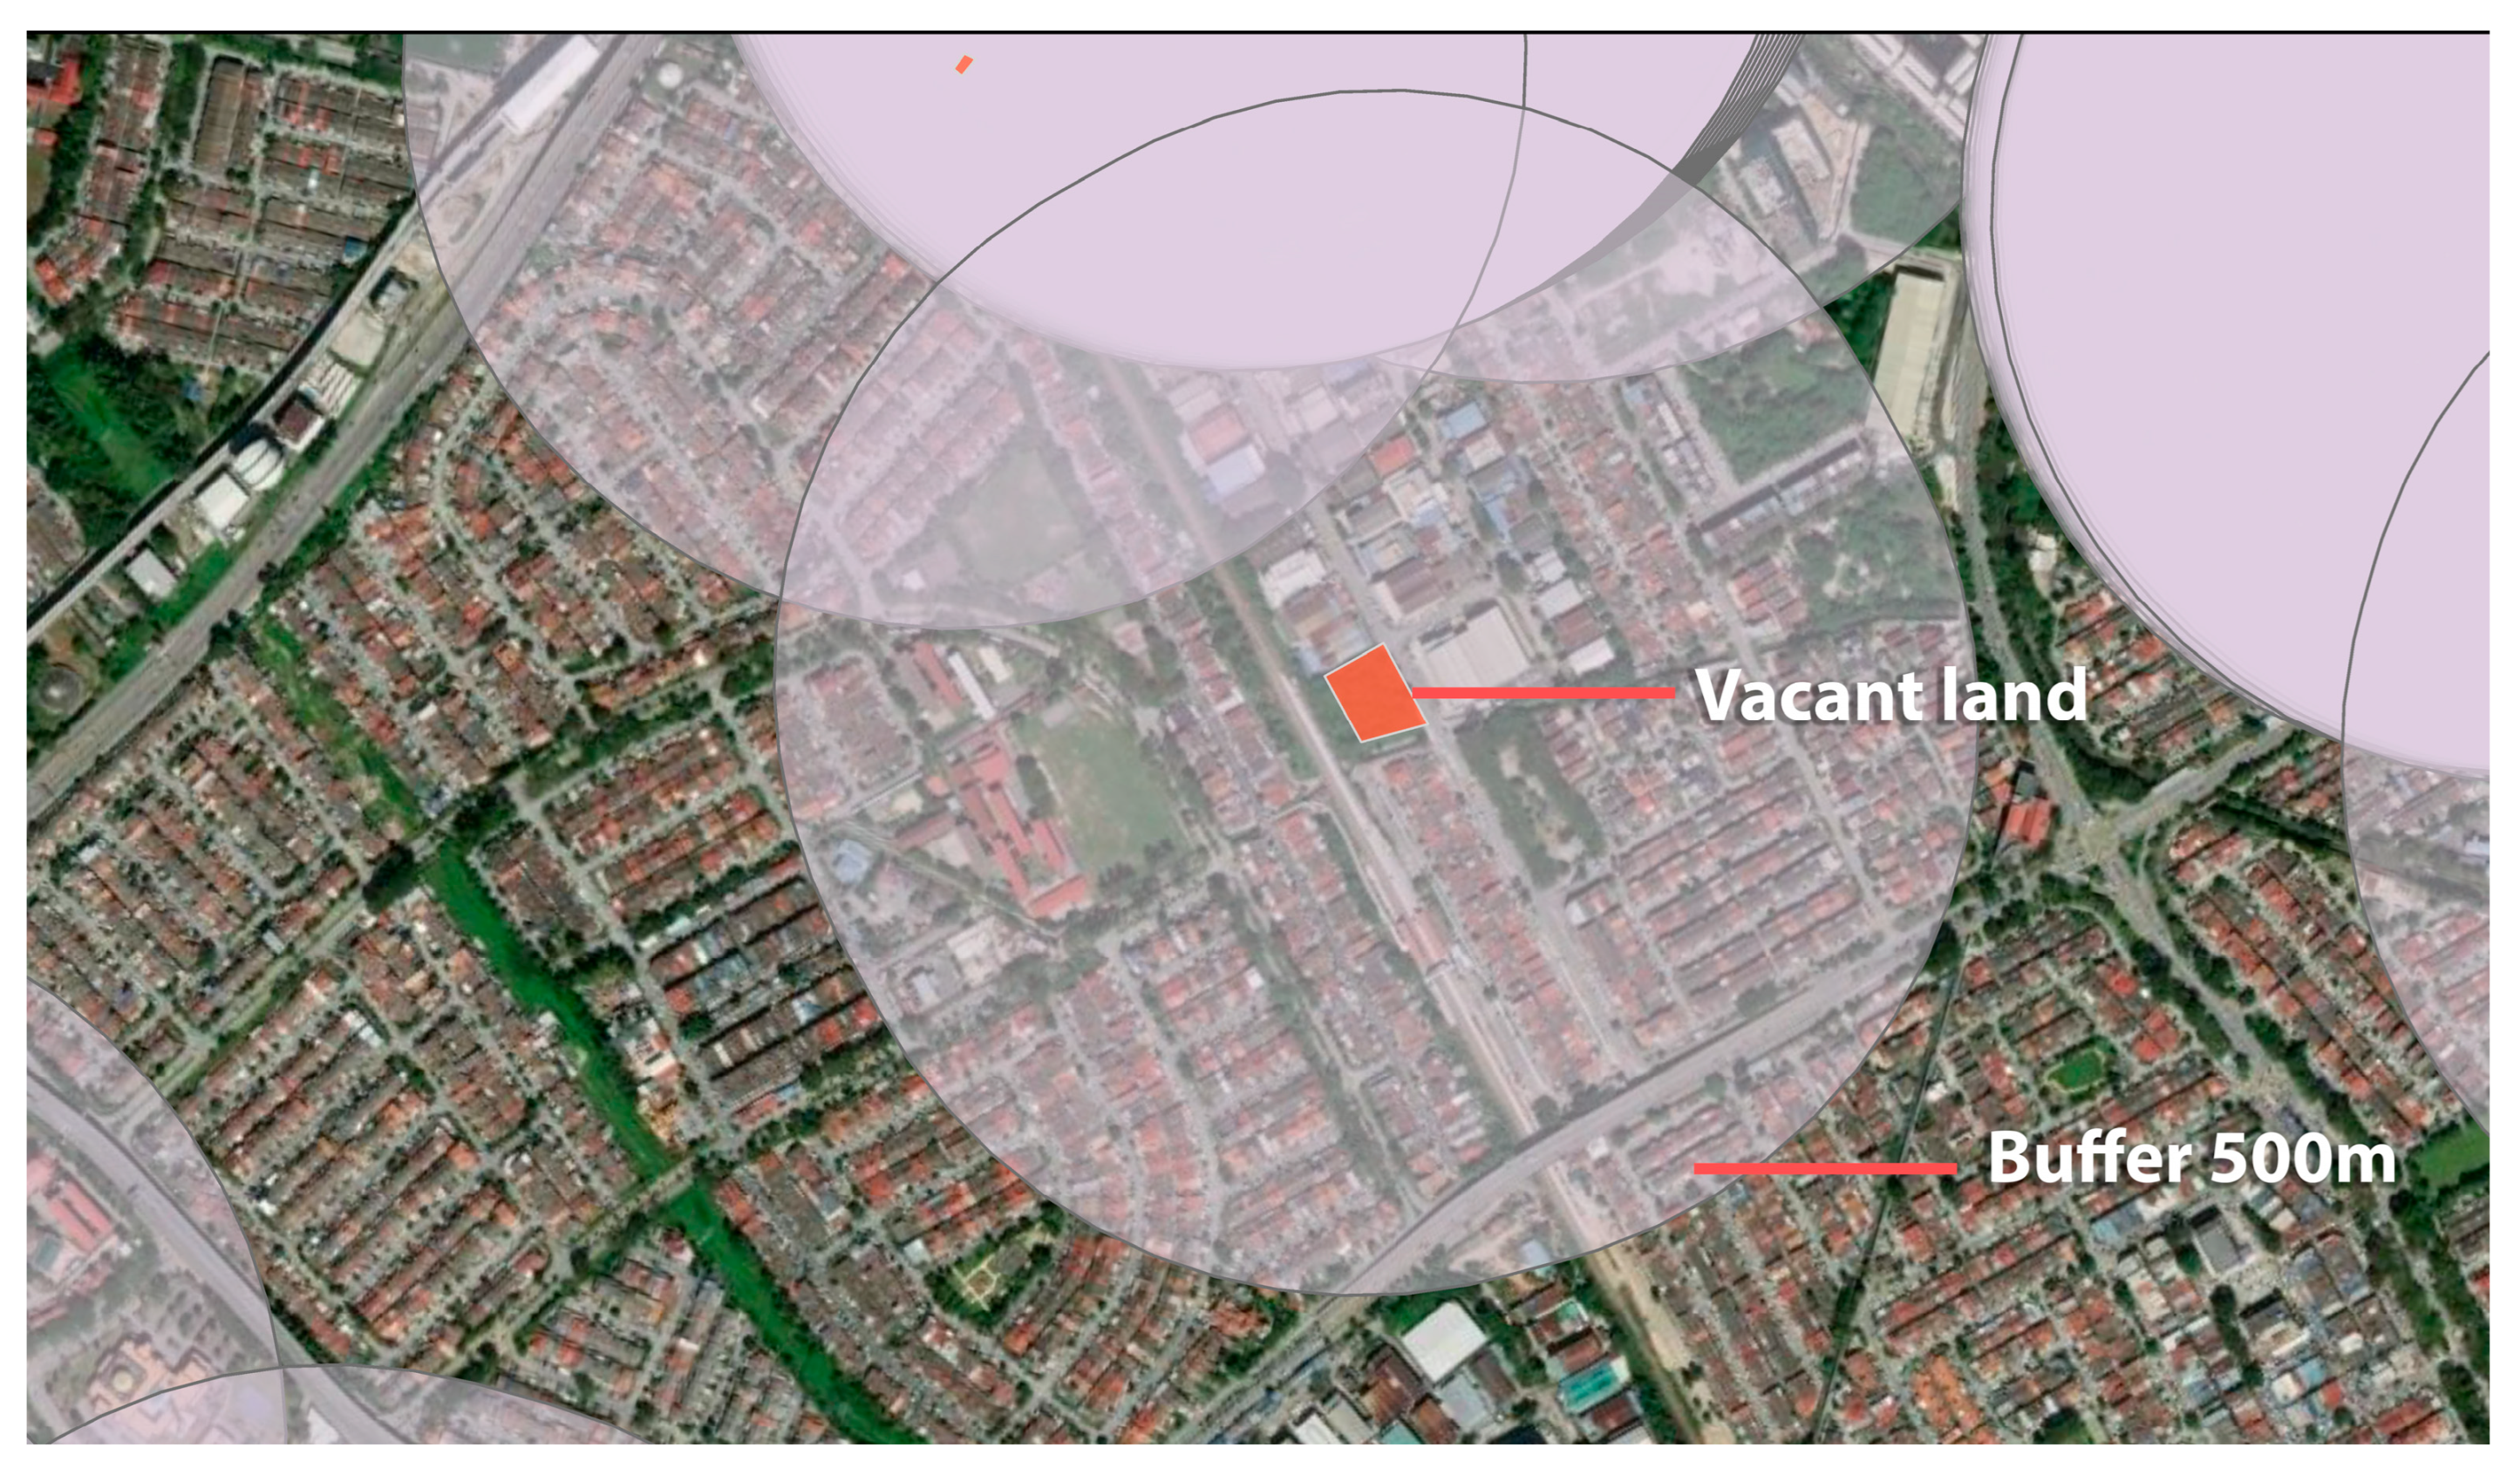
3.2.5. Mapping and Evaluating Vacant Land Potential for Ecological Conservation

Overlay analysis was conducted using ArcGIS Pro 3.0.3 to integrate indicators from both Level 1 (GIS-based spatial analysis) and Level 2 (field surveys). All indicators were assigned equal importance, with no differential weighting applied. Each indicator was first converted into a raster format, and the resulting layers were then combined using a simple overlay operation to generate a composite spatial representation of ecological potential (Figure 12).
The overlay analysis produced a revitalisation potential map of the Sentul–Manjalara zone, classifying 469 vacant land parcels into high, medium, and low ecological conservation potential levels (Figure 13). Based on the overlay scores, 33 parcels (7.0%) were identified as high-potential, 265 parcels (56.5%) as medium-potential, and 171 parcels (36.5%) as low-potential. These correspond to an estimated total of 26.13 ha for high-potential areas, 22.03 ha for medium-potential sites, and 34.78 ha for low-potential sites. The prioritisation provides clear spatial guidance to planners on which vacant sites offer the greatest ecological potential and should be considered for targeted interventions.
High-potential areas, mostly located along ecological corridors or adjacent to green infrastructure, represent critical zones for biodiversity enhancement and ecosystem functions provision. These parcels tend to exhibit higher vegetation cover, proximity to existing green spaces, and favourable field-based indicators such as natural soil conditions, the absence of contamination, and spontaneous vegetation. Medium-potential parcels may still contribute meaningfully to urban greening efforts with moderate restoration input, while low-potential areas generally exhibit degraded site conditions or poor ecological connectivity.
The framework demonstrates potential for replication in other urban contexts, particularly in cities with limited access to spatial data. In such environments, the Level 1 desktop assessment could be carried out using open access datasets and basic GIS tools, enabling baseline ecological evaluations to guide planning decisions. The tiered structure of the assessment ensures that different levels of detail can be achieved depending on resource availability. From a policy standpoint, the ecological potential map provides an evidence-based foundation to support land use planning and green infrastructure development. Parcels identified as having high ecological potential can be integrated into local or regional green space strategies, such as urban biodiversity corridors, retention areas, or native vegetation zones. Aligning these findings with municipal land use plans would allow underutilised land to be more strategically incorporated into urban resilience and climate adaptation policies. Moreover, the prioritisation map can serve as a visual communication tool to engage stakeholders in conservation initiatives, fostering a more data-informed and inclusive planning process.

3.3. Methodological and Practical Implications

3.3.1. Advancing Vacant Land Assessment with a Multi-Tiered Framework

The multi-tiered framework introduced in this study enhances vacant land assessment by providing a structured, adaptable methodology that surpasses previous models. Unlike conventional approaches that rely on static assessments or broad classifications, this framework integrates Level 1 (desktop study), Level 2 (field surveys), and Level 3 (expert evaluations) to enable a progressive, data-driven analysis. This hierarchical structure allows urban planners to prioritise land efficiently, allocate resources strategically, and ensure that revitalisation efforts align with both ecological and urban sustainability goals.
Existing ecological assessment methods using GIS and remote sensing have significantly advanced urban vacant land evaluations, providing valuable tools for spatial analysis and ecological mapping [16,17,31]. Building upon these foundations, this study introduces a structured, scalable, multi-tier approach, enhancing assessment accuracy by integrating spatial analysis, field observations, and expert validation. Categorising assessment levels allows for a balance between broad-scale evaluations and detailed ecological insights, ensuring that assessments capture site-specific ecological variability more effectively. The tiered approach incorporates cost-effective, remote GIS-based evaluations, followed by field surveys for on-site validation, and culminates in expert assessments for in-depth ecological analysis, making it both adaptable and robust. Integrating expert-driven validation alongside real-time data collection strengthens accuracy and supports more informed decision-making, expanding the applicability of vacant land assessments in urban sustainability planning
Additionally, the Fuzzy Delphi Method ensures that the criteria and indicators are validated by experts, enhancing both their scientific rigour and practical applicability. This validation process reinforces the credibility of the framework, positioning it as a methodological innovation in vacant land management. The approach advances beyond theoretical classifications through the provision of an evidence-based tool that enables urban planners to integrate vacant land into broader green infrastructure strategies. In the context of Kuala Lumpur’s rapid urbanisation, where ecological sustainability is increasingly challenged, the framework offers a strategic basis for identifying and revitalising underutilised green spaces. Through the integration of spatial analysis, field observations, and expert evaluation, this study presents a comprehensive and scalable method that strengthens existing planning models. As a result, vacant land assessments can remain flexible, targeted, and impactful within urban sustainability planning efforts.

3.3.2. Limitations of the Study

This study is limited by the availability and temporal accuracy of spatial datasets. The land use shapefile used in this analysis was acquired from the National Geospatial Centre and dated to 2018, which was the most recent dataset publicly available at the time. Given the rapid pace of urban development in Kuala Lumpur, some parcels classified as vacant may have since been developed or repurposed. The analysis would be more meaningful and current if updated land use data could be obtained from municipal or cadastral sources.
Another limitation involves the use of equal weights across all indicators during the overlay process. While equal weighting ensured neutrality and reduced subjective bias, future studies could incorporate a formal sensitivity analysis to examine how varying the weight of individual indicators affects parcel prioritisation outcomes. This would provide a measure of confidence in the robustness of the classification and inform the refinement of the framework.

3.3.3. Recommendations for Further Study and Expansion of Level 3 Assessments

Future research should incorporate Level 3 expert assessments to deepen the ecological evaluation of urban vacant land. While the current framework—structured around vegetation, water, soil, wildlife, and site context—relies primarily on desktop studies (Level 1) and field surveys (Level 2), these methods may not fully capture the ecological complexity of vacant landscapes. Expert-led evaluations can offer a more precise and nuanced understanding by addressing limitations in data availability and revealing intricate ecological interactions that desktop and field assessments may overlook.
For example, biochemical oxygen demand (BOD) testing can uncover water quality issues that are not detectable through remote sensing or direct observation. Expanding Level 3 assessments through expert interviews, laboratory analysis, and ecological modelling would enhance the scientific depth and policy relevance of the framework. These methods can strengthen indicator selection and ecosystem diagnostics, improving biodiversity evaluation where empirical data is limited [32]. Ultimately, this expansion would support more targeted conservation strategies and enable data-informed planning decisions that advance ecological resilience and sustainability.
In parallel, future studies should consider integrating participatory mapping approaches to strengthen Level 2 assessments. Local communities often have valuable insights into informal land use, biodiversity presence, and historical conditions. Their involvement—facilitated through tools such as Field Maps or Survey123—can enrich data collection and promote long-term stewardship. The framework may also be adapted to different ecological and urban contexts, enabling comparative assessments across cities or development zones.

4. Conclusions

This study introduces a novel GIS-based multi-tier framework for assessing the ecological potential of urban vacant land, providing urban planners with a structured, adaptable, and scalable method for prioritising land parcels for conservation and ecological revitalisation. The framework integrates expert-driven ecological indicators, validated through the Fuzzy Delphi Method, with GIS-based spatial analyses and field surveys, enabling planners to systematically categorise vacant parcels into high, medium, and low revitalisation priorities. The practical utility of this approach was demonstrated through its application to the Sentul-Manjalara zone in Kuala Lumpur, resulting in an ecological potential map serving as a robust, evidence-based decision-making tool.
The multi-tier approach significantly advances existing assessment methodologies. It addresses critical gaps, allowing planners to conduct flexible evaluations at varying levels of detail—from rapid preliminary GIS-based assessments to comprehensive field-based ecological evaluations. This structured approach directly supports urban sustainability goals, facilitating targeted ecological interventions such as habitat restoration, urban wildlife corridors, and green infrastructure development. Consequently, the framework enhances biodiversity, ecological connectivity, and urban resilience.
The clear, replicable methodology proposed in this study can be effectively integrated into urban policies and planning strategies, including the Kuala Lumpur Structure Plan 2040, facilitating strategic ecological revitalisation and supporting broader sustainability initiatives. Future research should focus on integrating detailed expert assessments (Level 3) to further refine ecological indicators and enhance the framework’s precision and applicability across diverse urban landscapes.

Supplementary Materials

The following supporting information can be downloaded at: https://www.mdpi.com/article/10.3390/urbansci9060218/s1, Table S1. Calculation of the I-CVI for relevancy and clarity of questionnaire items, Table S2. Converting Likert scale to fuzzy scale (Phase I), Table S3. Obtaining average fuzzy score, Table S4. Threshold value for Phase I Delphi survey, Table S5. Percentage of expert’s agreement, Table S6. Defuzzification process, Table S7. Converting Likert scale to fuzzy scale (Phase II), Table S8. Obtaining average fuzzy score—Criteria 1 Vegetation (Phase II), Table S9. Threshold value—Criteria 1 Vegetation (Phase II), Table S10. Percentage of experts’ agreement—Criteria 1 Vegetation (Phase II), Table S11. Defuzzification process—Criteria 1 Vegetation (Phase II), Table S12. Number of vacant land parcels categorised as cold spots at a 99% confidence level, Figure S1. Hot spot analysis of vacant land proximity to green spaces in Kuala Lumpur, Figure S2. Hot spot analysis of vacant land proximity to water bodies in Kuala Lumpur.

Author Contributions

Conceptualisation, I.A.M.S., S.M. and M.F.S.; data curation, I.A.M.S.; formal analysis, I.A.M.S. and M.J.M.Y.; funding acquisition, I.A.M.S. and S.M.; investigation, I.A.M.S.; methodology, I.A.M.S., M.J.M.Y. and M.F.S.; project administration, I.A.M.S. and S.M.; resources, I.A.M.S.; software, I.A.M.S. and M.J.M.Y.; supervision, S.M., M.J.M.Y. and M.F.S.; validation, S.M. and M.F.S.; visualisation, I.A.M.S.; writing—original draft, I.A.M.S.; writing—review and editing, I.A.M.S., S.M., M.J.M.Y. and M.F.S. All authors have read and agreed to the published version of the manuscript.

Funding

This research was funded by the Ministry of Higher Education Malaysia [Fundamental Research Grant Scheme (FRGS) 5540527] and Universiti Putra Malaysia [Inisiatif Putra Siswazah GP-IPS 9702400].

Data Availability Statement

The raw data supporting the conclusions of this article will be made available by the authors on request.

Acknowledgments

The authors are grateful to the following institutions for providing the data used in this study: (1) KLCH for providing Kuala Lumpur land use data, (2) National Geospatial Centre, Ministry of Energy and Natural Resources Malaysia for providing Kuala Lumpur land use vector data.

Conflicts of Interest

The funders had no role in the design of the study; in the collection, analyses, or interpretation of data; in the writing of the manuscript; or in the decision to publish the results.

Abbreviations

The following abbreviations are used in this manuscript:
GISGeographic Information System
NDVINormalised Difference Vegetation Index
KLCHKuala Lumpur City Hall
CVIContent Validity Index
I-CVIItem-Level Content Validity Index
S-CVIScale-Level Content Validity Index

Appendix A

Appendix A.1

Calculation of degree of relevance and CVI.
Table A1. Degree of relevance for item assessment.
ScoreDescription
1The item is not relevant to the measured domain
2The item is somewhat relevant to the measured domain
3The item is quite relevant to the measured domain
4The item is highly relevant to the measured domain
Adapted from Yusoff [21].
Table A2. CVI indices and formula.
CVI IndicesDefinitionFormula
I-CVI (item-level content validity index)The proportion of content experts giving an item a relevance rating of 3 or 4I-CVI = (agreed item)/(number of expert)
S-CVI/UA (scale-level content validity index based on the universal agreement method)The proportion of items on the scale achieving a relevance scale of 3 or 4 from all experts. The universal agreement (UA) score is given as 1 when the item achieved 100% experts in agreement; otherwise, the UA score is 0.S-CVI/UA = (sum of UA
scores)/(number of item)
Adapted from Yusoff [21].

Appendix A.2

The Fuzzy Delphi employs Triangular Fuzzy Numbers to represent the degree of uncertainty (fuzziness) in the experts’ opinions that cannot be addressed by the Likert scale [26]. The triangular fuzzy numbers are expressed as (a1, a2, and a3), while the membership function, uα is expressed as follows (A1):
u α x = 0 x < a 1 x a 1 a 2 a 1 a 1 x a 2 x a 3 a 2 a 3 a 2 x a 3 0 a 3 < x ,
0 ≤ a1a2a3 ≤ 1, where a1 and a3 stand for the minimum and the maximum values of support of α, and a2 represents the most reasonable value.
Table A3 indicates the fuzzy score scale for the seven-point Likert scale. The fuzzy set of the interval conversion represents the ambiguous boundary of each Likert scale interval.
Table A3. Seven-point Likert scale and equivalent fuzzy score scale.
Linguistic Scoring ScaleLikert ScaleFuzzy Scale
Lower BoundMiddle ValueUpper Bound
Extremely important70.911
Very important60.70.91
Important50.50.70.9
Moderately important40.30.50.7
Unimportant30.10.30.5
Very unimportant200.10.3
Extremely unimportant1000.1
The following Equation (A2) was applied to compute the average fuzzy score, which is the summation of the numbers of each item divided by the number of experts:
F a v = 1 n a 1 i , a 2 i , a 3 i
According to Dawood et al. [26], the questionnaire items must fulfil the three Fuzzy Delphi requirements:
(i) Threshold value (d)
The threshold value (d) of each item should be less than or equal to 0.2 (A3) to be considered as achieving consensus.
d ( m ~ , n ~ ) = 1 3 [ ( m 1 n 1 ) 2 + ( m 2 n 2 ) 2 + ( m 3 n 3 ) 2 ]
T h r e s h o l d   v a l u e   ( d C o n s t r u c t ) = A v e r a g e   T h r e s h o l d   V a l u e ,   d f o r   e a c h   i t e m T o t a l   E x p e r t s × T o t a l   I t e m s   i n   C o n s t r u c t s
(ii) Obtain 75% of the expert’s consensus
An item was accepted if 75% or more of the experts agreed and rejected if consensus fell below this threshold.
(iii) Defuzzification process analysis
This process determines the fuzzy score value, which represents the average of a fuzzy number. The value must be equal to or more than the median value of 0.5, which determines whether an item is retained or discarded. If the fuzzy score value, A m a x α , in which (α-cut value) represents the threshold value, then the item was accepted (A4).
A m a x = 1 3 × m 1 + m 2 + m 3

References

  1. Zhang, P.; Fahey, R.T.; Park, S. The importance of current and potential tree canopy on urban vacant lots for landscape connectivity. Urban For. Urban Green. 2024, 94, 128235. [Google Scholar] [CrossRef]
  2. Pineda-Pinto, M.; Collier, M.; Cooper, C.; O’Donnell, M.; Nulty, F.; Castañeda, N.R. Exploring urban novel ecosystems: Understandings, insights and recommendations for future research and practice. Futures 2024, 164, 103487. [Google Scholar] [CrossRef]
  3. Villaseñor, N.R.; Chiang, L.A.; Hernández, H.J.; Escobar, M.A.H. Vacant lands as refuges for native birds: An opportunity for biodiversity conservation in cities. Urban For. Urban Green. 2020, 49, 126632. [Google Scholar] [CrossRef]
  4. Anderson, E.C.; Minor, E.S. Vacant lots: An underexplored resource for ecological and social benefits in cities. Urban For. Urban Green. 2017, 21, 146–152. [Google Scholar] [CrossRef]
  5. Smith, J.P.; Li, X.; Turner, B.L. Lots for greening: Identification of metropolitan vacant land and its potential use for cooling and agriculture in Phoenix, AZ, USA. Appl. Geogr. 2017, 85, 139–151. [Google Scholar] [CrossRef]
  6. Ameller, J.; Rinaudo, J.; Merly, C. The contribution of economic science to brownfield redevelopment: A review. Integr. Environ. Assess. Manag. 2020, 16, 184–196. [Google Scholar] [CrossRef]
  7. Stanley, B.W. Leveraging public land development initiatives for private gain: The political economy of vacant land speculation in Phoenix, Arizona. Urban Aff. Rev. 2016, 52, 559–590. [Google Scholar] [CrossRef]
  8. Kowarik, I. Urban wilderness: Supply, demand, and access. Urban For. Urban Green. 2018, 29, 336–347. [Google Scholar] [CrossRef]
  9. Kim, G.; Miller, P.A.; Nowak, D.J. Urban vacant land typology: A tool for managing urban vacant land. Sustain. Cities Soc. 2018, 36, 144–156. [Google Scholar] [CrossRef]
  10. Kelleher, C.; Golden, H.E.; Burkholder, S.; Shuster, W. Urban vacant lands impart hydrological benefits across city landscapes. Nat. Commun. 2020, 11, 1563. [Google Scholar] [CrossRef]
  11. Zhang, Y.; Murray, A.T.; Turner, B.L. Optimizing green space locations to reduce daytime and nighttime urban heat island effects in Phoenix, Arizona. Landsc. Urban Plan. 2017, 165, 162–171. [Google Scholar] [CrossRef]
  12. Kremer, P.; Hamstead, Z.A.; McPhearson, T. A social-ecological assessment of vacant lots in New York City. Landsc. Urban Plan. 2013, 120, 218–233. [Google Scholar] [CrossRef]
  13. Drake, L.; Ravit, B.; Lawson, L. Developing a vacant property inventory through productive partnerships: A university, NGO, and municipal planning collaboration in Trenton, New Jersey. Cities Environ. 2016, 8, 6. Available online: http://digitalcommons.lmu.edu/cate/vol8/iss2/6/ (accessed on 8 March 2025).
  14. Stewart, W.P.; Gobster, P.H.; Rigolon, A.; Strauser, J.; Williams, D.A.; van Riper, C.J. Resident-led beautification of vacant lots that connects place to community. Landsc. Urban Plan. 2019, 185, 200–209. [Google Scholar] [CrossRef]
  15. Pearsall, H. Staying cool in the compact city: Vacant land and urban heating in Philadelphia, Pennsylvania. Appl. Geogr. 2017, 79, 84–92. [Google Scholar] [CrossRef]
  16. Sanches, P.M.; Pellegrino, P.R.M. Greening potential of derelict and vacant lands in urban areas. Urban for. Urban Green. 2016, 19, 128–139. [Google Scholar] [CrossRef]
  17. Gavrilidis, A.A.; Niță, M.R.; Onose, D.A.; Badiu, D.L.; Năstase, I.I. Methodological framework for urban sprawl control through sustainable planning of urban green infrastructure. Ecol. Indic. 2019, 96, 67–78. [Google Scholar] [CrossRef]
  18. Kuala Lumpur City Hall. Kuala Lumpur Structure Plan 2040: City for All; Kuala Lumpur City Hall: Kuala Lumpur, Malaysia, 2023. Available online: https://ppkl.dbkl.gov.my/en/pskl2040/ (accessed on 8 March 2025).
  19. Kuala Lumpur City Hall. Draft Kuala Lumpur Structure Plan 2040; Dewan Bandaraya Kuala Lumpur: Kuala Lumpur, Malaysia, 2020. [Google Scholar]
  20. Haynes, S.N.; Richard, D.C.S.; Kubany, E.S. Content validity in psychological assessment: A functional approach to concepts and methods. Psychol. Assess. 1995, 7, 238–247. [Google Scholar] [CrossRef]
  21. Yusoff, M.S.B. ABC of content validation and content validity index calculation. Educ. Med. J. 2019, 11, 49–54. [Google Scholar] [CrossRef]
  22. Mukherjee, N.; Hugé, J.; Sutherland, W.J.; McNeill, J.; Van Opstal, M.; Dahdouh-Guebas, F.; Koedam, N. The Delphi technique in ecology and biological conservation: Applications and guidelines. Methods Ecol. Evol. 2015, 6, 1097–1109. [Google Scholar] [CrossRef]
  23. Powell, C. The Delphi technique: Myths and realities. J. Adv. Nurs. 2003, 41, 376–382. [Google Scholar] [CrossRef] [PubMed]
  24. Gordon, T.J. The Delphi method. Futures Res. Methodol. 1994, 2, 3. [Google Scholar]
  25. Pearsall, H.; Lucas, S.; Lenhardt, J. The contested nature of vacant land in Philadelphia and approaches for resolving competing objectives for redevelopment. Cities 2014, 40, 163–174. [Google Scholar] [CrossRef]
  26. Dawood, K.A.; Sharif, K.Y.; Ghani, A.A.; Zulzalil, H.; Zaidan, A.A.; Zaidan, B.B. Towards a unified criteria model for usability evaluation in the context of open source software based on a fuzzy Delphi method. Inf. Softw. Technol. 2021, 130, 106453. [Google Scholar] [CrossRef]
  27. Zhu, X. GIS for Environmental Applications; Routledge: Oxon, UK, 2016. [Google Scholar]
  28. de Hierro, A.F.R.L.; Sánchez, M.; Puente-Fernández, D.; Montoya-Juárez, R.; Roldán, C. A fuzzy Delphi consensus methodology based on a fuzzy ranking. Mathematics 2021, 9, 2323. [Google Scholar] [CrossRef]
  29. Abdullah, M.H. Principles in Water Analysis for Environmental Sciences, 1st ed.; Penerbit Universiti Malaysia Sabah: Kota Kinabalu, Malaysia, 2014. [Google Scholar]
  30. Lomnicky, G.A.; Herlihy, A.T.; Kaufmann, P.R. Quantifying the extent of human disturbance activities and anthropogenic stressors in wetlands across the conterminous United States: Results from the National Wetland Condition Assessment. Environ. Monit. Assess. 2019, 191, 7314. [Google Scholar] [CrossRef]
  31. Morckel, V. Using suitability analysis to select and prioritize naturalization efforts in legacy cities: An example from Flint, Michigan. Urban For. Urban Green. 2017, 27, 343–351. [Google Scholar] [CrossRef]
  32. Isbell, F.; Adler, P.B.; Eisenhauer, N.; Hautier, Y.; Kimmel, K.; Cowles, J.; van der Plas, F.; Reich, P.B. Expert perspectives on global biodiversity loss and its drivers and impacts on people. Front. Ecol. Environ. 2023, 21, 94–103. [Google Scholar] [CrossRef]
Figure 1. (Left) Location plan (regional context) showing the position of Kuala Lumpur within Peninsular Malaysia. (Right) Site plan of Kuala Lumpur, highlighting the six strategic development zones.
Urbansci 09 00218 g001
Figure 2. Web view of Typeform survey page. The question shown refers to the importance of percentage of vegetated area as an indicator to assess vegetation on urban vacant land. Respondents rated the importance on a 7-point Likert scale: 1—Extremely unimportant, 2—Very unimportant, 3—Unimportant, 4—Moderately important, 5—Important, 6—Very important, and 7—Extremely important [25].
Urbansci 09 00218 g002
Figure 3. An example of web map creation in ArcGIS Online.
Urbansci 09 00218 g003
Figure 4. Criteria and indicators used to assess the ecological potential of urban vacant land.
Urbansci 09 00218 g004
Figure 5. Location of Sentul-Manjalara.
Urbansci 09 00218 g005
Figure 6. Assessment of vacant land selection for field survey eligibility based on Google Earth and Google Street View. The cyan-coloured parcel represents the selected vacant land being assessed in the attribute table in ArcGIS Pro. Attributes include visual accessibility and physical classification. Street-level verification was conducted using Google Street View to confirm accessibility and site condition.
Urbansci 09 00218 g006
Figure 7. Assessing percentage of vegetated area.
Urbansci 09 00218 g007
Figure 8. Assessing the presence of water bodies. Blue areas represent water bodies, while orange areas indicate identified vacant land in proximity to these features.
Urbansci 09 00218 g008
Figure 9. Scoring connectivity of vacant land with other green spaces, using buffers of 100 m, 500 m, and 1000 m distances. Light green polygons represent green spaces, while the orange polygon indicates the vacant land. Red dots mark the location from which buffers are generated, represented as concentric circles: light blue (100 m), medium blue (500 m), and purple (1000 m), illustrating proximity to nearby green areas.
Urbansci 09 00218 g009
Figure 10. Assessment of matrix contrast (percentage of surrounding tree cover) and percentage of surrounding built-up area within a radius of 500 m for each vacant land parcel.
Urbansci 09 00218 g010
Figure 11. Input of field survey data into Field Maps. The orange polygons represent vacant land parcels, while the cyan line indicates the boundary of the assessed parcel during the field survey. Supporting photographs show the site’s actual conditions, including vegetation, water body, and surrounding development.
Urbansci 09 00218 g011
Figure 12. Model builder illustrating the process of conducting overlay analysis in ArcGIS Pro 3.0.3.
Urbansci 09 00218 g012
Figure 13. Map showing the ecological potential of urban vacant land in Sentul-Manjalara, Kuala Lumpur, based on Level 1 and Level 2 assessments.
Urbansci 09 00218 g013
Table 1. Criteria used to assess site selection for field survey.
AccessibilityDescriptionWeightage
Visual accessibilityThe visual accessibility of vacant land parcels was determined by assessing the visibility of the parcel from the street, considering factors such as obstructions and the clarity of the view.Clear visibility—1
Limited visibility—0
Physical classificationGreen: parcels predominantly covered by vegetation.
Developing: parcels showing signs of ongoing development or construction activities.
Developed: vacant land parcel has been developed.
Green—1
Developing—0
Developed—0
Table 2. Summary of Fuzzy Delphi analysis for Phase I.
CriteriadConsensus Percentage (≥75%)Average Fuzzy Number* Result
Vegetation0.13393.8%0.890Accepted
Water0.158100.0%0.865Accepted
Soil0.108100.0%0.896Accepted
Structure0.35356.25%0.658Rejected
Wildlife0.22587.50%0.850Accepted
Site Context0.148100.00%0.888Accepted
* prerequisite for retaining items based on expert consensus (must fulfil all requirements). i. Threshold value (d) ≤ 0.2 (3 decimal points is accepted). ii. Percentage expert agreement ≥ 75%. iii. Average fuzzy value (“A” value) ≥ 0.5.
Table 3. Summary of Fuzzy Delphi analysis for Phase II.
CriteriadConsensus Percentage (≥75%)Average Fuzzy Number* Result
Percentage of vegetated area0.070100.0%0.931Accepted
Vegetation species diversity0.14994.1%0.890Accepted
Tree benefit estimate (carbon)0.10888.2%0.906Accepted
Tree benefit estimate (air pollution)0.119100.00%0.884Accepted
Tree benefit estimate (hydrological)0.125100.00%0.896Accepted
Endemic species0.28788.24%0.786Accepted
Rare specie 0.35941.18%0.649Rejected
Aesthetic value0.29270.59%0.778Rejected
Cultural value0.27835.29%0.716Rejected
Botanical value0.25276.47%0.561Accepted
Presence of water bodies0.22388.24%0.849Accepted
Water appearance0.139100.00%0.880Accepted
Nutrient enrichment0.16994.12%0.784Accepted
Biochemical oxygen demand0.18194.12%0.837Accepted
Soil compaction0.20388.24%0.825Accepted
Soil invertebrates0.14788.24%0.837Accepted
Surface crusting0.092100.00%0.861Accepted
Soil erosion0.123100.00%0.890Accepted
Presence of debris or contaminants0.14794.12%0.851Accepted
Wildlife habitat diversity0.19288.24%0.835Accepted
Wildlife species diversity0.24876.47%0.824Accepted
Threatened species0.27841.18%0.747Rejected
Habitat naturalness0.22182.35%0.782Accepted
Vacant parcel size0.28170.59%0.767Rejected
Connectivity with other green spaces0.10788.24%0.912Accepted
Matrix contrast0.19688.24%0.841Accepted
Surrounding built-up area0.10888.24%0.906Accepted
Noise pollution0.23482.35%0.775Accepted
* prerequisite for retaining items based on expert consensus (must fulfil all requirements). i. Threshold value (d) ≤ 0.2 (3 decimal points is accepted). ii. Percentage expert agreement ≥ 75%. iii. Average fuzzy value (“A” value) ≥ 0.5.
Table 4. Level of assessments for each indicator.
CriteriaIndicatorsData Collection
Requirements
Level 1
(Desktop Study)
Level 2 (Field
Survey)
Level 3
(Expert
Evaluation)
VegetationPercentage of vegetated area Satellite imageries
Vegetation species diversity Field sampling
Tree benefit estimates (carbon)Allometric equations, field measurements
Tree benefit estimates (air pollution)Air quality sensors, field measurements
Tree benefit estimate (hydrological)Hydrological models, field measurements
Endemic speciesField surveys, ecological records
Botanical valueBotanical surveys, field assessments
WaterPresence of water bodiesSatellite imageries
Water appearanceVisual inspection
Nutrient enrichmentVisual inspection
Biochemical oxygen demand (BOD)Water sampling, laboratory analysis
SoilSoil compactionPenetrometer readings, field tests
Soil invertebratesSoil sampling, laboratory analysis
Surface crustingVisual inspection, field observations
Soil erosionField measurements, erosion pins
Presence of debris or contaminantsVisual inspection
WildlifeWildlife habitat diversityField surveys, ecological records
Wildlife species diversityField surveys, ecological records
Habitat naturalnessVisual analysis, satellite imagery
Site contextConnectivity with other green spacesGIS analysis, spatial data
Matrix contrastGIS analysis, spatial data
Surrounding built-up areaGIS analysis, spatial data
Noise pollutionNoise level meters, field measurements
Table 5. Scoring matrix for indicators assigned as Level 1 assessment.
CriteriaIndicatorScaleScoreSource
VegetationPercentage of vegetated area100%4[25]
Up to 75%3
Up to 50%2
Up to 25%1
0%0
WaterPresence of water bodyYes1[16]
No0
Site ContextConnectivity with other green spaces0 m4[16]
Up to 100 m3
Up to 500 m2
Up to 1000 m1
>1000 m 0
Matrix contrast
Tree cover within a radius of 500 m
≥504[16]
30% ≤ e ≤ 50%3
15% ≤ e ≤ 30%2
15%1
0%0
Surrounding built-up area0%4[16]
Up to 25%3
Up to 50%2
Up to 75%1
100%0
Table 6. Scoring matrix for indicators assigned as Level 2 assessment.
CriteriaIndicatorScaleScoreSource
WaterNutrient enrichmentYes0[29]
No1
SoilPresence of debris or contaminantsYes0[9]
No1
WildlifeHabitat naturalness 0%4[30]
Up to 25%3
Up to 50%2
Up to 75%1
100%0
Disclaimer/Publisher’s Note: The statements, opinions and data contained in all publications are solely those of the individual author(s) and contributor(s) and not of MDPI and/or the editor(s). MDPI and/or the editor(s) disclaim responsibility for any injury to people or property resulting from any ideas, methods, instructions or products referred to in the content.

