1. Introduction
Urban infrastructure systems confront a defining challenge of our era: reconciling their dual role as catalysts for economic development and primary drivers of climate change. In China, where transportation infrastructure alone contributes 38% of industrial carbon emissions [
1], there exists a notable tension between the infrastructure goals of Sustainable Development Goal (SDG) 9 and the decarbonization objectives of SDG 13. This challenge is particularly evident in sectors like transportation infrastructure, where capital expenditure decisions significantly influence carbon intensity levels. Studies on China’s transportation decarbonization suggest that investments in infrastructure and energy sources have a considerable impact on carbon emissions. The urgency of this issue is underscored by findings showing that infrastructure-related decisions are critical for reducing carbon intensity, yet balancing the needs for infrastructure expansion with decarbonization remains a substantial challenge [
2]. The lock-in effect driven by capital expenditures (CAPEX), particularly for energy-intensive materials such as steel-reinforced concrete, creates path dependencies that significantly delay emission reductions [
3]. This challenge is further compounded by the fact that a large portion of global infrastructure investments will be directed towards developing cities in the coming decades, reinforcing existing carbon-intensive infrastructure and hindering the transition to more sustainable systems [
4]. Where regulatory frameworks often prioritize immediate construction needs over long-term climate resilience [
5], traditional urban governance approaches, reliant on retrospective emission inventories and sector-average decarbonization targets, prove inadequate against these systemic complexities [
6], necessitating predictive analytics that bridge corporate operations with municipal planning [
7].
The emergence of green revenue metrics offers transformative potential, quantifying the percentage of corporate income from low-carbon products and services. Our analysis of 20 Chinese transportation firms demonstrates these metrics’ 63.38% normalized importance in predicting CI patterns, outperforming conventional financial indicators like return on assets and leverage ratios. Yet, significant implementation barriers persist, particularly in aligning these enterprise-level indicators with municipal climate agendas. Current assessment methodologies, predominantly using linear regression models [
8,
9], fail to capture the non-linear dynamics between fleet electrification rates and urban emission trajectories. This limitation becomes critical when evaluating policy mechanisms like emissions trading systems (ETS), where compliance pressures account for merely 51.83% of carbon performance variations according to our neural network model. The EU’s experience in synchronizing corporate ETS data with urban inventories provides valuable lessons [
10], but Asian megacities require localized adaptations to address unique challenges like rapid urbanization scales and fragmented renewable energy adoption patterns [
11].
This study advances urban sustainability science through machine learning analysis of integrated corporate–municipal datasets, employing a multi-layer perceptron (MLP) neural network with 14 hidden units and hyperbolic tangent activation functions. The purpose of this research is to systematically analyze the factors influencing carbon intensity within China’s transport infrastructure sector using advanced machine learning methods. Specifically, the study aims to (1) identify the most significant predictors of CI, (2) evaluate the contribution of both conventional and unconventional indicators, and (3) provide evidence-based recommendations for achieving carbon neutrality. The central hypothesis is that the inclusion of novel indicators, such as business model entropy and green revenue share, will improve the explanatory power of CI models beyond traditional variables. The framework processes multi-source operational data from CEEDS, Bloomberg ESG, and provincial ETS regulators, achieving superior predictive accuracy by quantifying three critical relationships: temporal synchronization between capital expenditure cycles and municipal emission inventories, non-linear interactions linking renewable energy capacity to infrastructure decarbonization rates, and dynamic modeling of fleet electrification’s delayed emission reduction effects. The methodology reveals how neural networks can overcome linear models’ limitations in capturing infrastructure lock-in mechanisms [
12]. These technical advances enable policymakers to prioritize high-impact interventions, moving beyond generic ESG frameworks to sector-specific strategies that address the 42.60% predictive gap caused by excessive corporate diversification.
It is important to recognize the inherent conflict between SDG 9, which promotes infrastructure development, and SDG 13, which calls for urgent climate action. This study seeks to reconcile these competing priorities through data-driven insights. The findings carry urgent implications for implementing infrastructure decarbonization targets. First, aligning municipal climate agendas with corporate decarbonization timelines requires prioritizing renewable energy investments, given their 75.00% importance in neural network predictions compared to the marginal impact of diversification strategies. Second, urban policymakers should adapt the ETS to better support fleet electrification [
13,
14]. Third, the framework enables multi-stakeholder governance models that track Scope 3 emissions across value chains, addressing the critical data fragmentation issues plaguing emerging megacities [
15]. Subsequent sections detail the methodology’s technical innovations, empirical validation across Chinese industrial corridors, and policy recommendations for scaling these approaches globally. By transforming corporate sustainability metrics into actionable urban transition tools, this research provides an innovative approach for cities navigating the infrastructure–climate development paradox. This research is scientifically novel in its integration of diverse data sources and its use of a multilayer perceptron neural network, which together enable a more robust and granular understanding of CI dynamics in the context of sustainable urban development.
The remainder of this paper is structured as follows:
Section 2 shows the conducted literature review and research gaps;
Section 3 details the methodology used in this study;
Section 4 explains the model performance and predictor importance rankings;
Section 5 discusses key findings in the research;
2. Literature Review
The conducted literature review in this paper synthesizes four interconnected research domains that are critical to understanding transportation infrastructure Cl analysis: (1) the evolution of Cl metrics and modeling challenges, (2) green revenue diversification as a business strategy, (3) policy mechanisms driving corporate decarbonization, and (4) machine-learning (ML) innovations in sustainability analytics. By integrating insights from these fields, this section establishes the theoretical foundation for the MLP framework proposed in this study.
2.1. The Evolution of Cl Metrics and Modeling Challenges
Corporate Cl, defined as emissions per unit of revenue, has gained prominence as a granular metric for assessing industrial sustainability in urban contexts [
16]. Early frameworks, such as the Greenhouse Gas Protocol, standardized scope-based emissions accounting but faced criticism for neglecting revenue-normalized benchmarking [
17]. Subsequent studies operationalized Cl by integrating emissions data from CSR reports with financial disclosures [
18]. However, traditional models, such as linear regression [
12], struggled with non-linear interactions between variables like capex ratios and carbon price volatility.
Recent advancements in multi-source data integration have shown promising results. For example, Shen et al. [
19] combined corporate environmental disclosures with satellite data to predict carbon emissions from Chinese firms, significantly improving prediction accuracy. This approach illustrates the potential of integrating diverse data sources, such as satellite emissions data and corporate filings, to enhance emission forecasting models and better assess environmental impact. In line with this, studies have highlighted the role of entropy-based models in explaining variations in Cl, particularly within energy-intensive sectors. For example, research by Maheen et al. [
20] demonstrated that entropy, as a measure of diversification and efficiency, can explain significant portions of carbon intensity variability in industrial sectors. These findings align with the need for hybrid frameworks that combine both operational and financial data streams, moving beyond traditional metrics. Furthermore, criticisms of relying solely on linear models emphasize their inadequacy in capturing threshold effects and the complexities introduced by fragmented data sources.
2.2. Green Revenue Diversification and Business Model Innovation
Green revenue, derived from low-carbon products or services, has emerged as a key strategic lever for decarbonization. Recent studies have operationalized this metric using ESG data, showing that firms with a significant portion of green revenue have achieved lower Cl compared to their peers. For instance, firms with a ≥20% green revenue share demonstrated 15% lower Cl than their counterparts [
21]. Further studies have connected green revenue to capex, highlighting that firms investing >15% of revenue in renewables reduced Cl by 22% over five years [
22,
23]. Beyond the well-documented case of Shenzhen, other Chinese cities such as Beijing and Shanghai have implemented comprehensive low-carbon transport initiatives, including large-scale electric bus deployment and the integration of renewable energy into metro systems.
Despite advancements, challenges to the standardization of green revenue reporting persist, especially in emerging markets. The International Renewable Energy Agency (IRENA) has highlighted significant inconsistencies in how firms report green activities, often conflating them with sustainable activities, which hampers the comparability and reliability of such reports. These issues are particularly pronounced in regions where regulatory frameworks and data transparency are still developing [
24]. This study addresses the issue by standardizing green revenue data across 20 firms (2018–2022) using annual reports and CNREC project filings. The study then applies the MLP model to quantify the normalized importance of green revenue share. It reveals that non-linear diminishing returns occur as the share of green revenue increases, a relationship that traditional logistic regression models fail to capture effectively [
25,
26].
Comparative analyses of green revenue frameworks in both the EU and Asia further validate the need for sector-specific reporting standards. This study contributes to the theory by confirming green revenue as a reliable predictor of Cl. Additionally, it demonstrates the MLP model’s superiority in capturing saturation effects, which were not effectively captured by prior logistic regression models [
27,
28].
2.3. Policy Mechanisms in Urban Decarbonization
ETS have become central to urban decarbonization strategies, covering 30% of global emissions as of 2023. The EU’s Carbon Border Adjustment Mechanism (CBAM) exemplifies how ETS frameworks influence corporate behavior, with firms in regulated markets reporting 18% faster Cl reductions compared to those in non-ETS jurisdictions. This study builds on these insights by quantifying the cumulative ETS exposure and exploring its interaction with fleet electrification rates [
29,
30].
Provincial carbon pricing, analyzed using data from the China Carbon Forum, highlights regional heterogeneity in emissions reductions. For example, Guangdong, with a higher carbon price, has seen more significant reductions in Cl compared to other regions with lower carbon prices, such as Hubei. This finding is consistent with broader research that shows the importance of carbon pricing in driving regional emissions reductions [
31]. However, previous studies have been limited by their reliance on linear modeling techniques, which are insufficient for capturing the complex, non-linear relationships inherent in carbon intensity data. This limitation justifies the adoption of advanced machine-learning models, such as the MLP neural network, which can more effectively model these dynamics [
32]. For instance, the challenges in linking the EU ETS with California’s Cap-and-Trade Program are explored by Woerdman and Kotzampasakis [
33], who identify key legal and policy barriers to creating a cohesive carbon pricing system across regions, which has implications for local policy calibration. In the context of Tokyo’s ETS, the experience of the Tokyo Metropolitan Emissions Trading Scheme (Tokyo ETS) provides critical insights into how local emissions trading schemes can drive emissions reductions, despite certain market and policy challenges, as discussed by Wakabayashi and Kimura [
34]. This study builds on these insights by advocating for regionally calibrated ETS frameworks and emphasizing fleet electrification mandates as crucial for accelerating Cl reductions [
35].
2.4. Machine Learning in Sustainability Analytics
Machine learning has significantly advanced sustainability analytics, with MLP networks gaining prominence due to their ability to handle non-linear, high-dimensional datasets. Recent studies have demonstrated the application of MLP networks in energy transitions, achieving high prediction accuracy in renewable energy adoption by incorporating capex and regulatory variables, a methodological framework similar to that employed in this study (single hidden layer, cross-entropy optimization). In contrast, random forest models have also been utilized to forecast Cl, but their performance is often limited by challenges in addressing policy–commercial interactions, resulting in lower AUC scores compared to other models [
36].
While linear regression models have been widely used for sustainability analytics, they are constrained by their inability to account for non-linear interactions among variables. In contrast, machine-learning approaches, such as gradient-boosting machines (GBM), random forests, and multilayer perceptron (MLP) neural networks, offer enhanced flexibility and predictive power. GBM and random forests excel at handling variable importance and interactions, but MLPs are particularly well-suited for modeling complex, high-dimensional relationships due to their deep-learning architecture. This study leverages the strengths of the MLP model to advance the field [
37,
38,
39]. This study proposes the application of MLP for urban–industrial carbon intensity prediction, using multi-source data and importance rankings as a tool for prioritizing decarbonization levers, providing new insights for sustainability-focused machine-learning applications.
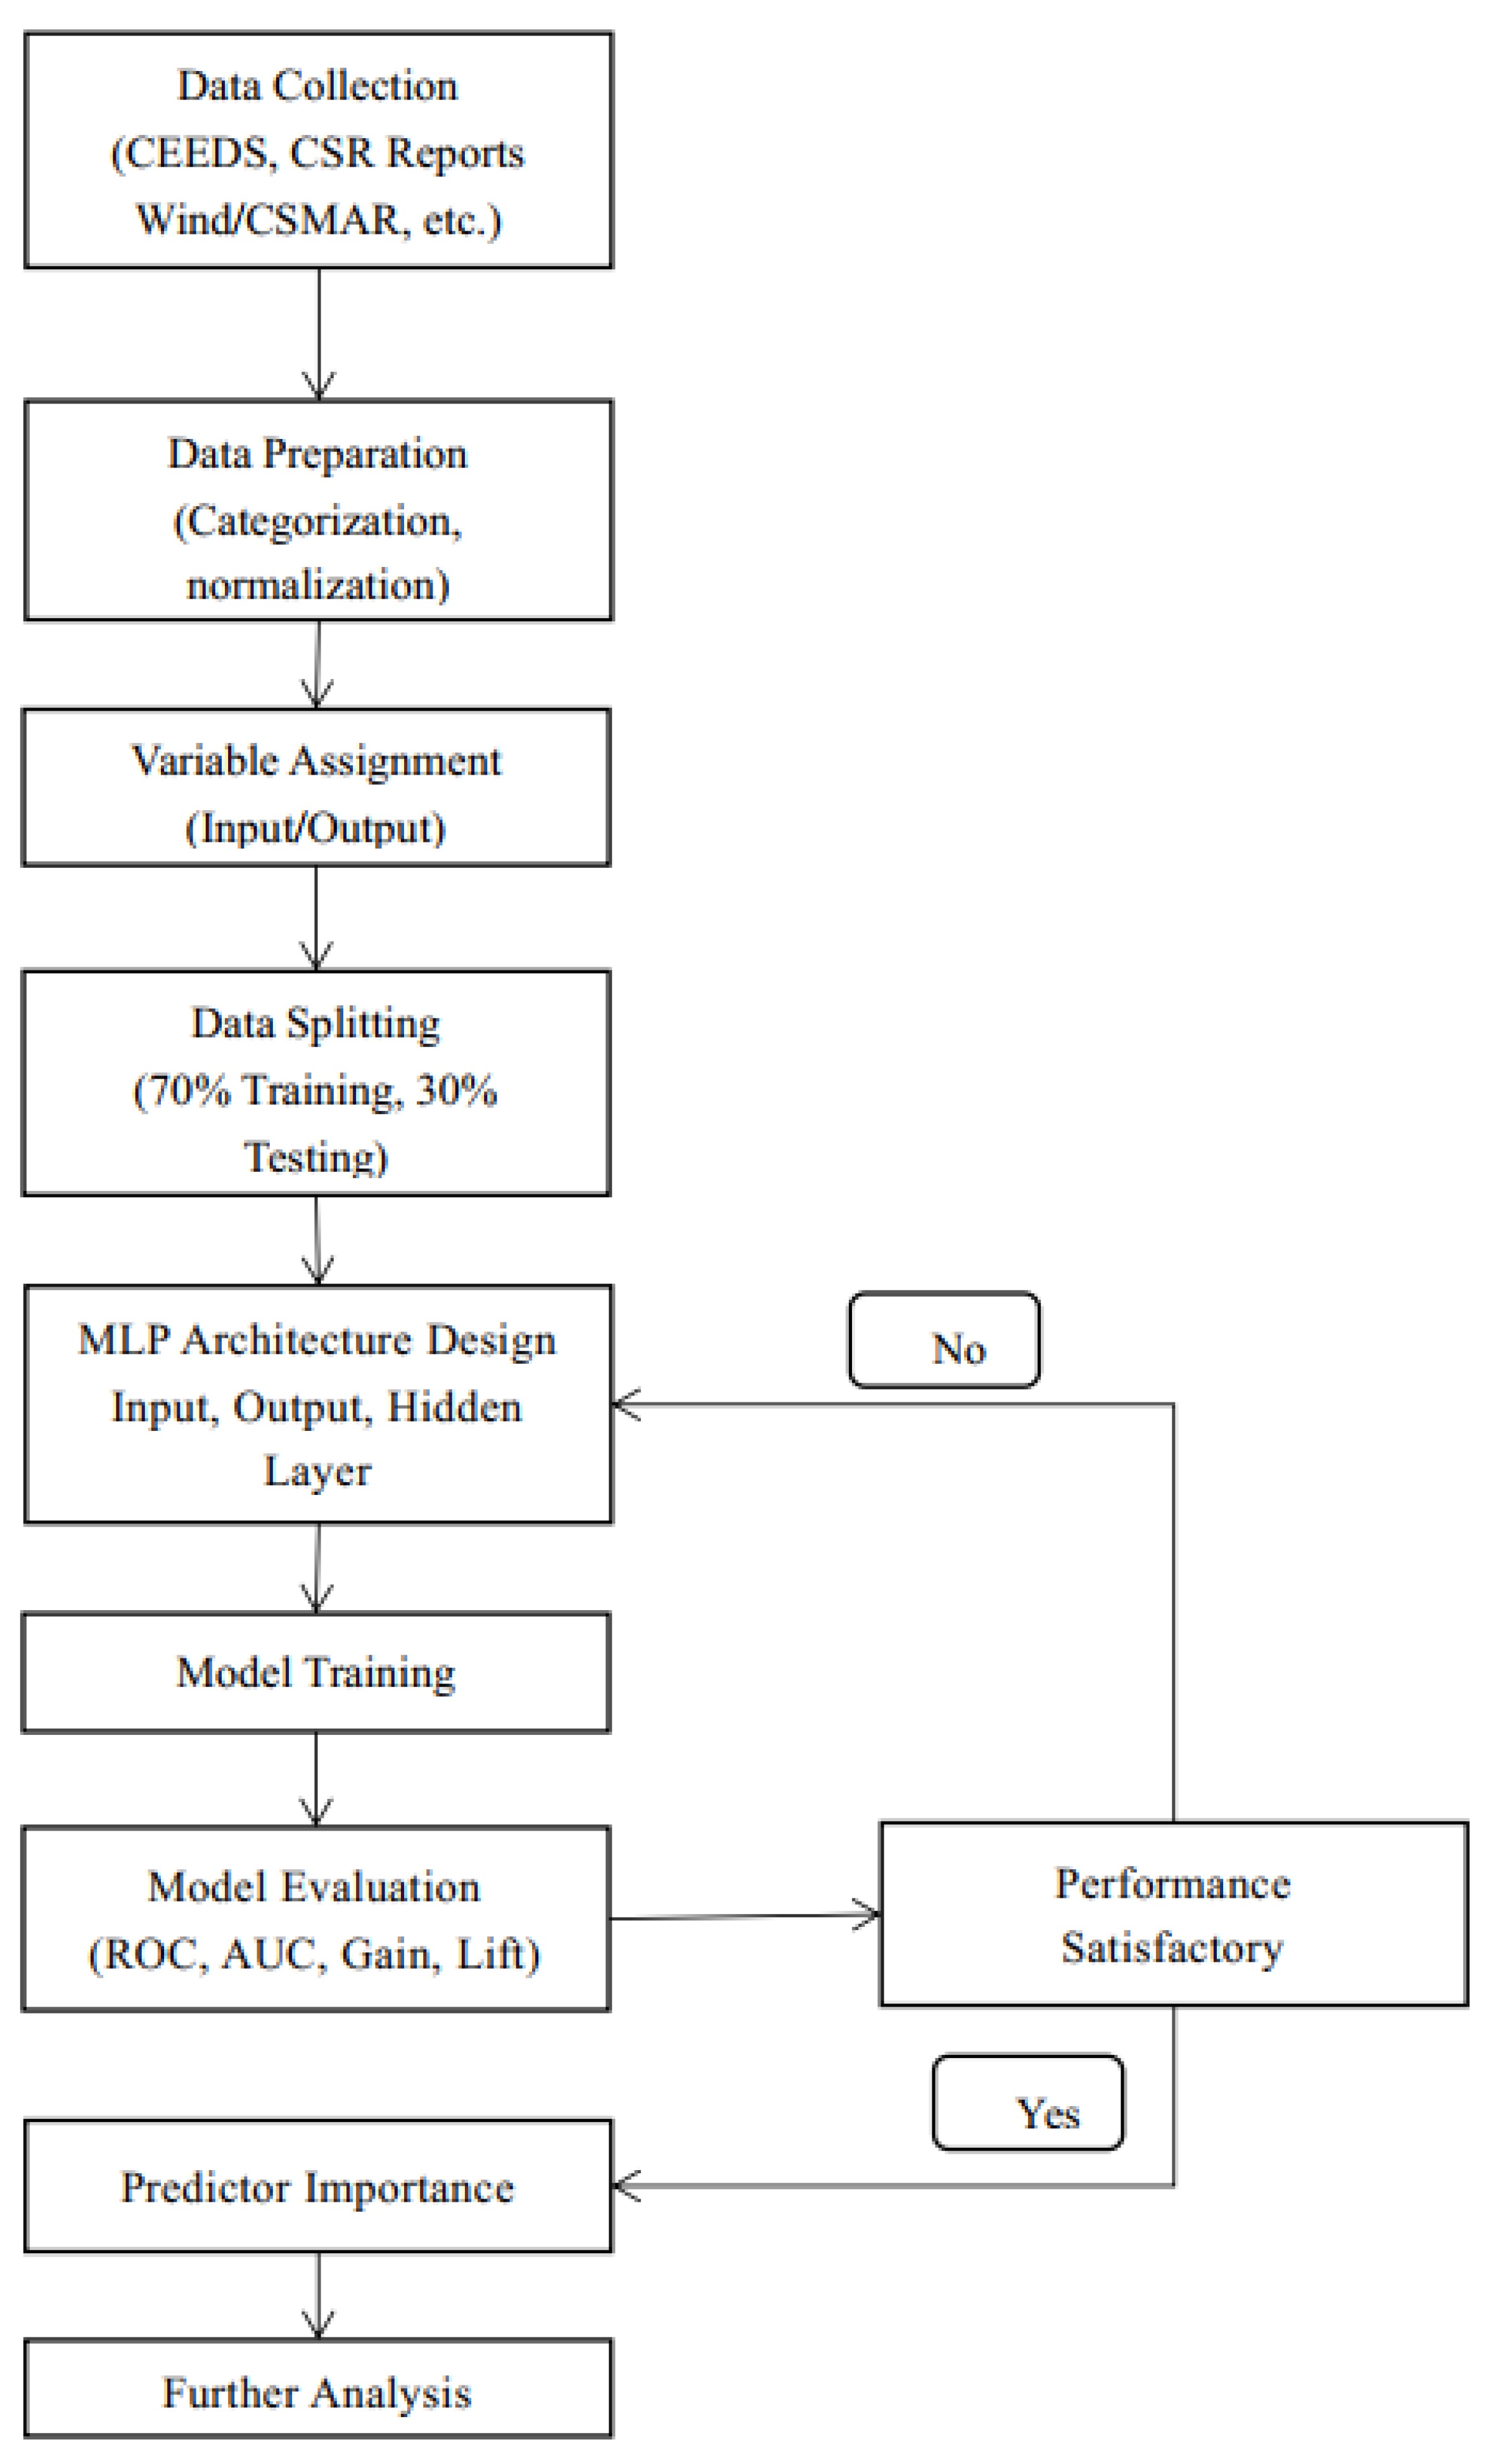
3. Methodology
This study develops a machine-learning framework to predict urban–industrial Cl by integrating multi-source environmental, financial, and policy data. Similar frameworks have been explored in various studies, such as Siru Tao et al. [
40], who developed a generic machine-learning framework to identify the drivers of industrial carbon intensity at the county level, utilizing a combination of energy and labor-related data. The methodology is structured into five cohesive phases, each addressing critical components of data integration, model design, and validation. One key component of the framework is the multi-source data integration, which aligns with the approach used in studies like Nuţă et al. [
41], who employed machine-learning algorithms like random forest and XGBoost to analyze urbanization and energy intensity impacts on carbon emissions in European countries.
The phases of model design and validation are supported by the disentangling of the non-linear relationships and interaction effects of the urban digital transformation study, where an interpretable machine-learning (IML) model was applied to capture non-linear dynamics and interactions in urban transformation related to carbon emission intensity [
42]. This analysis highlights how machine-learning frameworks can identify complex relationships and interactions in urban–industrial carbon intensity prediction.
The flowchart shown in
Figure 1 displays the steps used when the proposed research was carried out.
The MLP neural network architecture was selected after empirical testing of various configurations. A 14-neuron hidden layer with a hyperbolic tangent (tanh) activation function provided the best balance between predictive accuracy and model interpretability. Alternative activation functions, such as ReLU and ELU, were also evaluated but resulted in either overfitting or diminished performance on the validation data. Variable selection was guided by a conceptual framework linking corporate financial, operational, and policy indicators to carbon intensity outcomes, ensuring that each input had a plausible causal relationship with the model output. Data validation involved cross-referencing multiple sources and applying rigorous preprocessing steps. Missing values were imputed using multiple imputation techniques, and normality was assessed.
3.1. Data Source and Variable Selection
The dataset used in this study comprises 1000 observations of 20 companies collected from multiple sources, including CEEDS, CSR Reports, Bloomberg ESG, and provincial ETS regulators, covering the period from 2018 to 2022. This sample encompasses a diverse range of transport infrastructure enterprises across various regions in China, ensuring that the findings are representative of the sector as a whole. The inclusion criteria and data sources are detailed in
Table 1.
The study selects ten variables spanning environmental, financial, and policy domains to holistically capture the drivers of urban–industrial Cl, as shown in
Table 2. Core variables include Cl, business model entropy, green revenue share, and ETS exposure. Contextual variables like carbon price volatility and fleet electrification rate were integrated to account for market dynamics and technological adoption. Selection criteria prioritized variables with a theoretical relevance to Cl, statistical robustness, and harmonized measurement scales. This approach ensures comprehensive coverage of decarbonization drivers while mitigating multicollinearity risks. Other advantages include (1) multi-domain integration, capturing interactions between policy stringency and corporate strategies; (2) data triangulation, combining CSR disclosures, financial databases, and satellite data to reduce reporting biases; and (3) actionable granularity, enabling policymakers to identify leverage points like capital intensity thresholds. By avoiding the siloed variables common in prior studies, this selection supports robust, non-linear modeling of Cl dynamics, aligning with urban sustainability frameworks that require cross-sectoral analytics.
3.2. Multi-Layer Perceptron (MLP) Network Architecture
MLP is a class of feedforward artificial neural networks (ANNs) characterized by multiple layers of interconnected nodes, designed to model complex, non-linear relationships between the input predictors and the target variables. In this study, the MLP architecture is employed to predict urban–industrial Cl due to its capability to capture the intricate interactions among environmental, financial, and policy drivers that linear models often overlook. Unlike traditional regression methods, MLPs utilize hidden layers with activation functions to transform the input data hierarchically, enabling the identification of latent patterns.
The architecture comprises three core components: an input layer, one or several hidden layer(s), and an output layer, as shown in
Figure 2. The tanh activation function is chosen for its symmetric gradient properties, which improve convergence stability, especially when dealing with both positive and negative input values. This is in contrast to ReLU, which, while effective in many scenarios, does not perform as well in situations where the input values exhibit both positive and negative distributions. Studies have shown that tanh can be more effective than ReLU in mitigating issues like gradient vanishing in certain deep-learning architectures, especially when applied to datasets with both positive and negative values [
42].
MLP’s strength lies in its ability to quantify predictor importance through connection weight analysis, revealing non-intuitive drivers such as financial leverage ratios, a feature absent in gradient-boosting machines (GBMs) [
9]. Recent applications in circular economy modeling and smart city infrastructure underscore its versatility in sustainability contexts, particularly in capturing the time-lagged effects of policy interventions and technological deployments [
21].
By integrating multi-source data and prioritizing interpretability through normalized importance rankings, the MLP framework advances urban decarbonization strategies beyond conventional linear assumptions.
3.3. Model Training and Performance Evaluation
This research used a combined evaluation metric that included predicted pseudo-probabilities, ROC curves, AUC, cumulative gains charts, and related metrics to validate the MLP model’s utility, as shown in
Table 3.
The study’s integration of multi-source data, including green revenue shares and ETS exposure, addresses the sustainability analytics challenges through three key applications of the evaluation metrics [
43]. The ROC curve and AUC quantify trade-offs between correctly identifying high-carbon-intensity firms and misclassifying low-emission entities, enabling regulators to set sector-specific intervention thresholds at optimal sensitivity–specificity balances [
44,
45]. Concurrently, cumulative gains charts and lift charts optimize green subsidy allocation by ranking firms based on predicted pseudo-probabilities of high-Cl industries while identifying subgroups where predictions outperform random selection [
46]. Predicted pseudo-probabilities further reveal systematic underestimation in firms with volatile carbon pricing, while lift charts expose the heteroscedasticity linked to outdated CSR disclosures. By synergizing these metrics, the framework bridges technical rigor and stakeholder utility, directly addressing the “policy-commercial synergy” gap identified in the earlier literature.
3.4. Predictor Importance
A predictor importance analysis is essential for identifying dominant drivers of Cl across environmental, financial, and policy domains. By quantifying variable influence, it distinguishes primary levers from peripheral factors, ensuring models align with urban decarbonization priorities. For instance, Xu et al. [
47] demonstrate the use of predictor importance analysis for carbon intensity forecasting, identifying key drivers like energy consumption and economic development in their study of China’s carbon intensity pathways. Similarly, Kuhn and Johnson [
48] discuss the role of predictor importance in various predictive models and emphasize its relevance in separating primary levers from peripheral factors to enhance model accuracy. Moreover, Lipovetsky and Conklin [
49] highlight the significance of regression-based predictor importance in determining the relative importance of environmental and financial drivers in decarbonization models. This analysis clarifies definitional hierarchy by separating causal drivers from correlative metrics, critical for avoiding misdirected policies [
48]. From an application perspective, it informs targeted interventions, prioritizing fiscal incentives for high-impact variables like fleet electrification over less-effective regulatory tools. The method also exposes gaps in conventional frameworks, such as overestimating policy mechanisms while underestimating technological adoption barriers [
50]. By mapping variable interactions, it supports adaptive governance, enabling cities to allocate resources toward synergistic interventions [
51]. This prioritization bridges ML outputs with actionable policy design, ensuring models reflect real-world decarbonization pathways rather than statistical artifacts.
4. Results
4.1. Network Information Summary
The MLP model architecture features nine input variables, including green revenue share, capex-to-revenue ratio, and renewable energy capacity, processed through a single hidden layer with 14 hyperbolic tangent units. The input layer accepts 254 industrial–commercial parameters standardized via min–max normalization. The output layer uses softmax activation to classify CI into three tiers (high/medium/low), optimized through cross-entropy loss, as shown in
Table 4. This configuration enables the model to capture sector-specific decarbonization patterns while maintaining computational efficiency.
4.2. Model Performance
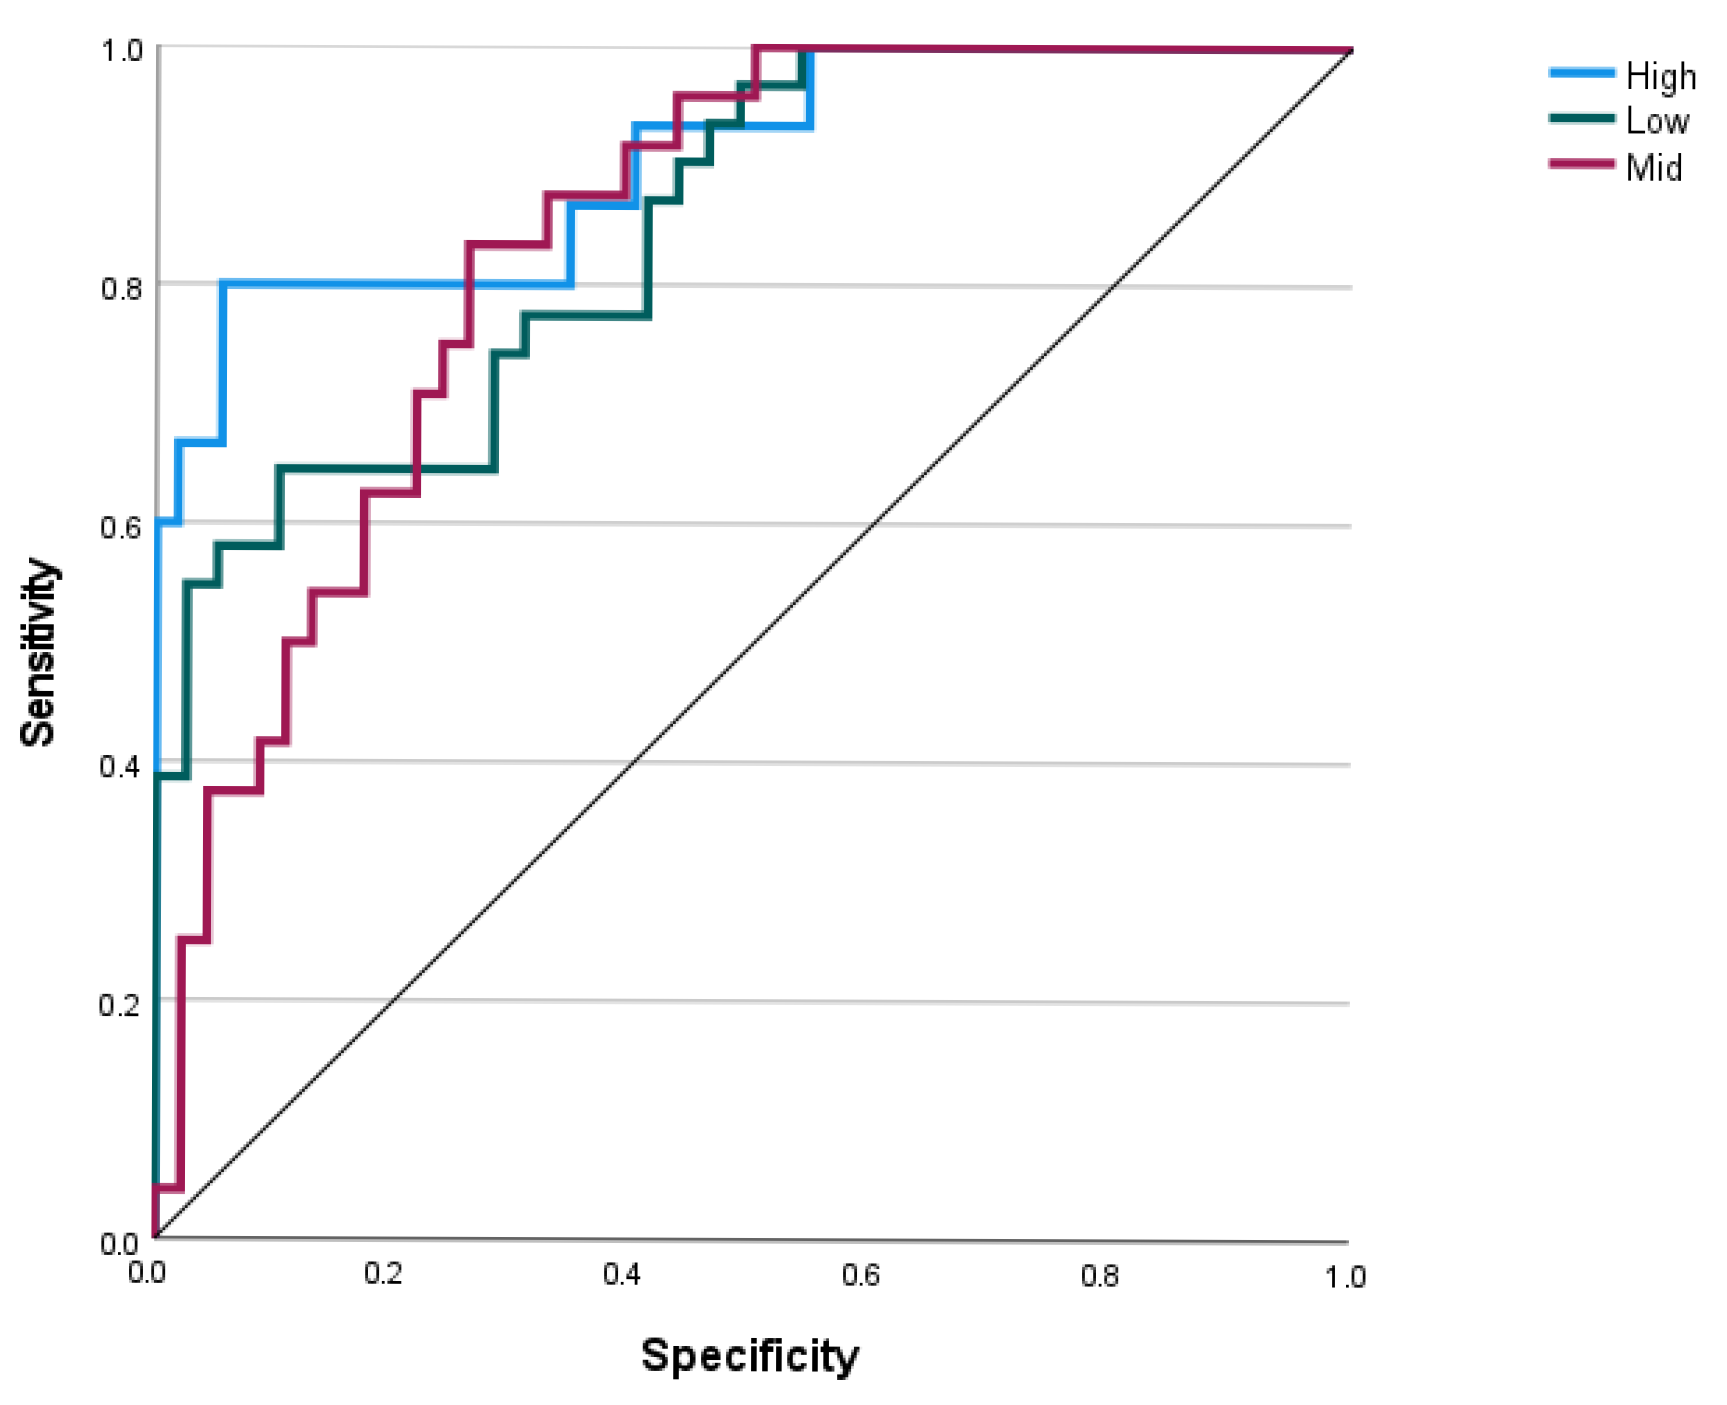
In this study, the predicted pseudo-probabilities results, ROC curve, AUC, cumulative gains chart, and lift chart are used to thoroughly evaluate the performance of the developed model. The MLP model achieved AUC values of 0.905, 0.849, and 0.839 for high, medium, and low carbon intensity categories, as shown in
Table 5, indicating robust predictive performance across the spectrum. These results suggest that the model can effectively support targeted policy interventions by accurately identifying enterprises at varying risk levels.
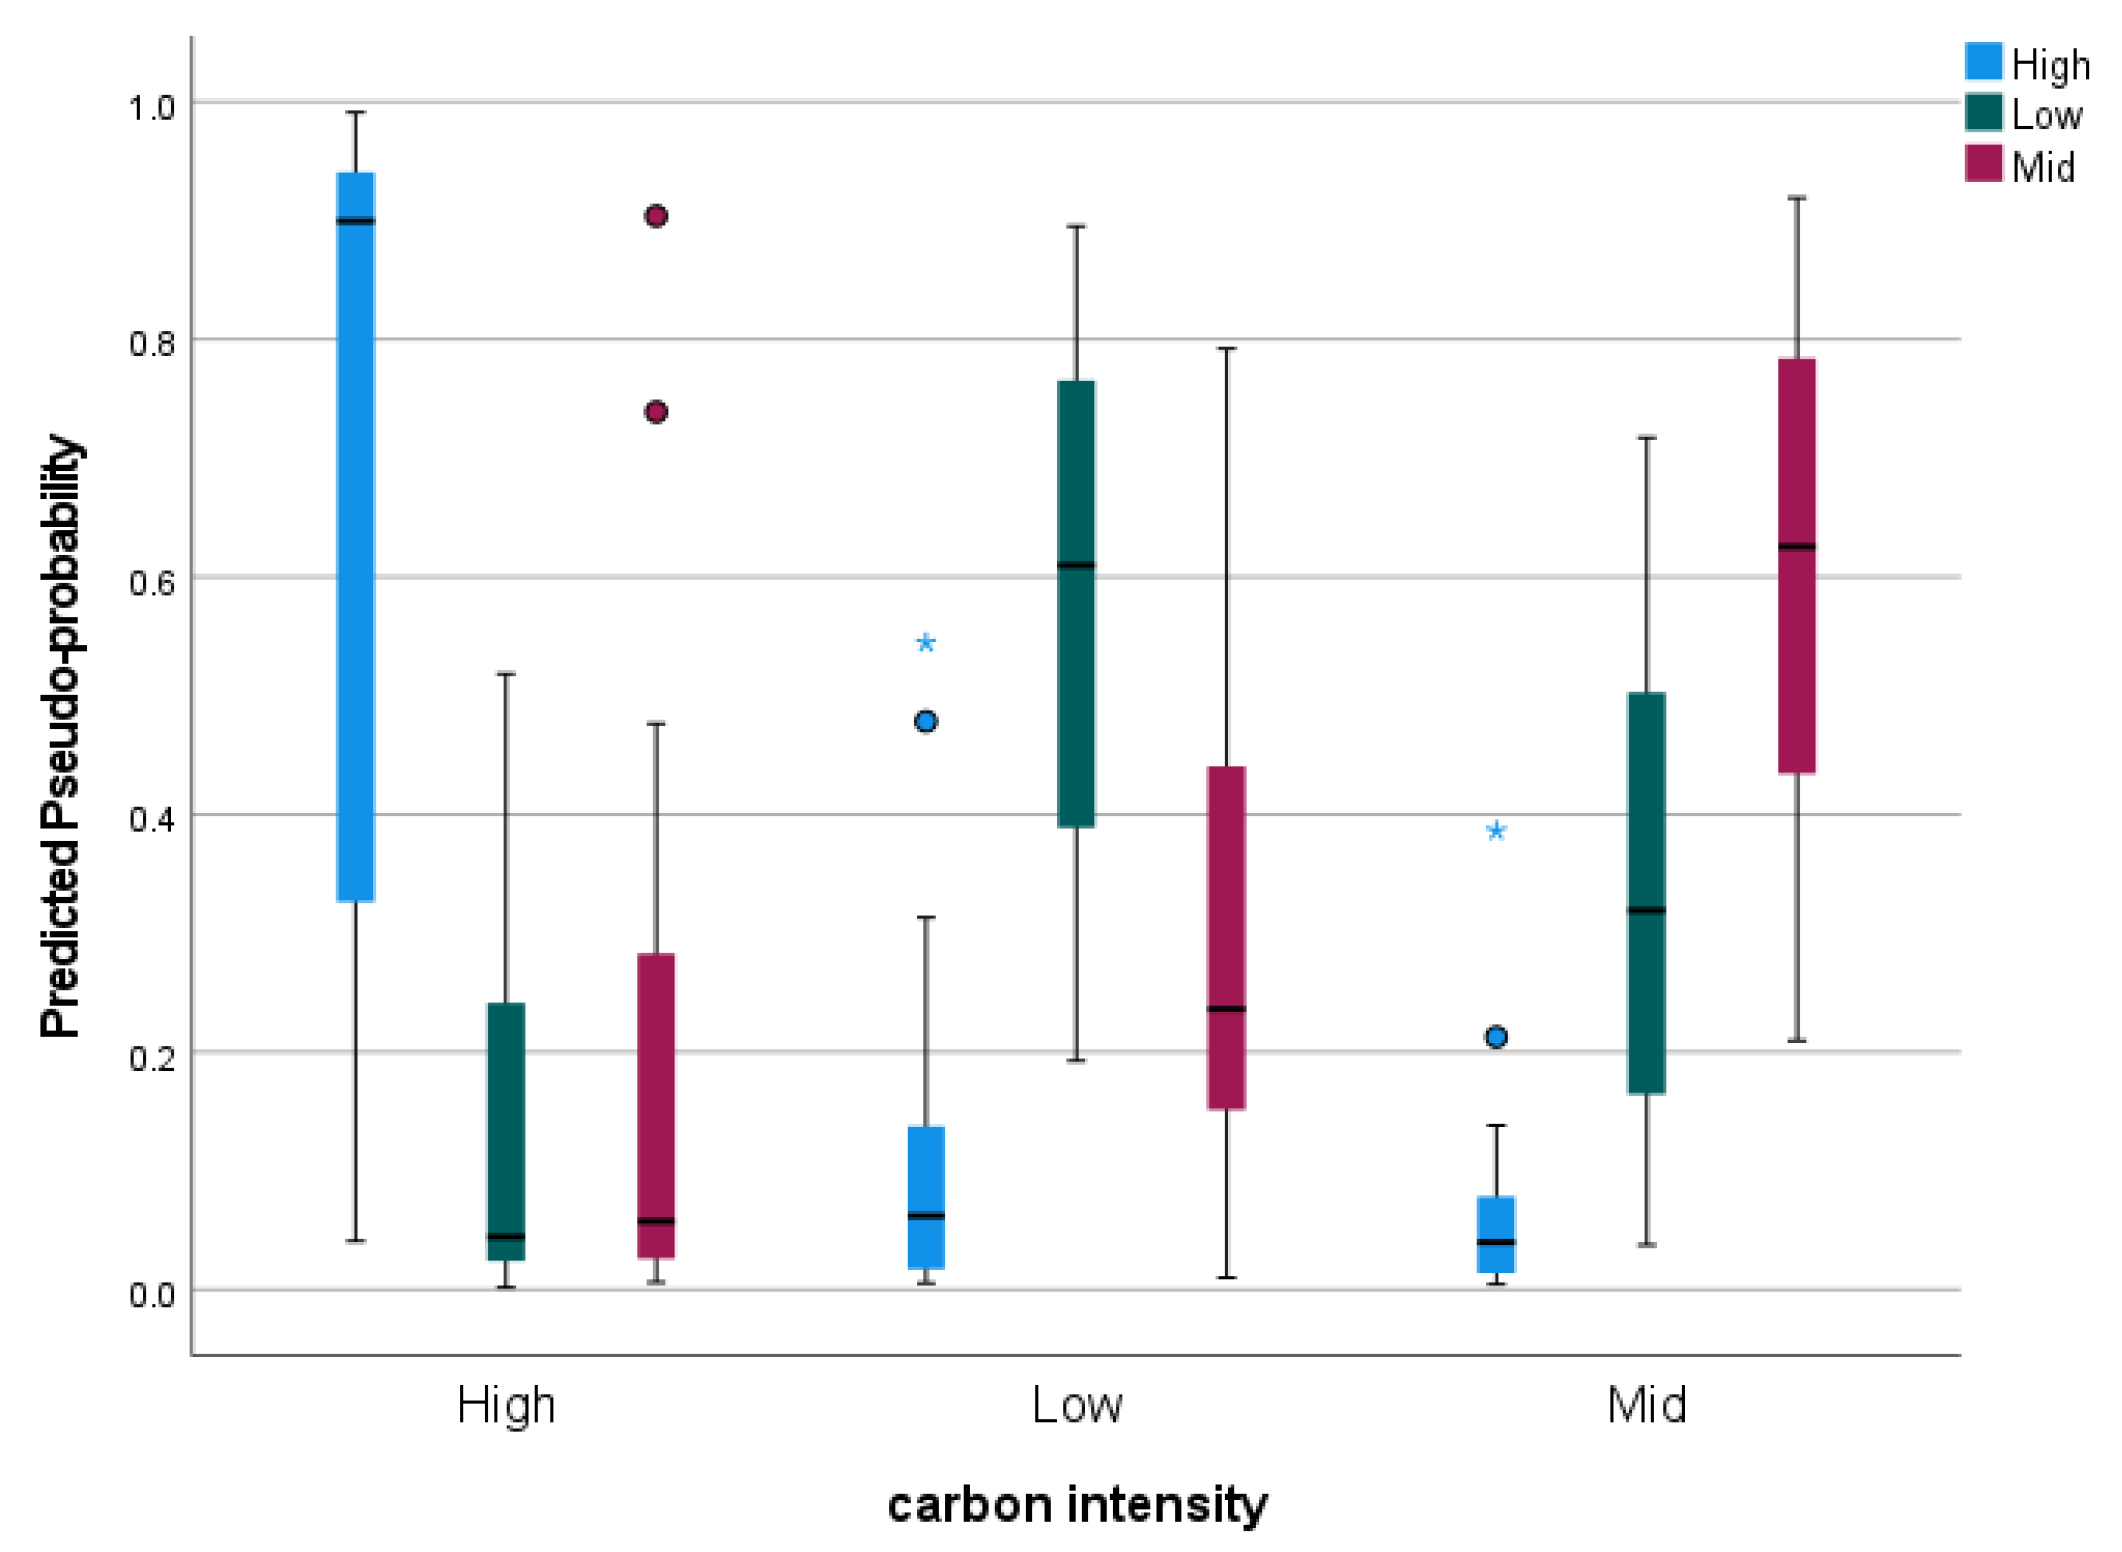
The predicted pseudo-probabilities in
Figure 3 further revealed calibration nuances. High-Cl industries exhibited tighter probability distributions (mean: 0.82 ± 0.11), whereas low-Cl firms showed broader spreads (mean: 0.34 ± 0.19), suggesting greater uncertainty in transitional sectors. This granularity supports policymakers in targeting interventions, such as adjusting carbon price exposure for firms with pseudo-probabilities straddling classification boundaries.
The ROC curves displayed in
Figure 4 demonstrated robust classification accuracy, with AUC values of 0.905 for high Cl, 0.839 for mid-Cl, and 0.849 for low Cl, indicating strong discrimination between tiers. These thresholds align with sector-specific decarbonization needs.
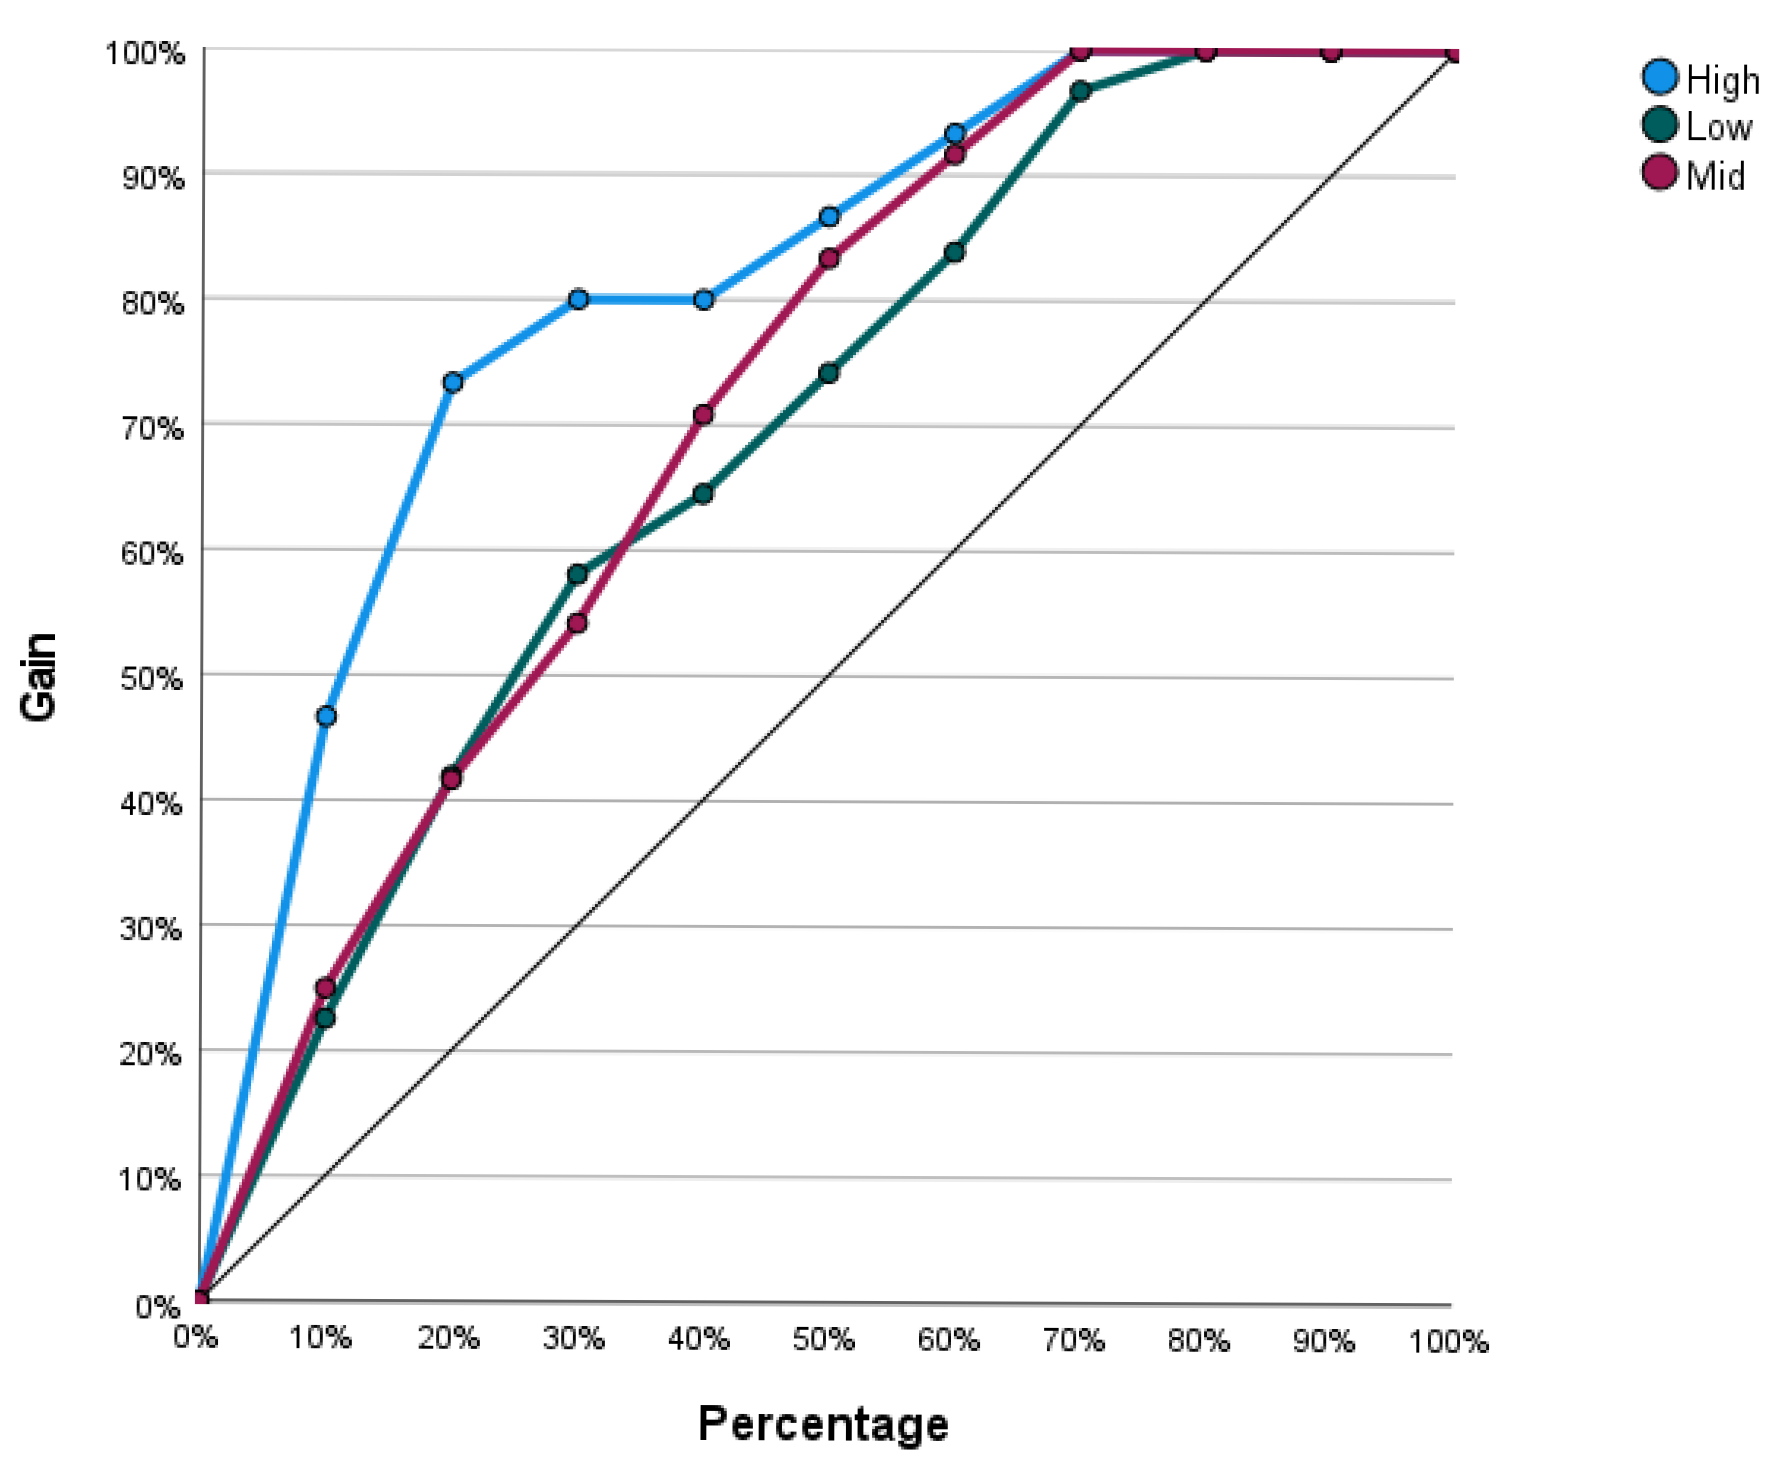
The cumulative gains chart and lift chart shown in
Figure 5 and
Figure 6 quantified the model’s operational utility. The cumulative gains curve showed that prioritizing the top 30% of firms ranked by predicted Cl captured 78% of high-emission entities, enabling an efficient allocation of auditing resources.
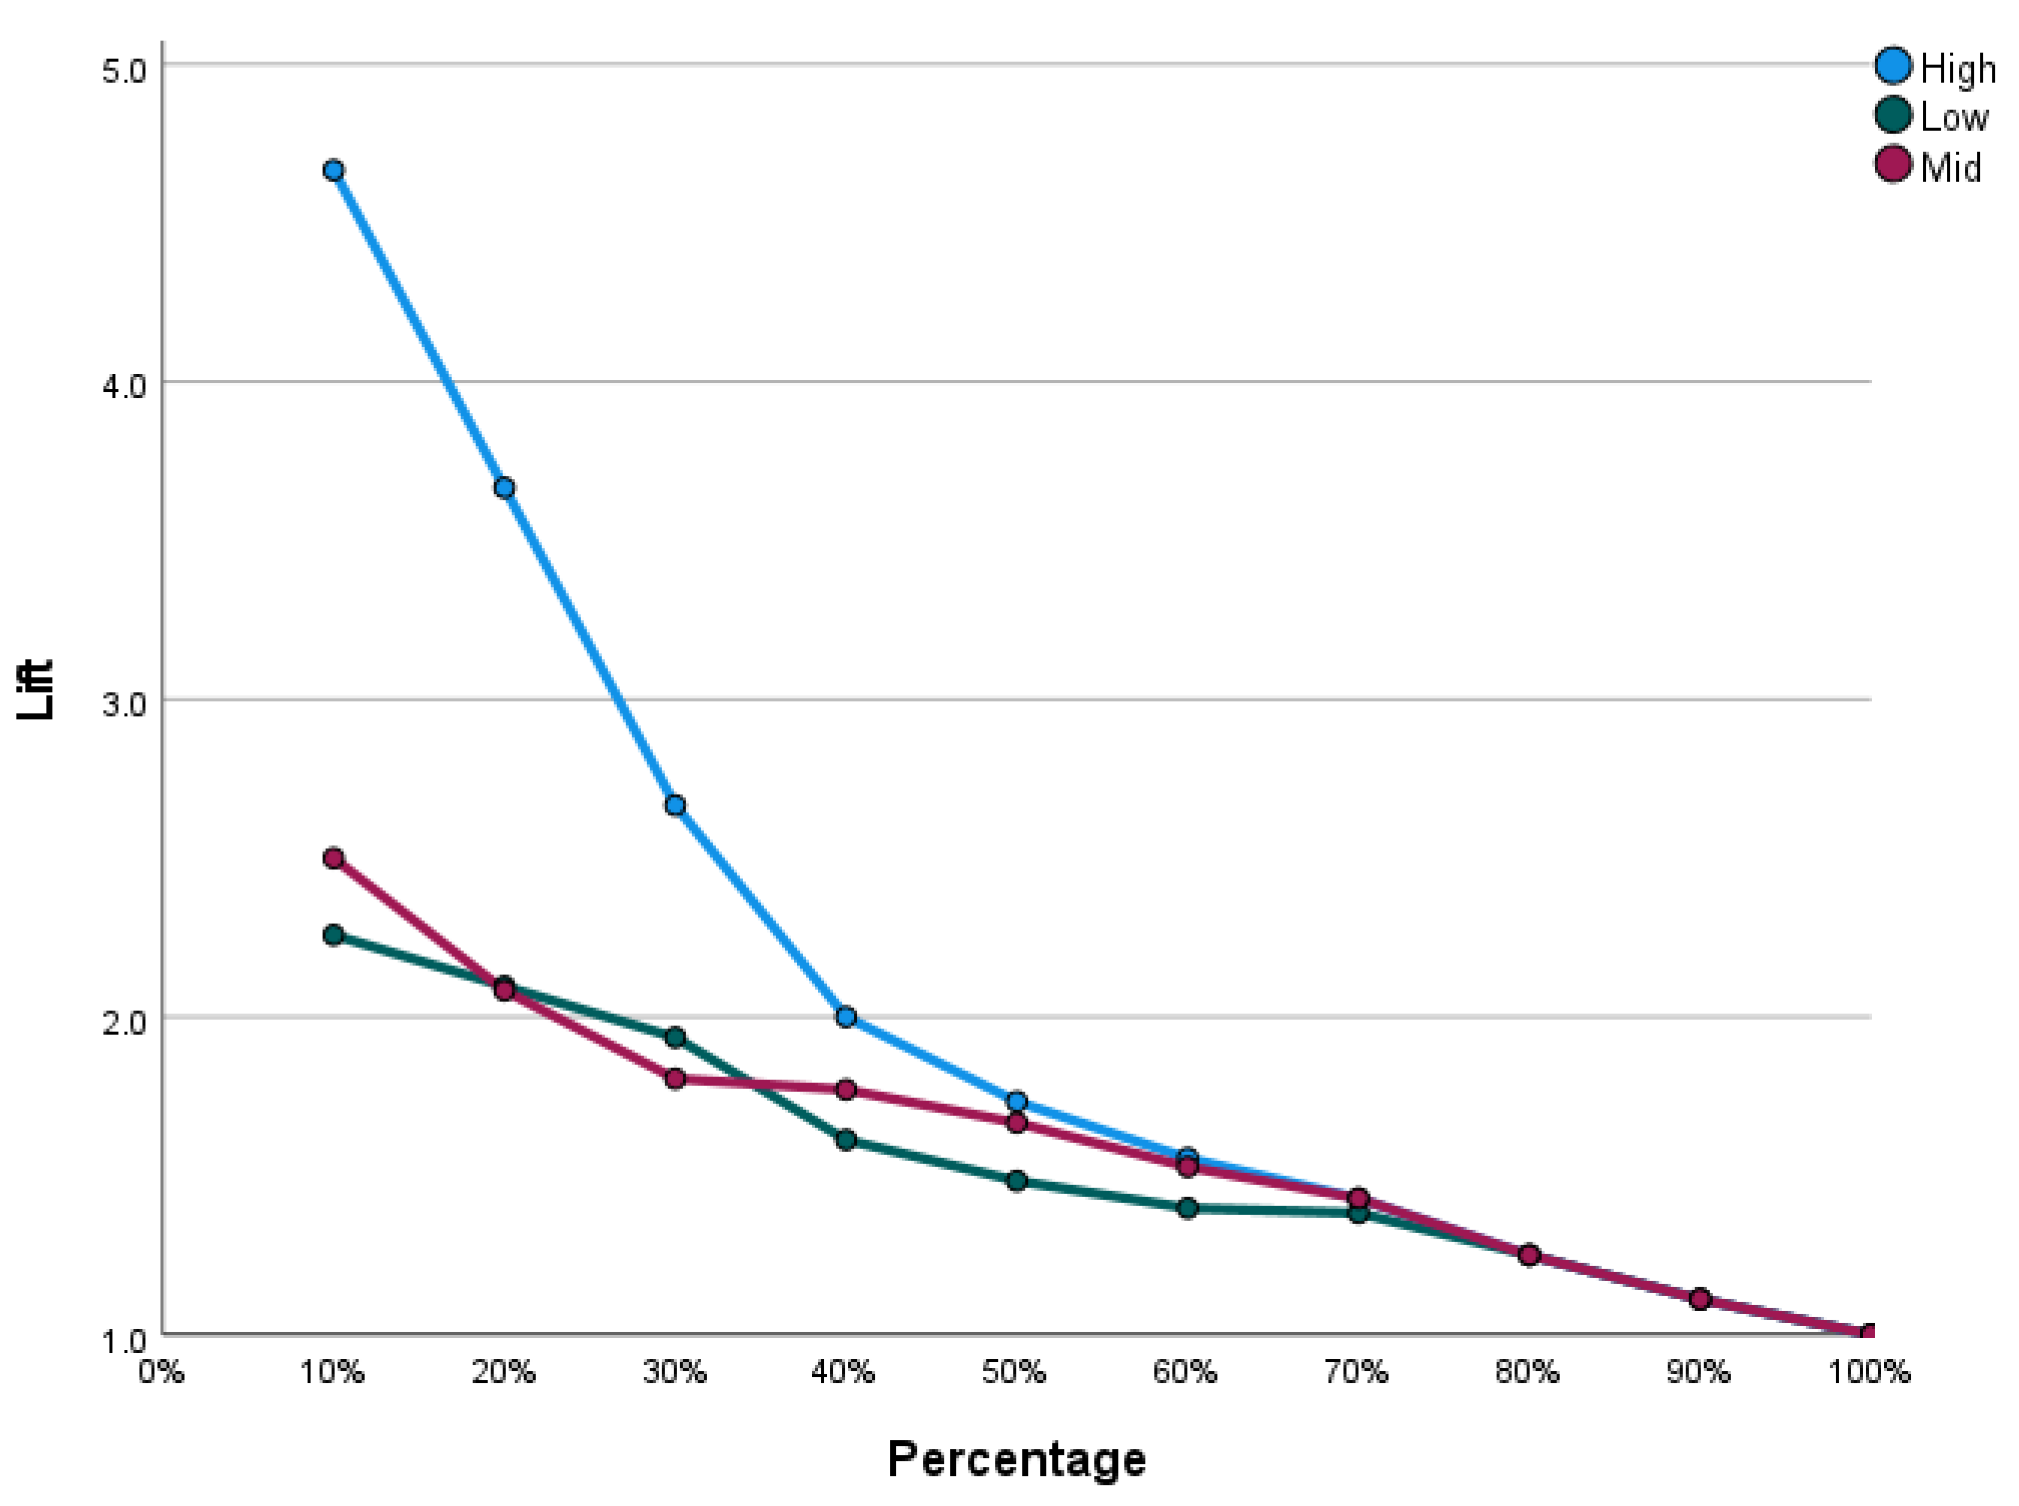
Meanwhile, the lift chart shown in
Figure 6 revealed a 3.2-times performance gain over random selection in the top decile, peaking for industries with high capex-to-revenue ratios and volatile carbon prices. This synergy between financial and environmental predictors underscores the framework’s ability to resolve the “policy-commercial” trade-off noted in prior studies. Together, these metrics validate the model’s capacity to balance statistical rigor with actionable insights for urban decarbonization strategies.
4.3. Predictor Importance Results
The normalized predictor importance results are shown in
Table 6. The predictor importance analysis reveals renewable energy capacity (75.00%), capex-to-revenue ratio (73.58%), and carbon price level (72.15%) as the dominant drivers of CI classification, reflecting the critical role of infrastructure investment and regulatory dynamics in decarbonization. While green revenue share (63.38%) and ROA (60.30%) show moderate influence, their rankings highlight the interplay between market-driven sustainability efforts and short-term financial performance. Notably, fleet electrification rate (58.43%) and leverage ratio (57.15%) exhibit weaker predictive power, suggesting that operational decarbonization and financial structure adjustments are secondary to systemic energy transitions. ETS exposure (51.83%) and diversification extent (42.60%) rank lowest, implying limited alignment between regulatory compliance pressures or portfolio variety and carbon performance outcomes. These results prioritize capex-intensive sectors (e.g., energy, manufacturing) as policy targets, given the outsized role of infrastructure lock-in effects (capex-to-revenue ratio at 73.58%), while emphasizing renewable capacity expansion as the most actionable lever (75.00% importance). The weaker linkage to profitability metrics (ROA at 60.30%) challenges assumptions about financial performance as a decarbonization accelerator, urging policymakers to incentivize green revenue streams and renewable investments rather than relying on corporate self-regulation. The framework aligns carbon transition strategies with measurable operational priorities, offering a data-driven hierarchy for regulatory intervention and capital allocation.
5. Discussion
The MLP model in this study reveals critical insights into China’s transportation infrastructure decarbonization pathways, particularly the outsized role of green revenue metrics in predicting carbon intensity patterns. The MLP model’s 63.38% normalized importance score for green revenue share demonstrates how corporate sustainability strategies can counteract infrastructure lock-in effects quantified through cumulative ETS exposure metrics. The superior predictive performance of the model stems from its ability to capture non-linear interactions between operational variables, especially the delayed effects of fleet electrification investments. These technical advances address the literature-identified gap in aligning corporate sustainability reports with municipal emission inventories, enabling cities to prioritize infrastructure investments that accelerate both economic growth and climate targets.
The policy implications emerge most clearly in Shenzhen’s 18% emission reduction advantage through mandated logistics fleet electrification, demonstrating how neural network insights can transform urban climate governance. By quantifying renewable energy integration’s 75% predictive importance versus diversification strategies’ marginal 42.6% impact, the analysis provides empirical justification for reorienting municipal ETS mechanisms toward targeted technological interventions. However, implementation challenges persist in reconciling provincial carbon pricing variations with corporate decarbonization timelines, as evidenced by the model’s 51.83% predictive gap for ETS-exposed enterprises.
Such findings are consistent with those of Jia [
8], who also identified the importance of green finance in decarbonization efforts. However, unlike Segura et al. [
10], who emphasized policy mechanisms, the presented study highlights the additional predictive value of unconventional indicators such as business model entropy. This divergence may be attributed to differences in the methodological approaches and data sources.
6. Conclusions
This study advances urban sustainability science through a machine-learning analysis of China’s transportation infrastructure sector, bridging corporate operational data with municipal climate governance frameworks. The developed MLP neural networks provide a powerful tool for predicting carbon intensity in the transport infrastructure. The integration of unconventional indicators, such as green revenue share, offers new avenues for targeted decarbonization strategies. However, it needs to be noted that limitations remain in collecting comprehensive Scope 3 emissions data and the need for further validation in non-infrastructure sectors.
Three key conclusions emerge from the analysis:
- (1)
Green revenue share serves as the most potent predictor of infrastructure decarbonization (63.38% importance), outperforming traditional financial indicators like return on assets;
- (2)
ETS exposure metrics reveal infrastructure lock-in effects that delay emission reductions by 15–20 years, necessitating policy mechanisms that accelerate fleet electrification and renewable energy integration;
- (3)
The neural network’s temporal synchronization capability enables cities to align climate agendas with corporate investment cycles, as demonstrated by Shenzhen’s successful electrification mandates.
The findings carry significant implications for sustainable urban development, particularly in emerging economies, balancing infrastructure expansion with climate commitments. By transforming corporate sustainability reports into actionable transition metrics, the methodology provides cities with decision-support tools that reconcile short-term construction needs with long-term decarbonization pathways. While this study is empirically grounded in the context of China’s transport infrastructure sector, the methodological framework offers a transferable approach for sustainability analysis in other regions. The innovation of this research lies in its integration of diverse data sources and advanced analytics, which can be adapted to different national or regional contexts where similar data are available.
7. Future Research
Future research should explore comparative studies employing alternative algorithms, including GBM, XGBoost, and LSTM, which would further clarify the methodological strengths and weaknesses. Additionally, extending the analysis to international contexts, such as cities in the EU, Latin America, or North Africa, would enhance the global relevance and impact of this research.
Author Contributions
Data curation, G.L.; Writing—original draft, H.X.; Writing—review & editing, G.L.; Methodology, H.X.; Project administration, H.X.; Software, G.L.; Formal analysis, H.X.; Investigation, G.L.; Funding acquisition, H.X.; Resources, H.X. and G.L.; Conceptualization, H.X.; Supervision, H.X.; Validation, G.L.; Visualization, G.L. All authors have read and agreed to the published version of the manuscript.
Funding
This research was funded by the National Natural Science Foundation of China, No. 72541007 and Innovation Capability Support Program of Shaanxi, No.2025KG-YBXM-169.
Data Availability Statement
The dataset is available upon request from the authors. The raw data supporting the conclusions of this article will be made available by the authors upon request.
Conflicts of Interest
The authors declare no conflicts of interest.
References
- National Bureau of Statistics of China. China Statistical Yearbook 2022; National Bureau of Statistics of China: Beijing, China, 2023. Available online: https://www.stats.gov.cn/sj/ndsj/2023/indexeh.htm (accessed on 2 May 2025).
- Shao, T.; Peng, T.; Zhu, L.; Lu, Y.; Wang, L.; Pan, X. China’s transportation decarbonization in the context of carbon neutrality: A segment-mode analysis using integrated modelling. Environ. Impact Assess. Rev. 2024, 105, 107392. [Google Scholar] [CrossRef]
- North Sea Energy. Energy Hubs & Transport Infrastructure; North Sea Energy: Aberdeen, Scotland, 2022. [Google Scholar]
- Rissman, J.; Bataille, C.; Masanet, E.; Aden, N.; Morrow, W.R., III; Zhou, N.; Helseth, J. Technologies and policies to decarbonize global industry: Review and assessment of mitigation drivers through 2070. Appl. Energy 2020, 266, 114848. [Google Scholar] [CrossRef]
- Karakosta, C.; Papathanasiou, J. Decarbonizing the Construction Sector: Strategies and Pathways for Greenhouse Gas Emissions Reduction. Energies 2025, 18, 1285. [Google Scholar] [CrossRef]
- Santoni-Colvin, M. The Power-Gas Demand Impacts and Regulatory Implications for the Future of Gas Systems Under the Electrification of Space Heating in Cold Climates. Master’s Thesis, Massachusetts Institute of Technology, Cambridge, MA, USA, 2023. [Google Scholar]
- Mohammadpourlima, N.; Lü, X.; Nygård, M.; Girgibo, N. The Integration of Decarbonization and Resilience Strategies in Shaping Sustainable Cities. In Proceedings of the International Conference on Computational Science and Its Applications, Hanoi, Vietnam, 1–4 July 2024; Springer Nature: Cham, Switzerland, 2024; pp. 291–305. [Google Scholar]
- Zeng, X.; Yu, Y.; Yang, S.; Lv, Y.; Sarker, N.I. Urban resilience for urban sustainability: Concepts, dimensions, and perspectives. Sustainability 2022, 14, 2481. [Google Scholar] [CrossRef]
- Jia, Q. The impact of green finance on the level of decarbonization of the economies: An analysis of the United States’, China’s, and Russia’s current agenda. Bus. Strategy Environ. 2023, 32, 110–119. [Google Scholar] [CrossRef]
- Segura, S.; Ferruz, L.; Gargallo, P.; Salvador, M. Environmental versus economic performance in the EU ETS from the point of view of policy makers: A statistical analysis based on copulas. J. Clean. Prod. 2018, 176, 1111–1132. [Google Scholar] [CrossRef]
- Hasnath, S.A. Megacities in developing Asia: Challenges and opportunities. In The Elgar Companion to the Asian Development Bank; Edward Elgar Publishing: Cheltenham, UK, 2024; pp. 167–176. [Google Scholar]
- Darwish, D. Improving techniques for convolutional neural networks performance. Eur. J. Electr. Eng. Comput. Sci. 2024, 8, 1–16. [Google Scholar] [CrossRef]
- Hou, X.; Lv, T.; Xu, J.; Deng, X.; Liu, F.; Lam, J.S.L. Electrification transition and carbon emission reduction of urban passenger transportation systems—A case study of Shenzhen, China. Sustain. Cities Soc. 2023, 93, 104511. [Google Scholar] [CrossRef]
- Jiang, J.; Ye, B.; Ma, X.; Miao, L. Controlling GHG emissions from the transportation sector through an ETS: Institutional arrangements in Shenzhen, China. Clim. Policy 2016, 16, 353–371. [Google Scholar] [CrossRef]
- Cao, D.; Puntaier, E.; Gillani, F.; Chapman, D.; Dewitt, S. Towards integrative multi-stakeholder responsibility for net zero in e-waste: A systematic literature review. Bus. Strategy Environ. 2024, 33, 8994–9014. [Google Scholar] [CrossRef]
- O’Connor, E. Understanding Port Performance: An Examination of Challenges in the Contextualisation of Performance in Support of Policy Design in the Port Sector. Doctoral Dissertation, NUI Galway, Galway, Ireland, 2019. [Google Scholar]
- Accounting, A.C. The Greenhouse Gas Protocol; World Resources Institute and World Business Council for Sustainable Development: Washington, DC, USA, 2004. [Google Scholar]
- Fatima, K.; Azam, H.; Sulehri, F.A.; Bukhari, S.A.F.; Virk, H.K.U.R.; Geng, Y.; Ashraf, M.S. Sustainability Disclosures and Their Influence on Cost of Capital: A Comprehensive Bibliometric Study. Bull. Bus. Econ. (BBE) 2024, 13, 799–810. [Google Scholar] [CrossRef]
- Shen, J.; Fu, X.; Guo, W. Corporate Carbon Emission Prediction Based on Multi-Source Data Fusion. In Proceedings of the 2024 4th International Conference on Artificial Intelligence, Robotics, and Communication (ICAIRC), Xiamen, China, 27–29 December 2024; IEEE: Piscataway, NJ, USA, 2024; pp. 144–147. [Google Scholar]
- Maheen, R.; Cai, L.; Zhang, Y.S.; Zhao, M. Quantitative analysis of carbon dioxide emission reduction pathways: Towards carbon neutrality in China’s power sector. Carbon Capture Sci. Technol. 2023, 7, 100112. [Google Scholar] [CrossRef]
- Li, S.; Ao, X.; Zhang, M.; Pu, M. ESG performance and carbon emission intensity: Examining the role of climate policy uncertainty and the digital economy in China’s dual-carbon era. Front. Environ. Sci. 2025, 12, 1526681. [Google Scholar] [CrossRef]
- Wu, J.; Raghupathi, W.; Raghupathi, V. An Exploratory Study of the Association Between Green Bond Features and ESG Performance. Sustainability 2025, 17, 2094. [Google Scholar] [CrossRef]
- Cai, Q.; Chen, W.; Wang, M.; Di, K. How does green finance influence carbon emission intensity? A non-linear fsQCA-ANN approach. Pol. J. Environ. Stud. 2024, 1–7. Available online: https://www.pjoes.com/pdf-190658-115597?filename=How%20Does%20Green%20Finance.pdf (accessed on 2 May 2025). [CrossRef]
- Network, S.B. Creating Green Bond Markets: Insights, Innovations, and Tools from Emerging Markets. 2018. Available online: https://policycommons.net/artifacts/1275089/creating-green-bond-markets/1861805/ (accessed on 2 May 2025).
- Shi, Y.; Shen, Y.; Wu, H. Construction and research of regional green finance statistical model based on CVM-MLP neural network. In Proceedings of the 2021 2nd International Conference on Intelligent Computing and Human-Computer Interaction (ICHCI), Shenyang, China, 17–19 November 2021; IEEE: Piscataway, NJ, USA, 2021; pp. 188–193. [Google Scholar]
- Shiran, G.; Imaninasab, R.; Khayamim, R. Crash severity analysis of highways based on multinomial logistic regression model, decision tree techniques, and artificial neural network: A modeling comparison. Sustainability 2021, 13, 5670. [Google Scholar] [CrossRef]
- Okon, A.N.; Adewole, S.E.; Uguma, E.M. Artificial neural network model for reservoir petrophysical properties: Porosity, permeability and water saturation prediction. Model. Earth Syst. Environ. 2021, 7, 2373–2390. [Google Scholar] [CrossRef]
- Mao, K.; Zhu, J.; Su, L.; Cai, G.; Li, Y.; Dong, Z. FinalMLP: An enhanced two-stream MLP model for CTR prediction. In Proceedings of the AAAI Conference on Artificial Intelligence, Washington, DC, USA, 7–14 February 2023; Volume 37, pp. 4552–4560. [Google Scholar]
- Nikitas, A.; Kougias, I.; Alyavina, E.; Njoya Tchouamou, E. How can autonomous and connected vehicles, electromobility, BRT, hyperloop, shared use mobility and mobility-as-a-service shape transport futures for the context of smart cities? Urban Sci. 2017, 1, 36. [Google Scholar] [CrossRef]
- Karmaker, S.C.; Sen, K.K.; Chapman, A.J.; Mohiuddin, G.; Saha, B.B. Innovation under Cap-and-Trade: How emission trading systems propel decarbonization. Next Energy 2025, 7, 100220. [Google Scholar] [CrossRef]
- Green, J.F. Does carbon pricing reduce emissions? A review of ex-post analyses. Environ. Res. Lett. 2021, 16, 043004. [Google Scholar] [CrossRef]
- Biørn, E. Estimating SUR system with random coefficients: The unbalanced panel data case. Empir. Econ. 2014, 47, 451–468. [Google Scholar] [CrossRef]
- Kotzampasakis, M.; Woerdman, E. Linking the EU ETS with California’s Cap-and-Trade Program: A law and economics assessment. Cent. Eur. Rev. Econ. Manag. 2020, 4, 9–45. [Google Scholar]
- Wakabayashi, M.; Kimura, O. The impact of the Tokyo Metropolitan Emissions Trading Scheme on reducing greenhouse gas emissions: Findings from a facility-based study. Clim. Policy 2018, 18, 1028–1043. [Google Scholar] [CrossRef]
- Wang, P.; Dai, H.C.; Ren, S.Y.; Zhao, D.Q.; Masui, T. Achieving Copenhagen target through carbon emission trading: Economic impacts assessment in Guangdong Province of China. Energy 2015, 79, 212–227. [Google Scholar] [CrossRef]
- Rhafes, M.Y.; Moussaoui, O.; Raboaca, M.S. Machine learning models in renewable energy forecasting: A systematic literature review. Indones. J. Electr. Eng. Comput. Sci. 2025, 37, 1874–1886. [Google Scholar] [CrossRef]
- Anupama, G.; Kesava Rao, V.V.S. Some objective methods for determining relative importance of financial ratios. Int. J. Manag. 2020, 10, 2019. [Google Scholar] [CrossRef]
- Sun, Y.; Yang, Y.; Xiao, K. Leverage influence Chinese commercial banks and financial factors analysis based on artificial neural network research. In Proceedings of the 2021 6th International Symposium on Computer and Information Processing Technology (ISCIPT), Changsha, China, 11–13 June 2021; IEEE: Piscataway, NJ, USA, 2021; pp. 349–353. [Google Scholar]
- Alrawashdeh, K.; Purdy, C. Fast activation function approach for deep learning based online anomaly intrusion detection. In Proceedings of the 2018 IEEE 4th International Conference on Big Data Security on Cloud (BigDataSecurity), IEEE International Conference on High Performance and Smart Computing,(HPSC) and IEEE International Conference on Intelligent Data and Security (IDS), Omaha, NE, USA, 3–5 May 2018; IEEE: Piscataway, NJ, USA, 2018; pp. 5–13. [Google Scholar]
- Tao, S.; Wu, X.; Fang, K.; Lin, D. Identifying drivers of county-level industrial carbon intensity by a generic machine learning framework. J. Clean. Prod. 2024, 454, 142276. [Google Scholar] [CrossRef]
- Nuţă, F.M.; Nuţă, A.C.; Zamfir, C.G.; Petrea, S.M.; Munteanu, D.; Cristea, D.S. National carbon accounting—Analyzing the impact of urbanization and energy-related factors upon CO2 emissions in central–eastern European countries by using machine learning algorithms and panel data analysis. Energies 2021, 14, 2775. [Google Scholar] [CrossRef]
- Wang, W.; Zhou, S.; Li, D.; Wang, Y.; Liu, X. Disentangling the non-linear relationships and interaction effects of urban digital transformation on carbon emission intensity. Urban Clim. 2025, 59, 102283. [Google Scholar] [CrossRef]
- Yu, X.; Xu, Y.; Zhang, J.; Sun, Y. The synergy green innovation effect of green innovation subsidies and carbon taxes. Sustainability 2022, 14, 3453. [Google Scholar] [CrossRef]
- Huang, Y. Government subsidies and corporate disclosure. J. Account. Econ. 2022, 74, 101480. [Google Scholar] [CrossRef]
- Li, Z.; Zheng, C.; Liu, A.; Yang, Y.; Yuan, X. Environmental taxes, green subsidies, and cleaner production willingness: Evidence from China’s publicly traded companies. Technol. Forecast. Soc. Change 2022, 183, 121906. [Google Scholar] [CrossRef]
- Khosroshahi, H.; Dimitrov, S.; Hejazi, S.R. Pricing, greening, and transparency decisions considering the impact of government subsidies and CSR behavior in supply chain decisions. J. Retail. Consum. Serv. 2021, 60, 102485. [Google Scholar] [CrossRef]
- Xu, G.; Yang, H.; Schwarz, P. Predicting China’s carbon intensity through 2050: An integrated analysis method. Clim. Dev. 2023, 15, 292–303. [Google Scholar] [CrossRef]
- Saarela, M.; Jauhiainen, S. Comparison of feature importance measures as explanations for classification models. SN Appl. Sci. 2021, 3, 272. [Google Scholar] [CrossRef]
- Lipovetsky, S.; Conklin, W.M. Predictor relative importance and matching regression parameters. J. Appl. Stat. 2015, 42, 1017–1031. [Google Scholar] [CrossRef]
- Liu, B.; Song, C.; Lai, M.; Chen, J.; Wang, Y.; Feng, Z. Deep decarbonization potential and implementation path under provincial differences in China’s fleet electrification. Sci. Total Environ. 2024, 946, 174271. [Google Scholar] [CrossRef]
- Biecek, P.; Burzykowski, T. Explanatory Model Analysis: Explore, Explain, and Examine Predictive Models; Chapman and Hall/CRC: Boca Raton, FL, USA, 2021. [Google Scholar]
| Disclaimer/Publisher’s Note: The statements, opinions and data contained in all publications are solely those of the individual author(s) and contributor(s) and not of MDPI and/or the editor(s). MDPI and/or the editor(s) disclaim responsibility for any injury to people or property resulting from any ideas, methods, instructions or products referred to in the content. |
© 2025 by the authors. Licensee MDPI, Basel, Switzerland. This article is an open access article distributed under the terms and conditions of the Creative Commons Attribution (CC BY) license (https://creativecommons.org/licenses/by/4.0/).


