Article

Assessing Energy Consumption and Treatment Efficiency Correlation: The Case of the Metamorphosis Wastewater Treatment Plant in Attica, Greece

by
Nikolaos Tsalas
1,2,
Spyridon K. Golfinopoulos
1,* and
Stylianos Samios
2
1
Department of Financial and Management Engineering, School of Engineering, University of the Aegean, Kountourioti 41, GR-82132 Chios, Greece
2
Research and Development Department, Athens Water Supply and Sewerage Company S.A (EYDAP), 156 Oropou Str., GR-11146 Athens, Greece
*
Author to whom correspondence should be addressed.
Urban Sci. 2025, 9(6), 201; https://doi.org/10.3390/urbansci9060201
Submission received: 29 March 2025 / Revised: 22 May 2025 / Accepted: 26 May 2025 / Published: 2 June 2025
(This article belongs to the Special Issue Sustainable Energy Management and Planning in Urban Areas)

Abstract

:
Wastewater treatment plants (WWTPs) are crucial for environmental protection and public health; however, they are among the most energy-intensive facilities in the water sector. This study examines the correlation between energy consumption and treatment efficiency at the Metamorphosis WWTP (MWWTP) in Attica, Greece, during the years 2022 and 2023. By analyzing influent and effluent characteristics, energy consumption patterns, and the removal efficiencies of key pollutants—Chemical Oxygen Demand (COD), Biochemical Oxygen Demand (BOD5), and Suspended Solids (SS)—this research provides valuable insights into optimizing wastewater treatment operations. The findings reveal that, despite seasonal variations and fluctuations in influent composition, the facility consistently achieved high pollutant removal rates while maintaining stable energy consumption. The influent BOD5 increased from 992.8 mg L−1 in 2022 to 1122.3 mg L−1 in 2023. COD rose from 1925.4 mg L−1 to 2594.4 mg L−1, SS from 1280.8 mg L−1 to 1421.2 mg L−1, and total phosphorus from 14.2 mg L−1 to 17.0 mg L−1. Effluent concentrations remained consistently low, with BOD5 at 6.1 mg L−1 in 2022 and 4.7 mg L−1 in 2023; COD at 23.8 mg L−1 and 25.2 mg L−1, respectively; total nitrogen at 20.2 mg L−1 and 16.7 mg L−1; total phosphorus at 2.4 mg L−1 and 2.6 mg L−1; and SS at 2.4 mg L−1 and 3.5 mg L−1. These results indicate removal efficiencies exceeding 90%. Energy consumption remained stable, recorded at 13,044.9 kWh (0.593 kWh m−3 influent) in 2022 and 13,126.1 kWh (0.598 kWh m−3 influent) in 2023. These results highlight the importance of integrating energy-efficient strategies and renewable energy solutions to enhance wastewater treatment plant (WWTP) sustainability. This study contributes to ongoing efforts to improve energy optimization in wastewater treatment, supporting global initiatives for carbon footprint reduction and advancing the principles of a circular economy.

1. Introduction

Wastewater treatment plants (WWTPs) play a crucial role in safeguarding public health and protecting the environment. However, they are also significant energy consumers, with the water sector accounting for approximately 4% of global electricity consumption and wastewater treatment alone representing roughly a quarter of this consumption [1]. In the United States, water and wastewater systems are responsible for an estimated 3–4% of the nation’s electricity usage [2]. This substantial energy demand has far-reaching implications in the global context of climate change, rising energy costs, and resource scarcity. The energy-intensive nature of WWTPs contributes to greenhouse gas emissions, further exacerbating climate change. Additionally, the financial burden of energy expenses can constitute a significant portion of WWTP operating costs, making energy efficiency a critical concern. Moreover, as global resources become increasingly scarce, the high energy consumption of WWTPs highlights the need for sustainable practices to ensure the long-term viability of water treatment infrastructure [3,4,5,6]. The energy-intensive processes within WWTPs, such as aeration, sludge treatment, and pumping, are significant contributors to greenhouse gas (GHG) emissions, primarily due to their reliance on fossil fuel-based electricity. Studies have quantified the carbon footprint of these facilities, highlighting the need for improved energy efficiency to mitigate their environmental impact. For instance, one study constructed a firm-level emission inventory for WWTPs, detailing emissions of CH4, N2O, and CO2 from various wastewater treatment processes [7]. Additionally, research has evaluated the carbon emissions and energy consumption of typical wastewater treatment processes in China, emphasizing the urgency of addressing GHG production in the wastewater treatment industry within the context of carbon neutrality [8]. Furthermore, another study examined the major on-site GHG emissions generated from biological wastewater treatment, sludge treatment, and biogas processes, underscoring the environmental implications of these energy-intensive operations [9,10,11,12,13]. Improving energy efficiency in WWTPs is essential to reduce their carbon footprint and align with international climate goals, such as the Paris Agreement [14]. Implementing energy-efficient technologies and optimizing operational processes can significantly decrease GHG emissions from these facilities, contributing to global efforts in combating climate change [15].
Moreover, the rising cost of energy places significant financial pressure on the operation of WWTPs, particularly in developing and middle-income countries, where energy infrastructure may be less reliable. Energy expenses can account for up to 30% of the total operating costs of a WWTP, making optimization not only an environmental priority but also an economic imperative [16,17].
Resource scarcity, particularly in water and energy, underscores the critical need for energy-efficient WWTPs. By incorporating renewable energy sources, such as biogas generated through anaerobic digestion, and adopting energy recovery technologies, WWTPs can transition from being energy consumers to achieving energy neutrality or even becoming energy-positive facilities [18]. This transformation aligns with the principles of a circular economy, which emphasizes resource reuse and waste minimization [19,20,21]. Moreover, energy optimization in WWTPs is essential for enhancing resilience to climate change. Extreme weather events, rising temperatures, and increasing water scarcity place additional pressures on treatment facilities, making efficient energy management critical for ensuring their long-term sustainability and operational reliability. This represents a multidimensional challenge that encompasses environmental, economic, and social objectives. By reducing energy consumption and GHG emissions while simultaneously lowering operating costs, optimized WWTPs contribute to global sustainability goals and enhance the resilience of critical infrastructure in an increasingly resource-constrained world [22,23,24].
The main objective of this study is to examine the correlation between energy consumption and treatment efficiency in a full-scale WWTP. By analyzing operational data from the Metamorphosis facility for 2022 and 2023, the research aims to identify performance trends and explore opportunities for energy optimization without compromising regulatory compliance.

2. Materials and Methods

The methodology involved a systematic analysis of data collected from the Metamorphosis WWTP over the designated periods in 2022 and 2023. The study correlated total energy consumption (kWh) with removal efficiencies (%) of key wastewater quality parameters, including COD, BOD5, and SS. Laboratory data from influent and effluent characteristics were sourced from a dedicated wastewater database managed by the Ministry of Environment and Energy [25].
To achieve these goals, the study is structured around the following key objectives:
  • Assess energy consumption patterns at the Metamorphosis WWTP by evaluating total energy use and its variations across different operational periods in 2022 and 2023.
  • Examine treatment efficiency by analyzing the removal rates of key wastewater quality parameters—including BOD5, COD, and TSS—in relation to energy consumption.
  • Compare annual performance trends to identify potential factors influencing changes in energy use and treatment outcomes between 2022 and 2023.
  • Investigate the impact of influent characteristics on energy requirements and pollutant removal efficiency, taking into account seasonal and operational variations.
  • Explore additional factors influencing energy demand, such as operational adjustments, climatic conditions, and variations in wastewater composition, to better understand the drivers of energy consumption in WWTPs.
  • Identify opportunities for energy optimization by evaluating operational strategies and technologies that could enhance efficiency while maintaining compliance with environmental and regulatory standards.
By addressing these objectives, this study offers valuable insights into the complex interplay between energy consumption and wastewater treatment efficiency. The findings contribute to a deeper understanding of energy dynamics in WWTPs, supporting efforts to optimize operations, reduce costs and enhance sustainability in wastewater management.
Energy consumption metrics were obtained directly from the Athens Water Supply and Sewerage Company S.A. (EYDAP). Removal efficiencies were calculated by comparing influent and effluent concentrations using standard wastewater treatment equations. To identify trends, correlations, and potential insights, statistical analysis and graphical representation tools were employed. Two schematic diagrams—one illustrating the process flow of the MWWTP and the other showing the distribution of energy consumption across treatment stages—were created using the online diagramming tool Draw.io [26]. The integration of precise monitoring techniques and robust analytical methods ensured the reliability and accuracy of the results, which serve as the foundation for evaluating the plant’s performance and energy efficiency.
To evaluate the relationships between influent characteristics, effluent quality, and energy consumption, statistical calculations were conducted using Microsoft Excel 2007. The analysis included the computation of mean values and standard deviations for key parameters. Furthermore, the removal efficiency (%) for each parameter was determined using the following formula:
Removal efficiency (%) = ((Influent-Effluent)/Influent) × 100
where influent and effluent refer to the respective concentrations of each parameter before and after treatment.
To visualize correlations and trends, XY scatter plots were generated using the “Scatter with Smooth Lines and Markers” format in Microsoft Excel. This graphical approach enabled the identification of potential relationships between pollutant removal efficiency and energy consumption, offering valuable insights into the plant’s operational performance.

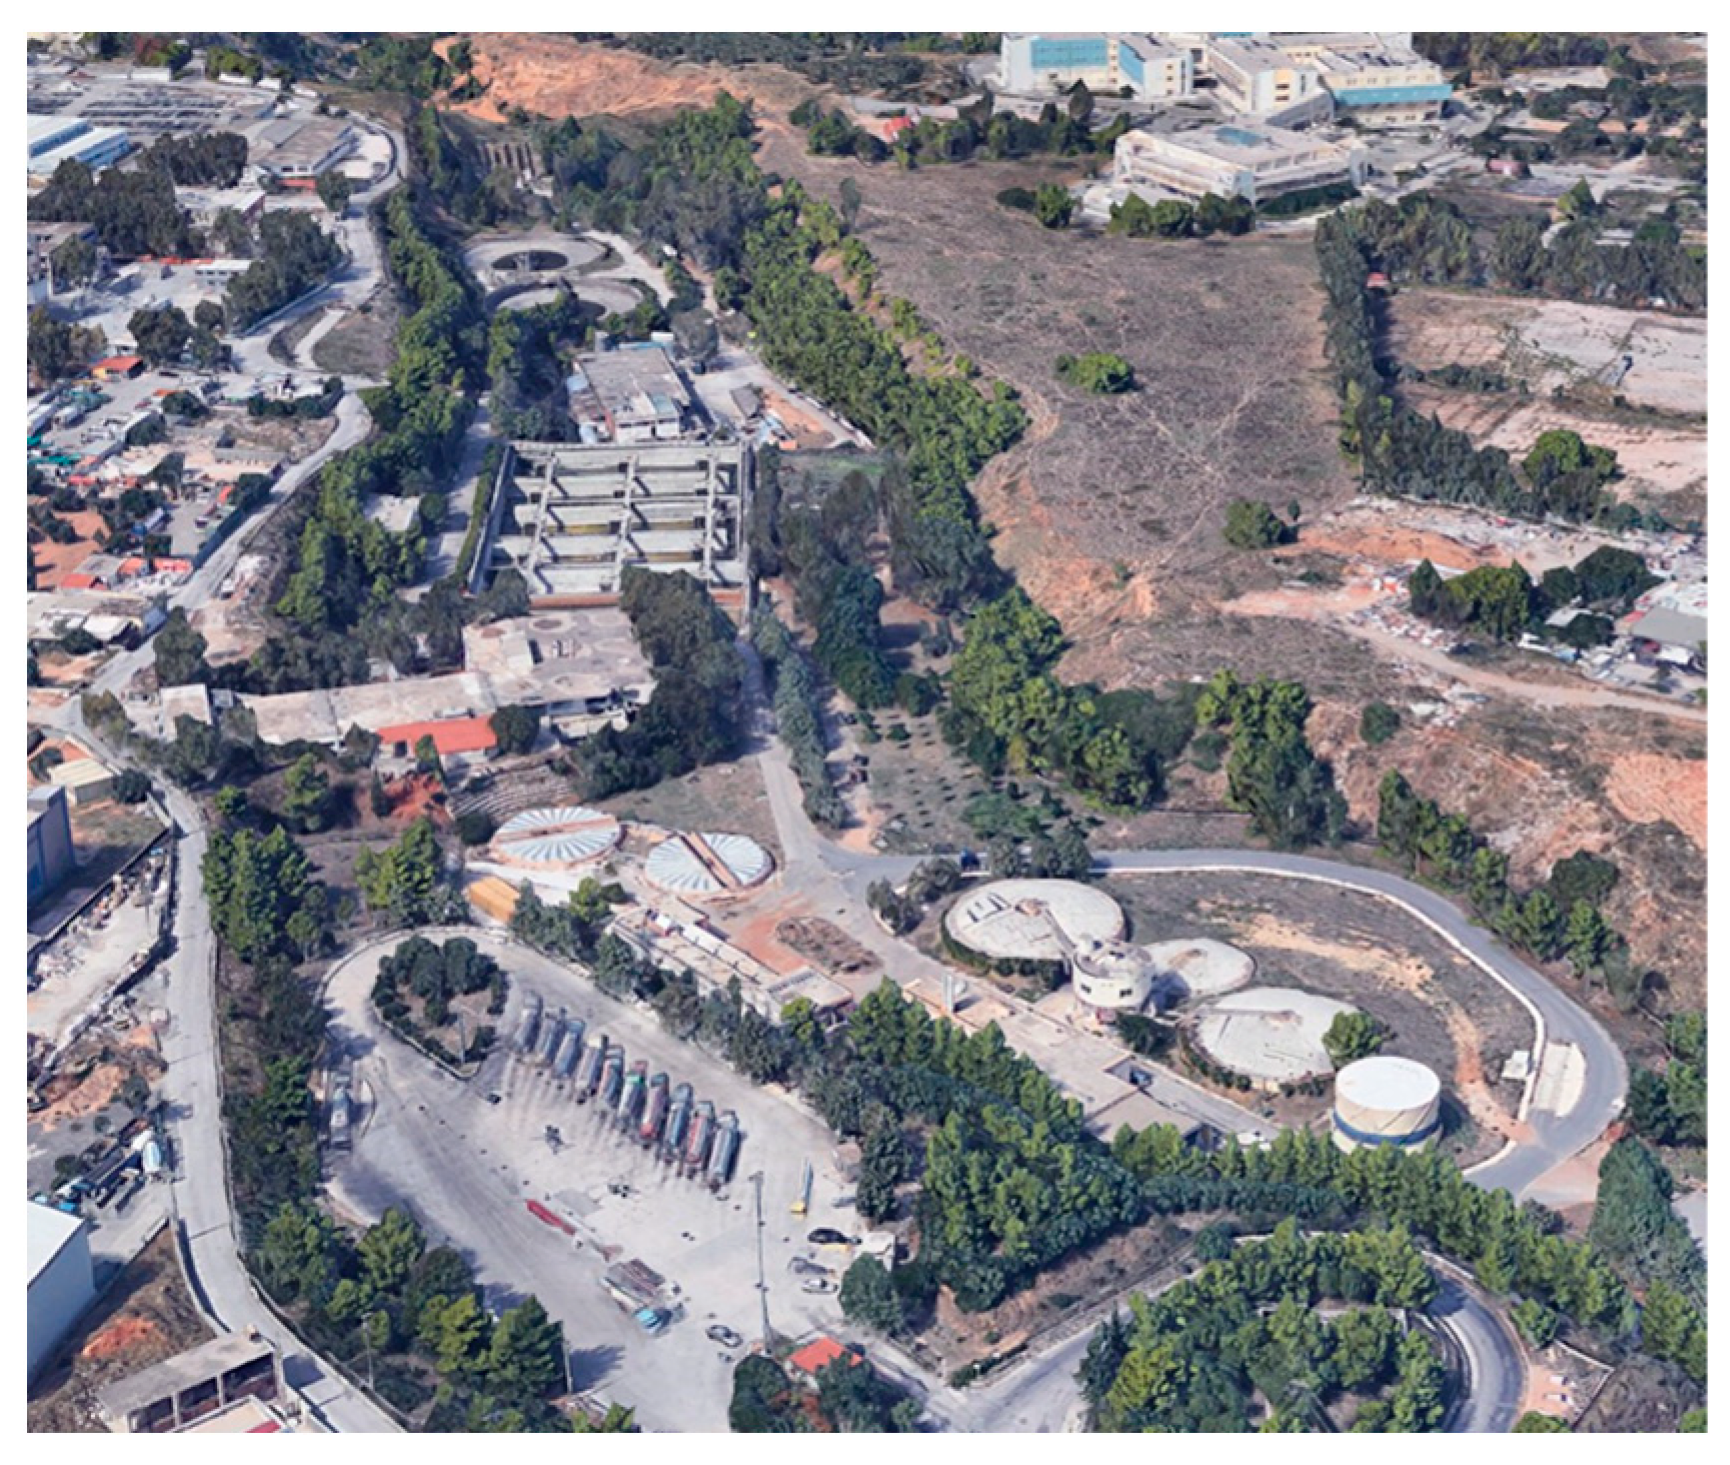
Metamorphosis Wastewater and Septic Sewage Treatment Plant

MWWTP is the only facility in Attica Prefecture capable of receiving and treating septic sewage from areas without a sewerage system. Fully operational since 1986, the plant also treats municipal wastewater from certain northern suburbs in the Attica region (Figure 1) [27].
The plant is designed to handle 24,000 m3 d−1 of septic sewage and 20,000 m3 d−1 of municipal wastewater, with a total organic load capacity of 30,470 kg dBOD−1, equivalent to serving 500,000 inhabitants. Recent operational data indicate that approximately 700 trucks discharge septic sewage into the plant daily, corresponding to a flow of about 11,000 m3 d−1 of septic sewage and 10,000 m3 d−1 of municipal wastewater. The plant operates with an efficiency exceeding 97%.
The treatment (Figure 2) begins with a shared pretreatment stage, where both streams pass through screening units and an aerated grit chamber within the same facility. Although the streams are treated in parallel, they remain physically separated to prevent mixing. Coarse solids are removed via screens with 25 mm and 10 mm openings, followed by grit removal in a 300 m3 aerated chamber, equipped with three blowers and 65 diffusion nozzles. Septic wastewater undergoes additional treatment with ferrous sulfate for sulfide removal, along with lime dosing to enhance flocculation. Screenings, grit, and floatables are collected and transported to licensed disposal facilities.
Primary treatment is conducted in separate sedimentation tanks designed according to the type of wastewater. Septic sewage is processed in two circular covered tanks (Ø20 m, total volume 2700 m3), while municipal wastewater is treated in two rectangular tanks (10 × 54 m, 2.8 m depth), which also receive excess biological sludge. Sludge from both systems is transferred to anaerobic digestion through dedicated pumping systems.
Secondary treatment involves biological processing in a large aeration tank (90 × 54 m, 4.35 m depth, total volume 21,000 m3). Aeration is provided by 15 surface aerators (55 kW each) and supported by 6 submersible mixers. Dissolved oxygen levels are continuously monitored to optimize aeration efficiency. The mixed liquor then flows by gravity into two circular secondary sedimentation tanks (Ø42 m, 4570 m3 each), where solid–liquid separation takes place. Return sludge is recirculated to the aeration tank, while excess sludge is conveyed to the digesters.
Disinfection is carried out after clarification through chlorination using sodium hypochlorite, dosed from a 23 m3 preparation tank. The chlorination basin (60 × 3.4 × 2 m, total volume 1600 m3) comprises four canals and ensures effective pathogen removal prior to discharge or reuse. Treated effluent may be reused internally following filtration through sand filters.
Sludge treatment involves the anaerobic digestion of sludge generated from both the primary and secondary treatment stages. Two primary digesters (7900 m3 each) and one secondary digester (3000 m3) operate at 35 °C, maintained by biogas-fueled boilers and heat exchangers. The secondary digester functions as a buffer storage tank for the dewatering phase. Biogas produced during digestion is used to support internal energy demands, with any surplus stored in a 1000 m3 gas holder.
Dewatering is performed using four belt filter presses, yielding sludge with 25–28% dry solids. A polymer dose is applied at a rate of 4 kg per ton of dry solids. The dewatering process is housed in a closed facility equipped with belt-cleaning systems using industrial water. Filtrates are recycled back to the primary sedimentation stage of the septic stream. The dewatered sludge is then conveyed to a covered loading area and transported to Psyttalia WWTP for thermal drying.
Figure 3 illustrates the indicative relative contribution of each treatment stage to the total energy consumption at the Metamorphosis WWTP. As is typical in activated sludge systems, aeration is the most energy-intensive process, accounting for approximately 48% of total energy use. Sludge treatment, including both digestion and dewatering, follows at 14.4%, reflecting the thermal and mechanical energy demands of these operations. Chlorination contributes around 10.9% due to the continuous need for disinfection. Pretreatment processes consume approximately 9.2%, while the activated sludge pumping station accounts for roughly 8.7%, underscoring the energy requirements of internal recirculation. In comparison, secondary sedimentation (2.6%) and primary sedimentation (1.3%) require significantly less energy, as these stages rely primarily on gravity. The remaining 4.9% is attributed to auxiliary systems, including lighting, ventilation, and administrative operations. It is important to note that these values are representative estimates derived from site-specific measurements and operational conditions. Actual energy distributions may vary depending on the plant design, influent characteristics, and operational strategies.
The flowchart presented in Figure 4 delineates the methodological framework employed in this study, highlighting the essential stages of data collection, processing, analysis, and interpretation. This structured approach facilitates a systematic examination of both influent and effluent characteristics, energy consumption, and statistical correlations within the wastewater treatment process. The methodology commences with the data collection phase, during which water quality parameters for both influent and effluent, alongside energy consumption data, are systematically gathered from pertinent monitoring sources. This initial phase is crucial for ensuring the availability of comprehensive datasets, which are pivotal for subsequent analytical processes.
Following the acquisition of data, the subsequent phase of data processing and calculations encompasses several analytical steps, including the following:
  • Influent and effluent analysis, which involves a comprehensive examination of variations in water quality parameters across different treatment stages.
  • Removal efficiency calculations. This analysis quantifies the effectiveness of various treatment processes in diminishing pollutant concentrations.
  • Energy consumption analysis, evaluating the energy requirements associated with the operation of the treatment plant.
  • Statistical analysis. This involves applying statistical methods to identify and evaluate correlations and trends that influence both energy consumption and treatment efficiency.
The final stage, data visualization and interpretation, synthesizes findings from the preceding phases, enabling a comparative analysis between the years 2022 and 2023. This phase encompasses the following:
  • Graphical representation of key metrics, including the creation of visual aids to enhance clarity and understanding of the data.
  • Comparison of annual trends, identifying variations in pollutant removal efficiency and energy consumption over the specified years.
  • Evaluation of influencing factors, providing insights into the parameters that affect energy usage within the treatment facility.
This structured methodology ensures a comprehensive assessment of wastewater treatment performance while highlighting opportunities for optimization in energy efficiency and pollutant removal.

3. Results and Discussion

This section reviews recent advancements (2015–2023) in energy-efficient and resource-recovering wastewater-treatment technologies, including Membrane-Aerated Biofilm Reactors (MABR), anaerobic digestion with Combined Heat and Power (CHP), Microbial Fuel Cells (MFCs), and algae-based systems. These technologies are evaluated in terms of energy consumption, operational efficiency, and environmental impact [29,30,31]. Case studies from the Strass WWT in Austria and Davyhulme WWTP in the UK demonstrate how biogas generation can drive facilities toward energy neutrality. Additionally, the integration of renewable energy sources, such as photovoltaic arrays and water-source heat pumps, highlights significant reductions in dependence on conventional energy [32]. This section also examines the correlation between stricter effluent discharge regulations and rising energy demands, explores energy benchmarking and monitoring methodologies, and analyzes relevant policy frameworks, including the Urban Wastewater Treatment Directive (91/271/EEC) and the Circular Economy Action Plan [33,34]. As summarized in Table 1, these innovations present promising pathways for WWTPs—including the MWWTP—to improve operational efficiency, reduce costs and carbon emissions, and enhance resilience in pursuit of carbon neutrality.

3.1. Latest Developments in Energy-Efficient Technologies for Wastewater Treatment

Recent advancements in wastewater treatment technologies (2015–2023) have increasingly focused on energy efficiency, sustainability, and resource recovery employing a range of innovative approaches (Table 1). Technologies such as the MABR and Advanced Aeration Control have demonstrated substantial energy savings by enhancing oxygen transfer and optimizing aeration processes. For example, MABR technology has achieved up to 40% in reductions in electricity consumption, while advanced aeration systems have reported energy savings of up to 30% in pilot-scale implementations [29,35].
Anaerobic digestion, when coupled with CHP systems, has proved highly effective in driving plants toward energy neutrality. A prime example is the Strass WWTP, Strass im Zillertal in Austria, where organic carbon is converted into biogas for on-site electricity and heat generation. Similarly, at the Davyhulme Plant, Manchester in the UK, biogas energy generation production has been shown to satisfy up to 96% of the plant’s total energy demands [32].
Emerging technologies such as MFCs and algae-based systems [36,37,38] further highlight the potential for resource recovery and nutrient removal. MFCs harness microbial activity to generate electricity directly from wastewater, with reported power densities of up to 60 W m−3. Algae-based systems offer the dual benefits of nutrient recovery and reduced energy demand, thereby enhancing both efficiency and sustainability [31,38,39,40].
Renewable energy integrations are also gaining traction in the wastewater sector. Photovoltaic systems, as implemented in eastern China, and water-source heat pumps, such as those used at the Stockholm WWTP, Stockholm, Sweden, effectively utilize solar and thermal energy to offset conventional energy needs, contributing to lower carbon emissions and cleaner operations [32,41].
In addition, energy recovery from sewage sludge through pyrolysis and gasification is emerging as an efficient strategy to convert waste into syngas, bio-oil, or biochar. The Bekkelaget WWTP, Oslo in Norway is one such example where these processes have delivered meaningful energy savings and reduced the environmental impact [30,39].
Nature-based solutions, including green infrastructure and ecological treatment systems, provide added environmental co-benefits. Constructed wetlands, for instance, not only deliver effective wastewater treatment but also enhance biodiversity and ecosystem services [36,37,38].
Collectively, these advancements underscore the potential of wastewater treatment facilities to operate more sustainably, achieve greater energy efficiency, and advance resource recovery. By integrating these technologies, plants such as MWWTP can move toward carbon neutrality while contributing to broader goals of environmental resilience and circular economy practices.
Table 1. Recent technological developments for sustainable and energy-efficient wastewater treatment.
TechnologyDescriptionApplication/ExampleResultsReference
MABRUtilizes hollow fiber membranes to transfer oxygen directly to biofilms, reducing the need for bubble aeration.No specific examples of installations where MABR technology has been applied are mentioned.40% reduction in electricity consumption, 18% higher energy production.[29,35]
Anaerobic Digestion & CHPOrganic carbon is diverted to anaerobic digestion, producing biogas, which is used in CHP systems.Strass Plant, Strass im Zillertal, Austria.Biogas production at 1.6 kJ g−1 COD removed; energy neutrality achieved.[29,30,38,39]
Enhanced Primary Treatment (EPT)Utilizes rotating belt sieves to remove organic matter, enhancing flexibility in nutrient removal processes.Not widely implemented; potential in pilot projects.Improves efficiency in organics removal and reduces sludge load.[29,42,43]
Alternate Nitrogen Removal PathwaysUtilizes techniques such as nitrite shunt and anammox to reduce oxygen demand for nitrogen removal.Applied mainly in pilot studies and side-stream treatments for nitrogen-rich wastewater; however, it is not yet widely implemented in full-scale municipal WWTPs.Partial nitrification–anammox systems have demonstrated a 47% reduction in energy consumption for nitrogen removal, with nitrogen removal efficiencies reaching up to 90% in certain configurations.[29,38]
MFCsMicrobial systems harness microbes to generate electricity directly from wastewater, offering an innovative approach to energy recovery.Pilot-scale implementation (1000 L) has shown effectiveness, reaching a 7–60 W m−3 power density with significant COD removal.Demonstrated power density of up to 7–60 W m−3 and up to 62.93 mW m−2 in hybrid MFC systems, with an 18% increase in performance.[31,38,39,40]
Algae-based TechnologyUtilizes microalgae for nutrient removal and bioenergy production, integrating wastewater treatment with carbon sequestration.Pilot trials in photobioreactors and open pond systems. Example: 70% COD reduction in PBR using Chlorella species; other trials showed nutrient removal >90%.Energy consumption reduced to 0.2 kWh m−3 (50% lower than traditional methods); high Energy Return on Investment (EROI) of 2.1–2.4, with significant nutrient uptake.[36,37,38]
Biogas Energy GenerationProduces biogas from wastewater decomposition, providing energy autonomy for WWTPs.Davyhulme plant, Manchester, UK.Covers up to 96% of the plant’s energy needs.[32]
Photovoltaic Energy GenerationSolar panels generate electricity to cover the energy demands of WWTPs.Plant in eastern China with 800,000 tons/day capacity.Generates 1.04 × 10⁷ kWh, covering 84% of energy needs.[32,41]
Water Source Heat Pump TechnologyExtracts thermal energy from wastewater for heating and cooling purposes.Stockholm WWTP, Stockholm, Sweden.Produces 5.97 × 10⁸ kWh annually, reducing energy consumption.[32,41]
Green Infrastructure & Ecologically Advanced Treatment TechnologiesEco-friendly treatment methods, such as constructed wetlands, provide effective wastewater treatment while simultaneously enhancing biodiversity.Various applications in Europe and North America.Low cost and high efficiency, with additional environmental benefits.[32,41]
Advanced Aeration ControlUtilizes sensors and automation to optimize aeration, the most energy-consuming process in WWTPs.In use at WWTPs in Germany and Japan Energy consumption for aeration reduced by 20–30%.[42,44]
Energy Benchmarking and MonitoringCompares energy use with benchmarks to identify inefficiencies and set energy efficiency goals.Implemented in Canadian and Australian WWTPs.Significant energy reductions achieved through targeted interventions.[44]
Energy Recovery from Sewage SludgeConverts sludge into syngas, bio-oil, or biochar using processes like pyrolysis and gasification.Bekkelaget WWTP, Oslo, Norway.Saved approximately 40,000–94,000 kWh annually.[30,39]
Recent studies highlight the urgent need to modernize wastewater treatment plants (WWTPs) to improve energy efficiency and reduce operational costs. Innovative technologies—such as anaerobic digestion, microbial fuel cells, and membrane bioreactors—offer the dual advantage of effective treatment and sustainable energy generation [45]. The integration of renewable energy sources, such as solar power and biogas, into WWTPs has shown significant environmental and economic benefits [46]. Moreover, the adoption of smart control systems that leverage real-time data and machine learning algorithms has proven effective in optimizing energy consumption, resulting in substantial cost savings without compromising treatment performance [47,48]. These advancements collectively highlight the urgent need for wastewater treatment plants (WWTPs) to transition toward more sustainable and cost-effective operations. In an era of rising energy costs and increasingly stringent environmental regulations, modernizing wastewater infrastructure is not merely advantageous—it is essential for ensuring long-term financial viability and operational resilience.

3.2. Reducing Energy Consumption in WWTPs, a Key Strategy for Lowering the Carbon Footprint

Reducing energy consumption in WWTPs [49] is pivotal to lowering their carbon footprint, as energy-intensive processes within these facilities often rely on fossil fuels, resulting in significant GHG emissions. By implementing energy-efficient technologies and optimizing operations, WWTPs can substantially reduce their energy usage and associated CO2 emissions.
A study assessing the energy consumption and carbon footprint of Greek WWTPs highlighted that these facilities exhibit high energy demands and produce considerable GHG emissions. The research underscores the critical importance of improving energy efficiency to minimize their environmental impact [50]. Furthermore, a case study demonstrated the potential for reducing CO2 emissions from wastewater treatment facilities by integrating renewable energy sources, such as photovoltaics and cogeneration. The study reported a reduction in average monthly CO2 emissions from 68,905 kg to 37,385 kg, illustrating the effectiveness of renewable energy integration in mitigating GHG emissions [51].
Additionally, research on achieving energy neutrality in WWTPs through energy savings and resource recovery highlights energy benchmarking as a powerful tool for optimizing operations. Such measures not only help reduce costs but also significantly lower GHG emissions. The findings suggest that combining energy efficiency improvements with resource recovery strategies can lead to substantial reductions in the carbon footprint of wastewater treatment processes [52].
In summary, reducing energy consumption in WWTPs through the adoption of energy-efficient technologies, the optimization of operational processes, and integration of renewable energy sources directly contributes to lowering their carbon footprint. These measures not only reduce reliance on fossil fuels but also align with global efforts to combat climate change by decreasing GHG emissions associated with wastewater treatment.

3.3. Impact of Stricter Environmental Regulations on Effluent Quality and Energy Consumption

The enforcement of stricter environmental regulations to improve wastewater effluent quality often necessitates the adoption of advanced treatment technologies, which can significantly increase the energy consumption of WWTPs. Traditional secondary treatment methods, such as activated sludge processes, may no longer suffice to meet tighter limits for parameters like nitrogen, phosphorus, and micropollutants. As a result, facilities are required to implement additional processes, including advanced nutrient removal, tertiary treatment, and disinfection, all of which demand higher energy inputs.
For instance, achieving stricter nitrogen and phosphorus limits often involves energy-intensive processes such as Biological Nutrient Removal (BNR) or chemical precipitation. BNR requires extended aeration phases to facilitate nitrification and denitrification, which can increase aeration energy demand by up to 50% compared to conventional secondary treatment. Similarly, chemical precipitation for phosphorus removal involves the use of coagulants and mixers, further increasing operational energy consumption [53,54].
The inclusion of tertiary treatment processes, such as filtration, ozonation, or ultraviolet (UV) disinfection [55], further amplifies energy demands. These processes are specifically designed to remove fine particulates, pathogens, and micropollutants to meet advanced discharge standards, particularly for sensitive water bodies or reuse applications. For example, UV disinfection systems can constitute a significant portion of the total energy consumption of a WWTP [56,57,58].
Moreover, stricter regulations targeting emerging contaminants, such as pharmaceuticals, microplastics, and endocrine-disrupting compounds, are driving the adoption of advanced oxidation processes (AOPs). While highly effective, these processes are extremely energy-intensive, relying on technologies such as ozone generation and hydrogen peroxide dosing [53,54,55,56,57,58,59].
In addition to the direct energy implications of enhanced treatment processes, indirect energy consumption also increases due to the expanded use of monitoring and control systems to ensure compliance with tighter effluent limits. Automated systems, sensors, and real-time monitoring tools, while essential for precision and regulatory adherence, contribute to the overall energy footprint of the facility [53]. In summary, while stricter effluent quality regulations are essential for safeguarding aquatic ecosystems and public health, they inevitably lead to higher energy consumption in WWTPs. This underscores the importance of developing energy-efficient solutions to balance environmental protection with sustainable operations [32,60].

3.4. The Cost of Energy Consumption in WWTPs and How It Can Impact the Pricing of Water Supply and Wastewater Services

Energy consumption [61,62] constitutes a significant portion of the operational costs in WWTPs, directly influencing the pricing of water and sewerage services. Electricity expenses can account for 25–40% of a WWTP’s total operating costs [63,64]. This substantial energy expenditure is primarily due to processes such as aeration, pumping, and sludge treatment. For instance, secondary treatment plants may consume approximately 1500 to 1700 kWh of electricity to treat one million gallons of sewage [65]. This level of energy consumption translates into significant costs, which are often passed on to consumers through increased water and sewerage rates.
The impact of rising energy costs on water services has been observed globally. In Europe, the recent energy crisis has increased operational costs for water and wastewater utilities, resulting in higher prices for consumers [66]. Similarly, in the United States, variations in energy pricing significantly affect the operational expenses of wastewater treatment facilities [67].
To mitigate the influence of energy costs [68] on service pricing, WWTPs are exploring energy efficiency measures and alternative energy sources. Implementing energy-efficient technologies and optimizing operational processes can lead to substantial cost savings. For example, in Portugal, technological and management strategies have been shown to achieve significant energy savings for wastewater treatment operations [69]. Additionally, integrating renewable energy sources, such as biogas production from sludge digestion, can offset energy expenses and reduce reliance on external power supplies.
In conclusion, the energy consumption costs of WWTPs significantly affect the pricing of water and sewerage services. By adopting energy-efficient technologies and alternative energy sources, utilities can manage operational expenses more effectively, thereby stabilizing or potentially reducing the rates charged to consumers.

3.5. National or European Policies Promoting Sustainable Wastewater Management

At the European level, various policies and legislative frameworks aim to promote the sustainable management of wastewater, focusing on environmental protection, resource efficiency, and public health. A key element of these efforts is the establishment of stringent standards for the collection, treatment, and discharge of urban wastewater to protect the aquatic environment from pollution. These standards often mandate secondary or advanced treatment for wastewater discharge in sensitive areas and set minimum removal efficiencies for parameters such as BOD5, TSS, and nutrients like nitrogen and phosphorus [33].
In addition to these treatment standards, wastewater reuse and resource recovery should be emphasized. Policies promoting the safe reuse of treated wastewater in agriculture help reduce water stress and support the principles of a circular economy [70]. At the national level, countries have aligned their legislation with European directives by implementing specific measures for the collection, treatment, and discharge of urban wastewater. Many nations also incorporate policies to incentivize the adoption of advanced wastewater treatment technologies and the reuse of treated effluent, particularly in regions facing water scarcity [71].
A comprehensive framework for sustainable water management across Europe requires member states to achieve high ecological and chemical standards for all water bodies. This framework has driven significant improvements in wastewater treatment infrastructure and monitoring, addressing cumulative pollution impacts on water resources [72]. National policies often complement these efforts by fostering innovation in water reuse and energy recovery.
In summary, European and national policies collectively encourage sustainable wastewater management by setting regulatory standards, promoting resource efficiency, and supporting advancements in water reuse and energy recovery. These frameworks ensure that WWTPs not only comply with environmental regulations but also contribute to broader sustainability goals.

3.6. Assessment of Energy Consumption and Effluent Quality Performance

Complementing this technological review, the analysis of the operational performance of the MWWTP in Attica offers valuable insights into the relationship between energy consumption and pollutant removal efficiency under real-world conditions. The evaluation focuses on key treatment parameters—BOD5, COD, and TSS—and benchmarks their performance against the regulatory thresholds established by Directive 91/271/EEC (Table 2). The plant’s consistent ability to achieve high removal efficiencies while complying with stringent effluent standards across multiple operational periods highlights the practical effectiveness of its processes. This performance reinforces the value of integrating advanced technologies and energy-optimization strategies into future wastewater management frameworks.
As demonstrated in the following analysis, the plant consistently met and often exceeded these required effluent limits throughout 2022 and 2023. Its operational strategies and robust treatment processes have ensured compliance with stringent environmental regulations, reflecting a strong commitment to sustainable wastewater management.
The subsequent sections provide a detailed analysis of energy consumption in relation to removal efficiencies, emphasizing the plant’s performance in terms of both operational efficiency and regulatory compliance.

3.7. Analysis of Energy Consumption vs. Removal Efficiencies (2023)

The data and accompanying graphs illustrate the relationship between the total energy consumption of the WWTP and the removal efficiencies of key parameters—BOD5, COD, and SS—throughout 2023. The analysis covers three distinct periods: early, mid, and late 2023, highlighting seasonal variations, operational adjustments, and influent load fluctuations.

3.7.1. Early 2023 (January–April 2023)

During the initial months of 2023, energy consumption ranged between approximately 9000 kWh and 15,000 kWh, with moderate fluctuations and occasional spikes reflecting operational demands. Despite these variations, the removal efficiencies for BOD5, COD, and SS consistently exceeded 92% (Figure 5). This stability demonstrates the WWTP’s resilience in maintaining high treatment performance despite variable energy usage.

3.7.2. Mid 2023 (May–August 2023)

During this period, energy consumption fluctuated within a broader range, from 10,000 kWh to 16,000 kWh. Peaks in energy usage likely reflected increased treatment loads, seasonal variations in wastewater composition, or adjustments in operational protocols. Despite these fluctuations, the removal efficiencies for BOD5, COD, and SS remained consistently high, exceeding 90% (Figure 6). This underscores the plant’s ability to adapt to changing conditions while maintaining excellent treatment performance.

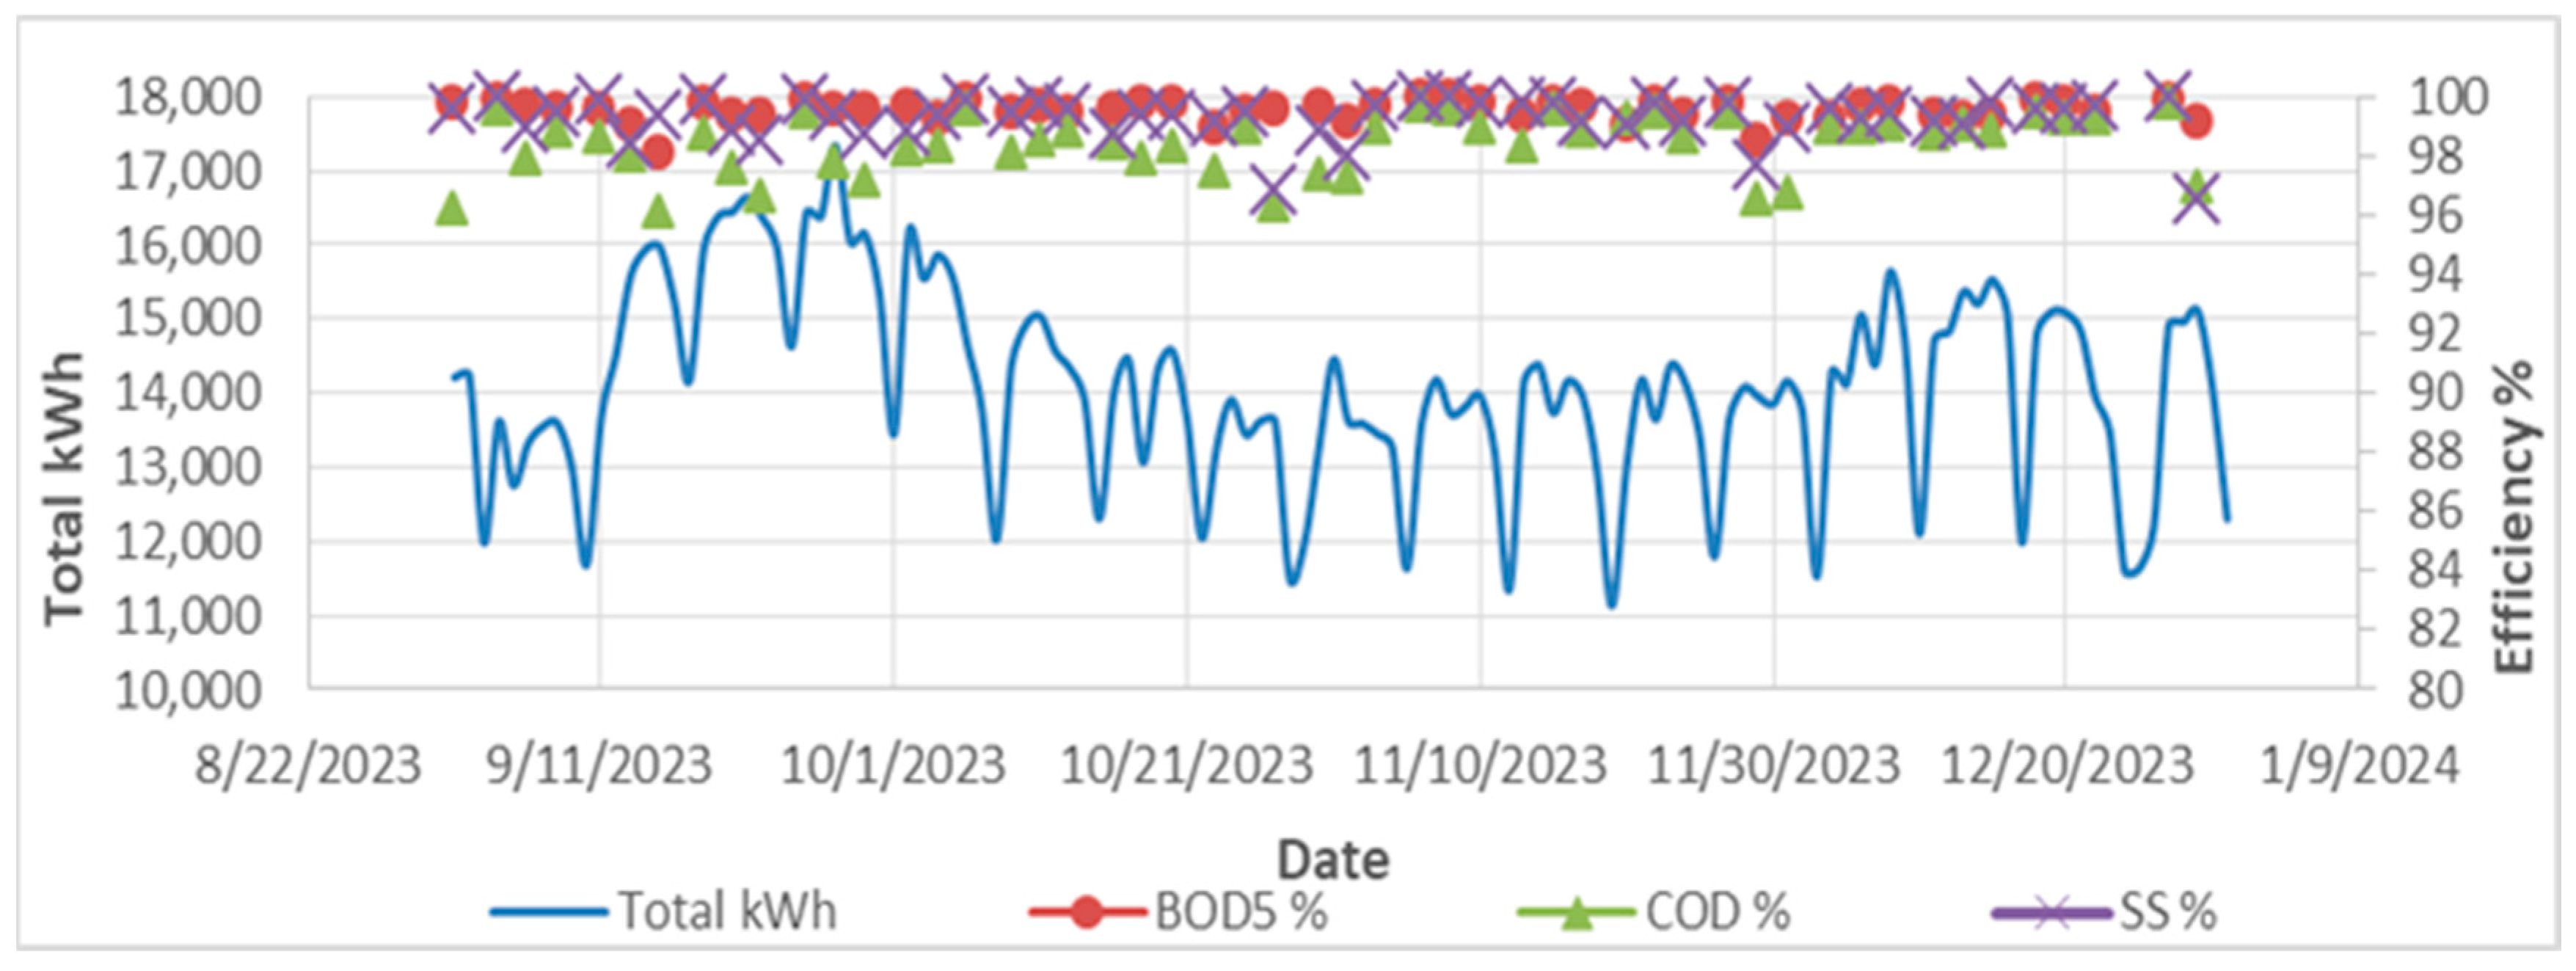
3.7.3. Late 2023 (September–December 2023)

In the final months of 2023, average energy consumption increased, with peaks reaching up to 17,000 kWh. This higher energy usage likely reflected increased influent loads, seasonal factors, or enhanced operational requirements. Despite the elevated energy consumption, the removal efficiencies for BOD5, COD, and SS remained consistently robust, exceeding 95% (Figure 7). This sustained high performance highlights the system’s operational stability and resilience, even under increased demand.

3.7.4. Annual Overview

Throughout 2023, the WWTP consistently achieved high removal efficiencies for BOD5, COD, and SS, regardless of fluctuations in energy consumption. This underscores the robustness of the plant’s process design and operational management. Despite variations in energy usage, the plant-maintained compliance with stringent effluent quality standards, effectively managing both organic and suspended matter loads (Table 3). The reliability of these findings is supported more by a substantial number of samplings conducted throughout the year, particularly for key parameters such as BOD5, COD, and TSS, as detailed in Table 4.

3.8. Analysis of Energy Consumption vs. Removal Efficiencies (2022)

3.8.1. Early 2022 (January–April 2022)

The data shows notable fluctuations in total energy consumption, ranging from approximately 9500 to 16,000 kWh. Despite these variations, the removal efficiencies for BOD5, COD, and SS remained consistently high, staying close to or exceeding 92%, as indicated by their stable trends near the upper limit of the secondary y-axis (Figure 8). This consistency in pollutant removal highlights the robust operational performance of the treatment plant, unaffected by energy consumption fluctuations. Minor dips in energy usage had no discernible adverse impact on removal efficiency during this period.

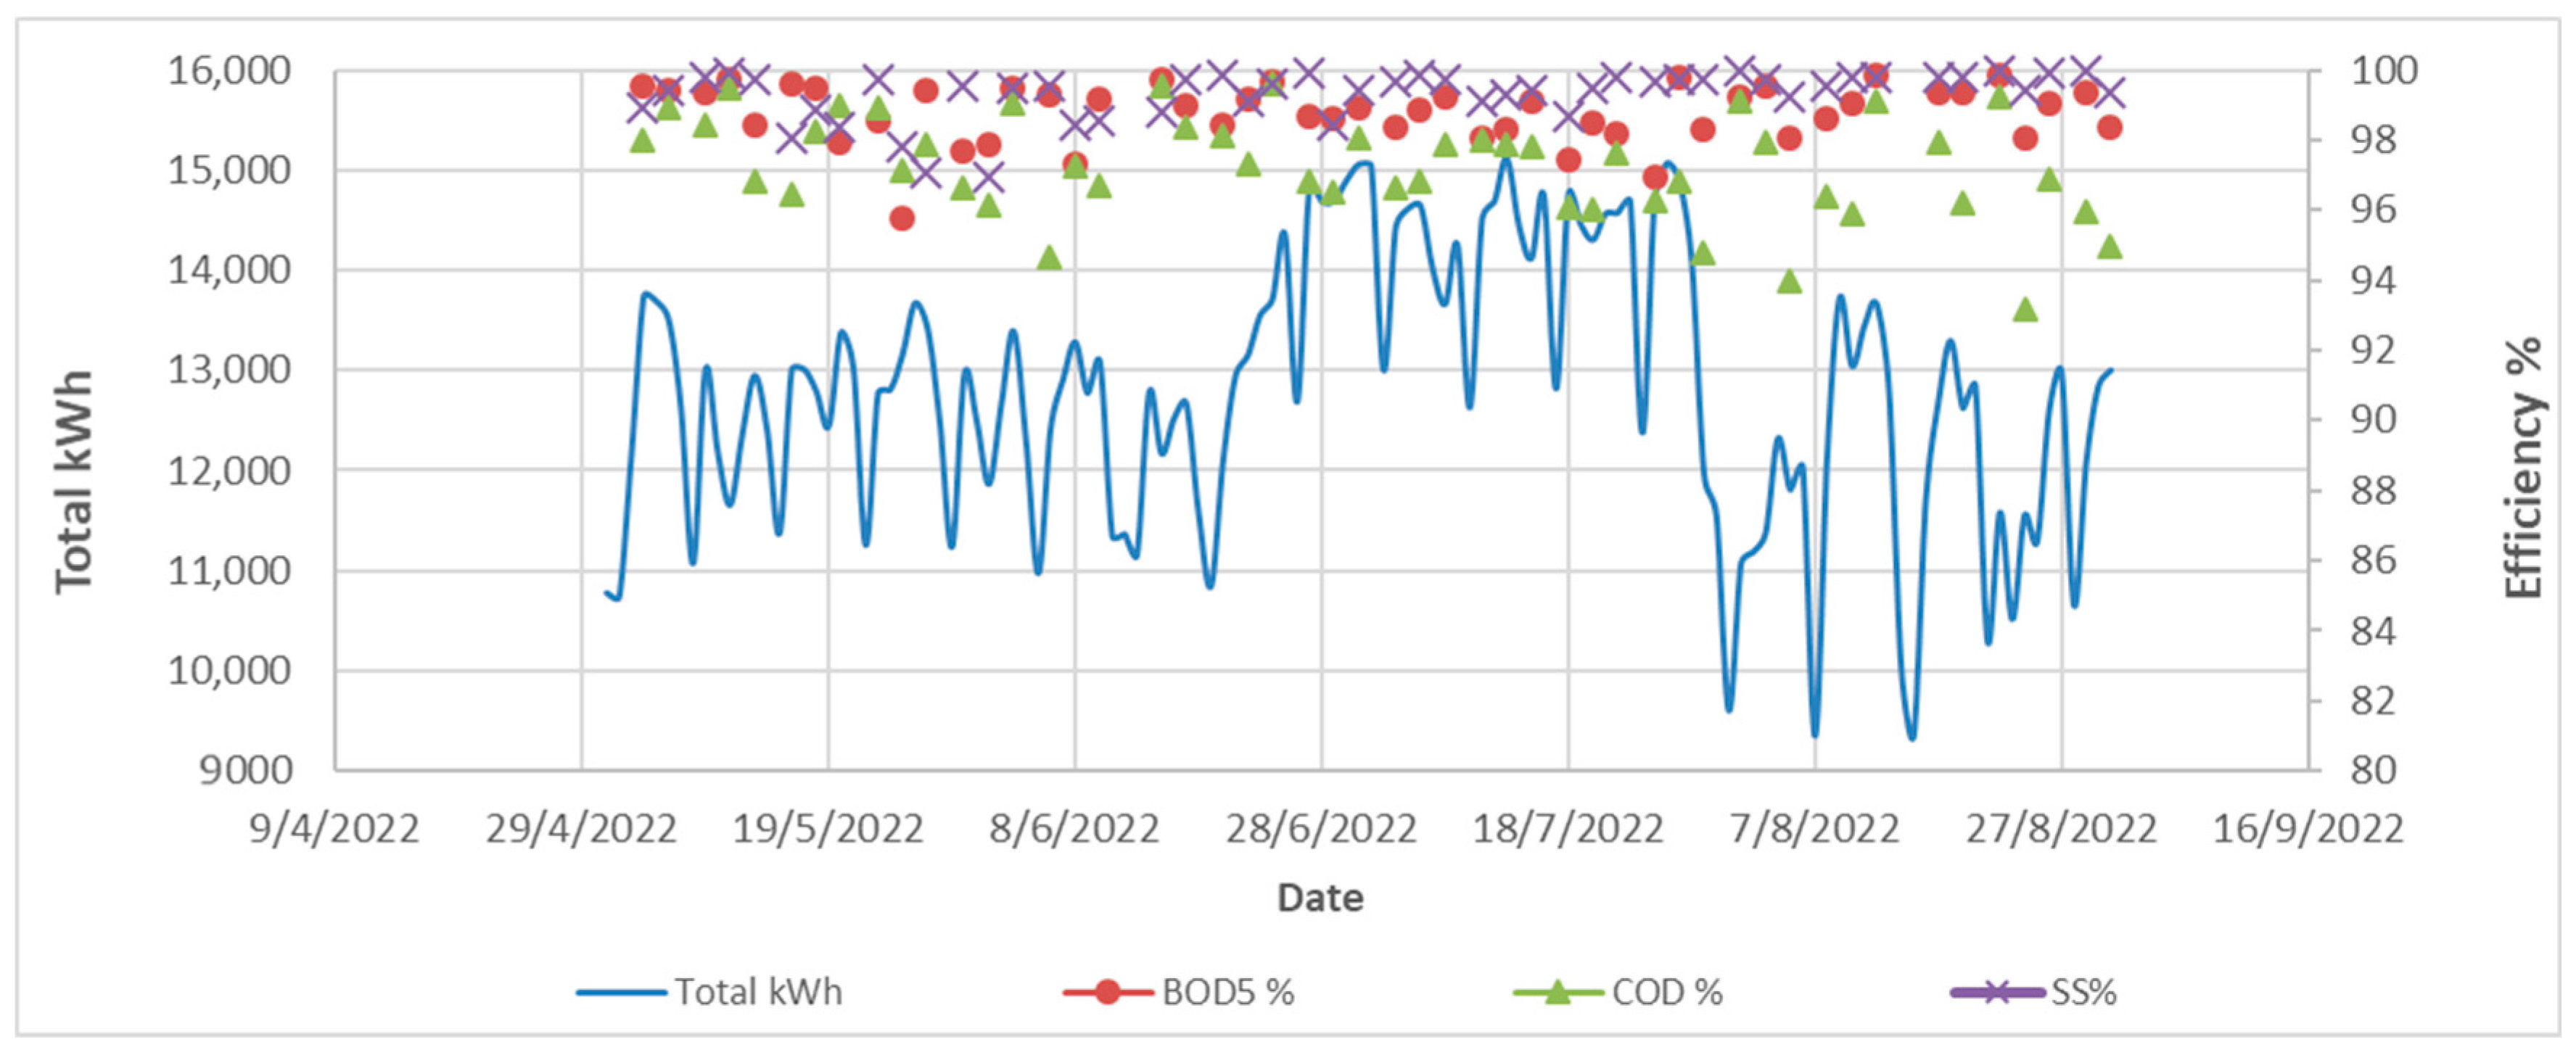
3.8.2. Mid 2022 (May–August 2022)

During this period, energy consumption showed a slight upward trend, peaking near 15,200 kWh by mid-July. The removal efficiencies for BOD5, COD, and SS remained stable, clustering within the 92–100% range (Figure 9). This indicated that the plant’s processes sustained optimal removal efficiency regardless of higher energy inputs. The linearity of efficiency trends reflects consistent system operations, likely supported by effective process monitoring and adjustment mechanisms.

3.8.3. Late 2022 (September–December 2022)

In the final quarter of the year, energy consumption showed greater variability, oscillating between approximately 10,000 and 15,300 kWh. Removal efficiencies for BOD5, COD, and SS remained remarkably stable (Figure 10). This suggests that external factors affecting energy inputs, such as seasonal changes or operational demands, did not significantly impact treatment efficacy. These findings highlight the resilience and adaptability of the treatment processes to varying energy levels.

3.8.4. Overall Assessment for 2022

Across all three time periods, the correlation between total energy consumption and removal efficiencies for BOD5, COD, and SS is not explicitly evident, as the latter metrics remain consistently high regardless of fluctuations in energy usage. This indicates a well-optimized treatment system where energy consumption levels are decoupled from pollutant removal performance (Table 5). Such findings highlight the efficiency of the operational strategies implemented at the plant and provide a benchmark for performance evaluation over subsequent years. The validity of these findings is further supported by the high number of samples collected in 2022, as shown in Table 6, ensuring robust statistical grounding of the results for that year.

3.8.5. Performance and Compliance: 2022 vs. 2023

A comparison of operational performance between 2022 and 2023 at the MWWTP highlights its exceptional ability to achieve high treatment efficiency while maintaining full compliance with regulatory standards.
In 2022, influent parameters showed slightly lower concentrations compared to 2023. For example, total nitrogen (TN) was recorded at 107.1 mg L−1 in 2022, slightly higher than the 106.0 mg L−1 observed in 2023. Total phosphorus (TP) levels increased from 14.2 mg L−1 in 2022 to 17.0 mg L−1 in 2023. Similarly, BOD5 and COD concentrations also rose in 2023, reaching 1122.3 mg L−1 and 2594.4 mg L−1, respectively, compared to 992.8 mg L−1 and 1925.4 mg L−1 in 2022. TSS followed a similar trend, with concentrations increasing to 1421.2 mg/L in 2023 from 1280.8 mg L−1 in 2022. These variations likely reflect dynamic changes in influent composition driven by seasonal or operational factors.
Despite variations in influent quality, the MWWTP consistently delivered excellent effluent quality in both years, demonstrating robust operational performance. Effluent TN levels improved from 20.2 mg L−1 in 2022 to 16.7 mg L−1 in 2023, while TP concentrations remained almost steady at 2.4 and 2.6 mg L−1 in both years. BOD5 concentrations decreased from 6.1 mg L−1 in 2022 to 4.7 mg L−1 in 2023, reflecting the plant’s effective biological treatment processes. In contrast, COD concentrations showed a minor increase from 23.8 mg L−1 in 2022 to 25.2 mg L−1 in 2023, and TSS levels rose slightly from 2.4 mg L−1 in 2022 to 3.5 mg L−1 in 2023. These effluent concentrations consistently met or exceeded the stringent requirements of the European Union’s Directive 91/271/EEC, reaffirming the plant’s commitment to environmental protection and regulatory compliance.
Energy consumption at the MWWTP remained largely stable between 2022 and 2023, averaging 13,044.9 kWh (0.593 kWh m−3 of influent) in 2022 and 13,126.1 kWh (0.598 kWh m−3 of influent) in 2023. The slight increase observed in 2023 is likely due to higher influent loads or operational adjustments made to sustain optimal treatment performance. Notably, the plant consistently achieved high removal efficiencies, exceeding 90% for BOD5, COD, and TSS, despite variations in influent quality.
When benchmarked against national and international data, the MWWTP demonstrates notable energy efficiency. In Greece, a study of 17 WWTPs reported energy consumption values ranging from 0.128 to 2.280 kWh m−3, with an average of 0.903 kWhm−3 [73], indicating that MWWTP operates significantly below the national average in terms of energy consumption. Similarly, data from 204 WWTPs in China’s Taihu basin report an average consumption of 0.458 kWh m−3, with values dropping to 0.33 kWhm−3 for larger plants processing over 50,000 m3 day−1 [74]. In Europe, energy consumption in activated sludge systems typically ranges from 0.15 to 0.7 kWhm−3, with national averages at 0.67 kWhm−3 in Germany, 0.55 kWhm−3 in Italy, and 0.45 kWhm−3 in the USA [21]. These comparisons underscore the MWWTP’s strength nationally and internationally within the wastewater treatment sector. Despite its strong performance, the MWWTP still has opportunities for further energy efficiency enhancements. One key recommendation is to expand the use of variable-frequency drives (VFDs) across all pumping systems, allowing for better adaptation to fluctuating hydraulic loads and reducing unnecessary energy use. In parallel, the integration of PV systems would enable the plant to harness solar energy, decreasing reliance on grid electricity.
Additionally, where hydraulic conditions permit, the installation of a micro-hydropower unit at the treated effluent outfall could provide a supplementary renewable energy source with minimal operational disruption. To support data-driven decision-making and improve transparency, it is also advisable to install dedicated energy meters at major treatment stages—such as aeration, sludge pumping, and digestion—enabling the continuous monitoring and targeted optimization of energy-intensive processes.
Given that aeration consumes the most energy, the development of a digital simulation model for the aeration process could assist in identifying optimal operation scenarios, improving both energy efficiency and process adaptability. Furthermore, implementing a CHP system using biogas from anaerobic digestion could significantly enhance the plant’s energy autonomy while providing a renewable source of heat for process needs.
The MWWTP’s consistently high performance under variable influent conditions underscores the importance of operational excellence and effective process management. These findings also suggest that policymakers could play a vital role by promoting stage-specific energy monitoring and offering incentives for the adoption of advanced technologies, such as VFDs, PV systems, and CHP. Overall, the plant serves as a model for combining environmental compliance with energy sustainability, reflecting positively on its operational team and offering guidance for future wastewater management policy frameworks.
In summary, the MWWTP exemplifies excellence in wastewater treatment, demonstrating its ability to adapt to changing influent conditions while consistently delivering effluent quality that meets or exceeds legislative requirements. These accomplishments underscore the plant’s critical role in safeguarding public health and protecting the environment through sustainable and efficient operations.

4. Conclusions

This study examined the relationship between energy consumption and treatment efficiency at the Metamorphosis WWTP using full-scale operational data from 2022 and 2023. Despite seasonal fluctuations and variations in influent composition, the plant consistently achieved high removal efficiencies (above 90%) for key pollutants, such as BOD5, COD, and TSS, while maintaining full compliance with the EU Urban Wastewater Treatment Directive.
Remarkably, both total and specific energy consumption remained stable across the two years, placing the facility in the lower quartile of energy use when benchmarked against national and international data. This reflects a high degree of process optimization and operational resilience. Performance dynamics were likely influenced by factors such as operational adjustments, ambient temperature fluctuations, and influent load variability, yet the plant’s energy and treatment performance remained consistently strong.
Nonetheless, the plant’s energy efficiency and treatment outcomes remained robust. Looking forward, additional gains in efficiency and sustainability could be realized through the expanded deployment of VFDs (inverters), the installation of PV systems, the development of digital twins for real-time aeration optimization, and the implementation of CHP systems utilizing biogas from sludge digestion.
Overall, the MWWTP serves as a model for energy-efficient and environmentally responsible wastewater treatment, particularly for facilities treating both municipal and septic sewage under variable conditions. Its performance demonstrates the value of strategic investments in technology, monitoring, and process control in achieving long-term operational sustainability.

Author Contributions

Conceptualization, S.K.G. and S.S.; methodology, N.T.; validation, S.K.G. and S.S.; formal analysis, N.T.; investigation, N.T. and S.S.; data curation, N.T.; writing—original draft preparation, N.T.; writing—review and editing, S.K.G. and S.S.; visualization, N.T.; supervision, S.K.G. and S.S.; project administration, S.K.G. and S.S. All authors have read and agreed to the published version of the manuscript.

Funding

This research received no external funding.

Data Availability Statement

Data are contained within the paper.

Acknowledgments

The authors would like to express their sincere gratitude to EYDAP S.A. for providing the opportunity to conduct this research and publication. Special thanks are extended to Eleni Efstathiou, Head of the Metamorphosis Wastewater Treatment Plant, for her invaluable support. The authors also wish to acknowledge Vasiliki Polychniatou and Giorgos Katsouras from the Research and Development Department of EYDAP S.A. for their valuable guidance and advisory support throughout this study.

Conflicts of Interest

Authors Nikolaos Tsalas and Stylianos Samios are employed by the Athens Water Supply and Sewerage Company S.A (EYDAP), Research and Development. The remaining authors declare that the research was conducted without any commercial or financial relationships that could be construed as a potential conflict of interest.

Abbreviations

The following abbreviations are used in this manuscript:
AOPSAdvanced Oxidation Processes
BOD5Biochemical Oxygen Demand
BNRBiological Nutrient Removal
CH4Methane
CHPCombined Heat and Power
CODChemical Oxygen Demand
CO2Carbon Dioxide
DSDry Solids
ECEnergy Consumption
EECEuropean Economic Community
EPTEnhanced Primary Treatment
EROIEnergy Return on Investment
GHGGreenhouse Gas
kWhkilowatt-hour
MABRMembrane-Aerated Biofilm Reactors
MFCsMicrobial Fuel Cells
MWWTPMetamorphosis Wastewater Treatment Plant
NH3Ammonia
NO2Nitrite Nitrogen
NO3Nitrate Nitrogen
N2ONitrous Oxide
PEPopulation Equivalent
SCADASupervisory Control and Data Acquisition
SSSuspended Solids
TNTotal Nitrogen
TPTotal Phosphorus
UKUnited Kingdom
UVUltraviolet
WWTP(s)Wastewater Treatment Plants

References

  1. The Energy Sector Should Care About Wastewater—Analysis—IEA. Available online: https://www.iea.org/commentaries/the-energy-sector-should-care-about-wastewater (accessed on 16 February 2025).
  2. Daw, J.; Hallett, K.; DeWolfe, J.; Venner, I. Energy Efficiency Strategies for Municipal Wastewater Treatment Facilities; National Renewable Energy Laboratory: Golden, CO, USA, 2012. [CrossRef]
  3. World Bank Group Energy Efficiency Investments in Urban Water and Wastewater Utilities. Available online: https://www.worldbank.org/en/topic/water/publication/energy-efficiency-investments-in-urban-water-and-wastewater-utilities?utm (accessed on 14 May 2025).
  4. Independent Statistics and Analysis U.S. Energy Information Administration. What Is U.S. Electricity Generation by Energy Source? Available online: https://www.eia.gov/tools/faqs/faq.php?id=427&t=2&utm (accessed on 14 May 2025).
  5. IEA WEO-2016 Special Report: Water-Energy Nexus—Analysis—IEA. Available online: https://www.iea.org/reports/water-energy-nexus?utm (accessed on 14 May 2025).
  6. Gong, A.; Wang, G.; Qi, X.; He, Y.; Yang, X.; Huang, X.; Liang, P. Energy Recovery and Saving in Municipal Wastewater Treatment Engineering Practices. Nat. Sustain. 2025, 8, 112–119. [Google Scholar] [CrossRef]
  7. Wang, D.; Ye, W.; Wu, G.; Li, R.; Guan, Y.; Zhang, W.; Wang, J.; Shan, Y.; Hubacek, K. Greenhouse Gas Emissions from Municipal Wastewater Treatment Facilities in China from 2006 to 2019. Sci. Data 2022, 9, 317. [Google Scholar] [CrossRef]
  8. Tian, Y.; Liu, S.; Guo, Z.; Wu, N.; Liang, J.; Zhao, R.; Hao, L.; Zeng, M. Insight into Greenhouse Gases Emissions and Energy Consumption of Different Full-Scale Wastewater Treatment Plants via ECAM Tool. Int. J. Environ. Res. Public Health 2022, 19, 13387. [Google Scholar] [CrossRef]
  9. Mamais, D.; Noutsopoulos, C.; Dimopoulou, A.; Stasinakis, A.; Lekkas, T.D. Wastewater Treatment Process Impact on Energy Savings and Greenhouse Gas Emissions. Water Sci. Technol. 2015, 71, 303–308. [Google Scholar] [CrossRef] [PubMed]
  10. Yang, H.; Wang, Z.; Zhang, X.; Lu, H. Assessing Greenhouse Gas Emission Factors in Wastewater Treatment. Sustainability 2025, 17, 1488. [Google Scholar] [CrossRef]
  11. Chai, C.; Zhang, D.; Yu, Y.; Feng, Y.; Wong, M. Carbon Footprint Analyses of Mainstream Wastewater Treatment Technologies under Different Sludge Treatment Scenarios in China. Water 2015, 7, 918–938. [Google Scholar] [CrossRef]
  12. Wu, Z.; Duan, H.; Li, K.; Ye, L. A Comprehensive Carbon Footprint Analysis of Different Wastewater Treatment Plant Configurations. Environ. Res. 2022, 214, 113818. [Google Scholar] [CrossRef] [PubMed]
  13. Yao, H.; Gao, X.; Guo, J.; Wang, H.; Zhang, L.; Fan, L.; Jia, F.; Guo, J.; Peng, Y. Contribution of Nitrous Oxide to the Carbon Footprint of Full-Scale Wastewater Treatment Plants and Mitigation Strategies—A Critical Review. Environ. Pollut. 2022, 314, 120295. [Google Scholar] [CrossRef]
  14. The Paris Agreement|United Nations. Available online: https://www.un.org/en/climatechange/paris-agreement (accessed on 19 February 2025).
  15. Maktabifard, M.; Al-Hazmi, H.E.; Szulc, P.; Mousavizadegan, M.; Xu, X.; Zaborowska, E.; Li, X.; Mąkinia, J. Net-Zero Carbon Condition in Wastewater Treatment Plants: A Systematic Review of Mitigation Strategies and Challenges. Renew. Sustain. Energy Rev. 2023, 185, 113638. [Google Scholar] [CrossRef]
  16. Ramli, N.A.; Abdul Hamid, M.F. Analysis of Energy Efficiency and Energy Consumption Costs: A Case Study for Regional Wastewater Treatment Plant in Malaysia. J. Water Reuse Desalination 2017, 7, 103–110. [Google Scholar] [CrossRef]
  17. Sharawat, I.; Dahiya, R.; Dahiya, R.P. Analysis of a Wastewater Treatment Plant for Energy Consumption and Greenhouse Gas Emissions. Int. J. Environ. Sci. Technol. 2021, 18, 871–884. [Google Scholar] [CrossRef]
  18. Amiel, C.; Nawawi-Lansade, D.; Sorensen, K. An Optimal Solution to Achieve the Energy Neutral Waste Water Treatment Plant. Water Pract. Technol. 2011, 6, wpt20110068. [Google Scholar] [CrossRef]
  19. Gupta, A.S.; Khatiwada, D. Investigating the Sustainability of Biogas Recovery Systems in Wastewater Treatment Plants—A Circular Bioeconomy Approach. Renew. Sustain. Energy Rev. 2024, 199, 114447. [Google Scholar] [CrossRef]
  20. Twi-Yeboah, N.; Osei, D.; Dontoh, W.H.; Asamoah, G.A.; Baffoe, J.; Danquah, M.K. Enhancing Energy Efficiency and Resource Recovery in Wastewater Treatment Plants. Energies 2024, 17, 3060. [Google Scholar] [CrossRef]
  21. Ghimire, U.; Sarpong, G.; Gude, V.G. Transitioning Wastewater Treatment Plants toward Circular Economy and Energy Sustainability. ACS Omega 2021, 6, 11794–11803. [Google Scholar] [CrossRef]
  22. Tsalas, N.; Golfinopoulos, S.K.; Samios, S.; Katsouras, G.; Peroulis, K. Optimization of Energy Consumption in a Wastewater Treatment Plant: An Overview. Energies 2024, 17, 2808. [Google Scholar] [CrossRef]
  23. Skoczko, I. Energy Efficiency Analysis of Water Treatment Plants: Current Status and Future Trends. Energies 2025, 18, 1086. [Google Scholar] [CrossRef]
  24. SEDAC; Illinois Sustainable Technology Center; Illinois Environmental Protection Agency; US Department of Energy. The Path to Resilience: Maximizing Energy Savings at Wastewater Treatment Plants. 2024. Available online: https://smartenergy.illinois.edu/wp-content/uploads/2024/06/WWTPResiliencePublication_Final2.pdf (accessed on 14 May 2025).
  25. General Secretariat of Waste Management Coordination Wastewater Treatment Plants Monitoring Database. Available online: https://astikalimata.ypeka.gr/wtp (accessed on 22 February 2025).
  26. Flowchart Maker & Online Diagram Software. Available online: https://app.diagrams.net/ (accessed on 1 March 2025).
  27. EYDAP, S.A. Metamorfosi Wastewater Treatment Plant. p. 2. Available online: https://www.eydap.gr/userfiles/c3c4382d-a658-4d79-b9e2-ecff7ddd9b76/Fact-sheet-MWWTP.PDF (accessed on 22 February 2025).
  28. Google Earth. Available online: https://www.google.com/intl/el/earth/index.html (accessed on 1 March 2025).
  29. Peeters, J.; Vicevic, G.; Koops, G.H.; Côté, P. The Role of Innovative Technologies in Achieving Energy-Neutral Wastewater Treatment. Water Pract. Technol. 2016, 11, 691–701. [Google Scholar] [CrossRef]
  30. Silva Thomsen, L.B.; Carvalho, P.N.; Dos Passos, J.S.; Anastasakis, K.; Bester, K.; Biller, P. Hydrothermal Liquefaction of Sewage Sludge; Energy Considerations and Fate of Micropollutants during Pilot Scale Processing. Water Res. 2020, 183, 116101. [Google Scholar] [CrossRef]
  31. Esfandyari, M.; Jafari, D.; Azami, H. Microbial Fuel Cells for Energy Production in Wastewater Treatment Plants—A Review. Biofuels 2024, 15, 743–753. [Google Scholar] [CrossRef]
  32. Guo, Z.; Sun, Y.; Pan, S.-Y.; Chiang, P.-C. Integration of Green Energy and Advanced Energy-Efficient Technologies for Municipal Wastewater Treatment Plants. Int. J. Environ. Res. Public Health 2019, 16, 1282. [Google Scholar] [CrossRef] [PubMed]
  33. Directive—91/271—EN—EUR-Lex. Available online: https://eur-lex.europa.eu/legal-content/EN/TXT/?uri=CELEX:31991L0271 (accessed on 16 February 2025).
  34. European Commission Circular Economy Action Plan—European Commission. Available online: https://environment.ec.europa.eu/strategy/circular-economy-action-plan_en (accessed on 1 March 2025).
  35. Tian, H.; Zhang, J.; Zheng, Y.; Zheng, G.; Li, Y.; Yan, Y.; Li, Z.; Hui, M. Evaluating the Performance of an Integrated Membrane-Aerated Biofilm Reactor (MABR) System for High-Strength Brewery Wastewater Treatment. Environ. Sci. Water Res. Technol. 2023, 9, 2053–2064. [Google Scholar] [CrossRef]
  36. Arashiro, L.T.; Ferrer, I.; Rousseau, D.P.L.; Van Hulle, S.W.H.; Garfí, M. The Effect of Primary Treatment of Wastewater in High Rate Algal Pond Systems: Biomass and Bioenergy Recovery. Bioresour. Technol. 2019, 280, 27–36. [Google Scholar] [CrossRef] [PubMed]
  37. Arashiro, L.T.; Montero, N.; Ferrer, I.; Acién, F.G.; Gómez, C.; Garfí, M. Life Cycle Assessment of High Rate Algal Ponds for Wastewater Treatment and Resource Recovery. Sci. Total Environ. 2018, 622–623, 1118–1130. [Google Scholar] [CrossRef] [PubMed]
  38. Daverey, A.; Pandey, D.; Verma, P.; Verma, S.; Shah, V.; Dutta, K.; Arunachalam, K. Recent Advances in Energy Efficient Biological Treatment of Municipal Wastewater. Bioresour. Technol. Rep. 2019, 7, 100252. [Google Scholar] [CrossRef]
  39. Stamatelatou, K.; Tsagarakis, K.P. Sewage Treatment Plants: Economic Evaluation of Innovative Technologies for Energy Efficiency; IWA Publishing: London, UK, 2015; ISBN 978-1-78040-502-5. [Google Scholar]
  40. Aghababaie, M.; Farhadian, M.; Jeihanipour, A.; Biria, D. Effective Factors on the Performance of Microbial Fuel Cells in Wastewater Treatment—A Review. Environ. Technol. Rev. 2015, 4, 71–89. [Google Scholar] [CrossRef]
  41. Lima, D.; Li, L.; Appleby, G. A Review of Renewable Energy Technologies in Municipal Wastewater Treatment Plants (WWTPs). Energies 2024, 17, 6084. [Google Scholar] [CrossRef]
  42. Jallouli, S.; Wali, A.; Buonerba, A.; Zarra, T.; Belgiorno, V.; Naddeo, V.; Ksibi, M. Efficient and Sustainable Treatment of Tannery Wastewater by a Sequential Electrocoagulation-UV Photolytic Process. J. Water Process Eng. 2020, 38, 101642. [Google Scholar] [CrossRef]
  43. Bezirgiannidis, A. Development of Emerging Technologies for a Low Carbon Footprint Wasewater Treatment; Democritus University of Thace: Dragana Alexandroupolis, Greece, 2021; Available online: http://hdl.handle.net/10442/hedi/50134 (accessed on 15 March 2025).
  44. Clos, I.; Krampe, J.; Alvarez-Gaitan, J.P.; Saint, C.P.; Short, M.D. Energy Benchmarking as a Tool for Energy-Efficient Wastewater Treatment: Reviewing International Applications. Water Conserv. Sci. Eng. 2020, 5, 115–136. [Google Scholar] [CrossRef]
  45. Ochuko, M. Ojo A Review of Selected Energy-Efficient Technologies for Wastewater Treatment. J. Energy Technol. Environ. 2024, 6, 188–197. [Google Scholar] [CrossRef]
  46. Shamshad, J.; Ur Rehman, R. Innovative Approaches to Sustainable Wastewater Treatment: A Comprehensive Exploration of Conventional and Emerging Technologies. Environ. Sci. Adv. 2025, 4, 189–222. [Google Scholar] [CrossRef]
  47. PORVOO 7 Energy-Efficient Wastewater Treatment Methods—PORVOO Clean-Tech. Available online: https://porvoo.com.cn/blog/7-energy-efficient-wastewater-treatment-methods/ (accessed on 21 May 2025).
  48. Tabibi, A. Energy-Efficient Wastewater Treatment Systems. Available online: https://green.org/2024/01/30/energy-efficient-wastewater-treatment-systems/ (accessed on 21 May 2025).
  49. Ghoneim, W.A.M.; Helal, A.A.; Abdel Wahab, M.G. Minimizing Energy Consumption in Wastewater Treatment Plants. In Proceedings of the 2016 3rd International Conference on Renewable Energies for Developing Countries (REDEC), Zouk Mosbeh, Lebanon, 13–15 July 2016; IEEE: Zouk Mosbeh, Lebanon, 2016; pp. 1–8. [Google Scholar]
  50. Goliopoulos, N.; Mamais, D.; Noutsopoulos, C.; Dimopoulou, A.; Kounadis, C. Energy Consumption and Carbon Footprint of Greek Wastewater Treatment Plants. Water 2022, 14, 320. [Google Scholar] [CrossRef]
  51. Płuciennik-Koropczuk, E.; Myszograj, S.; Mąkowski, M. Reducing CO2 Emissions from Wastewater Treatment Plants by Utilising Renewable Energy Sources—Case Study. Energies 2022, 15, 8446. [Google Scholar] [CrossRef]
  52. Maktabifard, M.; Zaborowska, E.; Makinia, J. Achieving Energy Neutrality in Wastewater Treatment Plants through Energy Savings and Enhancing Renewable Energy Production. Rev. Env. Sci. Biotechnol. 2018, 17, 655–689. [Google Scholar] [CrossRef]
  53. Bailey, J.R.; Ahmad, S.; Batista, J.R. The Impact of Advanced Treatment Technologies on the Energy Use in Satellite Water Reuse Plants. Water 2020, 12, 366. [Google Scholar] [CrossRef]
  54. Rodziewicz, J.; Mielcarek, A.; Bryszewski, K.; Janczukowicz, W.; Kłobukowska, K. Energy Consumption for Nutrient Removal from High-Nitrate and High-Phosphorus Wastewater in Aerobic and Anaerobic Bioelectrochemical Reactors. Energies 2022, 15, 7251. [Google Scholar] [CrossRef]
  55. Rizzo, L.; Fiorentino, A.; Anselmo, A. Advanced Treatment of Urban Wastewater by UV Radiation: Effect on Antibiotics and Antibiotic-Resistant E. Coli Strains. Chemosphere 2013, 92, 171–176. [Google Scholar] [CrossRef]
  56. González, Y.; Gómez, G.; Moeller-Chávez, G.E.; Vidal, G. UV Disinfection Systems for Wastewater Treatment: Emphasis on Reactivation of Microorganisms. Sustainability 2023, 15, 11262. [Google Scholar] [CrossRef]
  57. Zăbavă, B.-Ș.; Voicu, G.; Ungureanu, N.; Dincă, M.; Vladut, V. UV Disinfection—A Method of Purifying Wastewater from Farms—A Review. In Proceedings of the 14th Annual Meeting “Durable Agriculture–Agriculture of the Future”, Craiova, Romania, 27–29 September 2018. [Google Scholar]
  58. Collivignarelli, M.C.; Abbà, A.; Miino, M.C.; Caccamo, F.M.; Torretta, V.; Rada, E.C.; Sorlini, S. Disinfection of Wastewater by UV-Based Treatment for Reuse in a Circular Economy Perspective. Where Are We At? Int. J. Environ. Res. Public Health 2020, 18, 77. [Google Scholar] [CrossRef]
  59. Miklos, D.B.; Remy, C.; Jekel, M.; Linden, K.G.; Drewes, J.E.; Hübner, U. Evaluation of Advanced Oxidation Processes for Water and Wastewater Treatment—A Critical Review. Water Res. 2018, 139, 118–131. [Google Scholar] [CrossRef]
  60. Cardoso, B.J.; Rodrigues, E.; Gaspar, A.R.; Gomes, Á. Energy Performance Factors in Wastewater Treatment Plants: A Review. J. Clean. Prod. 2021, 322, 129107. [Google Scholar] [CrossRef]
  61. Li, Z.; Zou, Z.; Wang, L. Analysis and Forecasting of the Energy Consumption in Wastewater Treatment Plant. Math. Probl. Eng. 2019, 2019, 8690898. [Google Scholar] [CrossRef]
  62. Bodík, I.; Kubaská, M. Energy and Sustainability of Operation of a Wastewater Treatment Plant. Environ. Protect. Eng. 2013, 39, 15–24. [Google Scholar] [CrossRef]
  63. Gandiglio, M.; Lanzini, A.; Soto, A.; Leone, P.; Santarelli, M. Enhancing the Energy Efficiency of Wastewater Treatment Plants through Co-Digestion and Fuel Cell Systems. Front. Environ. Sci. 2017, 5, 70. [Google Scholar] [CrossRef]
  64. Hamawand, I. Energy Consumption in Water/Wastewater Treatment Industry—Optimisation Potentials. Energies 2023, 16, 2433. [Google Scholar] [CrossRef]
  65. Pakenas, L.J. Energy Efficiency in Municipal Wastewater Treatment Plants; New York State Energy Research and Development Authority (NYSERDA): Albany, NY, USA, 1995.
  66. WAREG—European Water Regulators. Impacts of the Energy Crisis on the Price of Water Services; WAREG—European Water Regulators: Milan, Italy, 2023; Available online: https://www.wareg.org/documents/energy-report-wareg/ (accessed on 16 February 2025).
  67. Chapin, F.T.; Bolorinos, J.; Mauter, M.S. Electricity and Natural Gas Tariffs at United States Wastewater Treatment Plants. Sci. Data 2024, 11, 113. [Google Scholar] [CrossRef]
  68. Trapote, A.; Albaladejo, A.; Simón, P. Energy Consumption in an Urban Wastewater Treatment Plant: The Case of Murcia Region (Spain). Civ. Eng. Environ. Syst. 2014, 31, 304–310. [Google Scholar] [CrossRef]
  69. Santos, E.; Albuquerque, A.; Lisboa, I.; Murray, P.; Ermis, H. Economic Assessment of Energy Consumption in Wastewater Treatment Plants: Applicability of Alternative Nature-Based Technologies in Portugal. Water 2022, 14, 2042. [Google Scholar] [CrossRef]
  70. Regulation—2020/741—EN—EUR-Lex. Available online: https://eur-lex.europa.eu/eli/reg/2020/741/oj/eng (accessed on 16 February 2025).
  71. Legislation—Ministry of Environment and Energy. Available online: https://ypen.gov.gr/diacheirisi-apovliton/astika-lymata/nomothesia/ (accessed on 16 February 2025).
  72. Directive—2000/60—EN—Water Framework Directive—EUR-Lex. Available online: https://eur-lex.europa.eu/legal-content/EN/TXT/?uri=CELEX:32000L0060 (accessed on 16 February 2025).
  73. Siatou, A.; Manali, A.; Gikas, P. Energy Consumption and Internal Distribution in Activated Sludge Wastewater Treatment Plants of Greece. Water 2020, 12, 1204. [Google Scholar] [CrossRef]
  74. Zou, L.; Li, H.; Wang, S.; Zheng, K.; Wang, Y.; Du, G.; Li, J. Characteristic and Correlation Analysis of Influent and Energy Consumption of Wastewater Treatment Plants in Taihu Basin. Front. Environ. Sci. Eng. 2019, 13, 83. [Google Scholar] [CrossRef]
Figure 1. MWWTP [28].
Urbansci 09 00201 g001
Figure 2. Flowchart of MWWTP.
Urbansci 09 00201 g002
Figure 3. Energy consumption distribution across treatment stages at the Metamorphosis Wastewater Treatment Plant (MWWTP).
Urbansci 09 00201 g003
Figure 4. Flowchart of the methodology for energy consumption and treatment efficiency analysis.
Urbansci 09 00201 g004
Figure 5. Τotal energy consumption (kWh) and removal efficiency (%) of BOD5, COD, and SS from 1 January 2023 to 30 April 2023.
Urbansci 09 00201 g005
Figure 6. Total energy consumption (kWh) and removal efficiency (%) of BOD5, COD, and SS from 1 May 2023 to 31 August 2023.
Urbansci 09 00201 g006
Figure 7. Total energy consumption (kWh) and removal efficiency (%) of BOD5, COD, and SS from 1 September 2023 to 31 December 2023.
Urbansci 09 00201 g007
Figure 8. Τotal energy consumption (kWh) and removal efficiency (%) of BOD5, COD, and SS from 1 January 2022 to 30 April 2022.
Urbansci 09 00201 g008
Figure 9. Τotal energy consumption (kWh) and removal efficiency (%) of BOD5, COD, and SS from 1 May 2022 to 31 August 2022.
Urbansci 09 00201 g009
Figure 10. Τotal energy consumption (kWh) and removal efficiency (%) of BOD5, COD, and SS from 1 September 2022 to 31 December 2022.
Urbansci 09 00201 g010
Table 2. The required effluent limits according to Directive 91/271/EEC.
ParameterConcentration (mg L−1)Minimum Removal Efficiency (%) *
BOD5≤2570–90
COD≤12575
SS≤35
>10,000 PE
≤60
2000–10,000 PE
90

70
Sensitive areas
(The above limits apply, along with the following additional requirements)
Total Phosphorus (TP)≤2
10,000–100,000 PE
≤1
>100,000 PE
80
Total Nitrogen (TN) **≤15
10,000–100,000 PE
≤10
>100,000 PE
70–80
* The concentration value and/or the minimum required reduction percentages for pollutants in treated urban wastewater are applied. ** For total nitrogen, the limit is defined as the sum of Total Kjeldahl Nitrogen (organic nitrogen and NH3), nitrate nitrogen (NO3), and nitrite nitrogen (NO2).
Table 3. Average concentrations and standard deviations of influent and effluent parameters at the MWWTP in 2023, including energy consumption (EC).
Inlet (mg L−1)Outlet (mg L−1)
TNTPBOD5CODTSSTNTPBOD5CODTSSEC (kWh)
Average106.017.01122.32594.41421.216.72.64.725.23.513,126.1
Standard deviation22.05.4770.82012.11985.66.61.52.84.42.11396.6
Table 4. Number of samplings for each parameter at the inlet and outlet during 2023.
InletOutlet
TNTPBOD5CODTSSTNTPBOD5CODTSS
149149149149149148148251251251
Table 5. Average concentrations and standard deviations of influent and effluent parameters at the MWWTP in 2022, including EC.
Inlet (mg L−1)Outlet (mg L−1)
TNTPBOD5CODTSSTNTPBOD5CODTSSEC (kWh)
Average107.114.2992.81925.41280.820.22.46.123.82.413,044.9
Standard deviation20.74.9649.61252.61610.48.61.93.17.71.71217.2
Table 6. Number of samplings for each parameter at the inlet and outlet during 2022.
InletOutlet
TNTPBOD5CODTSSTNTPBOD5CODTSS
145145145145145144148246246246
Disclaimer/Publisher’s Note: The statements, opinions and data contained in all publications are solely those of the individual author(s) and contributor(s) and not of MDPI and/or the editor(s). MDPI and/or the editor(s) disclaim responsibility for any injury to people or property resulting from any ideas, methods, instructions or products referred to in the content.

