
Study on the Public Information Level About the Waste Management System

 ,
,  , ,
, ,  ,
,  , and
, and
Abstract
1. Introduction
2. Methodology
- -
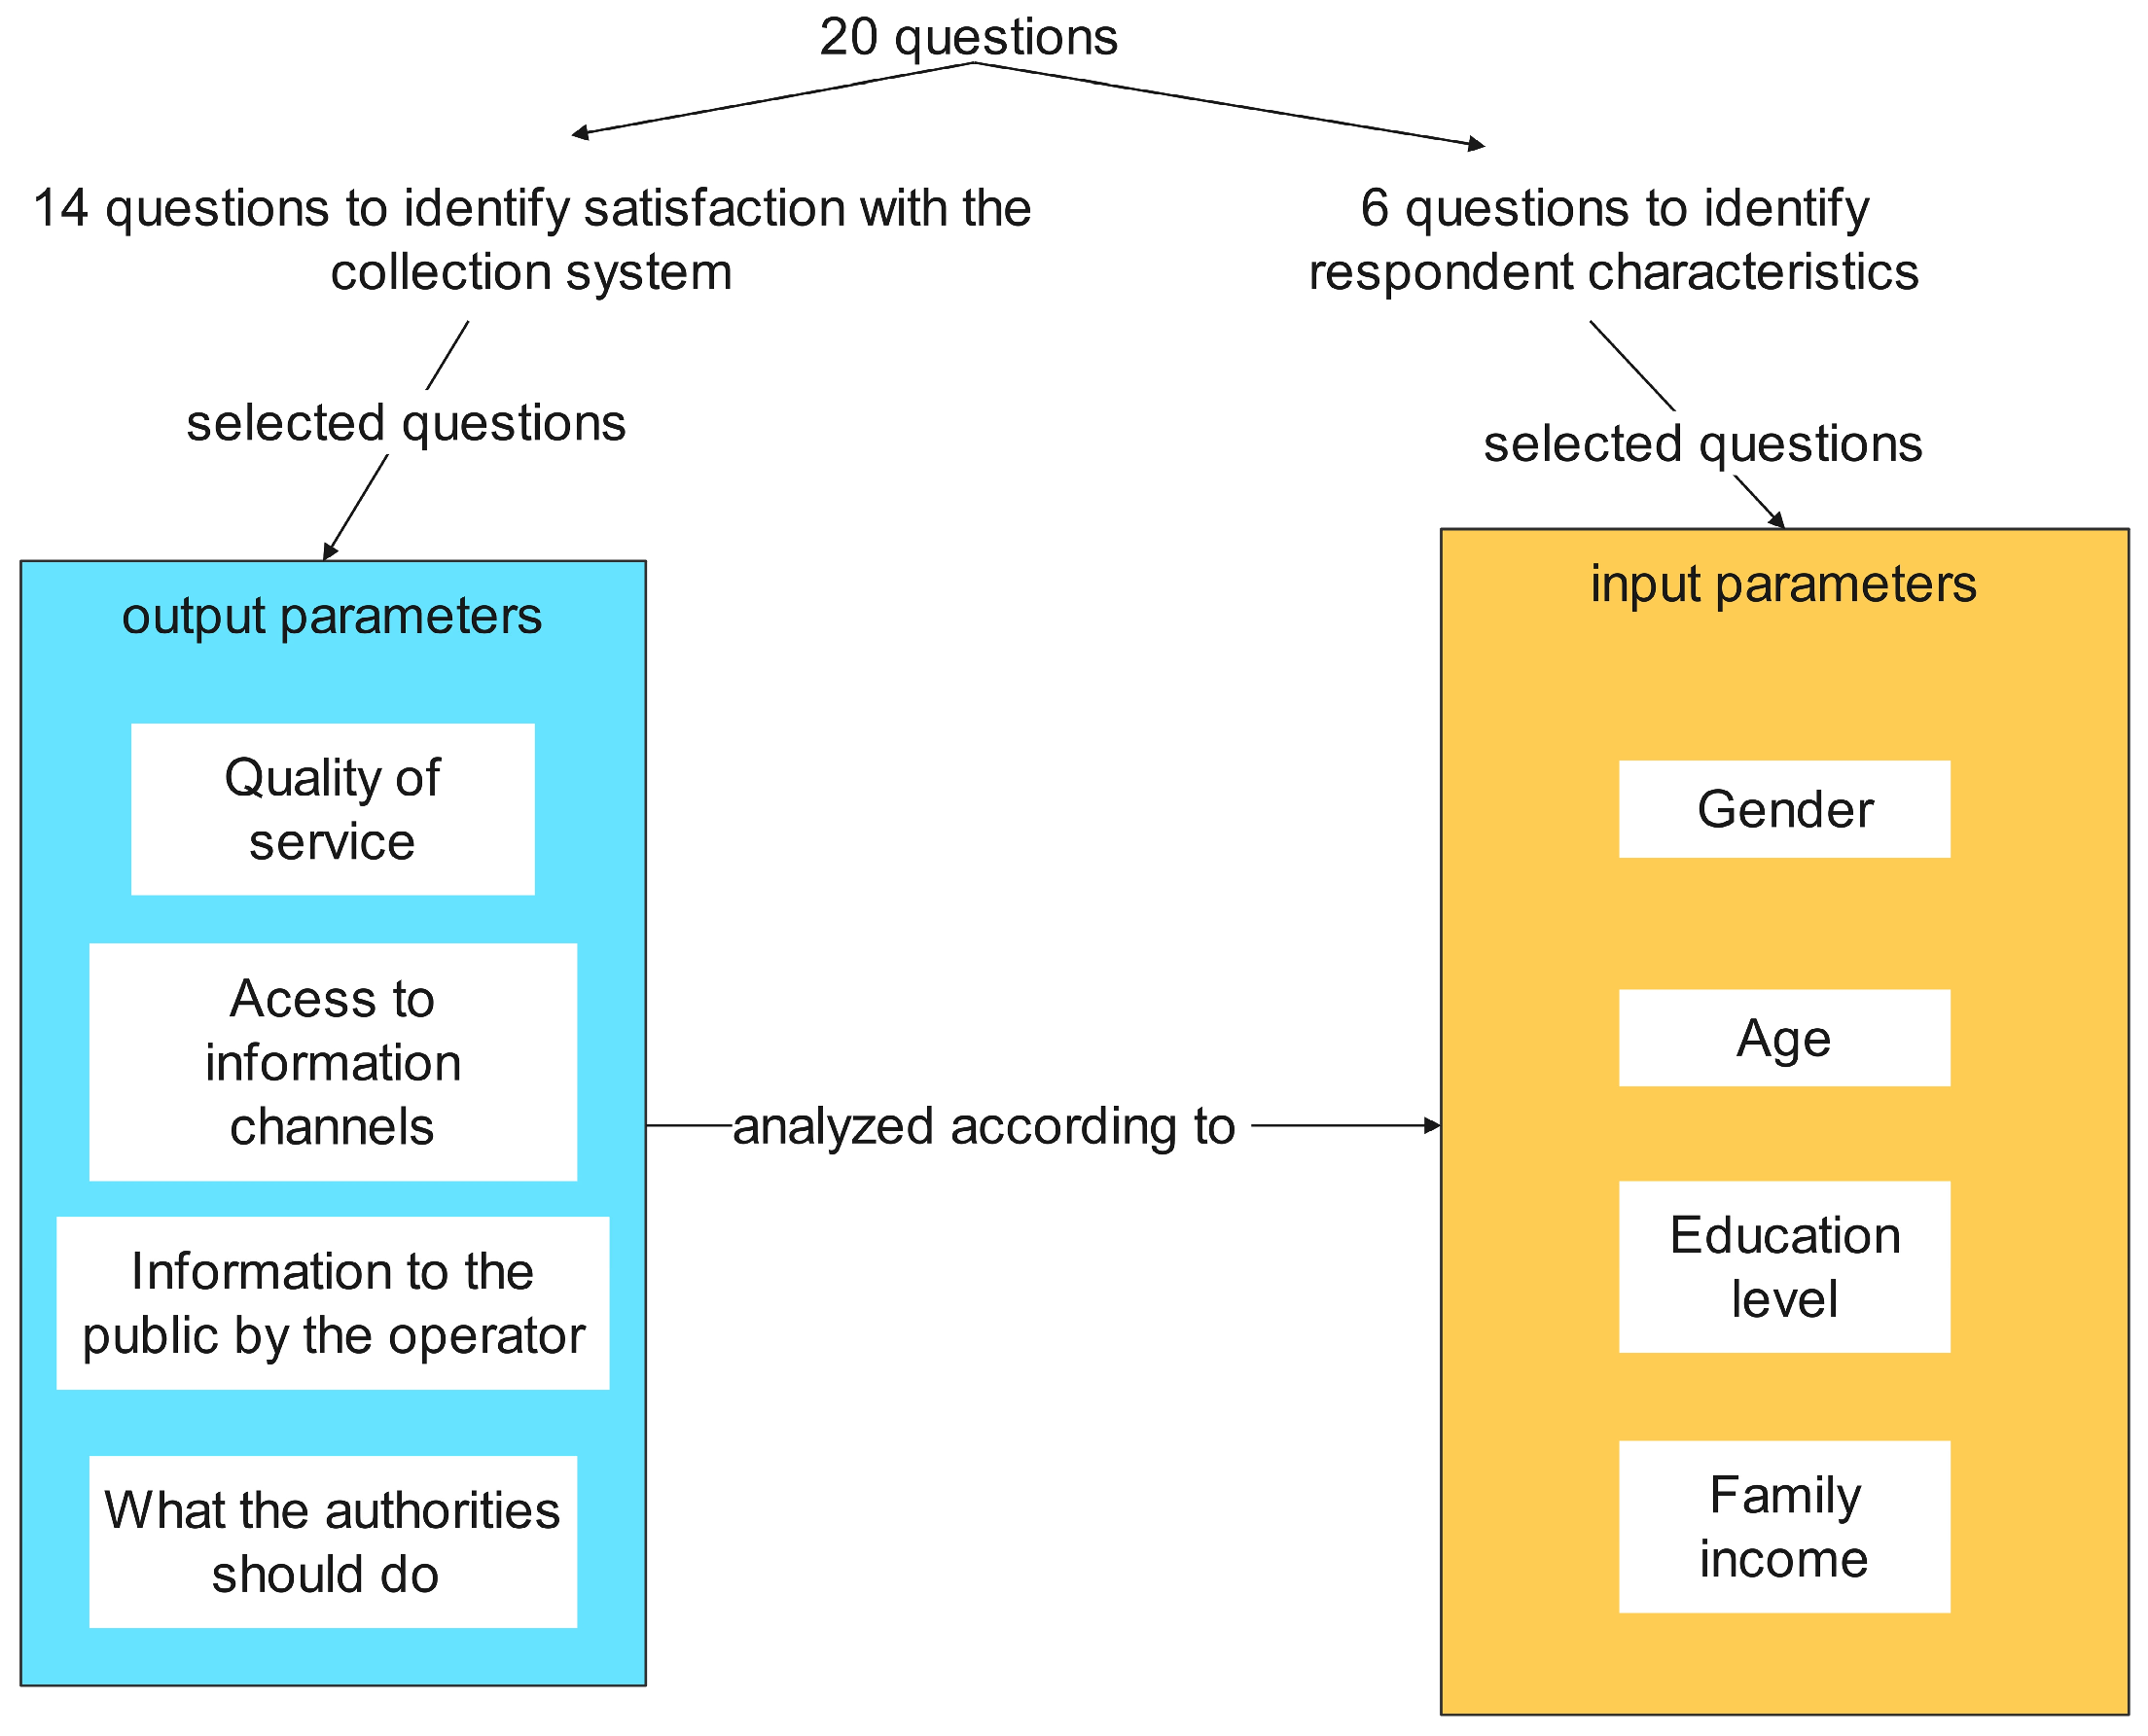
- Input parameters, which provide information about the respondents who participated in the survey;
- -
- Output parameters, which provide information about the population of the neighborhood under study’s perception on the waste collection system and their familiarity with the collection system.
- -
- During the process of collecting the waste bins (a process that involves the weekly collection of household waste and selectively collected waste—as the area is characterized by the door-to-door collection system), bin owners were asked, if they wished to participate in the questionnaire and whether they had access to and knew how to use IT technology to be able to answer an online questionnaire;
- -
- Those who answered “yes” to the initial questions were sent the corresponding link to the questionnaire through various methods, such as email or chat.
3. Results
- -
- Results describing the characteristics of the respondents who participated in this study (Table 3):
- ○
- The analysis of respondents’ distribution by Gender shows that male respondents outnumbered female respondents;
- ○
- Analysis of the Age distribution of respondents indicates that the predominant age group is represented by individuals aged 36–50 years, followed by respondents aged 51–60 years and 14–25 years. The smallest number of respondents are found in the age group of over 60 years, with 23 respondents;
- ○
- Referring to the Level of education, it can be observed that the majority of the respondents (49.74%) have a high school education, while the other half of the respondents are characterized by the other categories of educational levels;
- ○
- When analyzing the Financial status of the respondents, it should be considered that the Romania RON–Euro parity at the time of this survey was 4.9286–4.9405 RON for 1 Euro [35]. According to Table 3, 143 out of 191 respondents have a total household income below 1000 Euro per month, and only 25.13% have an income above this threshold.
- -
- The results presenting the information given by the respondents about how the household waste management system is managed were analyzed in relation to the characteristics of the respondents (those presented in Table 3):
- (a)
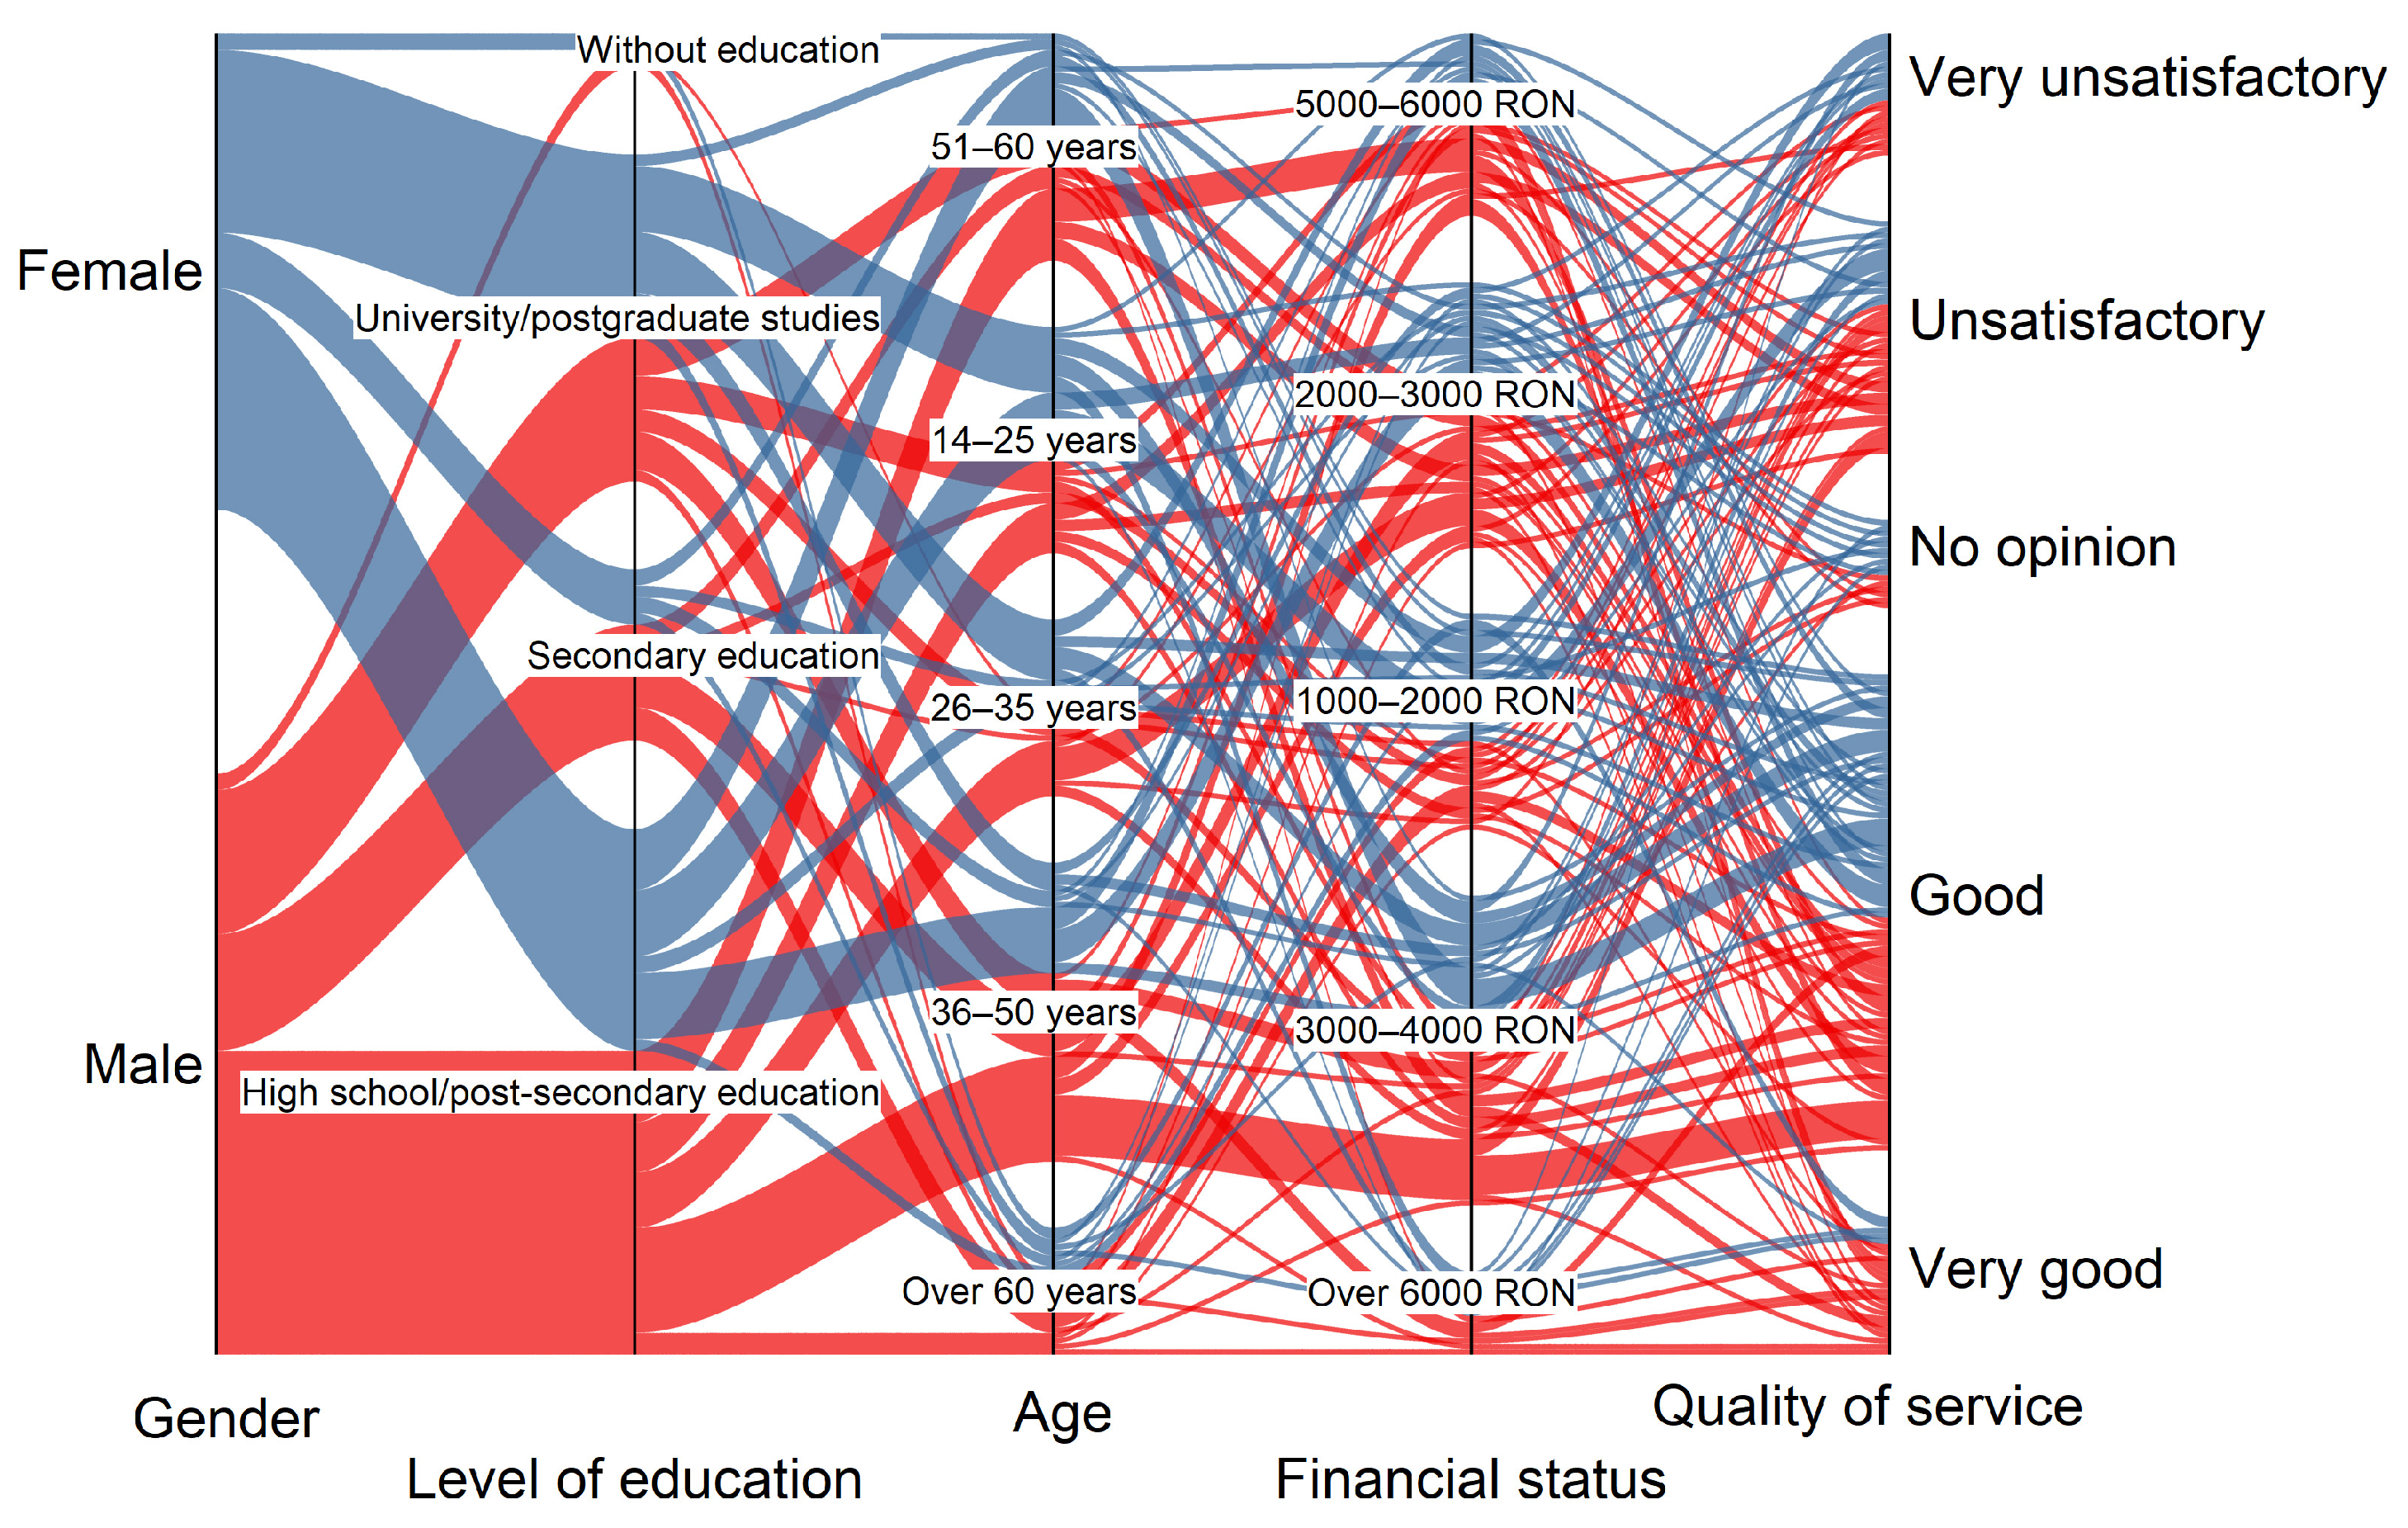
- The analysis of the level of sanitation services’ quality, from the point of view of the respondents, is presented in Figure 4. By analyzing each factor separately, the following conclusions can be drawn:
- Only 59.05% of the female respondents agree that the quality of service is Good and Very good, while among the male respondents, the share for the same answers is 56.97%;
- Regarding the impact of respondents’ Age on the Quality of services, the highest number of respondents who opted for Good and Very good were in the 51–60 years range (27 respondents) and the 36–50 years range (36 respondents). At the opposite end are those who had No opinion at all (age group over 60 years–zero answers) or a Very bad opinion (age group over 60–two responses, the same number of answers those in the 51–60 years age group);
- From the analysis of Financial status per household, it can be observed that 29 respondents whose income was 3000–4000 RON and 22 respondents whose income was 2000–3000 RON, have a Good impression of the quality of the service. Sixteen respondents whose income was 3000–4000 RON are not satisfied with the service, and the highest proportion of respondents who are Very unsatisfied, 11, are in the income group 1000–2000 RON. The remaining dispersion of respondents, between maximum of ten respondents and minimum of one respondent, does not significantly impact the overall analysis.
- Analyzing the influence of the level of education on satisfaction with the SWMS service, it can be observed that those who have a positive opinion have high school education (49 respondents) and university education (25 respondents), while the largest group of unsatisfied respondents (25 respondents) have high school education.
- Overall analysis—taking all factors into account, only a few compact groups of respondents with the same characteristics can be observed:
- ○
- Seven male respondents, aged 36–50 years, with an income of 3000–4000 RON and a high school education level, answered that they are satisfied with the service;
- ○
- It was possible to identify four groups whose opinion is predominantly positive; within these groups there were a maximum of three respondents;
- Within the category of female respondents who are satisfied with the sanitation service, the following groups were identified:
- ○
- And for this category it was possible to identify three groups within which a maximum of four respondents with the same characteristics were found;
- ○
- A group of three respondents, aged 36–50 years, with incomes of 5000–6000 RON and who have high school education;
- ○
- A final group of five respondents, aged 51–60 years, with incomes of 3000–4000 RON and high school education.
- (b)
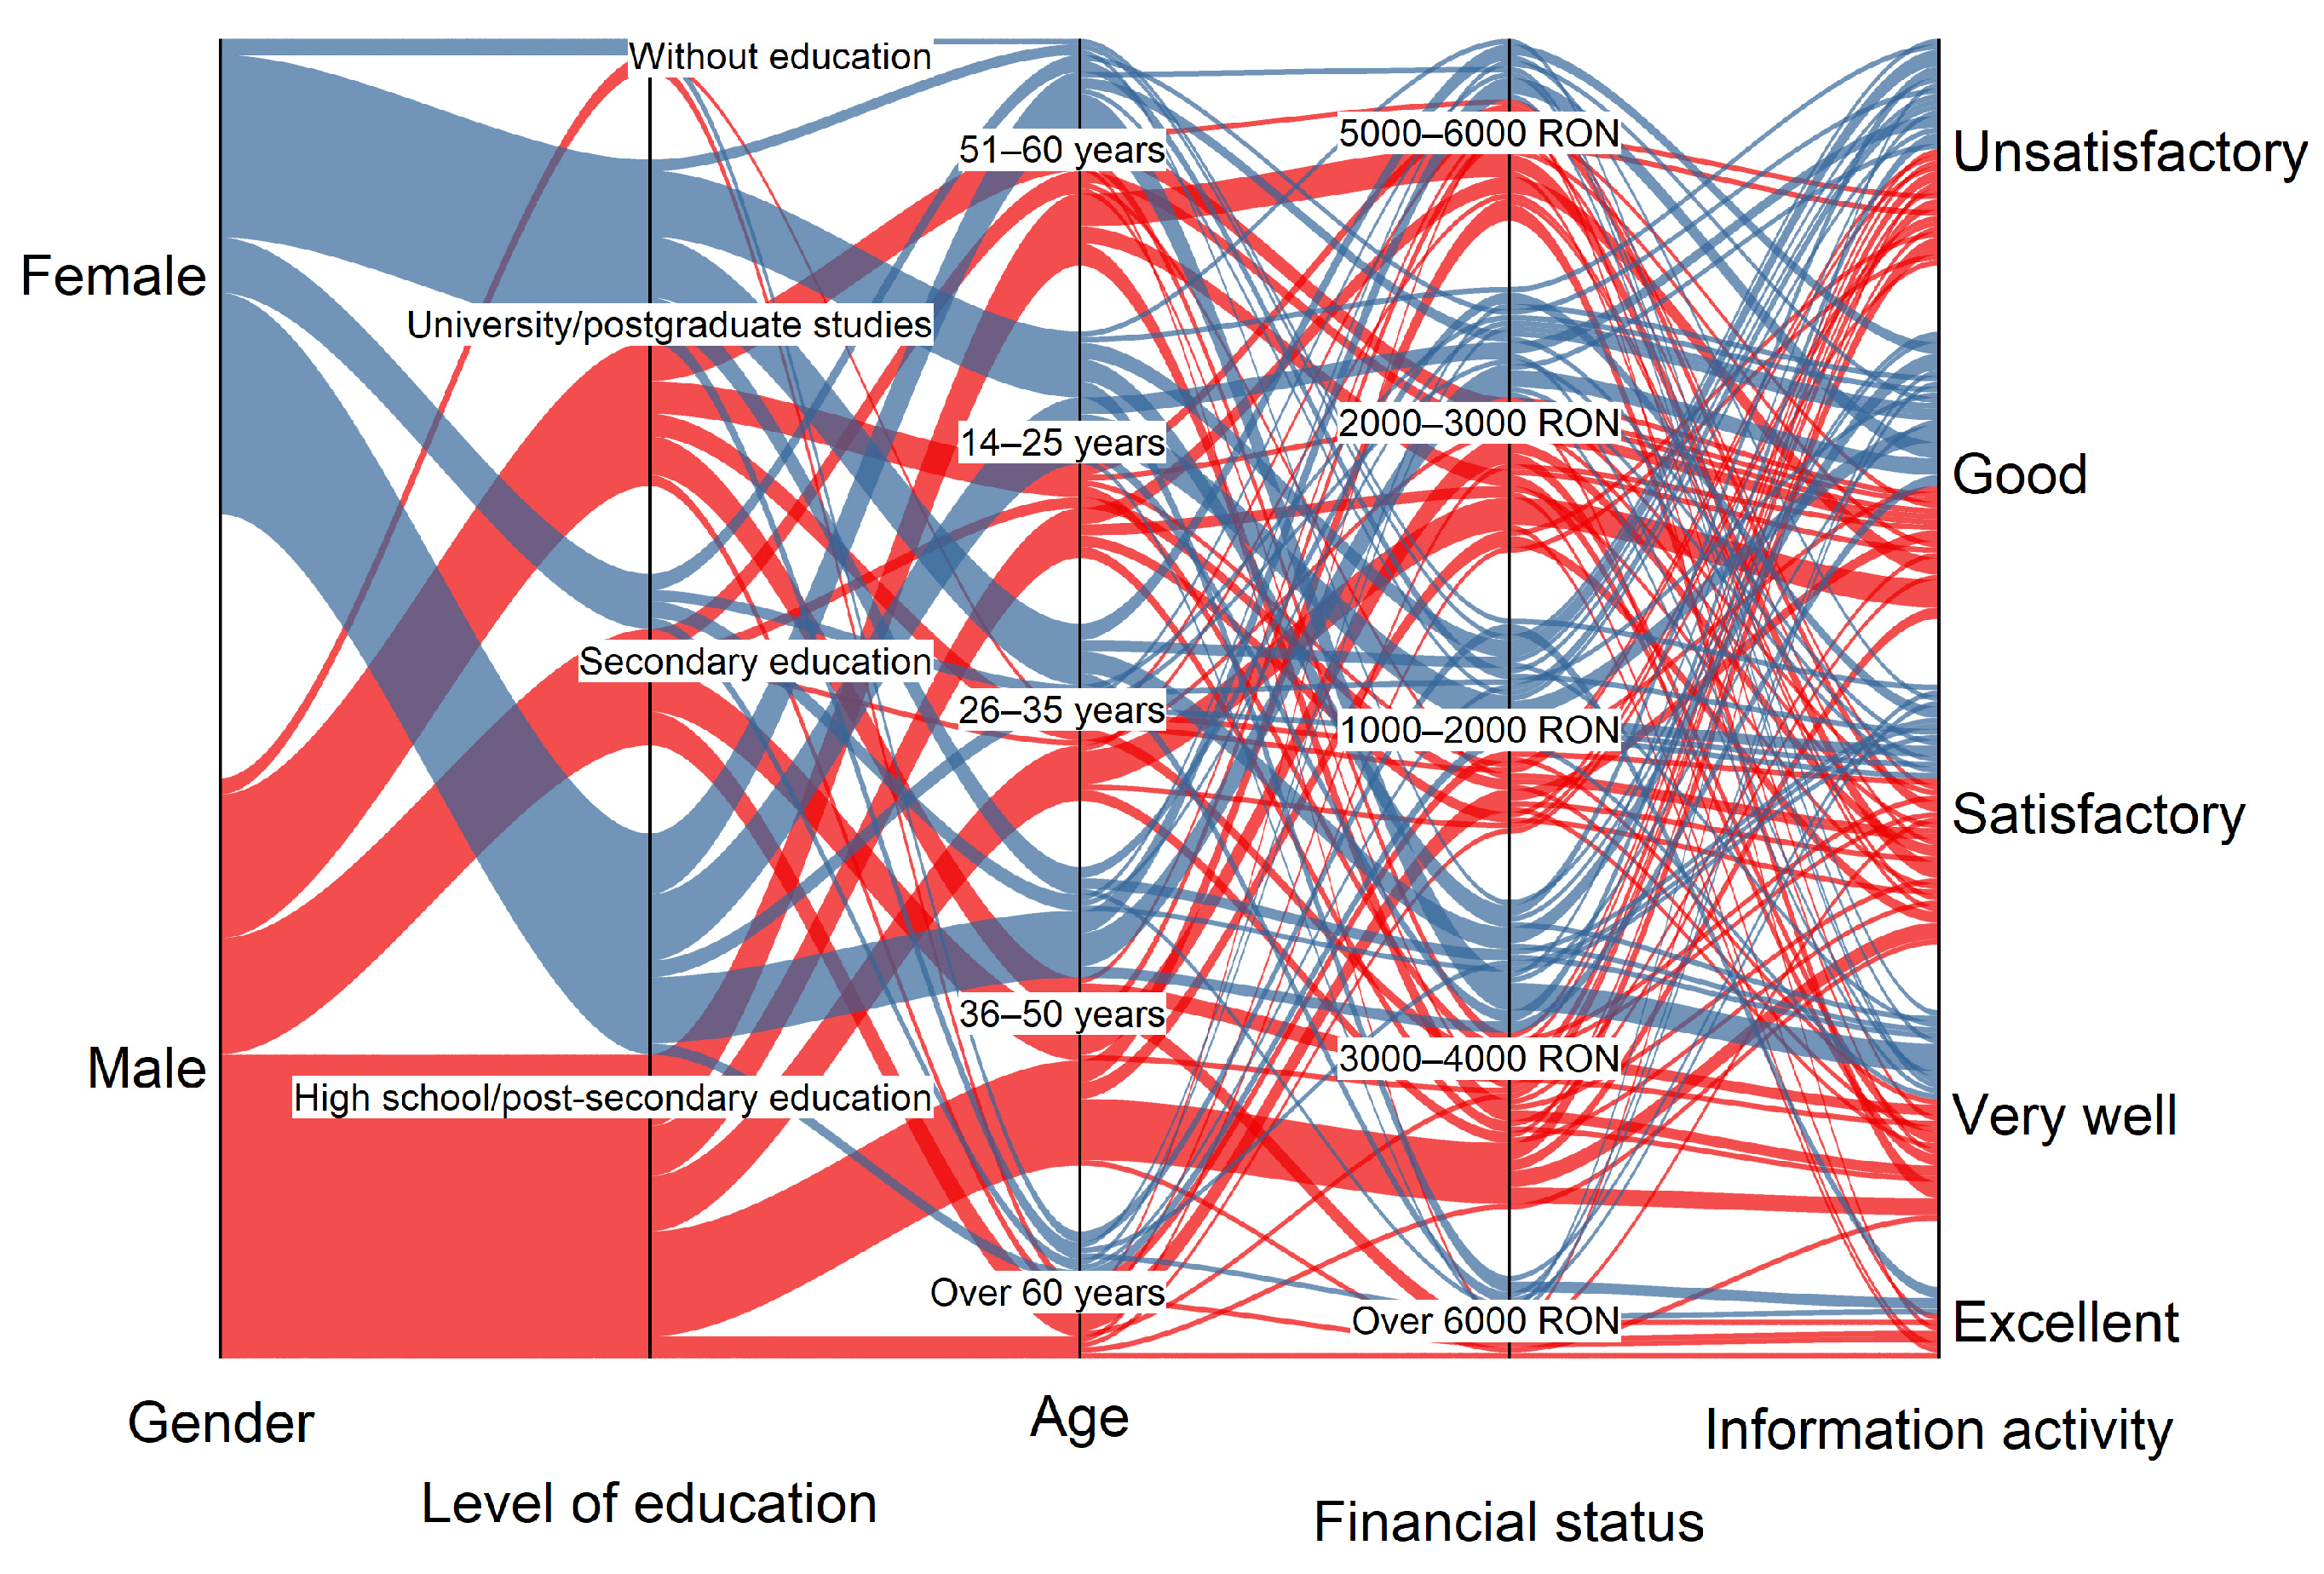
- Regarding the respondents’ appreciation of the information-and-awareness-raising activities (Figure 5) carried out by the sanitation operator, the following observations can be made:
- Of the 52 respondents who think this activity is Good, 53.85% are female and 46.15% are male. Those who have a Satisfactory opinion represent 24.61% of the total number of respondents, distributed by gender as follows: 30 male respondents and 17 female respondents. However, a significant number of respondents who are Not satisfied with this activity has also been identified (21.47%), with 51.22% of this category being male and 48.78% female. Only 38 respondents (19.9% of the total) think that the outreach activity is Very good, specifically 22 males and 16 females. The smallest group of respondents is found in the category of those who think that this activity is Excellent (6.81% of total respondents). This group analyzed by gender includes eight males and five females.
- Age distribution of respondents in relation to information activity reveals the following patterns:
- The large groups of respondents belong to the age groups 36–50 ages and 26–35 ages, 15 respondents identified for each category. These groups are distributed as follows: the first age group has a Satisfactory impression, and the second age group has a Good impression;
- Another large group of 14 respondents is found in the 36–50 ages group, who think the level of information is Very good;
- Additionally, within the 36–50 years age group, 13 respondents (25% of the total number of respondents) were identified as having a Good impression of this activity.
- Within the 51–60 years age group, two groups were identified: one of 12 respondents with a Satisfactory opinion, and the other with 11 respondents who consider the activity Very good;
- The remaining respondent groups include fewer than 10 members each;
- Analyzing this item from the perspective of Educational level, the following was found:
- The highest proportion of respondents, 49.74% of the total number of respondents, are high school graduates, distributed as follows: 28.42% have a Good impression of this activity, 25.26% have a Very good impression, 23.16% have a Satisfactory impression, 18.95% have an Unsatisfactory impression, and only 4.21% have an Excellent impression;
- Among the fifty-nine respondents with university education, the following distribution was obtained: sixteen respondents find it Unsatisfactory; 14 respondents have a Satisfactory opinion; thirteen respondents have a Good opinion; for Very good we have nine respondents; and for the last category Excellent we have seven respondents;
- Another group consists of respondents with secondary education, and they are characterized by a number of thirty-one respondents, distributed as follows: four respondents rated the activity as Very good; those who rate it Satisfactory are nine respondents; the Good option was chosen by eleven respondents; and seven respondents rated it Unsatisfactory.
- Regarding the impact of Financial status on waste management outreach, the most representative groups were identified in the following income groups:
- 2000–3000 RON, 20 respondents consider this activity to be Good;
- From the income group with 3000–4000 RON—17 respondents have a Very good opinion about the information activity;
- 16 respondents, from group 3000–4000 RON, are Not satisfied with this information activity;
- 14 respondents, from group 1000–2000 RON are Not satisfied with this information activity;
- 12 respondents, which are from group of 3000–4000 RON, have a Good opinion, while another 12 respondents, from the group of 2000–3000 RON, have a Satisfactory opinion.
- The results of this analysis, considering all the factors included, revealed compact groups of respondents with similar characteristics:
- The largest group, consisting of five respondents, includes males aged 26–35 years, high school graduates, with a household income of 2000–3000 RON, who have a Good opinion on this activity;
- 11 groups consisting of three respondents were identified.
- (c)
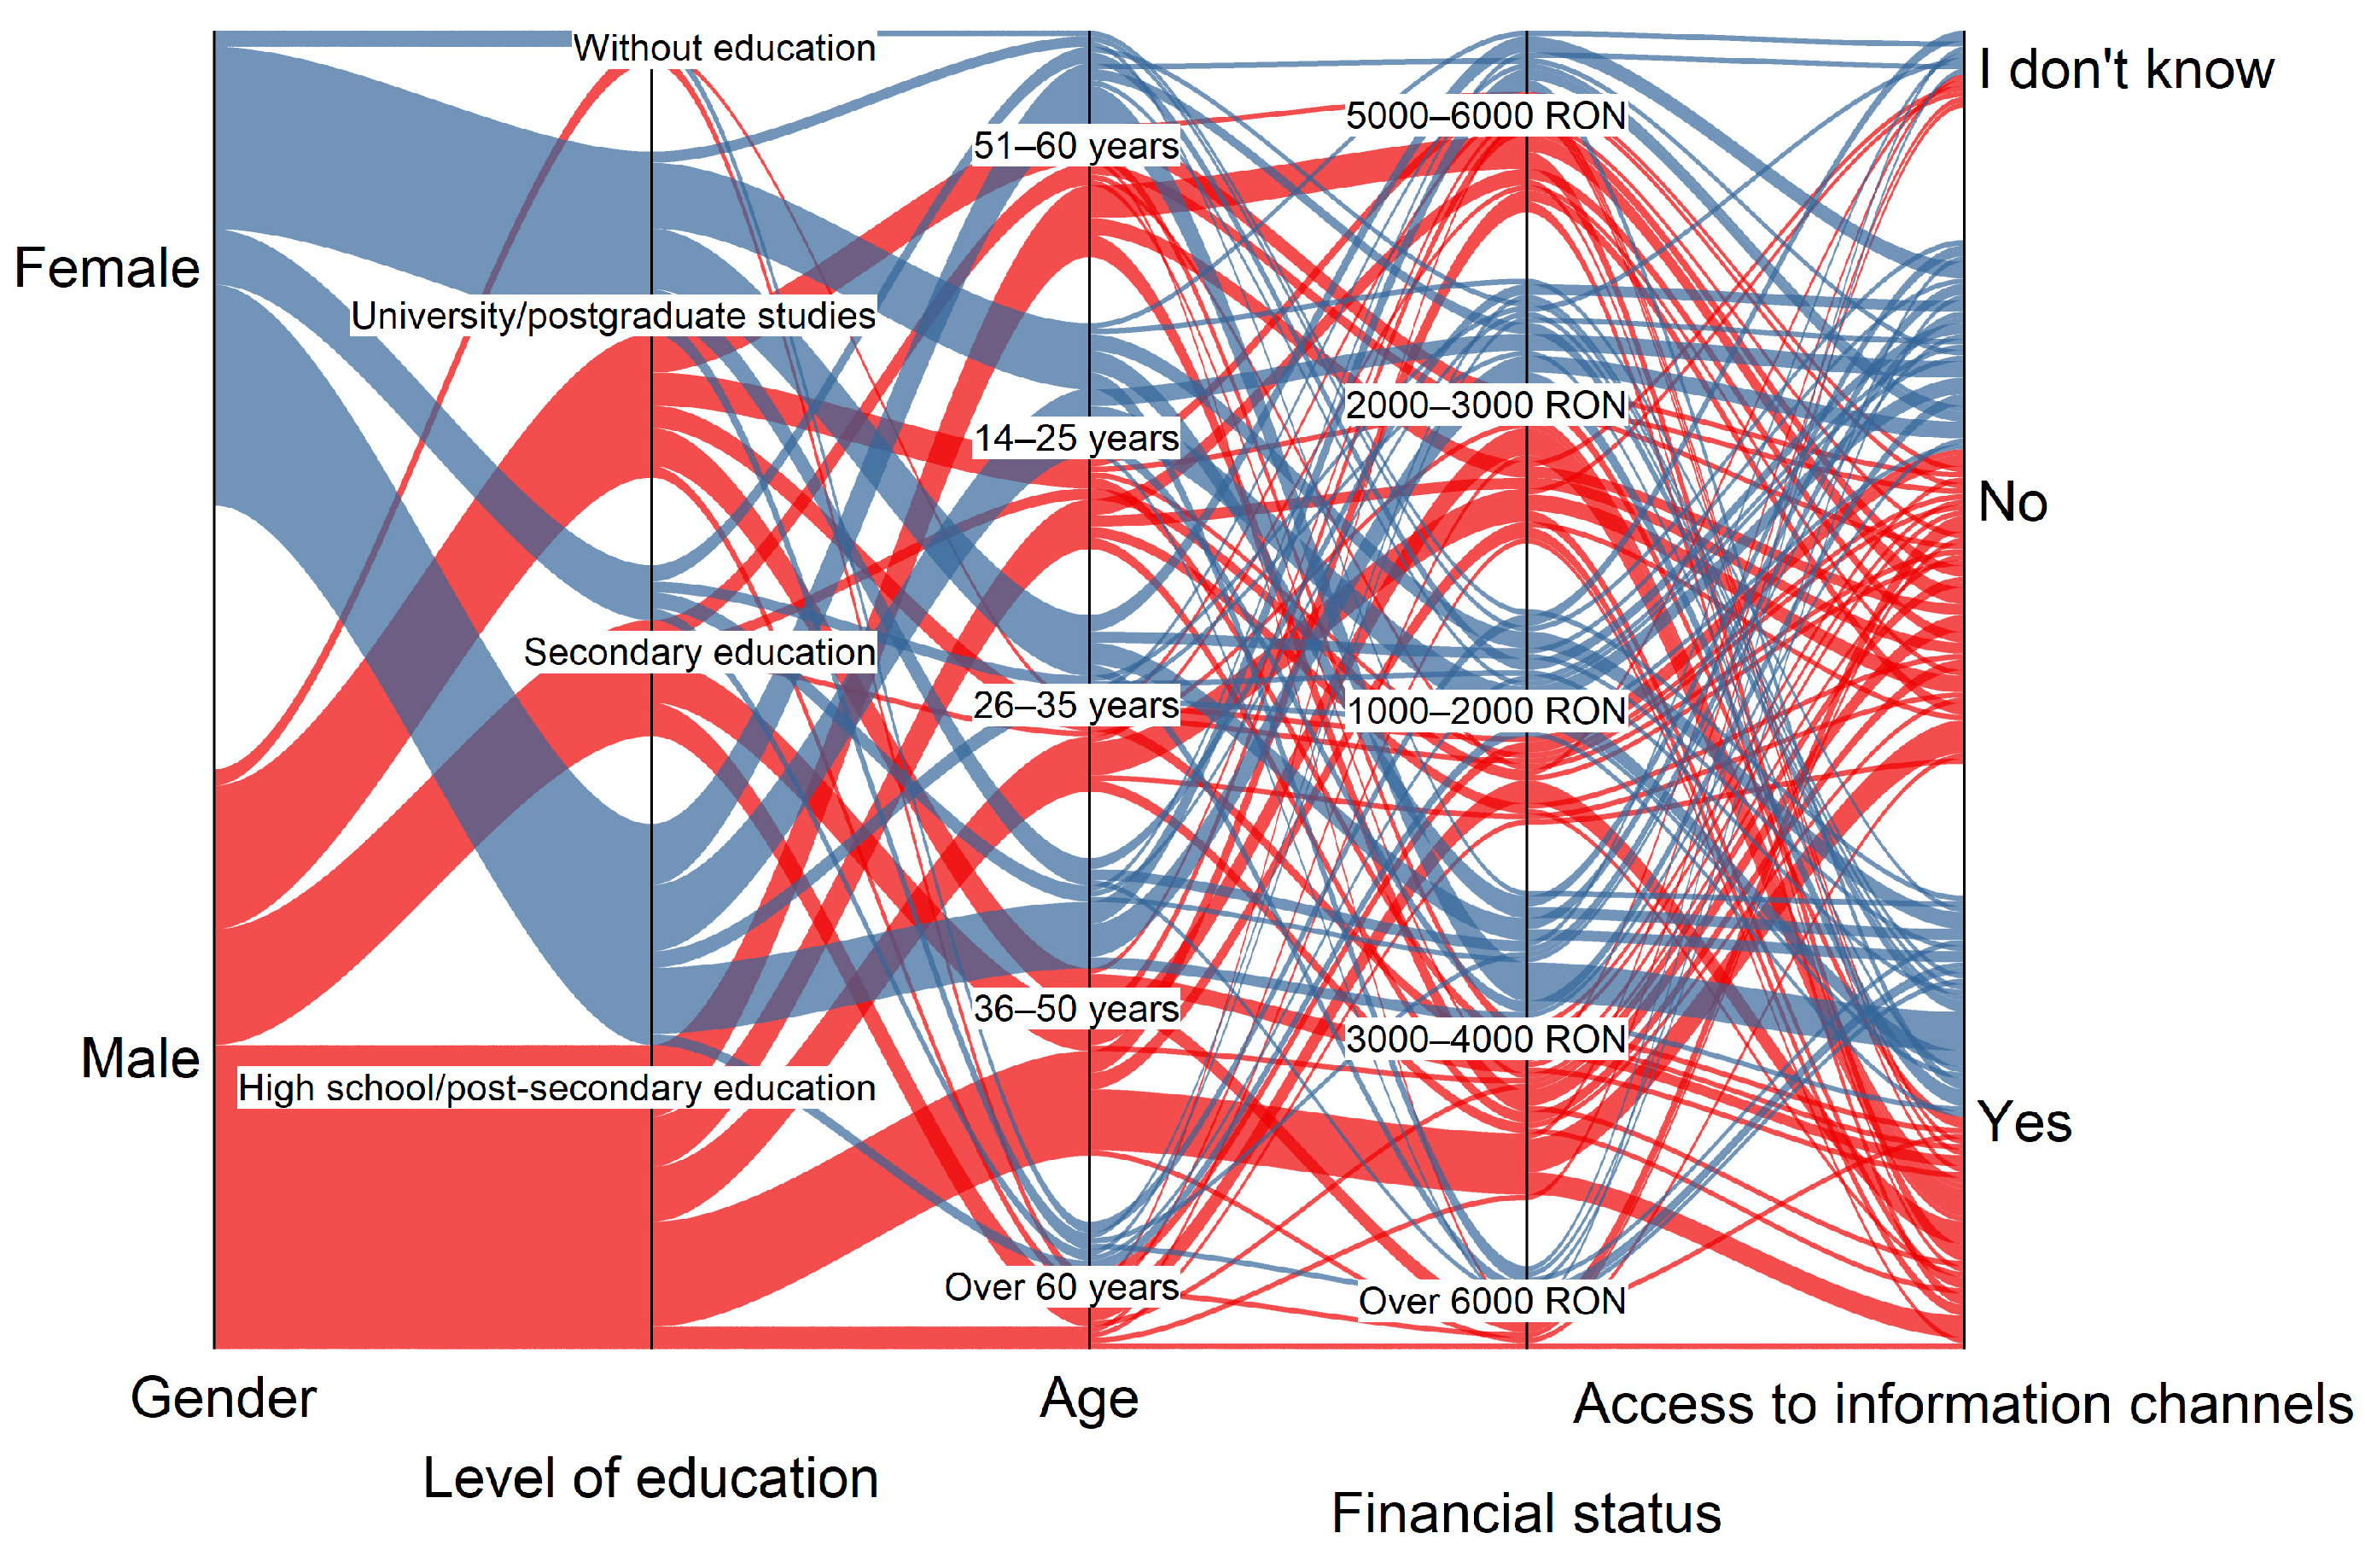
- Information on the analysis of the Access to information pathways used by the sanitation operator, based on the initial parameters, is presented in Figure 6. After analyzing it, the following information was derived:
- Analyzing this parameter in terms of respondents’ Gender shows the following:
- Among male respondents, 40% have access to information channels; 54.29% do not have access, 5.71% do not know about these channels;
- Regarding female respondents, forty have access to these channels, thirty-eight do not have access, and only eight respondents do not know of their existence;
- Referring to the impact of Age on this parameter, the highest proportion of respondents (49.74%) do not have access to these types of information channels. When analyzing by age group, separately, this value ranges from a minimum of 43.48% (for individuals over 60 years) to a maximum of 56, 1% (for those aged 14–25 years). Only 42.93% of respondents overall have access to these channels. By age group, this access ranges from a minimum of 34.15% (for the 14–25 years group) to a maximum value of 51.22% (for the 51–60 years group). A total of 7.33% of respondents are unaware of such information channels. This percentage is distributed among groups with a minimum of one respondent (for the age group 51–60 years) and a maximum of four respondents (from the 36–50 years and 14–25 years age groups).
- From the perspective of Educational level, it can be observed, as shown in Figure 5, that the majority of the respondents belong to the high school level of education. Their responses to the question “Did you have access to the information channels used by the sanitation operator (media, leaflets, posters, etc.)?” are divided as follows: 52.63% answered “NO” (do not have access), 42.11% have access, and 5.26% do not know. This distribution of responses is similar for respondents with university education and those with no formal education. Differences appear in the group with secondary education, where 48.39% have access, 41.94% do not have access, and 9.68% do not know.
- Analyzing responses from the point of view of the Financial status per family shows that for almost all the analyzed groups, the majority of respondents do not have access to this information. This ranges between 46.67% and 60.67%, except for the group with incomes of 2000–3000 RON, where 52.08% answered positively (have access).
- As with the analysis of the previous questions, a general examination was conducted to identify significant respondent groups. The following groups with more than three respondents were obtained:
- The largest group identified is made up of seven respondents, who are female, aged 51–60 years, with a high school education and a household income of 3000–4000 RON. This group has access to this information;
- A group of six respondents, who are male, aged 35–50 years, with high school education and a household income of 3000–4000 RON, does not have access to this information;
- A group of five respondents, who are male, aged 35–50 years, with secondary education and a household income of 2000–3000 RON, has access to this information;
- Two groups of four respondents were identified. The first group is characterized by male respondents, over 60 years old, with secondary education and a household income of 1000–2000 RON. This group has access to this information. The second group, who opted for the answer indicating that they have access to this information, consists of male respondents, aged 36–50 years, with secondary education and a household income of 3000–4000 RON;
- In the case of the groups of three respondents, 12 such groups were identified, of which:
- ○
- Eight groups are composed of female respondents, and the remaining four groups are composed of male respondents;
- ○
- Eight groups consist of respondents who do not have access to this information while the remaining four groups have access.

| No. | Question | The Response Variant | Parameter Type |
|---|---|---|---|
| 1 | What age category do you fall into? |
| 41 32 54 41 23 |
| 2 | Gender of interviewee? |
| 86 105 |
| 3 | What level of education do you have? |
| 59 95 31 6 |
| 4 | Total household income/month? |
| 39 48 56 33 15 |
- -
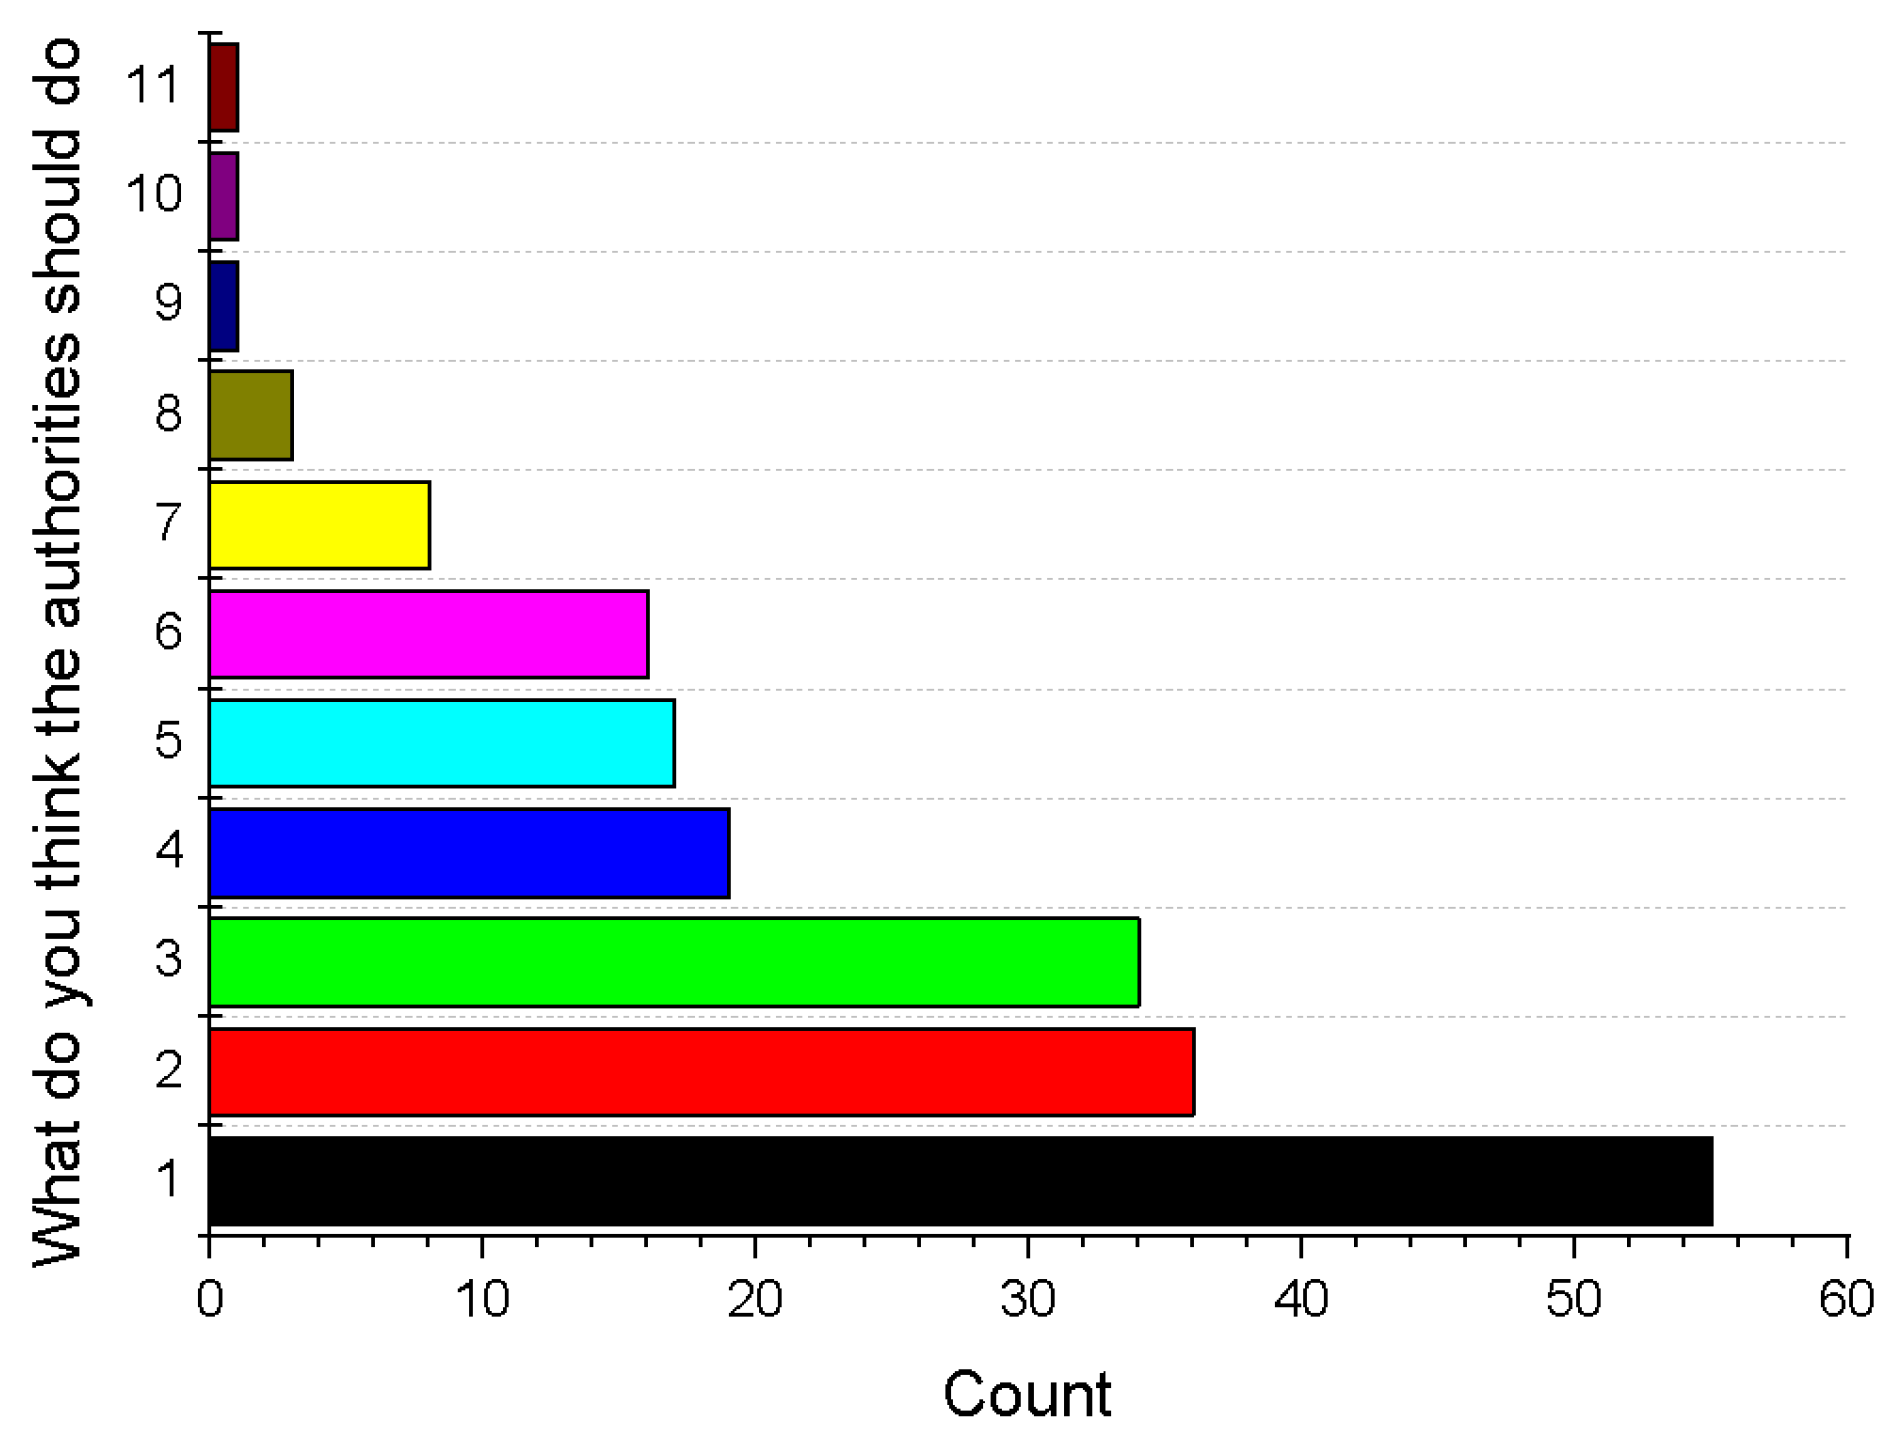
- The highest number of respondents (55) opted for the option group corresponding to code 1;
- -
- A very similar number of responses were identified for codes 2 and 3, with 36 and 34 options;
- -
- The answers corresponding to codes 4–6 are close in number, i.e., 19, 17, and 16 respondents opted for these groups of answers;
- -
- For the other identified code groups, the answers are below 10.
4. Statistical Analysis
- -
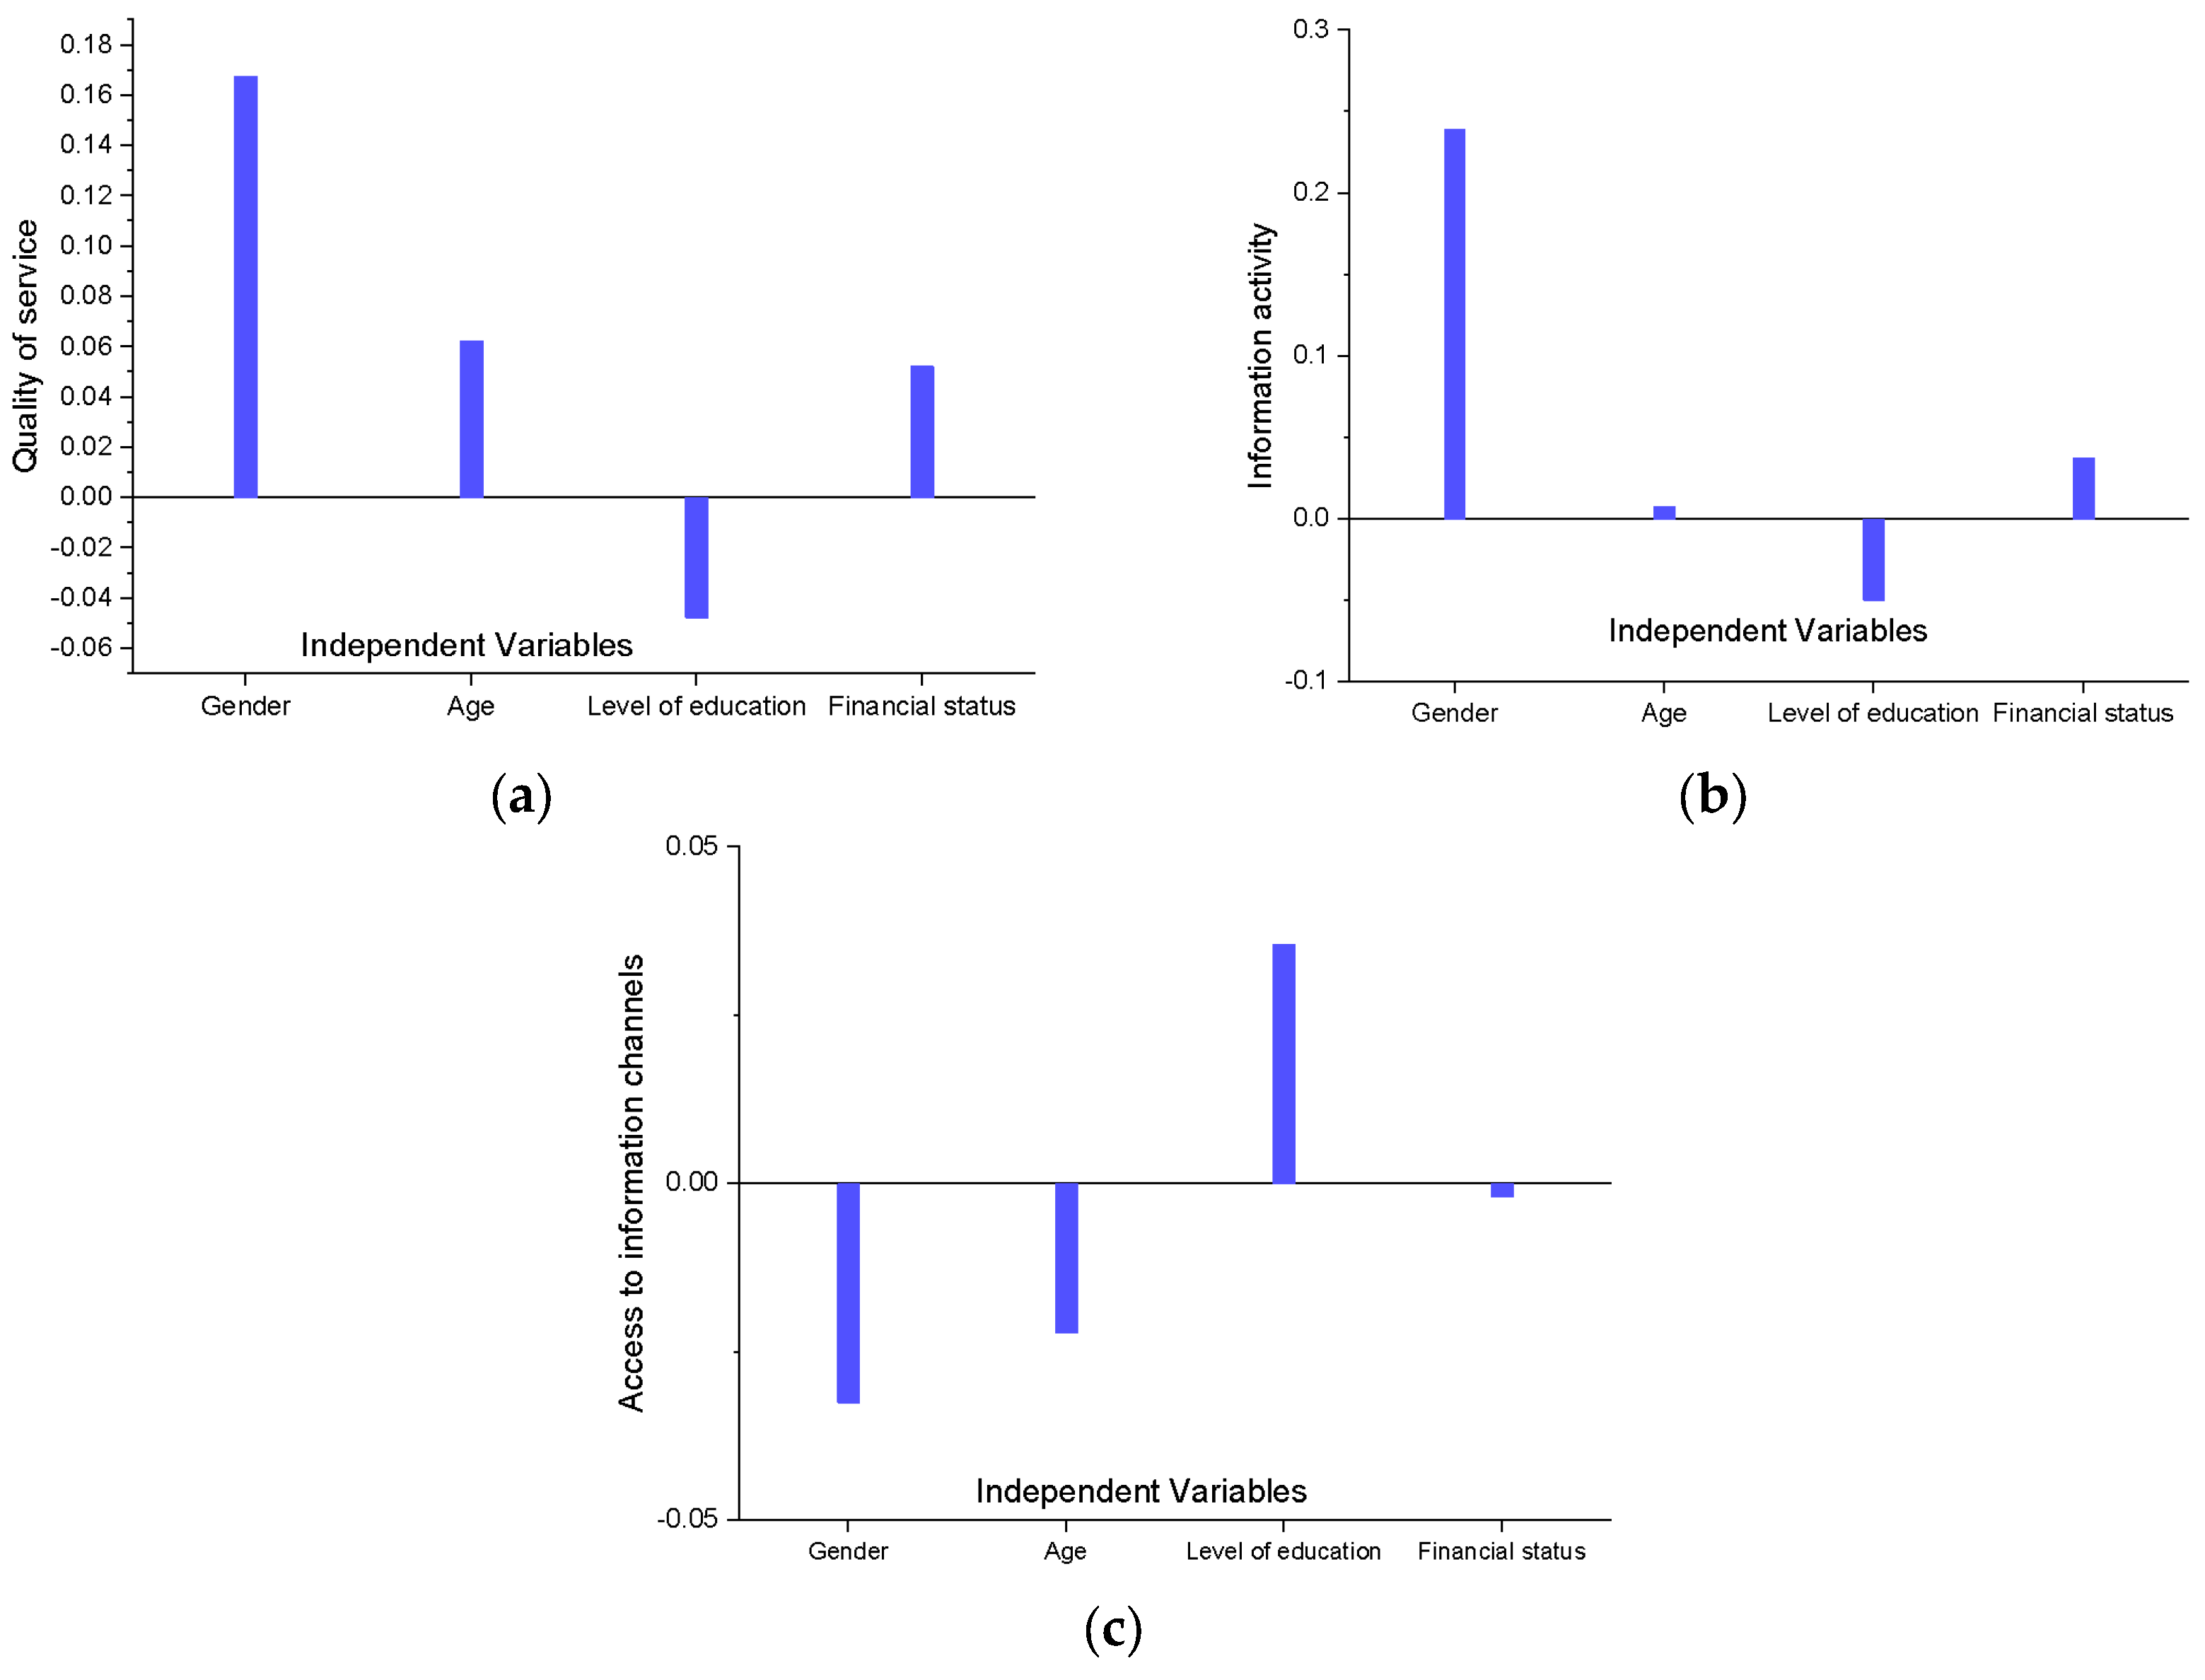
- Within the Partial Least Squares Analysis, the impact of input parameters (Gender, Age, Level of education, Financial status) on the output parameters (Quality of service; Information activity; Access to information channels) was identified. Following the identification of the linear regression for both groups of variables (dependent variables: Access to information channels; Quality of service; and Information activity; independent variables—Gender, Age, Level of education, and Financial status) (Figure 8), the following conclusions can be drawn:
- ○
- For the parameter “Quality of service”:
- -
- The positive coefficient of approximately 0.16 indicates a strongly positive relationship between gender and perception of service quality. This suggests that there are significant differences between how men and women rate SWMS service quality;
- -
- The positive coefficient of 0.06 indicates a moderately positive relationship between age and service quality. Respondents in older age groups may have a more favorable perception of sanitation services, possibly due to longer experience with the system or different expectations;
- -
- The negative coefficient of −0.05 suggests an inverse relationship between education and perceived service quality. This result may indicate that individuals with higher levels of education are more critical of the waste management system and have higher expectations of the services provided;
- -
- The positive coefficient of 0.04 indicates a slightly positive relationship between financial status and service quality. Individuals with higher incomes may have access to better-organized sanitation services or may be less affected by possible deficiencies in the system;
- ○
- In relation to the parameter “Information activity”:
- -
- The highest positive coefficient of approximately 0.28 highlights that gender plays an important role in the perception of information activity. Respondents perceive these activities differently based on gender, which may indicate the need to tailor messages specifically for men and women;
- -
- The positive coefficient of 0.15 suggests a moderate positive relationship between respondents’ age and perception of outreach activities. Older age groups may be more receptive to these initiatives, indicating a possible need for age-specific strategies;
- -
- The negative coefficient of −0.05 indicates an inverse relationship between education level and perception of outreach activities. Respondents with higher education may be more critical of the effectiveness and quality of these activities, highlighting the need to improve how information is presented;
- -
- The positive coefficient of 0.10 indicates a favorable influence on the perception of information activities. Individuals with higher incomes may have greater accessibility to the resources made available or a better understanding of their importance;
- ○
- Analyzing the parameter “Access to information channels” reveals the following:
- -
- Gender has a negative coefficient, indicating that gender negatively influences access to information provided by the sanitation operator. This suggests that certain demographic groups may face difficulties in accessing the necessary information;
- -
- Age also shows a negative coefficient, indicating a weak negative relationship between age and access to information channels. People in certain age groups may have limited access to this information;
- -
- Level of educational has a positive coefficient, suggesting that people with higher levels of education are more likely to access information channels. This emphasizes the importance of education in the information process;
- -
- Financial status shows a slightly negative coefficient, indicating a modest but negative influence on access to information. This result could reflect the lack of prioritization of financial resources for obtaining information.
- -
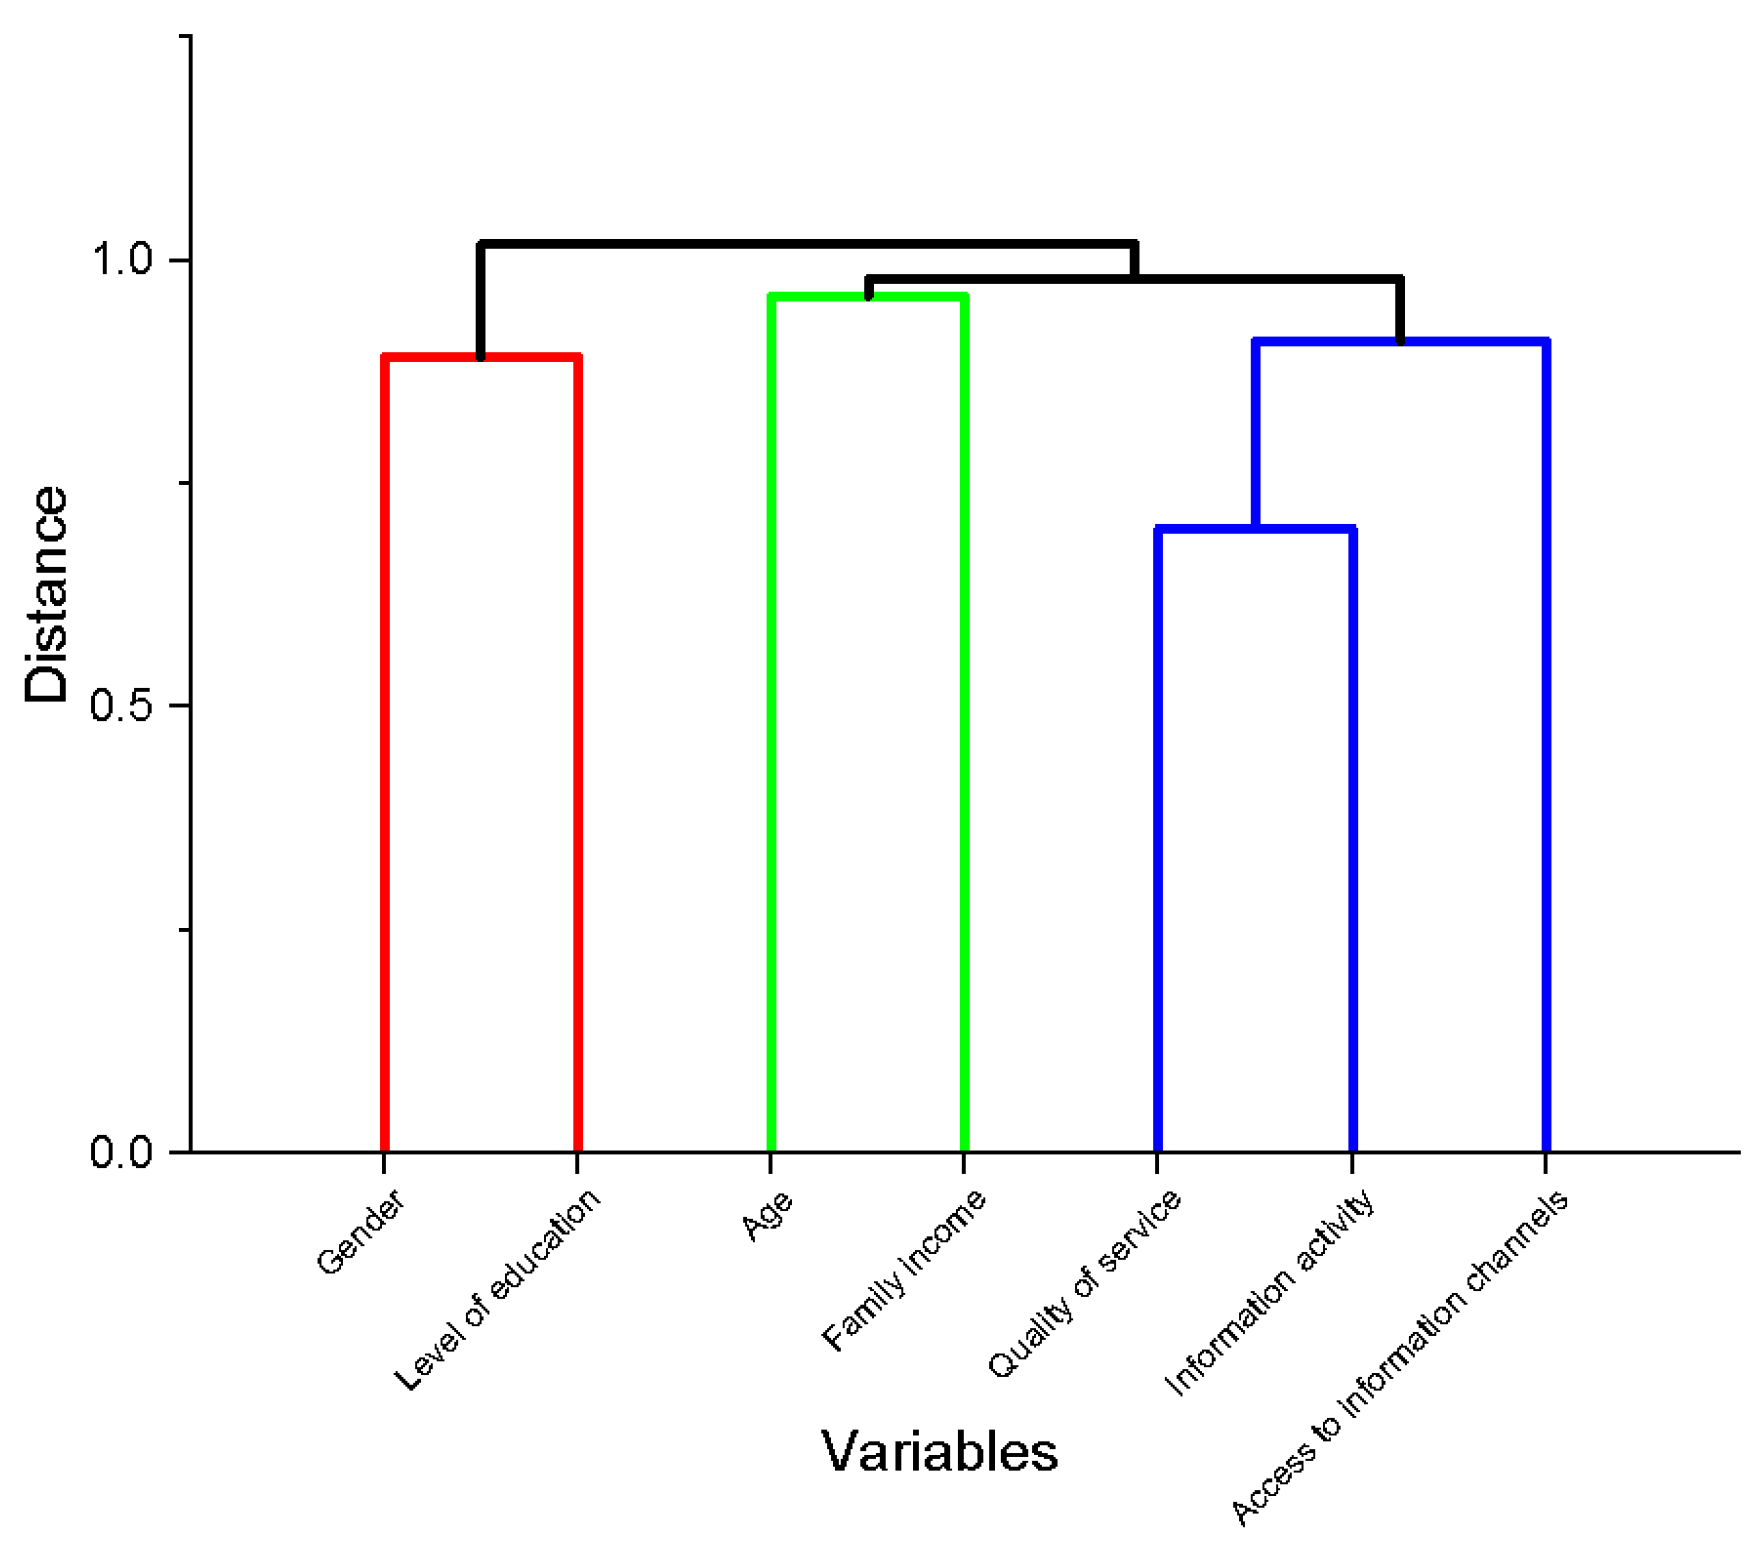
- The Hierarchical Cluster Analysis statistical analysis (Figure 9) groups the parameters from the presented study into dependency and mutual influence clusters. In this case three main (or level 1) clusters were identified:
- ○
- The first cluster consists of Quality of service and Information activity, indicating a strong relationship between the perception of sanitation service quality and the success of the information activities carried out by the operator;
- ○
- The second cluster is Gender and Level of education, suggesting that these factors are closely related in the evaluation of access to information or sanitation-related activities;
- ○
- The third cluster is Age and Financial status, highlighting the socio-economic influence on satisfaction and the level of information;
- ○
- A secondary (level 2) cluster was identified between the first cluster and Access to information channels, indicating a weaker link between the perception of service quality, information activity, and access to information.
- -
- The final statistical analysis conducted is Principal Component Analysis (Figure 10), an exploratory data analysis method. This type of graphical representation (Principal Component Analysis—PCA) provides insights into the analyzed variables and their relationships by plotting the two principal components, PC1 and PC2, which explain 19.97% and 18.25% of the total variation in the data, respectively. This analysis reveals that a large group of parameters are located as follows:
- -
- In quadrant I: Gender, Access to information channels, Information activity, and Quality of service, suggesting an interdependence between these factors in influencing public perception of SWMS. This analysis also identified one of the clusters from Figure 9, namely Age and Financial status, identified in quadrant IV (Figure 10).
- -
- The Level of education parameter is found alone in quadrant II, which may suggest that education level is not directly influenced by the social or economic variables analyzed. However, this factor plays a significant role in the overall model;
- -
- The variables Age and Financial status, found in quadrant IV, indicate a distinct relationship with the other variables and suggest a possible cluster based on socio-economic conditions

5. Conclusions
- -
- The percentage of male respondents is 22% higher than that of female respondents;
- -
- The Age distribution of the respondents can be divided into four large groups with approximately equal proportions: 28% of the respondents belong to the age group 36–50 years, combined with the group of respondents aged 26–35 years and over 60 years; 21% of respondents are split into two groups, namely those aged 51–60 years and those aged 14–25 years;
- -
- In terms of Level of education, respondents with high school education represent half of the total respondents;
- -
- The Financial status of respondents’ household is predominantly characterized by an income below 1000 Euro;
- -
- The responses obtained from the respondents regarding the Level of information on the household waste management system were analyzed considering their characteristics, with the aim of identifying common groups. The largest groups of respondents identified consist of seven individuals, sharing similarities in Financial status and Educational level. These two groups respond to different questions posed to the respondents.
- -
- Due to the large number of parameters used to identify the respondents’ characteristics, it was not possible to identify a major direct impact of these characteristics on the parameters presented in the article;
- -
- Since the values obtained in the questionnaire were textual, they were analyzed statistically. For this purpose, three different methods of analysis were employed, identifying certain correlations. In the Partial Least Squares Analysis, it was found that Age and Financial status are the parameters that most influence Information activity and Access to information channels. In the Hierarchical Cluster Analysis, no correlations were found between the parameters tracked and the parameters describing the respondents. By analyzing the data using Principal Component Analysis, two parameters were identified as having a small vector dimension yet playing an important role in this type of analysis, Age and Access to information channels.
- -
- The statistical analysis indicates that two parameters, Age and Access to information channels, have a significant impact and were found to be prominent in two of the three statistical analyses conducted in the study.
- -
- The study indicates that approximately 58% of respondents are satisfied with sanitation services. While this suggests a moderate level of satisfaction, it also underscores the need for further improvements to enhance the quality and efficiency of waste management.
- -
- About 49.7% of respondents do not have access to information channels related to waste management services. When including those who are unaware of these channels, this percentage increases to 57%, highlighting a significant deficiency in communication between authorities and the population. Whatever percentage values are referred to, they are below the values found in the literature [20] (60% was found).
- -
- Studies conducted in various countries, including Spain, Italy, China, and Bangladesh, have demonstrated significant discrepancies in satisfaction levels regarding waste management services. For instance, Spain reports a satisfaction rate of 84.37%, while Italy presents a significantly lower rate of 36%, showcasing stark contrasts between different regions.
- -
- Variables such as household income, education level, and age significantly influence public perception of waste management services. Respondents with a monthly household income of 3000–4000 RON exhibited a more favorable outlook toward sanitation services compared to those earning under 2000 RON.
- -
- Approximately 52% of respondents have a positive view of outreach activities conducted by sanitation operators. However, a significant portion of the population remains dissatisfied, highlighting the need for more effective awareness campaigns to promote proper waste separation and recycling.
- -
- Many respondents emphasized the lack of sufficient recycling bins and inefficient waste collection organization as major factors contributing to lower satisfaction levels. Improvements in infrastructure and optimized collection processes are necessary to enhance public confidence in waste management services.
- -
- The study suggests that authorities should implement more public awareness programs, expand waste collection points, and introduce penalties for individuals who fail to comply with proper waste segregation practices.
- -
- The present study is the first such study conducted at Bacău City, Bacău County, but also at the Romanian level, which focuses on identifying the population’s satisfaction with SWMS.
- -
- Also, through the use of statistical analysis it was possible to identify a series of correlations between the parameters corresponding to the characteristics of the respondents and the parameters followed in this study.
- -
- The findings are limited to the Șerbănești neighborhood of Bacău, highlighting the need for further research covering the entire municipality to gain a broader perspective on public satisfaction with waste management.
- -
- These findings are also limited due to the online survey method, which excluded people without internet access.
Author Contributions
Funding
Institutional Review Board Statement
Informed Consent Statement
Data Availability Statement
Conflicts of Interest
References
- Peng, X.; Jiang, Y.; Chen, Z.; Osman, A.I.; Farghali, M.; Rooney, D.W.; Yap, P.-S. Recycling municipal, agricultural and industrial waste into energy, fertilizers, food and construction materials, and economic feasibility: A review. Environ. Chem. Lett. 2023, 21, 765–801. [Google Scholar] [CrossRef]
- Priti; Mandal, K. Review on evolution of municipal solid waste management in India: Practices, challenges and policy implications. J. Mater. Cycles Waste Manag. 2019, 21, 1263–1279. [Google Scholar] [CrossRef]
- Deus, R.M.; Bezerra, B.S.; Battistelle, R.A.G. Solid waste indicators and their implications for management practice. Int. J. Environ. Sci. Technol. 2019, 16, 1129–1144. [Google Scholar] [CrossRef]
- Kaza, S.; Yao, L.C.; Bhada-Tata, P.; Van Woerden, F. What a Waste 2.0: A Global Snapshot of Solid Waste Management to 2050; Urban Development; World Bank: Washington, DC, USA, 2018. [Google Scholar]
- Wang, A.; Zhang, L.; Shi, Y.; Rozelle, S.; Osborn, A.; Yang, M. Rural solid waste management in China: Status, problems and challenges. Sustainability 2017, 9, 506. [Google Scholar] [CrossRef]
- Wang, A.; Chen, X.; Wang, X.; Wei, J.; Song, L. Determinants of satisfaction with solid waste management services: A central–local comparison in China. Int. J. Environ. Res. Public Health 2022, 19, 4610. [Google Scholar] [CrossRef]
- Marcello, B.; Di Gennaro, V.; Ferrini, S. Let the citizens speak: An empirical economic analysis of domestic organic waste for community composting in Tuscany. J. Clean. Prod. 2021, 306, 127263. [Google Scholar] [CrossRef]
- Bhada-Tata, P.; Hoornweg, D.A. What a Waste: A Global Review of Solid Waste Management; World Bank: Washington, DC, USA, 2012. [Google Scholar]
- Ansari, M.S.A. Municipal solid waste management systems in the Kingdom of Bahrain. Int. J. Water Resour. Environ. Eng. 2012, 4, 150–161. Available online: https://academicjournals.org/article/article1379512764_Al.Ansari.pdf (accessed on 3 October 2024).
- Batu, M.M.; Admasu, E.; Tolosa, F. Determinants of households’ willingness to pay for improved solid waste management in Ethiopia: The case study of jimma town. J. Environ. Earth Sci. 2016, 6, 75. [Google Scholar]
- Danquah-Bediem, N.Y.; Ametewee, S.K. The impact of household characteristics on willingness to pay for improved solid waste management in dunkwa on-offin, Ghana. J. Environ. Agric. Sci. 2022, 7, 15. [Google Scholar]
- Hariyono, P. Resident satisfaction on their residence and environment (case study of Srondol Bumi Indah Housing of Semarang City). Earth Environ. Sci. 2017, 99, 12014. [Google Scholar] [CrossRef]
- Thanh, N.V.; Le, D.T.; Tinh, L. Quantifying factors affecting satisfaction of people to waste classification at source: The case of Hai Chau District, Da Nang. Int. J. Environ. Sci. Dev. 2022, 13, 42–48. [Google Scholar] [CrossRef]
- Puche-Regaliza, J.C.; Porras-Alfonso, S.; Jiménez, A.; Aparicio-Castillo, S.; Arranz-Val, P. Exploring determinants of public satisfaction with urban solid waste collection services quality. Environ. Dev. Sustain. 2020, 23, 9927–9948. [Google Scholar] [CrossRef]
- Xu, H. Present situation and satisfaction evaluation of classification, delivery and disposal of rural domestic refuse—An empirical study based on Jiangsu province. J. Tianshui Coll. Adm. 2018, 19, 89–94. [Google Scholar]
- Tao, Y.; Huang, L.; He, Z. An analysis of rural residents’ satisfaction with MSW management in Beijing. Agric. Outlook 2020, 16, 33–38. [Google Scholar]
- Zou, C.; Tai, J.; Wang, Y.; Sun, F.; Che, Y. A factor analysis of residents’ performance in municipal solid waste source-separated collection: A case study of pilot cities in China. Air Waste Manag. Assoc. 2019, 69, 918–933. [Google Scholar] [CrossRef] [PubMed]
- Abas, M.A.; Hassin, N.H.; Hambali, K.A.; Karim, M.F.A.; Hussin, H.; Ismail, L.; Fitriani, N. Public satisfaction and willingness to pay (WTP) for better solid waste management services in rural area of Kelantan, Malaysia. IOP Conf. Ser. Earth Environ. Sci. 2021, 756, 12083. [Google Scholar]
- Puche-Regaliza, J.C.; Alvear-González, A.; Aparicio Castillo, S.; Val, P.A. Key factors in levels of public satisfaction with urban waste collection in a northern Spain city. J. Mater. Cycles Waste Manag. 2018, 20, 1842–1856. [Google Scholar] [CrossRef]
- Fil’a, M.; Schwarczová, L.; Mura, L. Citizen satisfaction survey as a tool of citizen relationship management of local government in Slovakia. Serb. J. Manag. 2015, 10, 117–129. [Google Scholar] [CrossRef]
- Khanom, T.F.; Farjana, T.; Mamun, A.A.; Hossain, A.; Baten, A. Household satisfaction on solid waste collection services conducted by NGOs in Mymensingh Municipality. Bangladesh. Int. J. Nat. Soc. Sci. 2015, 2, 14–22. [Google Scholar]
- Fetene, Y. Client satisfaction towards municipal solid waste management service in Jimma city, South West Ethiopia. Int. J. Environ. Sci. Nat. Resour. 2018, 13, 555865. [Google Scholar] [CrossRef]
- Hassan, F.A.; Ong’ayo, H.A.; Osore, M.K.; Morara, G.N.; Aura, C.M. Assessment of beneficiary satisfaction with community based solid waste management service. A case of Okoa Maisha project in Mnarani Village, Kilifi County, Kenya. Int. J. Sci. Res. Manag. IJSRM 2018, 6, 2321–3418. [Google Scholar] [CrossRef]
- Shriwas, S.; Rao, S.S.; Sharma, R. Public satisfaction towards solid waste management services in Chhattisgarh: A comparative study. Int. J. Res. Advent Technol. 2018, 6, 3567–3571. [Google Scholar]
- Seneva, D.; Chorteseva, S. Service quality, customer satisfaction and customer loyalty testing a structural equation model. Qual. Manag. Qual. Access Success 2020, 21, 24–128. [Google Scholar]
- Camarero, I.C.; Gutiérrez, C.J.; San Martín, G.S. The impact of customer relationship marketing on the firm performance: A Spanish case. J. Serv. Mark. 2005, 21, 234–244. [Google Scholar] [CrossRef]
- Chatterjee, R.; Suy, R. An overview of citizen satisfaction with public service: Based on the model of expectancy disconfirmation. Open J. Soc. Sci. 2019, 7, 243–258. [Google Scholar] [CrossRef]
- Hernon, P.; Nitecki, D.A.; Altman, E. Service quality and customer satisfaction: An assessment and future directions. J. Acad. Librariansh. 1999, 25, 9–17. [Google Scholar] [CrossRef]
- Rhee, S.K.; Rha, J.Y. Public service quality and customer satisfaction: Exploring the attributes of service quality in the public sector. Serv. Ind. J. 2009, 29, 1491–1512. [Google Scholar] [CrossRef]
- Ahsan, N. An Analysis of Customer Satisfaction Regarding Infrastructure Provision on Solid Waste Collection and Service Quality in Two Income Areas (Low & High) of Johar Town, Lahore. Master’s Thesis, Erasmus University, Rotterdam, The Netherlands, 2020. [Google Scholar]
- Gebre, G. Impact of Service Quality on Customer Satsfaction Incase of Construction and Business Bank in Adama Town, Rift Valley University, 2015, 1–20. Available online: https://www.academia.edu/11670487/THE_IMPACT_OF_SERVICE_QUALITY_ON_CUSTOMER_SATISFACTION (accessed on 3 October 2024).
- Peluso, A.M. Consumer Satisfaction: Advancements in Theory, Modeling, and Empirical Findings, New edition; Peter Lang AG, Internationaler Verlag der Wissenschaften: Lausanne, Switzerland, 2011. [Google Scholar]
- Andrews, R.; Van de Walle, S. New public management and citizens’ perceptions of local service efficiency, responsiveness, equity and effectiveness. Public Manag. Rev. 2013, 15, 762–783. [Google Scholar] [CrossRef]
- Wang, Y.; Shi, Y.; Zhou, J.; Zhao, J.; Maraseni, T.; Qian, G. Implementation effect of municipal solid waste mandatory sorting policy in Shanghai. J. Environ. Manag. 2021, 298, 113512. [Google Scholar] [CrossRef]
- BNR. Arhiva Curs BNR. Available online: https://www.cursbnr.ro/arhiva-curs-bnr (accessed on 3 October 2024).

| No. | Country | Location | Year | The Number of Respondents | Level of Satisfaction (%) |
|---|---|---|---|---|---|
| 1 | Spain | Burgos | 2016 | 146,923 | 84.37 |
| 2 | Kenya | Mnarani Village in Kilifi County | 2009 | 9000 | 52.4% |
| 3 | India | Raipur and Bilaspur | - | 100 | No percentage specified |
| 4 | Slovak Republic | 124 cities | 2014 | - | No percentage specified |
| 5 | Italy | Rapolano Terme, Cetona, and Gracciano | 2020 | 5000 | 36% |
| 6 | Bangladesh | Mymensingh | 2010 | 120 | over 79% |
| 7 | China | Jiangsu Province Beijing Province Hunan Province Hangzhou Province | 2015–2016 | - | 77% 67% 65% 58% |
| 8 | 185 cities in 31 provincial areas of China | 2021 | 1200 | 33.3% | |
| 9 | Ethiopia | Jimma City | 2007 | 260 | 74.7% |
| 10 | Ghana | Kumasi Metropolitan Assembly | 2016 | 400 | Unsatisfactory |
| No. | Question | The Response Variant | Parameter Type |
|---|---|---|---|
| 1 | What age category do you fall into? |
| input parameter—which gives information about respondents |
| 2 | Gender of interviewee? |
| |
| 3 | What level of education do you have? |
| |
| 4 | Total household income/month? |
| |
| 5 | How do you rate the quality of your street waste collection service? |
| output parameter—this represents tracked information |
| 6 | What do you think of the information-and-awareness-raising activities carried out by the sanitation operator regarding the selective collection of household waste? |
| |
| 7 | Did you have access to the information channels used by the waste treatment operator (media, leaflets, posters, etc.)? |
| |
| 8 | What do you think the authorities should do to encourage people to separate the waste? |
|
| Code | Question |
|---|---|
| 1 | To organize more information programs; make more waste bins/containers available to the population |
| 2 | To organize more information programs; make more waste bins/containers available to the population; fine people who don’t separate their waste |
| 3 | Fine people who don’t separate their waste |
| 4 | Make more waste bins/containers available to the population |
| 5 | Make more waste bins/containers available to the population; fine people who don’t separate their waste |
| 6 | Organize more information programs |
| 7 | To organize more information programs; fine people who don’t separate their waste |
| 8 | I don’t know |
| 9 | Make more waste bins/containers available to the population; I don’t know |
| 10 | To organize more information programs; fine people who don’t separate their waste; I don’t know |
| 11 | Make more waste bins/containers available to the population; fine people who don’t separate their waste; I don’t know |
| Gender | Age | Level of Education | Financial Status | Quality of Service | Information Activity | Access to Information Channels | |
|---|---|---|---|---|---|---|---|
| Gender | 1 | 0.08 | 0.11 | −0.09 | 0.06 | 0.09 | −0.02 |
| Age | 0.08 | 1 | −0.09 | 0.04 | 0.08 | 0.02 | −0.06 |
| Level of education | 0.11 | −0.09 | 1 | −0.19 | −0.04 | −0.04 | 0.06 |
| Financial status | −0.09 | 0.04 | −0.19 | 1 | 0.05 | 0.04 | −0.01 |
| Quality of service | 0.06 | 0.08 | −0.04 | 0.05 | 1 | 0.3 | 0.1 |
| Information activity | 0.09 | 0.02 | −0.04 | 0.04 | 0.3 | 1 | 0.08 |
| Access to information channels | −0.02 | −0.06 | 0.06 | −0.01 | 0.1 | 0.08 | 1 |
Disclaimer/Publisher’s Note: The statements, opinions and data contained in all publications are solely those of the individual author(s) and contributor(s) and not of MDPI and/or the editor(s). MDPI and/or the editor(s) disclaim responsibility for any injury to people or property resulting from any ideas, methods, instructions or products referred to in the content. |
© 2025 by the authors. Licensee MDPI, Basel, Switzerland. This article is an open access article distributed under the terms and conditions of the Creative Commons Attribution (CC BY) license (https://creativecommons.org/licenses/by/4.0/).
Share and Cite
Mosnegutu, E.; Przydatek, G.; Chitimus, D.; Placintă, C.; Barsan, N.; Tomozei, C.; Nedeff, F.; Sporea, N. Study on the Public Information Level About the Waste Management System. Urban Sci. 2025, 9, 148. https://doi.org/10.3390/urbansci9050148
Mosnegutu E, Przydatek G, Chitimus D, Placintă C, Barsan N, Tomozei C, Nedeff F, Sporea N. Study on the Public Information Level About the Waste Management System. Urban Science. 2025; 9(5):148. https://doi.org/10.3390/urbansci9050148
Chicago/Turabian StyleMosnegutu, Emilian, Grzegorz Przydatek, Dana Chitimus, Cătălin Placintă, Narcis Barsan, Claudia Tomozei, Florin Nedeff, and Nicoleta Sporea. 2025. "Study on the Public Information Level About the Waste Management System" Urban Science 9, no. 5: 148. https://doi.org/10.3390/urbansci9050148
APA StyleMosnegutu, E., Przydatek, G., Chitimus, D., Placintă, C., Barsan, N., Tomozei, C., Nedeff, F., & Sporea, N. (2025). Study on the Public Information Level About the Waste Management System. Urban Science, 9(5), 148. https://doi.org/10.3390/urbansci9050148